q2 2016 results presentation - veon2q15 2q16 financial highlights q2 2016 – yoy trends -0.9% 0.1%...
TRANSCRIPT

1
© V
imp
elC
om
Ltd
20
16
Q2 2016 Results presentation
Amsterdam – 4 August 2016
Jean-Yves Charlier – Chief Executive Officer
Andrew Davies – Chief Financial Officer

2
© V
imp
elC
om
Ltd
20
16
Disclaimer
This presentation contains “forward-looking statements”, as the phrase is defined in Section 27A of the U.S. Securities Act of 1933, as amended, and Section 21E of the U.S. Securities Exchange Act of 1934, as amended. Forward-looking statements are not historical facts, and include statements relating to, among other things, the Company's anticipated performance and guidance for 2016, future market developments and trends, expected synergies and timing of completion of the Italy joint venture; realization of the synergies of the Warid Telecom transaction; operational and network development and network investment and the Company’s ability to realize its targets and strategic initiatives in the various countries of operation. The forward-looking statements included in this presentation are based on management’s best assessment of the Company’s strategic and financial position and of future market conditions, trends and other potential developments. These discussions involve risks and uncertainties. The actual outcome may differ materially from these statements as a result of: continued volatility in the economies in our markets; unforeseen developments from competition; governmental regulation of the telecommunications industries; general political uncertainties in our markets; government investigations or other regulatory actions and/or litigation with third parties; failure to satisfy or waive the conditions to completion of the Italy joint venture; failure to obtain the requisite regulatory approvals or the receipt of approvals on terms not acceptable to the parties to the Italy joint venture; failure of the expected benefits of the Italy joint venture and the Warid Telecom transaction to materialize as expected or at all due to, among other things, the parties’ inability to successfully implement integration strategies or otherwise realize the anticipated synergies, and other risks beyond the parties’ control and failure to meet expectations regarding various strategic initiatives, including, but not limited to, the performance transformation program and/or changes to the capital structure. Certain other factors that could cause actual results to differ materially from those discussed in any forward-looking statements include the risk factors described in the Company’s Annual Report on Form 20-F for the year ended December 31, 2015 filed with the U.S. Securities and Exchange Commission (the “SEC”) and other public filings made by the Company with the SEC. The forward-looking statements speak only as of the date hereof, and the Company disclaims any obligation to update them or to announce publicly any revision to any of the forward-looking statements contained in this presentation, or to make corrections to reflect future events or developments.
All non GAAP measures disclosed further in this presentation, i.e. EBITDA, EBITDA margin, underlying EBITDA, underlying EBITDA margin, EBIT, EBT, net debt, operating cash flow, organic growth, capital expenditures excluding licenses, LTM capex excluding licenses/revenue, are reconciled to comparable GAAP measures in our Earnings Release published on our website on the date hereof.

3
© V
imp
elC
om
Ltd
20
16
Highlights
H1 2016 results in line with expectations, with slightly weaker than expected service revenue trend in Q2
Q2 2016 operational performance particularly strong in Pakistan and Ukraine, weaker in Algeria
Mobile data revenue in Q2 2016 grew 26% YoY
VimpelCom and Ericsson entered into a USD 1 billion long-term global software partnership
FY 2016 guidance confirmed, albeit at lower end of range for service revenue and underlying EBITDA margin, while capex/revenue is trending towards 17%
Italy JV filing of commitments to EC and formal agreements signed with Iliad; as of today no Statement of Objections received; EC decision expected by 8 September
Mobilink and Warid Telecom transaction in Pakistan completed on 1 July 2016, strengthening our leadership position in the Country

4
© V
imp
elC
om
Ltd
20
16
Financial highlights Q2 2016
1 Revenue and EBITDA organic growth are non-GAAP financial measures that exclude the effect of foreign currency translation and certain items such as liquidations and disposals 2 EBITDA underlying excludes: in Q2 2015, USD 3 million related to both to SIM re-verification costs and a positive one-off in utility costs in Pakistan; in Q2 2016, Performance Transformation costs of USD 74 million
and other exceptional costs of USD 42 million
Service revenue (USD billion)
2.1
Profit for the period (USD million)
EBITDA margin, underlying2 (%)
138
42.3 +1.2 p.p. organic1 YoY +0.8 p.p. reported YoY
306
-0.7% organic1 YoY -16.9% reported YoY
Capex excl. licenses (USD million)
-34.0% reported YoY LTM capex/revenue: 17.3%
+29% reported YoY
• Group total revenue organically flat YoY
• Service revenue declined 0.7% YoY organically, with a strong performance in Pakistan and Ukraine, offset by Algeria weakness
► Excluding Algeria +1.5% YoY
• Mobile data revenue grew 26% YoY
• Underlying EBITDA organic growth 3.0% YoY
• Profit for the period grew 29% YoY with strong contribution from Italy
• LTM capex/revenue at 17.3%, trending towards the lower end of FY16 guidance
• Strong Q2 2016 operating cash flow margin at 28.1% (+4.6 p.p YoY)
5
© V
imp
elC
om
Ltd
20
16
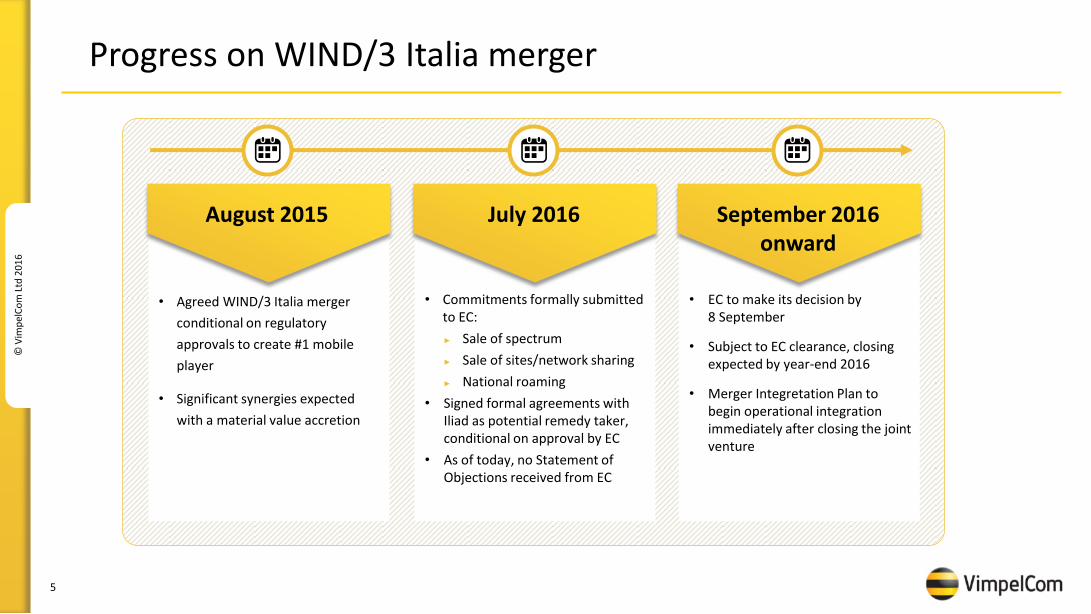
Progress on WIND/3 Italia merger
August 2015
• Agreed WIND/3 Italia merger
conditional on regulatory
approvals to create #1 mobile
player
• Significant synergies expected
with a material value accretion
July 2016
• Commitments formally submitted to EC:
► Sale of spectrum
► Sale of sites/network sharing
► National roaming
• Signed formal agreements with Iliad as potential remedy taker, conditional on approval by EC
• As of today, no Statement of Objections received from EC
September 2016 onward
• EC to make its decision by 8 September
• Subject to EC clearance, closing expected by year-end 2016
• Merger Integretation Plan to begin operational integration immediately after closing the joint venture

6
© V
imp
elC
om
Ltd
20
16
Pakistan: completion of Mobilink and Warid transaction
• Strengthening our leadership in Pakistan with 37% customer market share
• Largest combined footprint and customer base of 50 million
• Leading telecommunication provider of 2G, 3G and 4G/LTE services with higher quality coverage and the best-in-class digital mobile network
• Board consisting of 7 directors (6 nominated by VIP/GTH) chaired by His Highness Sheikh Nahayan Mabarak Al Nahayan
• Legal merger anticipated within 6 months
• Annual run-rate cost synergies of USD 115 million
• Provide nationwide 3G services to Warid customers
• Accelerate 4G/LTE for Mobilink, including postpaid customers
• Provide Warid customers with access to the full range of MFS
• Enhance distribution platform and focus on channel effectiveness
• Agreements signed with government for the deployment of services in rural areas
• Network integration to begin in Q4 2016
Benefits
Pakistan - among the fastest growing telecom markets
Population of ~200 million people
Smartphone Penetration 40%
16%
2020
Q2 2016
2.5x
Data consumption (MB/user/month)
775
292
2020
Q2 2016
2.7x
Mobile penetration of 65%
Data and smartphone penetration lagging behind
Source: population from CIA factbook; data consumption and smartphone penetration as of Q2 2016 from Company estimates, 2020 from EIU
Transaction

7
© V
imp
elC
om
Ltd
20
16
Overhauling digital IT infrastructure 7-year renewable, USD 1 billion investment with Ericsson for Business Support Systems
Globalizing the organization
• Profound change in the overall operating model
• Digitize and globalize business processes
• Replace legacy fragmentation and duplication of heavy CRM systems
Becoming agile
• Introduce time and place relevant real-time services to customers
• Based on customer permissions and strict privacy rules
• Technology is a differentiator, but needs standardization for agility
Enabling the digital leader
• Enable (launch of) real-time services
• Move beyond connectivity, pushing “OOTT” (“over OTT”)
► Engagement platform
► Multiple own communication services
► Multiple partner-developed services
► Payment platform
…contributing to a reduction of total IT costs down to a ratio of around 2 percent of Group total revenue by year three
Primary foundation of globalization, simplification and digitalization for the Group…

8
© V
imp
elC
om
Ltd
20
16
23.5% 28.1%
2Q15 2Q16
Financial highlights Q2 2016 – YoY trends
-0.9%
0.1%
-0.7% -0.7%
2Q 15/14 2Q 16/15
Total revenue Service revenue41.5% 42.3%
2Q15 2Q16
19.3% 17.3%
2Q15 2Q16
1 Organic revenue change is a non-GAAP financial measure that excludes the effect of foreign currency translation and certain items such as liquidations and disposals 2 EBITDA underlying exclude in Q2 2015 USD 3 million related to both to SIM re-verification costs and a positive one-off in utility costs in Pakistan; in Q2 2016, Performance Transformation
costs of USD 74 million and other exceptional costs of USD 42 million
-2.0 p.p.
+4.6p.p.
Total revenue and service revenue YoY organic1 development Underlying2 EBITDA margin development
LTM capex/revenue development OCF margin = (underlying EBITDA2 – capex)/revenue
LTM of 23.3%
LTM of 40.6%
LTM of 21.5%
+0.8 p.p. YoY +1.2 p.p. organic YoY
LTM of 40.8%

9
© V
imp
elC
om
Ltd
20
16
FOREX movements in VimpelCom’s footprint
1 VimpelCom Currency weightings calculated from the sum of the individual countries’ relative contribution to total countries revenue (= Total Group Revenue - Eliminations - HQ)
100 98
94
82
73 76
70 66
64 66
66
1Q14 2Q14 3Q14 4Q14 1Q15 2Q15 3Q15 4Q15 1Q16 2Q16 July 2016
VIP Coin1 vs USD
10
© V
imp
elC
om
Ltd
20
16
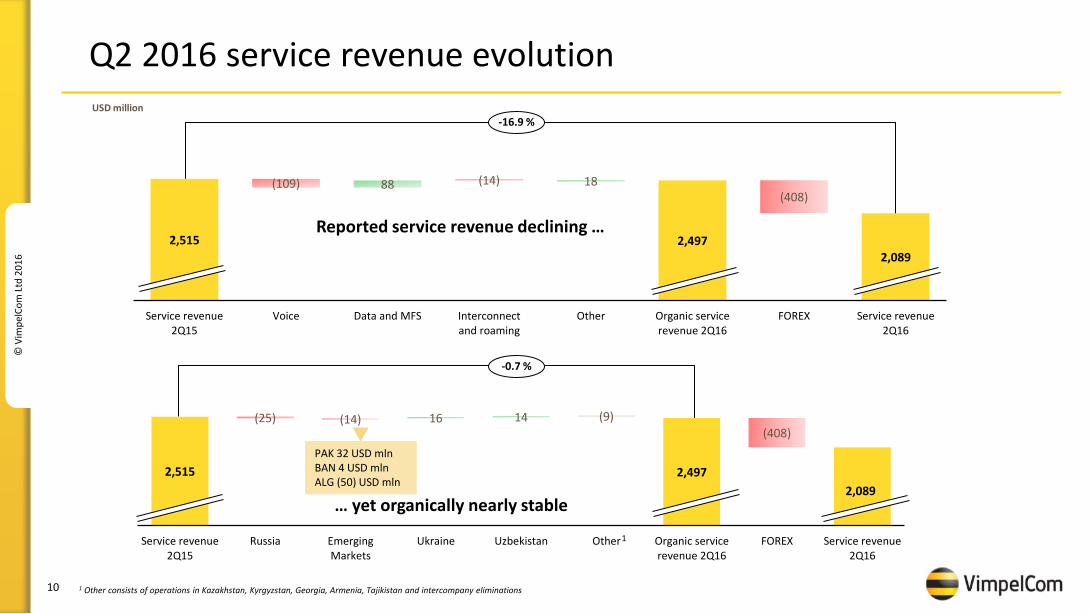
2,515 2,497
2,089
(25) (14) 16 14 (9)
(408)
Service revenue2Q15
Russia EmergingMarkets
Ukraine Uzbekistan Other Organic servicerevenue 2Q16
FOREX Service revenue2Q16
Q2 2016 service revenue evolution
2,515 2,497 2,089
(109) 88 (14) 18 (408)
Service revenue2Q15
Voice Data and MFS Interconnectand roaming
Other Organic servicerevenue 2Q16
FOREX Service revenue2Q16
-16.9 %
-0.7 %
USD million
Reported service revenue declining …
… yet organically nearly stable
1 Other consists of operations in Kazakhstan, Kyrgyzstan, Georgia, Armenia, Tajikistan and intercompany eliminations
PAK 32 USD mln BAN 4 USD mln ALG (50) USD mln
1

11
© V
imp
elC
om
Ltd
20
16
Q2 2016 EBITDA evolution
1,069 1,066 911 795
(3) (17) 96 (48) (186)
(116)
EBITDA 2Q15
Exceptional items
Underlying EBITDA 2Q15
Service revenue Performance transformation
savings
Re-investment in mono-brand,
devices, network, etc.
Forex Underlying EBITDA 2Q16
Exceptional items
EBITDA 2Q16
1,069 1,066 1,097
(3) (2) 9 24 (4) 4 (186)
(116)
795
EBITDA2Q15
Exceptionalitems
Underlying EBITDA2Q15
Russia Emerging Markets Ukraine Uzbekistan Other Underlyingorganic EBITDA
2Q16
Forex Exceptionalitems
EBITDA2Q16
-25.5%
+3.0%
USD million
2
1 Q2 2015 exceptional items refers to USD 3 million related to both to SIM re-verification costs and a positive one-off in utility costs in Pakistan 2 Exceptional items in Q2 2016 totaled USD 116 million of which Performance Transformation costs of USD 74 million and other exceptional costs of USD 42 million 3 Other consists of operations in Kazakhstan, Kyrgyzstan, Georgia, Armenia, Tajikistan and HQ costs and Intercompany eliminations
1
1
reported EBITDA declining
underlying EBITDA growing organically
3
PAK 30 USD mln BAN 11 USD mln ALG (32) USD mln
2

12
© V
imp
elC
om
Ltd
20
16
Q2 2016 Income statement
USD million 2Q16 2Q15 YoY
Revenue
2,156 2,570 (16%)
EBITDA reported
795 1,069 (26%)
D&A and other
(512) (538) (5%)
EBIT
283 530 (47%)
Net financial expenses
(187) (190) (2%)
FOREX and Other
0 (11) (97%)
Profit before tax
96 329 (71%)
Tax
(135) (55) 144%
Profit from continuing operations
(39) 274 n.m.
Profit / (loss) from discontinued operations
187 (128) n.m.
Non-controlling interest
(9) (38) n.m.
Profit for the period
138 108 29%
Currency headwind impact of USD 178 million and exceptional costs of USD 116 million in Q2 2016
Local currencies depreciation and lower impairment charges: USD 13 million in Q2 2015 related to east Ukraine assets and USD 4 million in Q2 2016. USD 70 million accelerated depreciation in Q2 2016 due to network swap in Pakistan and Ukraine
Elimination of depreciation and amortization charges of Italy since Q3 2015, as a result of Italy being classified as held for sale. WIND “standalone” results improved due to refinancing activities executed in 2015
In Q2 2015: positive effect of USD 75 million as a result of legal entity restructurings
In Q2 2016: change in the tax regime in Uzbekistan and creation of non-cash tax provisions in Tajikistan and GTH, amounting to USD 26 million

13
© V
imp
elC
om
Ltd
20
16
186 227
262
(2)
42
42
127
50 (15)
(157)
(12)
(264)
Net Income from continued operations
1H15
Impairment and Exceptionals
items
Net Income Underlying YTD
1H15
EBITDA underlying
Depreciation and Amortization
Net financial expenses
Tax Net Forex Impact and other
JV and associates Net Income Underlying 1H16
Impairments & exceptionals
in 1H16
Net Income from continued operations
1H16
Net Income underlying 1H15
Net Income underlying 1H16
H1 2016 Net income from continued operations USD million
+35
1 In H1 2015, exceptional items include USD 5 million above EBITDA, USD 112 million in impairments and USD (75) million reduction in taxes, as a result of legal entity restructurings 2 On organic basis 3 In H1 2016, exceptional items include USD 157 million above EBITDA, USD 70 million accelerated depreciation due to network swaps in Pakistan and Ukraine, USD 12 million in impairments, USD 25 million of non-cash tax
provisions
2
1 3

14
© V
imp
elC
om
Ltd
20
16
H1 2016 net cash flow from operating activities
37
1,353
1,129
997
1,371
442
1,316
(224)
(301)
105
21 42
375
(929)
Net cash from operating activities
1H15
Exceptionals Underlying Net cash from
operating activities 1H15
Discontinued operations
Underlying net cash flow from continued op activit 1Q15
EBITDA underlying
Interest & similar costs
Tax Working capital & provisions
Underlying net cash flow from
continued operating activities
1H16
Discontinued operations
Underlying net cash from
operating activities 1H16
Exceptionals Net cash from operating activities
1H16
Underlying net cash flow from
continued operating
activities 1H15
Underlying net cash flow from
continued operating
activities 1H16
USD million
-11.7%
+1.3%
1 Exceptional in H1 2015 consists of payments related to Algeria transaction in total amount of USD 1,312 million and USD 5 million payments related to SIM re-verification in Pakistan 2 Exceptional items in H1 2016 consist of payments related to SEC/DOJ/OM agreements of USD 795 million, related legal costs of USD 10 million and USD 118 million payments related to Performance Transformation and
USD 5 million in exceptional costs. Exceptional costs in Kyrgyzstan and Tajikistan are not included as they refer to non-cash tax provision
2 1

15
© V
imp
elC
om
Ltd
20
16
Q2 2016 net debt evolution
1 Underlying LTM EBITDA, which excludes: in 2015 exceptional items totaled USD 1,051 million and mainly consisted of provisions for investigations (related to SEC/DOJ/OM) of USD 900 million and transformation costs of USD 138 million; in Q1 2016, LTM underlying EBITDA excludes adjustments of Q2-Q3-Q4 2015 (see above for the amount) and Q1 2016 total adjustments of ~USD 40 million
2 In Q2 2016, Performance Transformation costs of USD 74 million and other exceptional in OpCos of USD 42 million
6,407
6,157
6,575
(911)
138 98
276
149
116
302
Net debt31 March
2016
EBITDAUnderlying
Net Interest Taxes CAPEX Change in WC Net Debtbefore
exceptionalsand Forex
Exceptionalsin 2Q16
Forex andother
Net debt30 June 2016
Net debt/ LTM EBITDA1 1.8x 1.7x
2
1.7x
USD million

16
© V
imp
elC
om
Ltd
20
16
Mobile customers (million)
Russia: challenging environment, increasing competition
• Price competition increasing
• Total service revenue decreased due to declining fixed-line and mobile service revenue affected by challenging macro environment and increased competition
• Mobile data revenue grew 20% YoY
• Underlying EBITDA margin improving YoY by 0.7p.p., driven by Performance Transformation
• NPS relative ranking continuing to improve, on par with competition
• Capex decreased mainly driven by phasing and capital efficiency
LCCY BILLION, UNLESS STATED OTHERWISE
Mobile Fixed-line
54.9 52.7 54.7
11.2 10.9 10.1
2Q15 1Q16 2Q16
-2.0 % YoY
57.2 57.4
2Q15 2Q16
+0.3% YoY
27.5 24.4 27.3
40.5% 36.8% 40.9%
2Q15 1Q16 2Q16
-1.0% YoY -0.3% YoY (Underlying)1
11.2
7.2
18.3% 16.6%
2Q15 2Q16
-35.6% YoY
1 Q2 2016 EBITDA negatively impacted by one-offs of transformation costs of RUB 177 million
EBITDA and EBITDA margin
Capex excl. licenses and LTM capex/revenue
Service revenue

17
© V
imp
elC
om
Ltd
20
16
Algeria: increased pressure on results
• Service revenue decreased YoY, due to:
► High churn of customers over the last year
► ARPU decrease as a result of high-value customers churn and shift in Ramadan
• Continued strong data revenue growth +53% YoY
• EBITDA declined YoY as a result of revenue decrease
• EBITDA margin continued to be above 50%:
► Commercial and network costs optimization
► Delayering and therefore HR costs reduction
► Further FTE reduction announced in July 2016
• 3G available in 41 wilayas (provinces); 4G/LTE licenses were awarded in May 2016, commercial launch expected in autumn 2016
• Approved dividends of 48% of FY2015 net income (gross amount of USD 128 million) to be distributed in Q3 2016
• Tom Gutjahr, the new CEO, is onboard
DZD BILLION, UNLESS STATED OTHERWISE
32.0 29.7 27.2
2Q15 1Q16 2Q16
-15.1% YoY
17.1 16.3
2Q15 2Q16
-4.4% YoY
17.2 17.1 14.0
53.4% 56.8% 51.1%
2Q15 1Q16 2Q16
-18.5% YoY -18.4% YoY (Underlying)1
4.5 4.7
17.3% 14.9%
2Q15 2Q16
+4.2% YoY
EBITDA and EBITDA margin
Capex excl. licenses and LTM capex/revenue
Mobile customers (million)
Mobile service revenue
1 Q2 2016 EBITDA negatively impacted by one-offs of transformation costs of DZD 10 million

18
© V
imp
elC
om
Ltd
20
16
Algeria: focus on customer base stabilization
Revenue
-15%
Customers
-4%
ARPU
-12%
Issues
Actions
• Distribution challenges: commission optimization with negative effect on sales, partially corrected
• Sub-optimal commercial decisions: change in billing increment and forced migration in Q1 2016; billing change reversed in Q2 2016
• High-value customer churn on the back of the gap in 3G and better on-net pricing by competitors
• QoQ shift in Ramadan -2.3% YoY
• 4G/LTE commercial launch in autumn 2016 with opportunity to win back high value customers
• Transformation in distribution; monobrand roll-out and refurbishment of existing shops in the medium term
• Promoting micro campaigns with tailored services to increase satisfaction
• New simple offers aligned with customer needs
• Data monetization initiatives: bundles, add-ons pack
• Smartphone promotions coupled with bundle offers
• Legacy under-investment
• Significant Market Player status
• Asymmetry in MTRs
• Restrictions on 3G roll-out

19
© V
imp
elC
om
Ltd
20
16
Pakistan: strengthening leadership position
• Double digit revenue growth supported by all revenue streams, gaining revenue market share
• Strong data revenue growth at 55% YoY
• MFS revenue represents 3.5% of service revenue, +56% YoY
• Underlying EBITDA margin, excluding Performance Transformation costs, remains strong at 45%
• Capex decreased due to the rapid 3G rollout in 2015
• Aamir Ibrahim, the new CEO, is onboard
PKR BILLION, UNLESS STATED OTHERWISE
24.9 27.0 28.1
2Q15 1Q16 2Q16
+13.1% YoY
33.4 39.1
2Q15 2Q16
+17.0% YoY
10.8 12.2 12.0
41.3% 42.6% 40.2%
2Q15 1Q16 2Q16
+10.8% YoY +28.6 % YoY (Underlying)1
8.1
3.6 29.3%
16.8%
2Q15 2Q16
-55.6%YoY
EBITDA and EBITDA margin
Capex excl. licenses and LTM capex/revenue
Mobile service revenue
Mobile customers (million)
1 Q2 2015 EBITDA negatively impacted by exceptional costs of PKR 310 million related to SIM re-verification costs and a positive one-off in utility costs; Q2 2016 EBITDA negatively impacted by exceptional costs of PKR 1.5 billion related with Performance Transformation costs
Mobilink and Warid transaction closed
Warid financials will be consolidated starting from July 2016:
LTM 2Q16 Revenue ~PKR 37 billion (USD 350 million) EBITDA margin ~20% Net debt* ~PKR 37 billion (USD 350 million) * excluding intercompany loan of USD 80 million from Mobilink

20
© V
imp
elC
om
Ltd
20
16
Bangladesh: EBITDA margin expansion
• Service revenue increased 2.9% YoY with data revenue growth at 60% YoY
• SIM re-verification successfully completed in July:
► 93% customers verified, almost 100% revenue secured
► Excluding the effect of shift in Ramadan and additional supplementary duty, service revenue growth was 4% YoY
• Underlying EBITDA margin of 48%, benefiting from revenue increase and Performance Transformation
• Banglalink 3G coverage reached 50% of population, from 33% at year-end 2015
LCCY BILLION, UNLESS STATED OTHERWISE
11.6 12.0 11.9
2Q15 1Q16 2Q16
+2.9% YoY
32.0 31.1
2Q15 2Q16
-2.8% YoY
4.9 5.5 5.4
41.9% 45.3% 43.7%
2Q15 1Q16 2Q16
+9.2% YoY +18.6% YoY (Underlying)1
2.5 2.6
26.0% 22.6%
2Q15 2Q16
+3.1% YoY
EBITDA and EBITDA margin
Capex excl. licenses and LTM capex/revenue
Mobile customers (million)
Service revenue
1 Q2 2016 EBITDA negatively impacted by exceptional costs of BDT 464 million related to PT costs and SIM re-verification costs

21
© V
imp
elC
om
Ltd
20
16
Ukraine: continued robust results UAH BILLION, UNLESS STATED OTHERWISE
Mobile Fixed-line
3.1 3.2 3.4
0.2 0.3 0.3
2Q15 1Q16 2Q16
+10.7% YoY
26.1 25.4
2Q15 2Q16
-2.4% YoY
1.5 1.8
2.0
45.6% 52.5% 54.9%
2Q15 1Q16 2Q16
+34.0% YoY
1.2 0.7
23.0% 18.4%
2Q15 2Q16
-38.2% YoY
EBITDA and EBITDA margin
Capex excl. licenses and LTM capex/revenue
Mobile customers (million)
Service revenue
• Clear market leader in challenging environment
• Service revenue increased 10.7% YoY, with mobile data revenue growing at 79% YoY
• Strong EBITDA margin at 55%, mainly driven by revenue growth and Performance Transformation
• High LTM Q2 2016 OCF margin of 34%
• Kyivstar 3G coverage reached 48% of population, from 35% at year-end 2015

22
© V
imp
elC
om
Ltd
20
16
3.1
47.5
6.7%
14.0%
2Q15 2Q16
Uzbekistan: strong revenue growth
• Service revenue increased 8.3% YoY, with mobile data revenue growing at 10% YoY, notwithstanding the change in the market structure from 2 to 4 players
• Robust EBITDA margin at 57%, although declined mainly due to the increased customer tax, impacting EBITDA margin negatively by 4.6 pp YoY
• Major milestone reached with the extension of the operating license for the next 15 years
UZS BILLION, UNLESS STATED OTHERWISE
Mobile Fixed-line
439 465 475
442 468 479
2Q15 1Q16 2Q16
+8.3% YoY
10.3 9.3
2Q15 1Q16
-9.3% YoY
284 285 273
64.3% 60.8% 57.1%
2Q15 1Q16 2Q16
-3.9% YoY
EBITDA and EBITDA margin
Capex excl. licenses and LTM capex/revenue
Mobile customers (million)
Service revenue

23
© V
imp
elC
om
Ltd
20
16
Italy: improving quarter-on-quarter trend
• Total Revenue and EBITDA back to growth (+0.9%/+0.5% YoY)
• Double digit growth in mobile data revenue (+13% YoY)
• Fixed direct customers base +3.7% YoY, of which broadband segment +5.1% YoY
• 4G/LTE population coverage approximately 62%, from 56% at year-end 2015
• Italian JV:
► Italy JV filing of commitments to EC and formal agreements signed with Iliad
► As of today, no Statement of Objections received
► EC decision expected by 8 September
• Enel Open Fiber agreement signed in April; in May first FTTH customers connected in Perugia and 4 new cities will be covered by September
EUR MILLION, UNLESS STATED OTHERWISE
Mobile Fixed-line
720.0 703.1 714.0
277.0 263.0 264.0
2Q15 1Q16 2Q16
-1.9% YoY
21.4 20.9
2Q15 2Q16
-2.5% YoY
397.2 380.8 399.1
36.7% 35.8% 36.6%
2Q15 1Q16 2Q16
+0.5 % YoY
185.7 191.6
17.9% 17.8%
0
200
2Q15 2Q16
+3.2% YoY
EBITDA and EBITDA margin
Capex excl. licenses and LTM capex/revenue
Mobile customers (million)
Service revenue

24
© V
imp
elC
om
Ltd
20
16
FY 2016 guidance confirmed - lower end of range for service revenue and
underlying EBITDA margin, while capex/revenue is trending towards 17%
Service Revenue1
EBITDA underlying margin1
Capex / revenue1
Leverage2
1 All targets, except leverage are calculated at constant currency. Targets for 2016 assume no major regulatory changes, no change to the asset portfolio and no major macro-economic changes; targets are also adjusted for Italy classified as asset held for sale; EBITDA Margin excludes exceptional items such as impairment charges, restructuring charges, litigation and settlements, impact of M&A transactions and related accounting and other one-off charges and transformation costs
2 Leverage target 2016 on assumed FX for 2016 (all currencies, e.g. Ruble/Dollar of 70). Leverage target 2016 assumes successful closing of Italy JV and Pakistan transaction
H1 2016 Targets FY 2016
+0.8% YoY
Organic +0.1 pp YoY (40.9%)
LTM: 17.3% (1H16: 10.9%)
1.8x
Flat to low single digit growth YoY
Flat to +1 p.p. YoY
17-18%
~2x
OCF margin1 (EBITDA-capex)/revenue
Flat to +2 p.p. YoY +2.6 pp YoY (30.0%)

25
© V
imp
elC
om
Ltd
20
16
Appendix

26
© V
imp
elC
om
Ltd
20
16
Exceptional item summary
USD mln, unaudited 2Q16 2Q15 1H16 1H15
EBITDA 795 1,069 1,553 2,006
Performance Transformation costs, of which 74 - 118 -
HQ and Other 55 90
Russia 3 3
Emerging Markets 16 24
Other exceptional items, of which 42 (3) 39 5
In other and HQ, mainly due to provisions for indirect taxes 38 38
SIM re-verification in Bangladesh 4 4
SIM re-verification in Pakistan, offset by positive one-off in utility costs in Q2 2015 (3) 5
Bad debt and litigation losses in Uzbekistan (3)
Total exceptional items 116 (3) 157 5
EBITDA underlying 911 1,066 1,710 2,011

27
© V
imp
elC
om
Ltd
20
16
Group debt maturity schedule
Group debt maturity schedule by currency1
As at 30 June 2016, in USD billion
Group debt maturity schedule
1 After effect of cross currency swaps
0.6
2.7
1.7
1.2
0.7 0.7
1.3 1.7
2016 2017 2018 2019 2020 2021 2022 >2022
Russia GTH HQ
2016 2017 2018 2019 2020 2021 2022 >2022
USD 0.1 1.5 0.6 1.0 0.6 0.7 1.3 1.7 71%
RUB 0.3 1.0 0.8 0.0 0.0 0.0 0.0 0.0 20%
Other 0.2 0.2 0.2 0.2 0.0 0.0 0.0 0.0 9%

28
© V
imp
elC
om
Ltd
20
16
Debt by entity
As at 30 June 2016, USD million
Outstanding debt (millions)
Entity Bonds Loans RCF Other Total
VimpelCom Holdings B.V. 3,369 - - - - 3,369
VimpelCom Amsterdam B.V. - 1,000 - 664 - 1,664
PJSC VimpelCom 1,773 1,187 - 95 42 3,097
GTH Finance B.V. 1,200 - - - - 1,200
Pakistan Mobile Communications Limited 69 316 - - - 385
Banglalink Digital Communications Ltd. 300 37 - - 0 337
Omnium Telecom Algeria S.p.A. - 499 - - - 499
Others - - - 8 - 0 8
Total 6,711 3,039 - 768 42 10,560
Type of debt/lender
Vendor Financing

29
© V
imp
elC
om
Ltd
20
16
Liquidity analysis
Group Cash breakdown by currency (USD 4.0bn) (30 June 2016)
Cash position largely held in USD
58%
42%
USD Others
Unused RCF headroom at the end Q2 2016:
VimpelCom - syndicate USD 1.8 billion
PJSC VimpelCom - Sberbank RUB 15 billion (USD 0.2 billion)
Unused VF/CF headroom at the end Q2 2016: VimpelCom - CDB RMB 0.7 billion (USD 0.1 billion)
Algeria - syndicate DZD 32 billion (USD 0.3 billion)
Pakistan - syndicate PKR 13 billion (USD 0.1 billion)

30
© V
imp
elC
om
Ltd
20
16
1.7
3.1
Group Including Italy
Net debt/EBITDA
Net debt / EBITDA1
(30 June 2016) Net debt / EBITDA1 (31 March 2016)
1 Underlying LTM EBITDA
1.8
3.2
Group Including Italy

31
© V
imp
elC
om
Ltd
20
16
2Q16 2Q15 YoYFY16
Targets1H16 1H15 YoY 2Q16 1Q16
Russian Ruble 65.89 52.65 25.1% 70.00 70.26 57.40 22.4% 64.26 67.61
Euro 0.89 0.90 -2.0% 0.88 0.90 0.90 0.0% 0.90 0.88
Algerian Dinar 109.54 98.27 11.5% 100.00 108.68 95.76 13.5% 110.31 108.39
Pakistan Rupee 104.67 101.83 2.8% 105.00 104.71 101.62 3.0% 104.75 104.71
Bangladeshi Taka 78.35 77.79 0.7% 79.00 78.41 77.82 0.8% 78.33 78.38
Ukrainian Hryvnia 25.26 21.61 16.9% 25.00 25.46 21.36 19.2% 24.85 26.22
Kazakhstani Tenge 335.58 185.86 80.6% 350.00 345.35 185.22 86.5% 338.87 343.06
Uzbekistan Som 2,910.98 2,522.6 15.4% 2840.00 2,877.3 2,486.8 15.7% 2,943.46 2,876.7
Armenian Dram 479.06 476.32 0.6% 480.00 483.83 476.71 1.5% 476.68 480.79
Kyrgystani Som 68.38 60.52 13.0% 70.00 71.29 60.67 17.5% 67.49 70.02
Georgian Lari 2.21 2.28 -3.0% 2.25 2.32 2.18 6.7% 2.34 2.37
Average rates Closing ratesAverage rates
Rates of functional currencies to USD