q2 2005 - idema · q2 2005 features: • gmr ... zinc lapping plates, although less common, ......
TRANSCRIPT
The online journal of IDEMA,
the global trade association for the disk drive industry Q2 2005 Features:
• GMR and TMR Corrosion Issues and Solutions for Magnetic Read-Write Devices, by Donald C. Zipperian, Ph.D, Pace Technologies, and Professor Srini Raghavan, University of Arizona
• Inertial Sensing for Hard Disk Drive Drop Protection, by Gregory J.
Galvin, Ph.D., President and CEO, Kionix, Inc. • DISKCON USA, September 19-22, Santa Clara, CA Charity for Youth Golf Tournament, September 19
Conference and Tradeshow, September 20-21 Keynote Dinner featuring Mike Wingert, Maxtor President & COO, Sept. 20 Global Standards Meetings, September 22
ARTICLE: GMR and TMR Corrosion Issues and Solutions for
Magnetic Read-Write Devices By Donald C. Zipperian, Ph.D., Pace Technologies, and Professor Srini Raghavan, University of Arizona
INTRODUCTION Magnetic read-write storage devices, in addition to computer hard drives and
magnetic tape, are now being incorporated into many commercial multimedia
information and communication devices. Driving this commercialization has been
the continued 60-80% growth rate per year in the areal recording density. The
technological developments utilized to reach the present areal density levels of 100+
Gbits/in2 have placed stringent demands on the manufacturing processes for these
devices. The primary driving force for the present technology and for the future
growth has been the continued development of giant magnetoresistive (GMR) spin-
valve heads and the next generation tunneling magnetoresistive (TMR) heads.
- 1 -
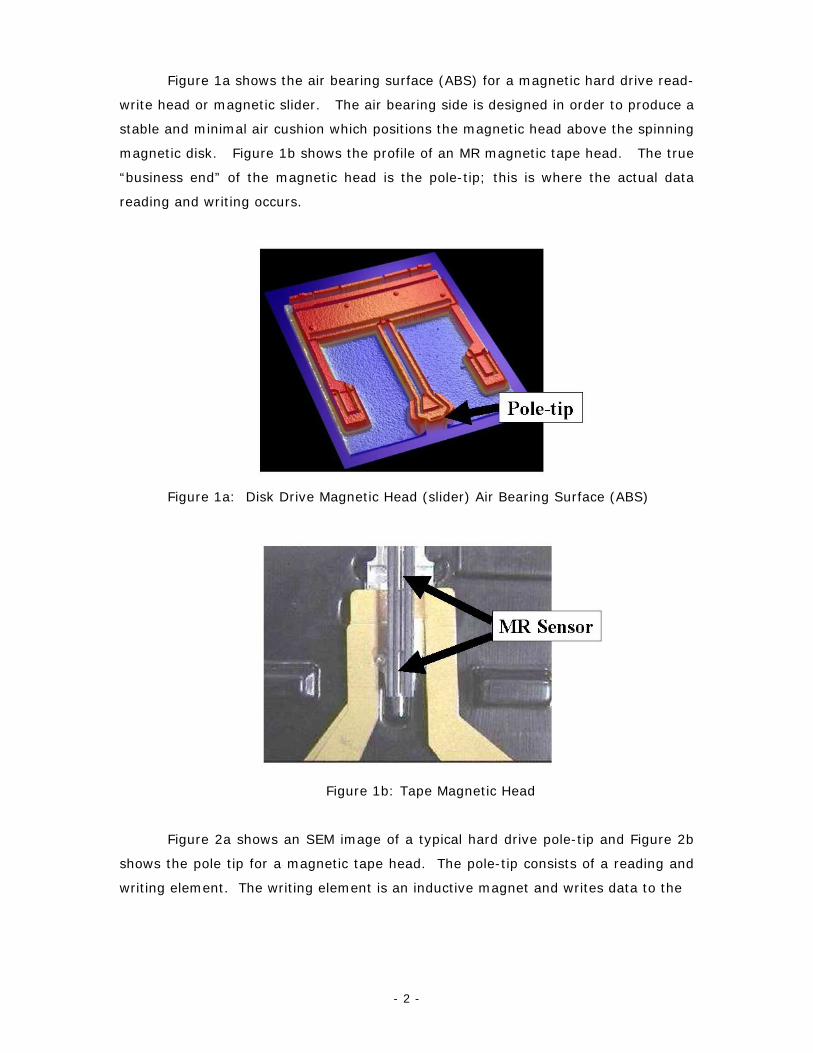
Figure 1a shows the air bearing surface (ABS) for a magnetic hard drive read-
write head or magnetic slider. The air bearing side is designed in order to produce a
stable and minimal air cushion which positions the magnetic head above the spinning
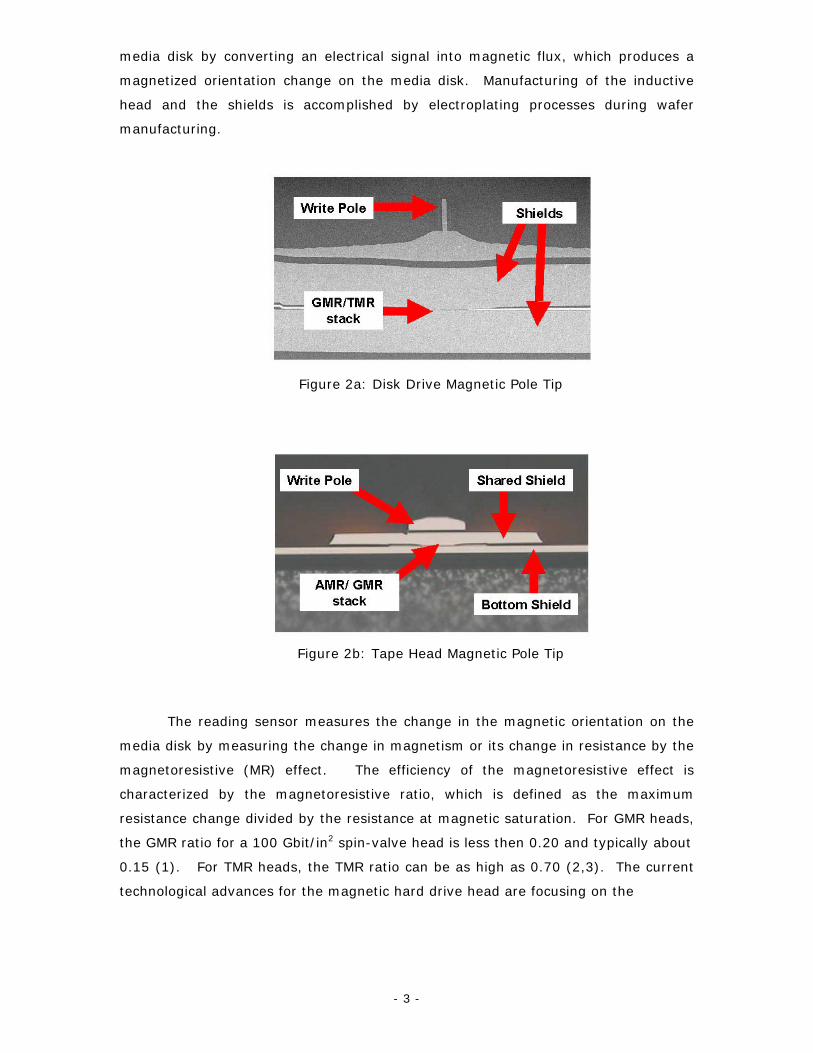
magnetic disk. Figure 1b shows the profile of an MR magnetic tape head. The true
“business end” of the magnetic head is the pole-tip; this is where the actual data
reading and writing occurs.
Figure 1a: Disk Drive Magnetic Head (slider) Air Bearing Surface (ABS)
Figure 1b: Tape Magnetic Head
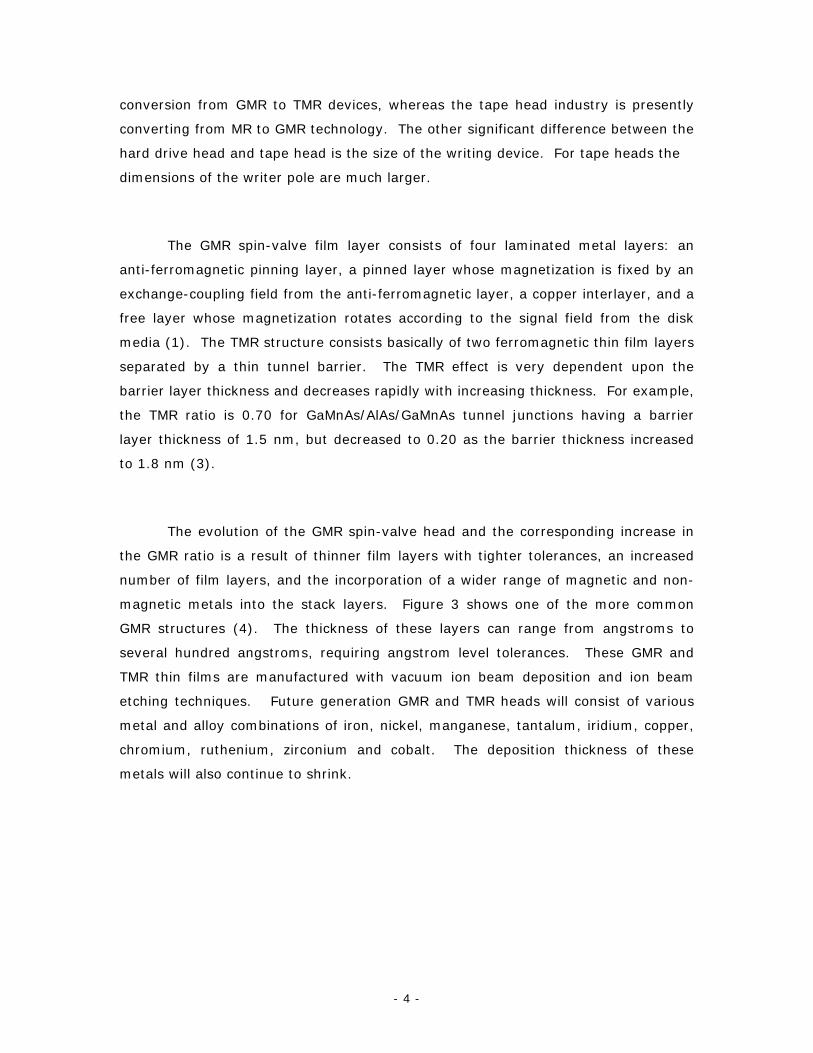
Figure 2a shows an SEM image of a typical hard drive pole-tip and Figure 2b
shows the pole tip for a magnetic tape head. The pole-tip consists of a reading and
writing element. The writing element is an inductive magnet and writes data to the
- 2 -
media disk by converting an electrical signal into magnetic flux, which produces a
magnetized orientation change on the media disk. Manufacturing of the inductive
head and the shields is accomplished by electroplating processes during wafer
manufacturing.
Figure 2a: Disk Drive Magnetic Pole Tip
Figure 2b: Tape Head Magnetic Pole Tip
The reading sensor measures the change in the magnetic orientation on the
media disk by measuring the change in magnetism or its change in resistance by the
magnetoresistive (MR) effect. The efficiency of the magnetoresistive effect is
characterized by the magnetoresistive ratio, which is defined as the maximum
resistance change divided by the resistance at magnetic saturation. For GMR heads,
the GMR ratio for a 100 Gbit/in2 spin-valve head is less then 0.20 and typically about
0.15 (1). For TMR heads, the TMR ratio can be as high as 0.70 (2,3). The current
technological advances for the magnetic hard drive head are focusing on the
- 3 -
- 4 -
conversion from GMR to TMR devices, whereas the tape head industry is presently
converting from MR to GMR technology. The other significant difference between the
hard drive head and tape head is the size of the writing device. For tape heads the
dimensions of the writer pole are much larger.
The GMR spin-valve film layer consists of four laminated metal layers: an
anti-ferromagnetic pinning layer, a pinned layer whose magnetization is fixed by an
exchange-coupling field from the anti-ferromagnetic layer, a copper interlayer, and a
free layer whose magnetization rotates according to the signal field from the disk
media (1). The TMR structure consists basically of two ferromagnetic thin film layers
separated by a thin tunnel barrier. The TMR effect is very dependent upon the
barrier layer thickness and decreases rapidly with increasing thickness. For example,
the TMR ratio is 0.70 for GaMnAs/AlAs/GaMnAs tunnel junctions having a barrier
layer thickness of 1.5 nm, but decreased to 0.20 as the barrier thickness increased
to 1.8 nm (3).
The evolution of the GMR spin-valve head and the corresponding increase in
the GMR ratio is a result of thinner film layers with tighter tolerances, an increased
number of film layers, and the incorporation of a wider range of magnetic and non-
magnetic metals into the stack layers. Figure 3 shows one of the more common
GMR structures (4). The thickness of these layers can range from angstroms to
several hundred angstroms, requiring angstrom level tolerances. These GMR and
TMR thin films are manufactured with vacuum ion beam deposition and ion beam
etching techniques. Future generation GMR and TMR heads will consist of various
metal and alloy combinations of iron, nickel, manganese, tantalum, iridium, copper,
chromium, ruthenium, zirconium and cobalt. The deposition thickness of these
metals will also continue to shrink.
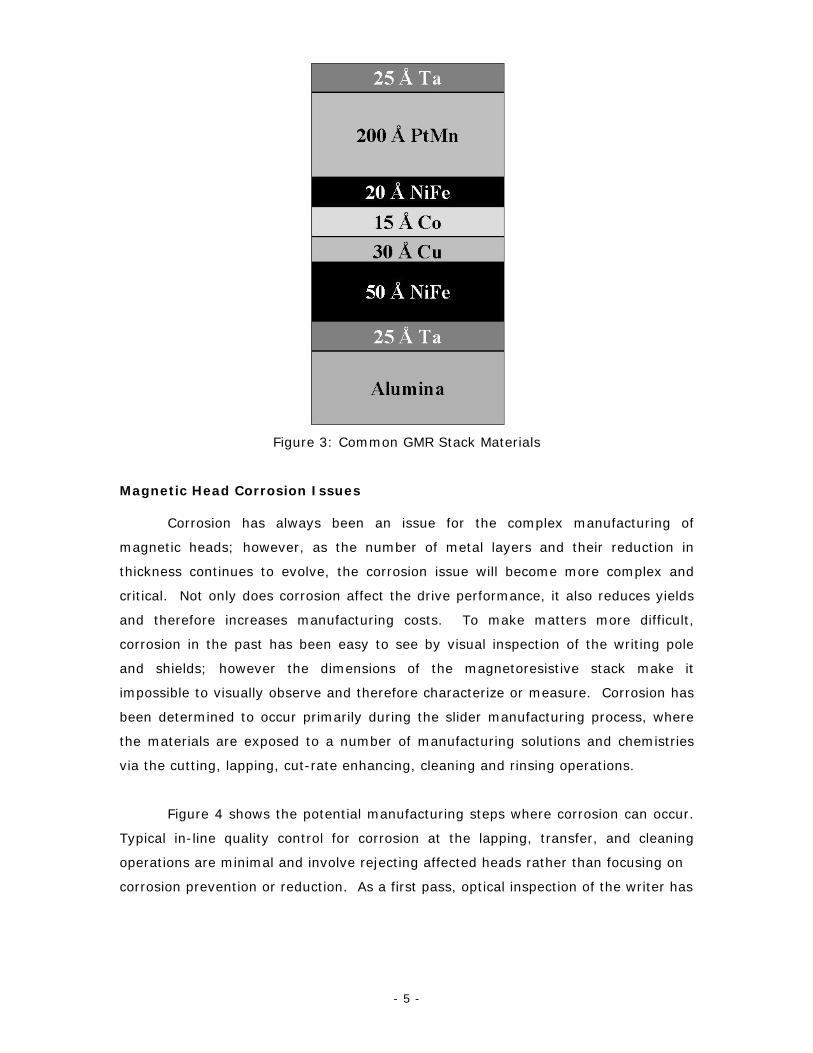
Figure 3: Common GMR Stack Materials
Magnetic Head Corrosion Issues
Corrosion has always been an issue for the complex manufacturing of
magnetic heads; however, as the number of metal layers and their reduction in
thickness continues to evolve, the corrosion issue will become more complex and
critical. Not only does corrosion affect the drive performance, it also reduces yields
and therefore increases manufacturing costs. To make matters more difficult,
corrosion in the past has been easy to see by visual inspection of the writing pole
and shields; however the dimensions of the magnetoresistive stack make it
impossible to visually observe and therefore characterize or measure. Corrosion has
been determined to occur primarily during the slider manufacturing process, where
the materials are exposed to a number of manufacturing solutions and chemistries
via the cutting, lapping, cut-rate enhancing, cleaning and rinsing operations.
Figure 4 shows the potential manufacturing steps where corrosion can occur.
Typical in-line quality control for corrosion at the lapping, transfer, and cleaning
operations are minimal and involve rejecting affected heads rather than focusing on
corrosion prevention or reduction. As a first pass, optical inspection of the writer has
- 5 -
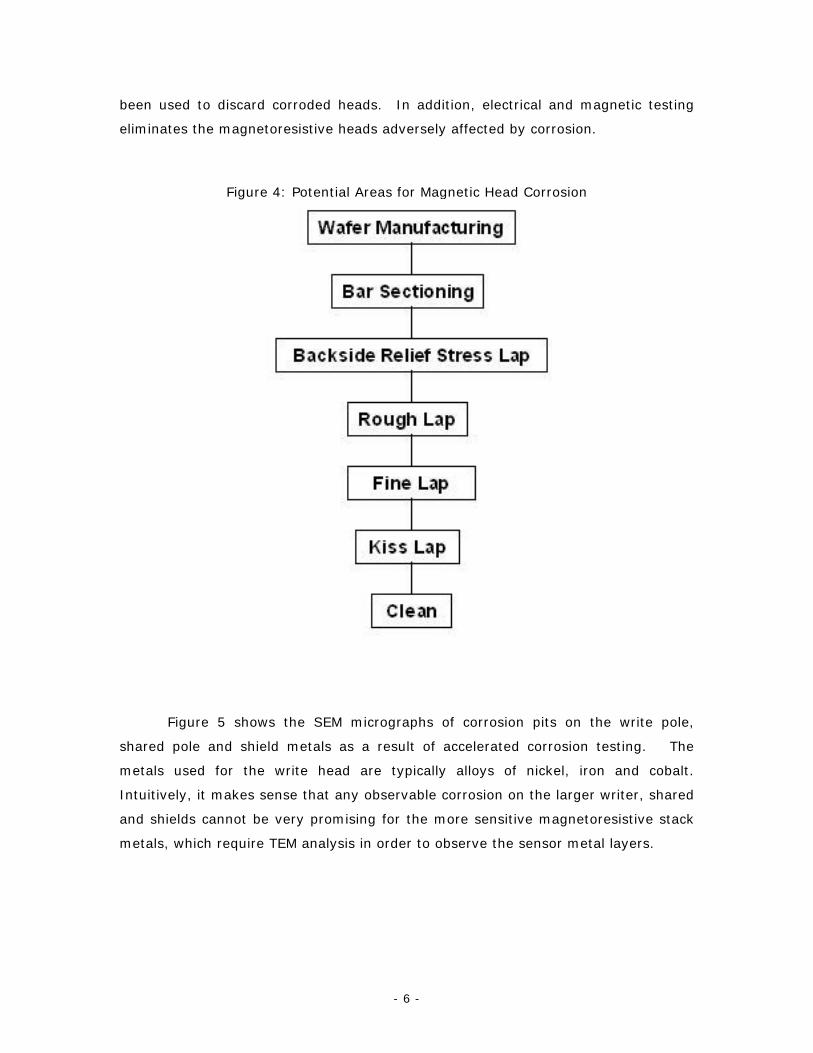
been used to discard corroded heads. In addition, electrical and magnetic testing
eliminates the magnetoresistive heads adversely affected by corrosion.
Figure 4: Potential Areas for Magnetic Head Corrosion
Figure 5 shows the SEM micrographs of corrosion pits on the write pole,
shared pole and shield metals as a result of accelerated corrosion testing. The
metals used for the write head are typically alloys of nickel, iron and cobalt.
Intuitively, it makes sense that any observable corrosion on the larger writer, shared
and shields cannot be very promising for the more sensitive magnetoresistive stack
metals, which require TEM analysis in order to observe the sensor metal layers.
- 6 -
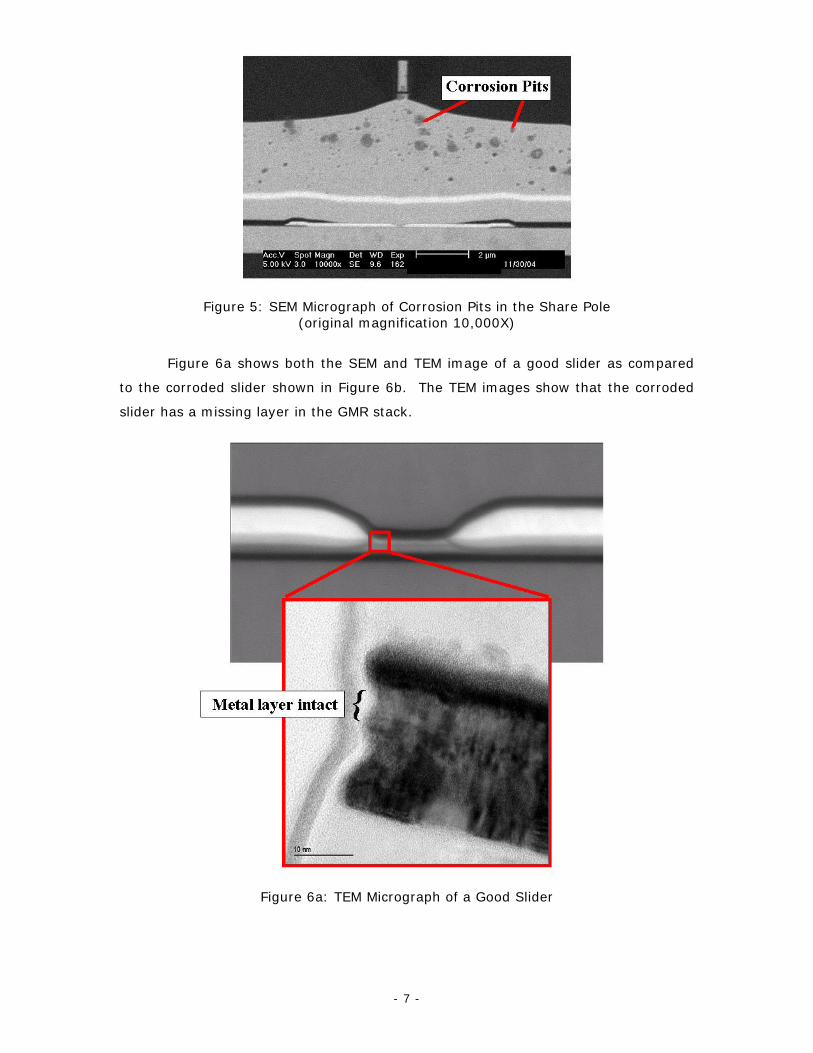
Figure 5: SEM Micrograph of Corrosion Pits in the Share Pole (original magnification 10,000X)
Figure 6a shows both the SEM and TEM image of a good slider as compared
to the corroded slider shown in Figure 6b. The TEM images show that the corroded
slider has a missing layer in the GMR stack.
Figure 6a: TEM Micrograph of a Good Slider
- 7 -
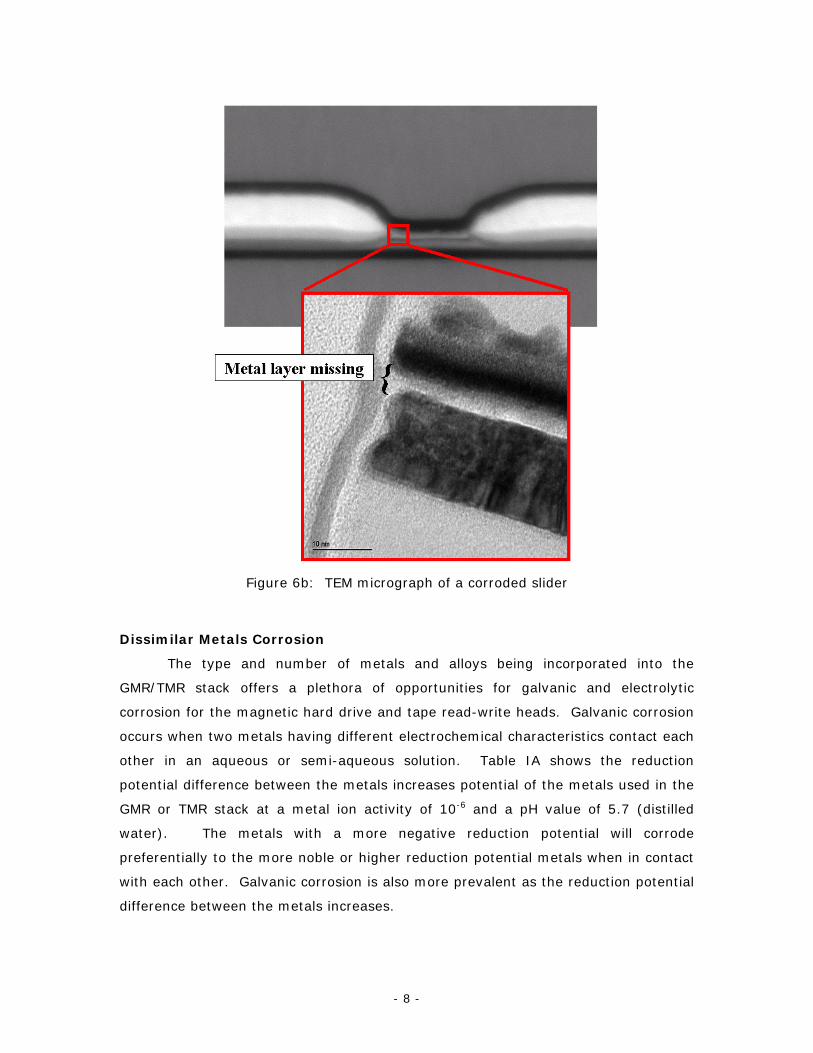
Figure 6b: TEM micrograph of a corroded slider
Dissimilar Metals Corrosion
The type and number of metals and alloys being incorporated into the
GMR/TMR stack offers a plethora of opportunities for galvanic and electrolytic
corrosion for the magnetic hard drive and tape read-write heads. Galvanic corrosion
occurs when two metals having different electrochemical characteristics contact each
other in an aqueous or semi-aqueous solution. Table IA shows the reduction
potential difference between the metals increases potential of the metals used in the
GMR or TMR stack at a metal ion activity of 10-6 and a pH value of 5.7 (distilled
water). The metals with a more negative reduction potential will corrode
preferentially to the more noble or higher reduction potential metals when in contact
with each other. Galvanic corrosion is also more prevalent as the reduction potential
difference between the metals increases. - 8 -
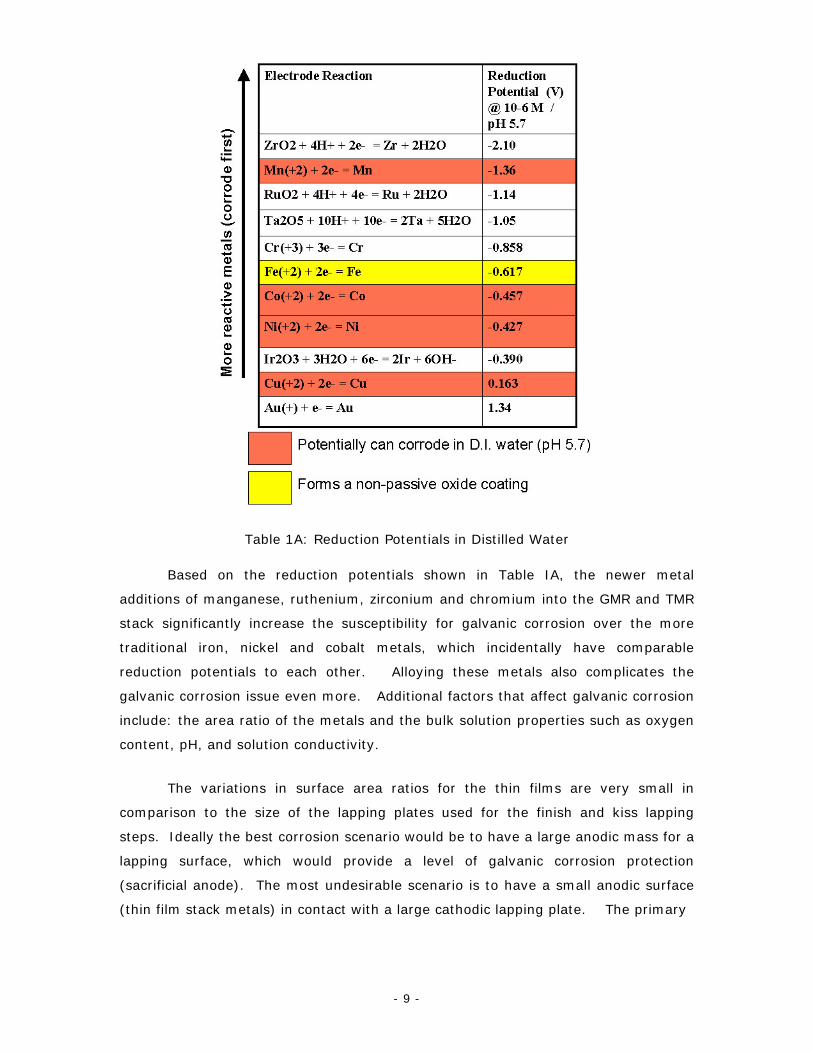
Table 1A: Reduction Potentials in Distilled Water Based on the reduction potentials shown in Table IA, the newer metal
additions of manganese, ruthenium, zirconium and chromium into the GMR and TMR
stack significantly increase the susceptibility for galvanic corrosion over the more
traditional iron, nickel and cobalt metals, which incidentally have comparable
reduction potentials to each other. Alloying these metals also complicates the
galvanic corrosion issue even more. Additional factors that affect galvanic corrosion
include: the area ratio of the metals and the bulk solution properties such as oxygen
content, pH, and solution conductivity.
The variations in surface area ratios for the thin films are very small in
comparison to the size of the lapping plates used for the finish and kiss lapping
steps. Ideally the best corrosion scenario would be to have a large anodic mass for a
lapping surface, which would provide a level of galvanic corrosion protection
(sacrificial anode). The most undesirable scenario is to have a small anodic surface
(thin film stack metals) in contact with a large cathodic lapping plate. The primary - 9 -
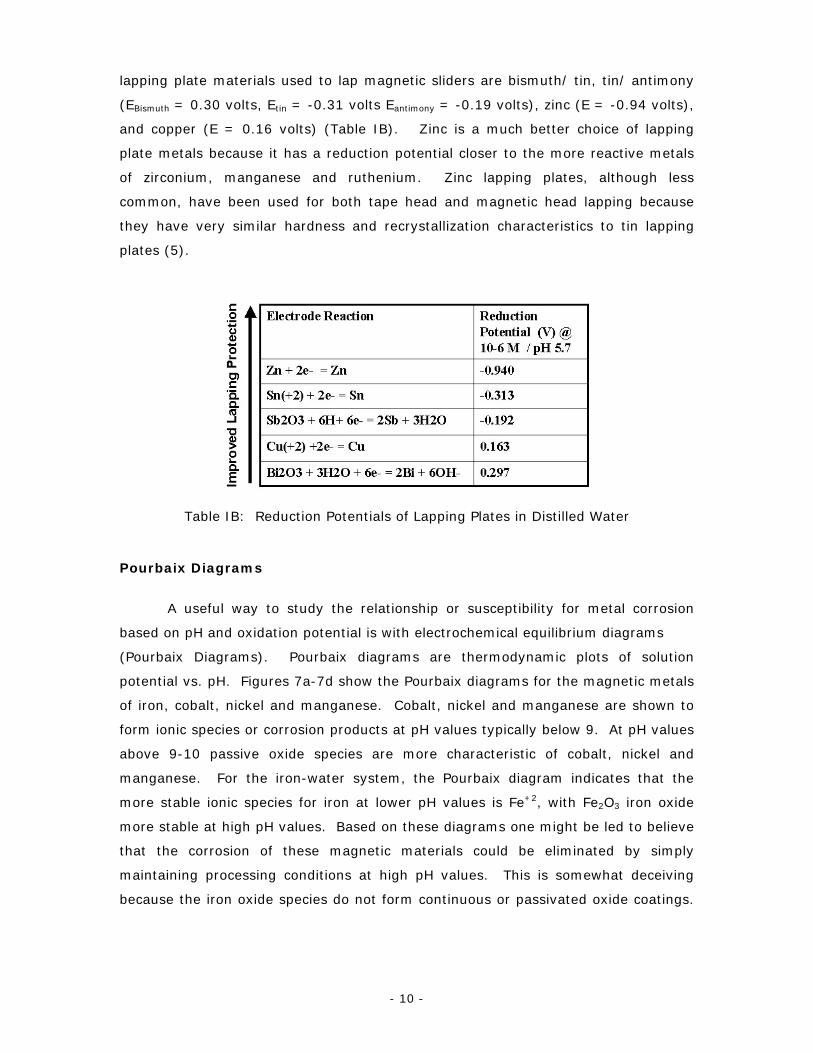
lapping plate materials used to lap magnetic sliders are bismuth/ tin, tin/ antimony
(EBismuth = 0.30 volts, Etin = -0.31 volts Eantimony = -0.19 volts), zinc (E = -0.94 volts),
and copper (E = 0.16 volts) (Table IB). Zinc is a much better choice of lapping
plate metals because it has a reduction potential closer to the more reactive metals
of zirconium, manganese and ruthenium. Zinc lapping plates, although less
common, have been used for both tape head and magnetic head lapping because
they have very similar hardness and recrystallization characteristics to tin lapping
plates (5).
Table IB: Reduction Potentials of Lapping Plates in Distilled Water
Pourbaix Diagrams
A useful way to study the relationship or susceptibility for metal corrosion
based on pH and oxidation potential is with electrochemical equilibrium diagrams
(Pourbaix Diagrams). Pourbaix diagrams are thermodynamic plots of solution
potential vs. pH. Figures 7a-7d show the Pourbaix diagrams for the magnetic metals
of iron, cobalt, nickel and manganese. Cobalt, nickel and manganese are shown to
form ionic species or corrosion products at pH values typically below 9. At pH values
above 9-10 passive oxide species are more characteristic of cobalt, nickel and
manganese. For the iron-water system, the Pourbaix diagram indicates that the
more stable ionic species for iron at lower pH values is Fe+2, with Fe2O3 iron oxide
more stable at high pH values. Based on these diagrams one might be led to believe
that the corrosion of these magnetic materials could be eliminated by simply
maintaining processing conditions at high pH values. This is somewhat deceiving
because the iron oxide species do not form continuous or passivated oxide coatings.
- 10 -

In fact, at higher pH values, iron corrosion may be more aggressive because of
localized pitting corrosion.
Figure 7a: Pourbaix Diagram for Iron-water System (metal ion activity 10-6)
Figure 7b: Pourbaix Diagram for Nickel-water System (metal ion activity 10-6)
- 11 -
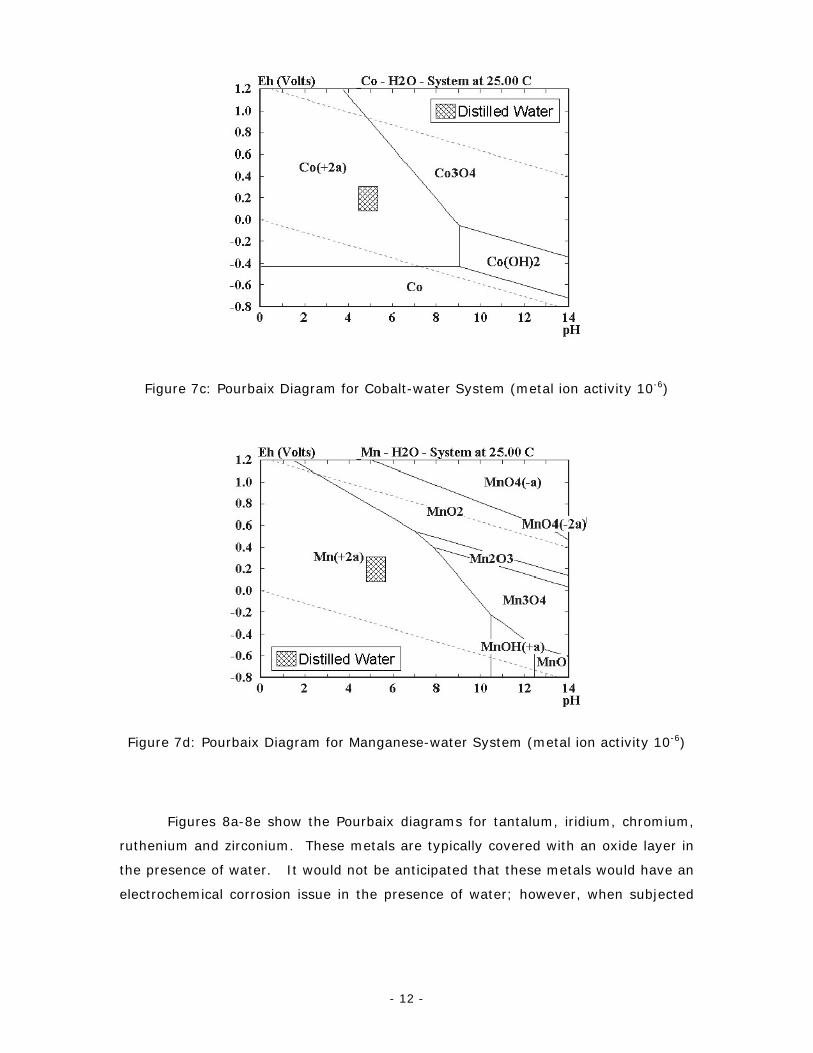
Figure 7c: Pourbaix Diagram for Cobalt-water System (metal ion activity 10-6)
Figure 7d: Pourbaix Diagram for Manganese-water System (metal ion activity 10-6)
Figures 8a-8e show the Pourbaix diagrams for tantalum, iridium, chromium,
ruthenium and zirconium. These metals are typically covered with an oxide layer in
the presence of water. It would not be anticipated that these metals would have an
electrochemical corrosion issue in the presence of water; however, when subjected
- 12 -
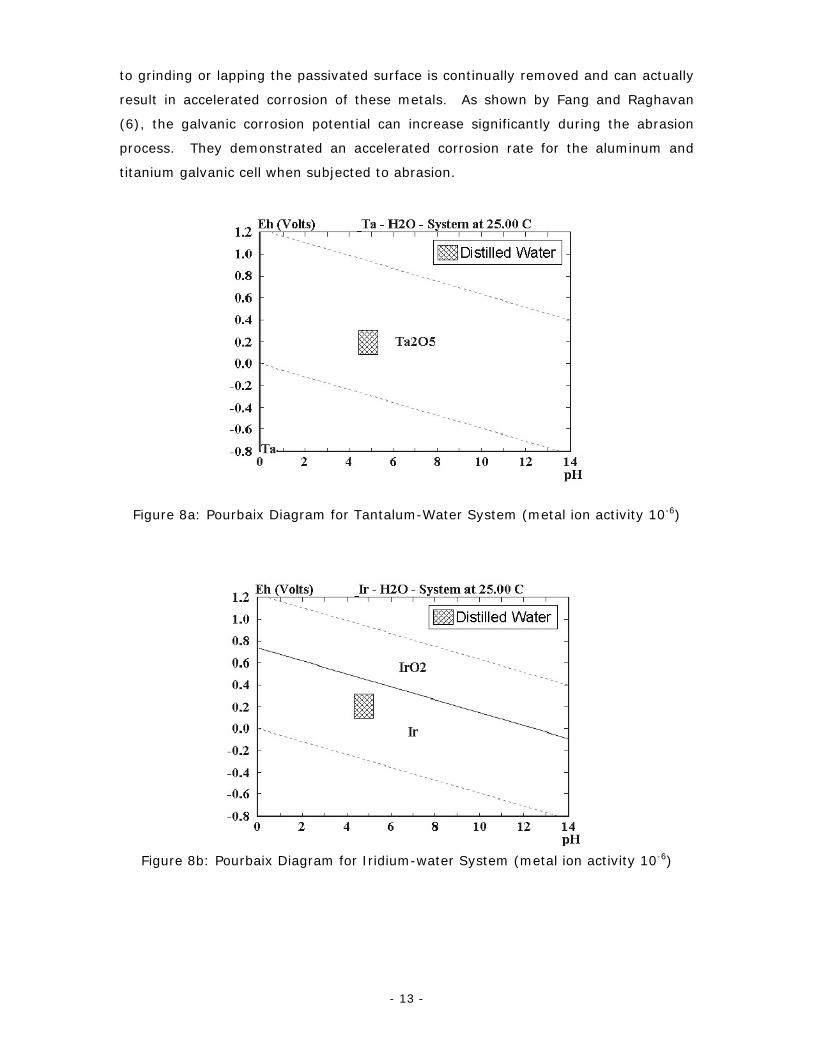
to grinding or lapping the passivated surface is continually removed and can actually
result in accelerated corrosion of these metals. As shown by Fang and Raghavan
(6), the galvanic corrosion potential can increase significantly during the abrasion
process. They demonstrated an accelerated corrosion rate for the aluminum and
titanium galvanic cell when subjected to abrasion.
Figure 8a: Pourbaix Diagram for Tantalum-Water System (metal ion activity 10-6)
Figure 8b: Pourbaix Diagram for Iridium-water System (metal ion activity 10-6)
- 13 -
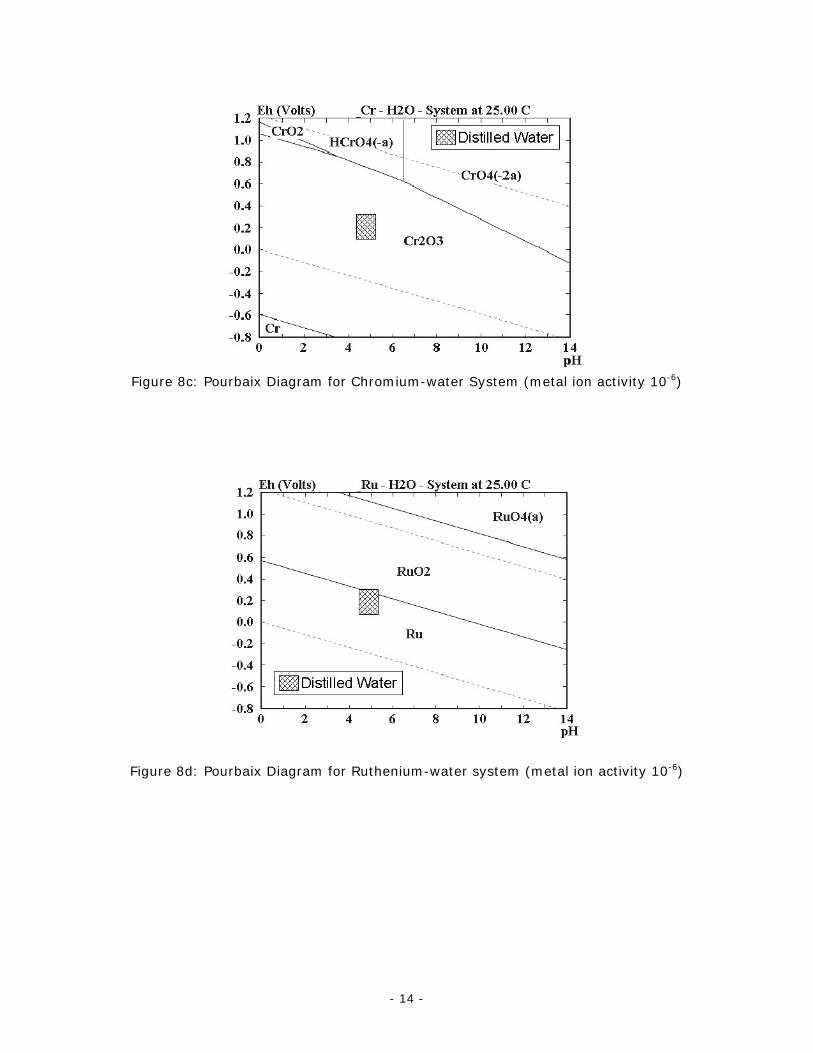
Figure 8c: Pourbaix Diagram for Chromium-water System (metal ion activity 10-6)
Figure 8d: Pourbaix Diagram for Ruthenium-water system (metal ion activity 10-6)
- 14 -
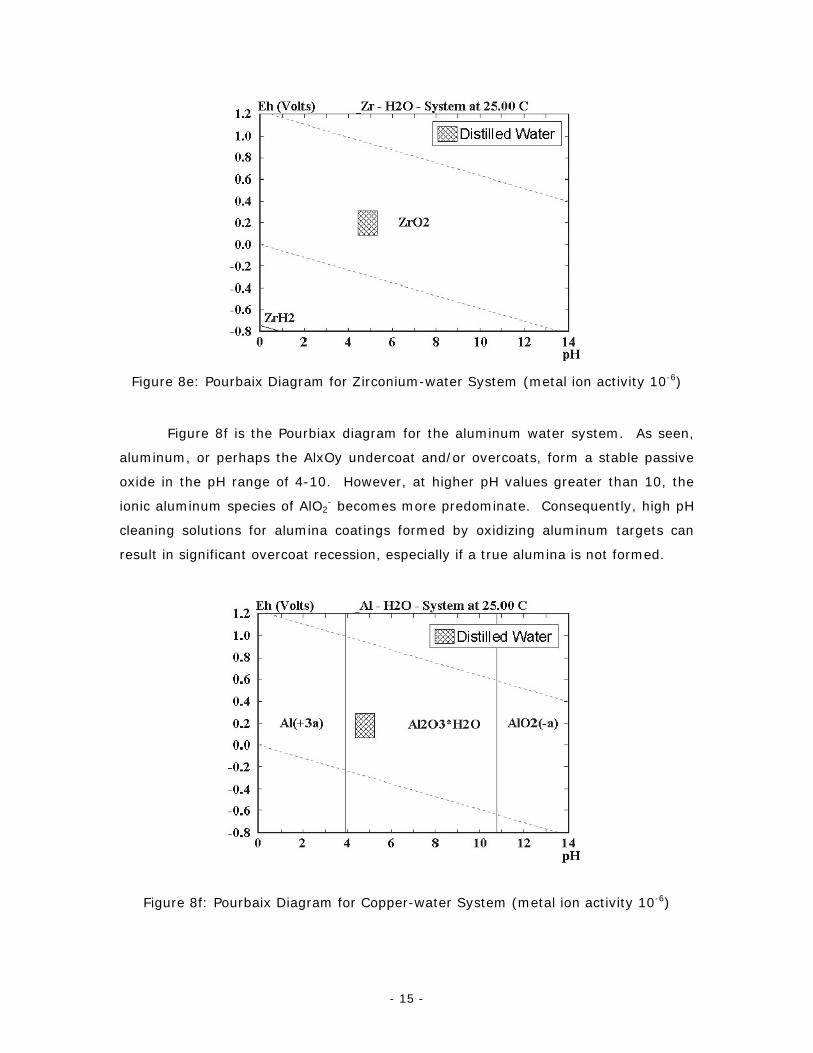
Figure 8e: Pourbaix Diagram for Zirconium-water System (metal ion activity 10-6)
Figure 8f is the Pourbiax diagram for the aluminum water system. As seen,
aluminum, or perhaps the AlxOy undercoat and/or overcoats, form a stable passive
oxide in the pH range of 4-10. However, at higher pH values greater than 10, the
ionic aluminum species of AlO2- becomes more predominate. Consequently, high pH
cleaning solutions for alumina coatings formed by oxidizing aluminum targets can
result in significant overcoat recession, especially if a true alumina is not formed.
Figure 8f: Pourbaix Diagram for Copper-water System (metal ion activity 10-6)
- 15 -
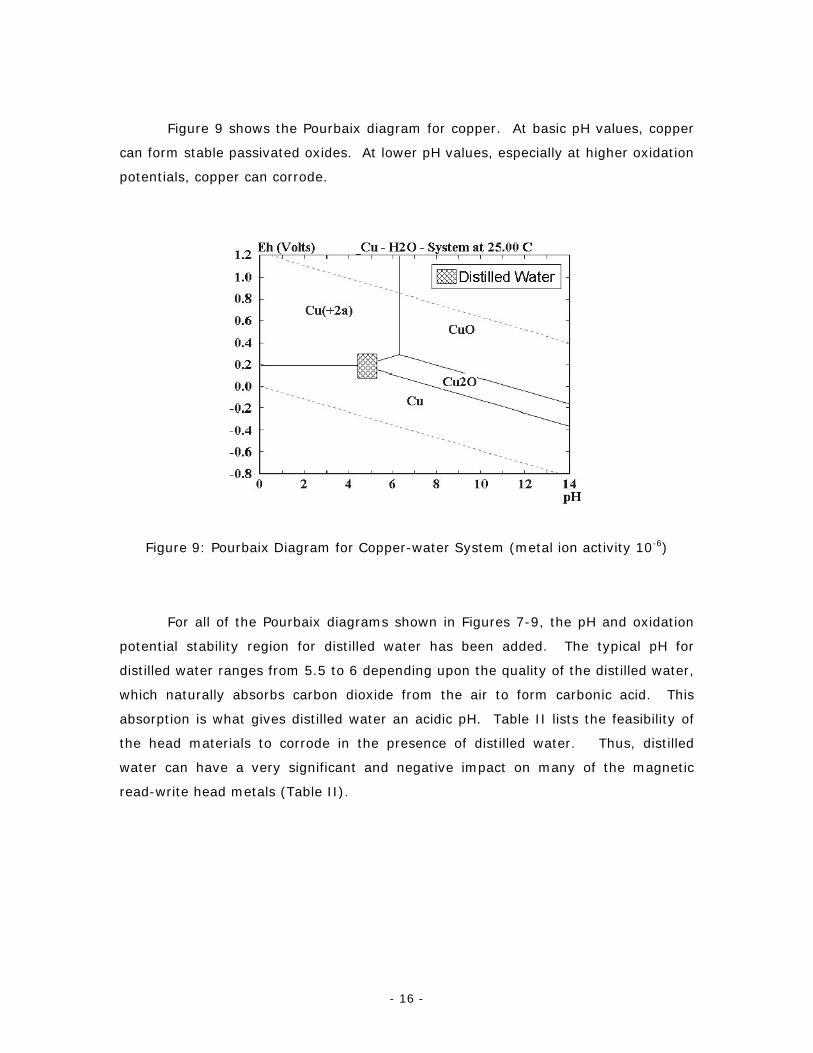
Figure 9 shows the Pourbaix diagram for copper. At basic pH values, copper
can form stable passivated oxides. At lower pH values, especially at higher oxidation
potentials, copper can corrode.
Figure 9: Pourbaix Diagram for Copper-water System (metal ion activity 10-6)
For all of the Pourbaix diagrams shown in Figures 7-9, the pH and oxidation
potential stability region for distilled water has been added. The typical pH for
distilled water ranges from 5.5 to 6 depending upon the quality of the distilled water,
which naturally absorbs carbon dioxide from the air to form carbonic acid. This
absorption is what gives distilled water an acidic pH. Table II lists the feasibility of
the head materials to corrode in the presence of distilled water. Thus, distilled
water can have a very significant and negative impact on many of the magnetic
read-write head metals (Table II).
- 16 -
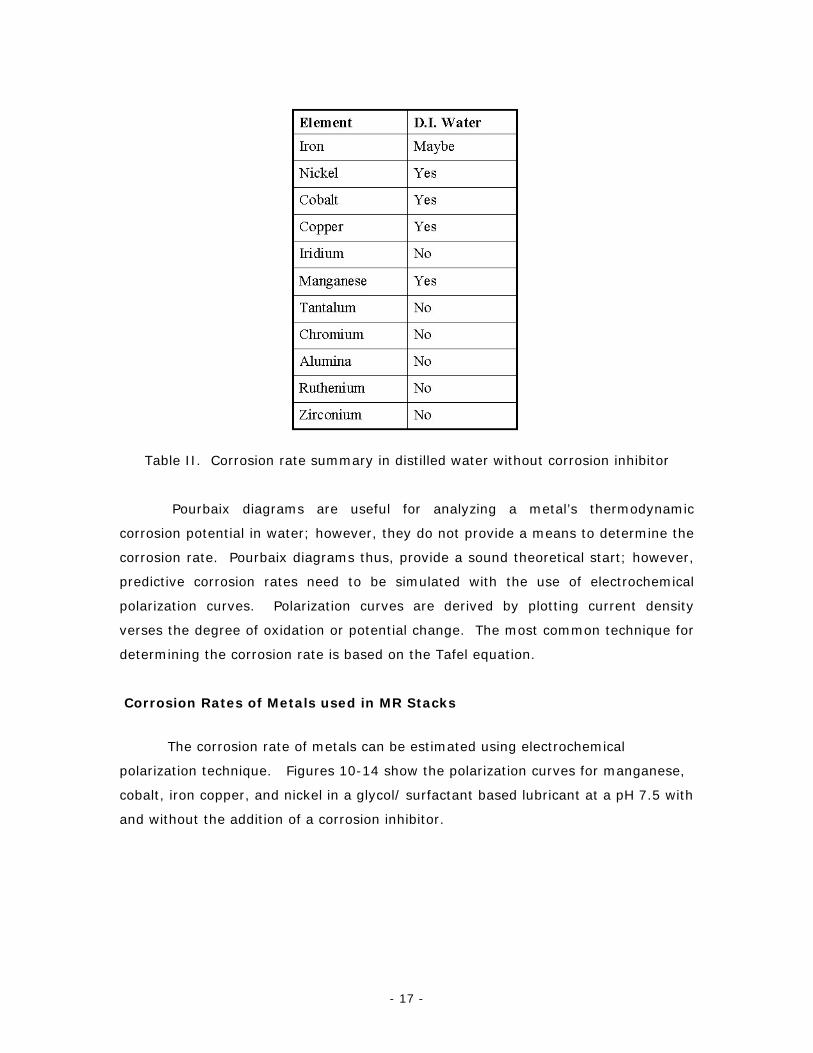
Table II. Corrosion rate summary in distilled water without corrosion inhibitor
Pourbaix diagrams are useful for analyzing a metal’s thermodynamic
corrosion potential in water; however, they do not provide a means to determine the
corrosion rate. Pourbaix diagrams thus, provide a sound theoretical start; however,
predictive corrosion rates need to be simulated with the use of electrochemical
polarization curves. Polarization curves are derived by plotting current density
verses the degree of oxidation or potential change. The most common technique for
determining the corrosion rate is based on the Tafel equation.
Corrosion Rates of Metals used in MR Stacks
The corrosion rate of metals can be estimated using electrochemical
polarization technique. Figures 10-14 show the polarization curves for manganese,
cobalt, iron copper, and nickel in a glycol/ surfactant based lubricant at a pH 7.5 with
and without the addition of a corrosion inhibitor.
- 17 -
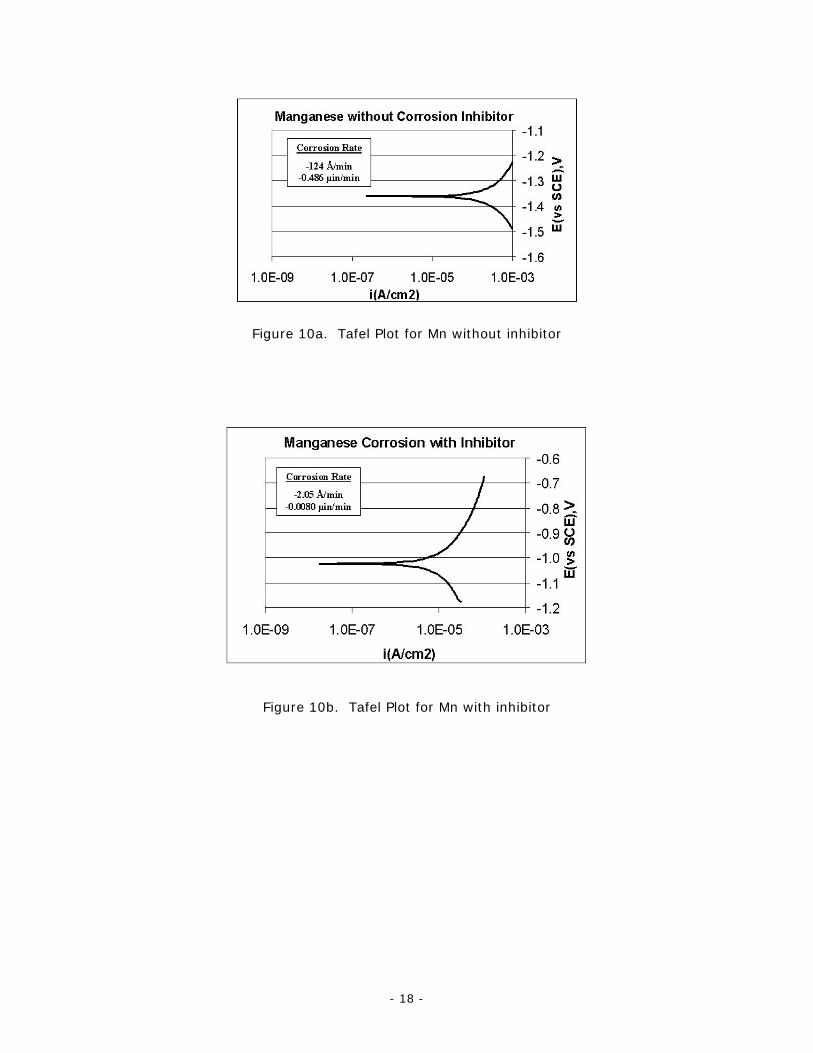
Figure 10a. Tafel Plot for Mn without inhibitor
Figure 10b. Tafel Plot for Mn with inhibitor
- 18 -

Figure 11a. Tafel Plot for Co without inhibitor
Figure 11b: Tafel Plot for Co with inhibitor
- 19 -
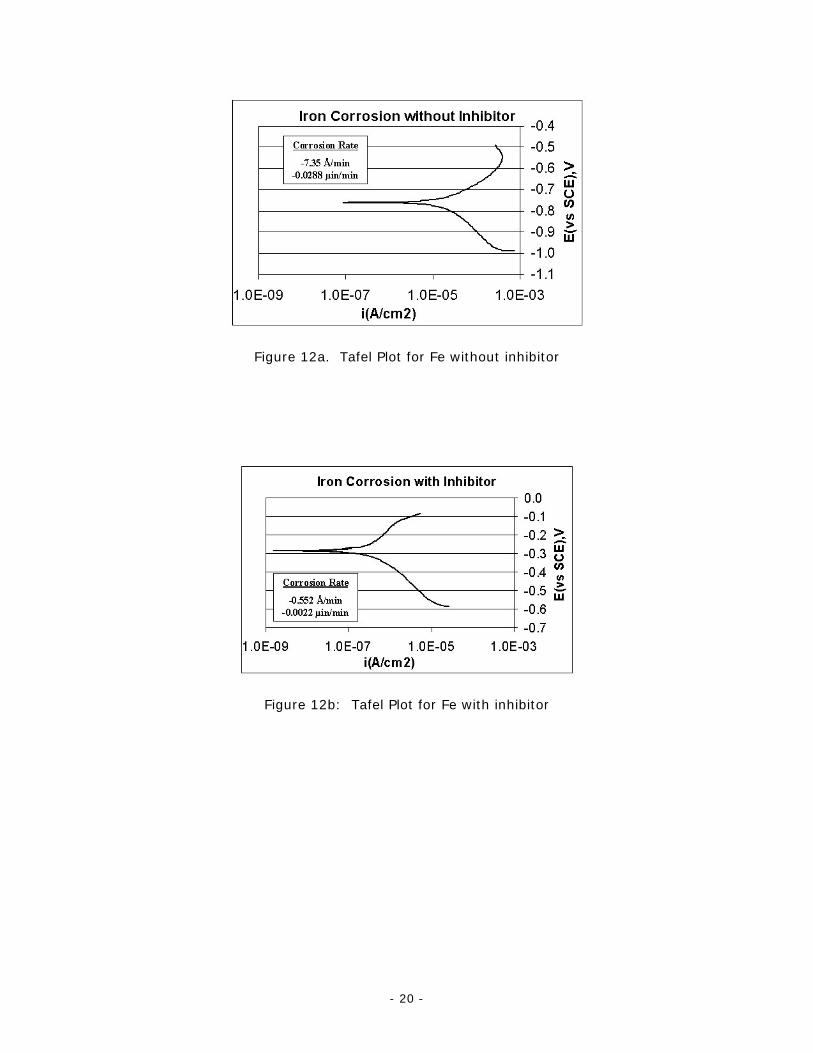
Figure 12a. Tafel Plot for Fe without inhibitor
Figure 12b: Tafel Plot for Fe with inhibitor
- 20 -
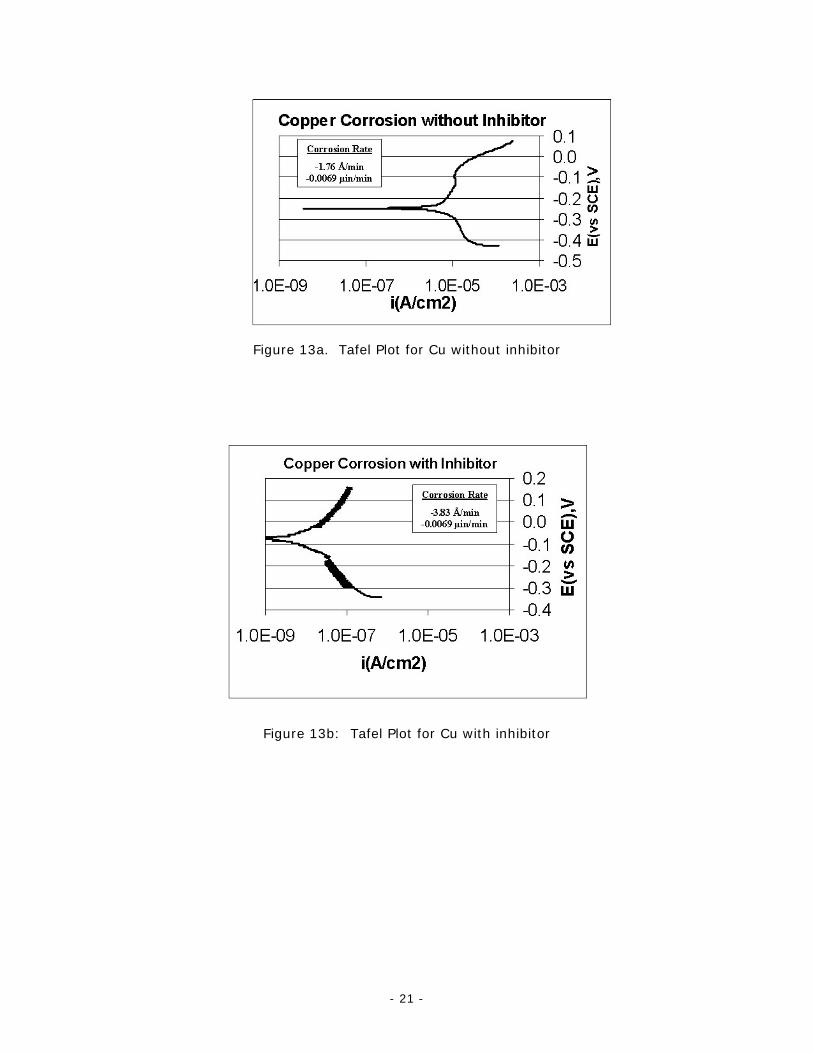
Figure 13a. Tafel Plot for Cu without inhibitor
Figure 13b: Tafel Plot for Cu with inhibitor
- 21 -
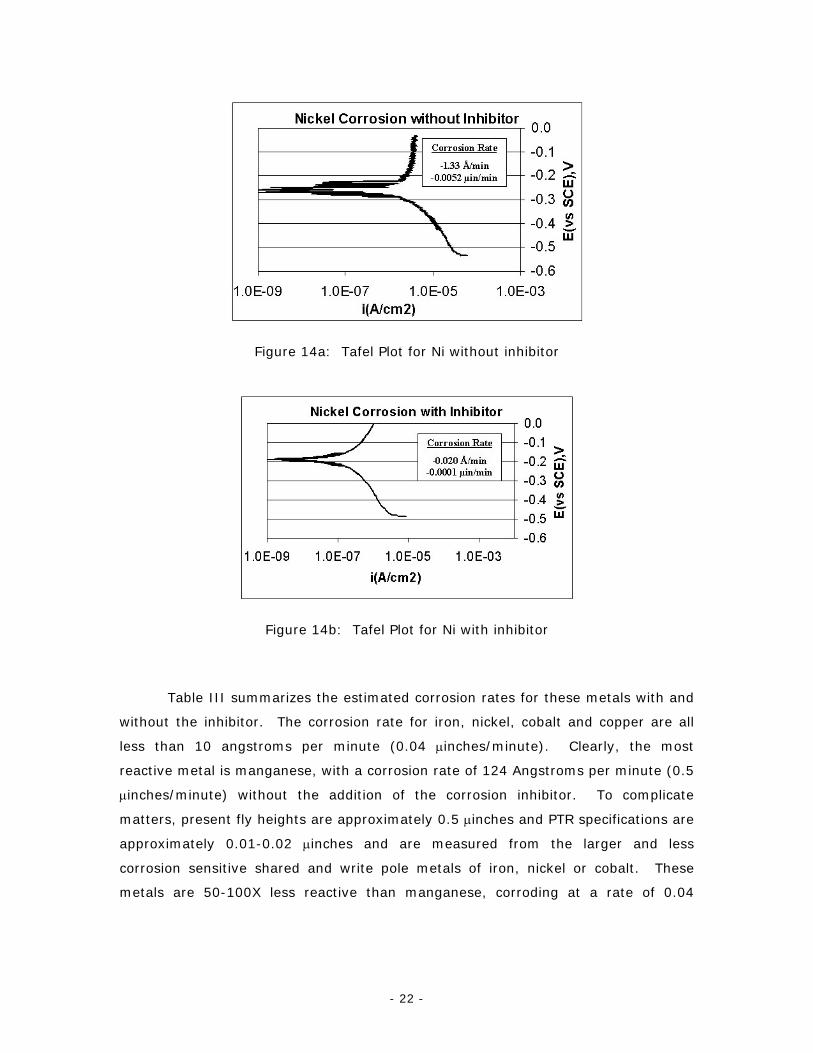
Figure 14a: Tafel Plot for Ni without inhibitor
Figure 14b: Tafel Plot for Ni with inhibitor
Table III summarizes the estimated corrosion rates for these metals with and
without the inhibitor. The corrosion rate for iron, nickel, cobalt and copper are all
less than 10 angstroms per minute (0.04 µinches/minute). Clearly, the most
reactive metal is manganese, with a corrosion rate of 124 Angstroms per minute (0.5
µinches/minute) without the addition of the corrosion inhibitor. To complicate
matters, present fly heights are approximately 0.5 µinches and PTR specifications are
approximately 0.01-0.02 µinches and are measured from the larger and less
corrosion sensitive shared and write pole metals of iron, nickel or cobalt. These
metals are 50-100X less reactive than manganese, corroding at a rate of 0.04
- 22 -
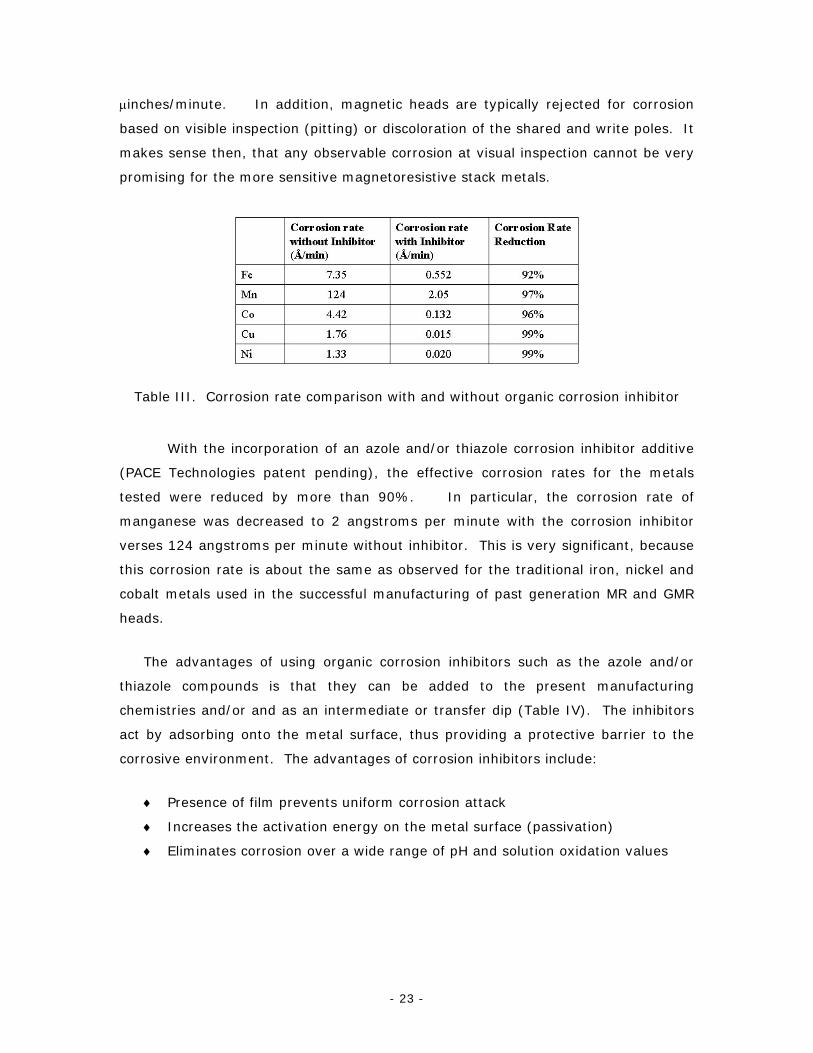
µinches/minute. In addition, magnetic heads are typically rejected for corrosion
based on visible inspection (pitting) or discoloration of the shared and write poles. It
makes sense then, that any observable corrosion at visual inspection cannot be very
promising for the more sensitive magnetoresistive stack metals.
Table III. Corrosion rate comparison with and without organic corrosion inhibitor
With the incorporation of an azole and/or thiazole corrosion inhibitor additive
(PACE Technologies patent pending), the effective corrosion rates for the metals
tested were reduced by more than 90%. In particular, the corrosion rate of
manganese was decreased to 2 angstroms per minute with the corrosion inhibitor
verses 124 angstroms per minute without inhibitor. This is very significant, because
this corrosion rate is about the same as observed for the traditional iron, nickel and
cobalt metals used in the successful manufacturing of past generation MR and GMR
heads.
The advantages of using organic corrosion inhibitors such as the azole and/or
thiazole compounds is that they can be added to the present manufacturing
chemistries and/or and as an intermediate or transfer dip (Table IV). The inhibitors
act by adsorbing onto the metal surface, thus providing a protective barrier to the
corrosive environment. The advantages of corrosion inhibitors include:
♦ Presence of film prevents uniform corrosion attack
♦ Increases the activation energy on the metal surface (passivation)
♦ Eliminates corrosion over a wide range of pH and solution oxidation values
- 23 -
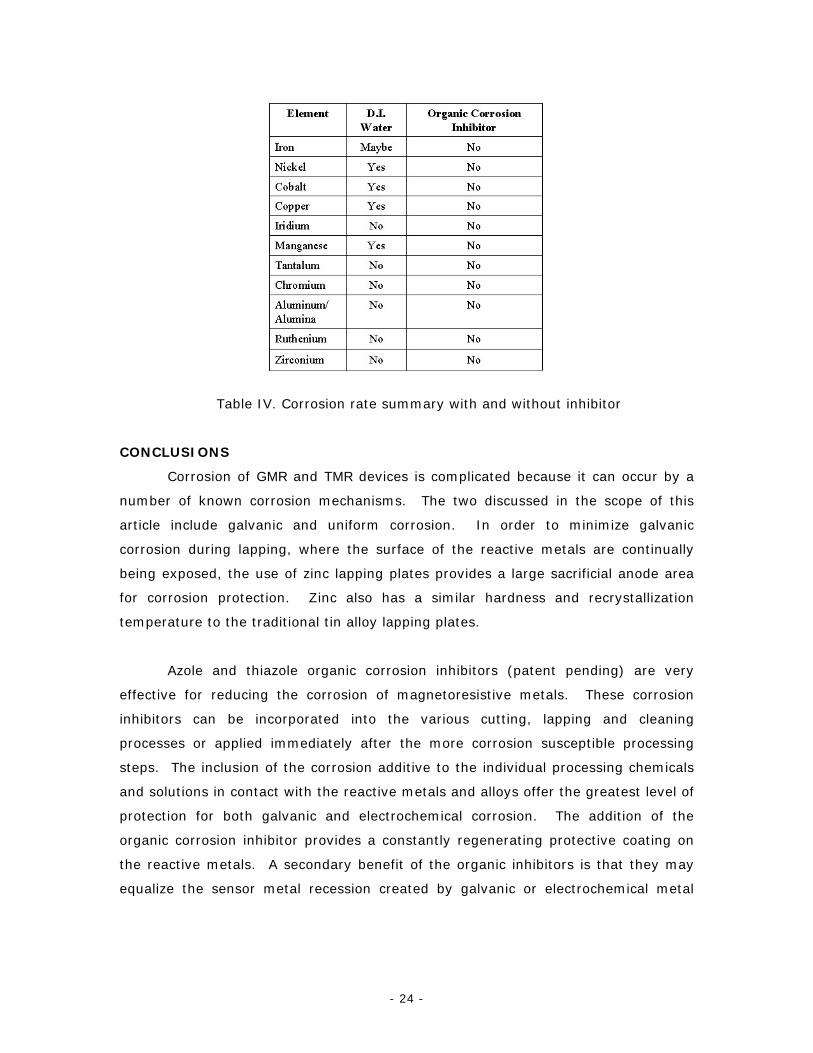
Table IV. Corrosion rate summary with and without inhibitor
CONCLUSIONS
Corrosion of GMR and TMR devices is complicated because it can occur by a
number of known corrosion mechanisms. The two discussed in the scope of this
article include galvanic and uniform corrosion. In order to minimize galvanic
corrosion during lapping, where the surface of the reactive metals are continually
being exposed, the use of zinc lapping plates provides a large sacrificial anode area
for corrosion protection. Zinc also has a similar hardness and recrystallization
temperature to the traditional tin alloy lapping plates.
Azole and thiazole organic corrosion inhibitors (patent pending) are very
effective for reducing the corrosion of magnetoresistive metals. These corrosion
inhibitors can be incorporated into the various cutting, lapping and cleaning
processes or applied immediately after the more corrosion susceptible processing
steps. The inclusion of the corrosion additive to the individual processing chemicals
and solutions in contact with the reactive metals and alloys offer the greatest level of
protection for both galvanic and electrochemical corrosion. The addition of the
organic corrosion inhibitor provides a constantly regenerating protective coating on
the reactive metals. A secondary benefit of the organic inhibitors is that they may
equalize the sensor metal recession created by galvanic or electrochemical metal
- 24 -
- 25 -
recession. Manganese is a good example of a metal where the corrosion rate can be
comparable or greater than the mechanical removal rate without the addition of a
corrosion inhibitor. Subsequently, the more reactive metals, such as manganese
would have at greater sensor recession and thus alter the magnetic head’s reading
sensitivity. Additionally, because of the inability to easily, accurately, and reliably
measure this recession, the addition of the corrosion inhibitor to the diamond
slurries, lubricants and cleaning solutions is certainly warranted. For added
protection, a dip, spray or immersion soak in the inhibitor after each process step
would provide an additional measure of corrosion protection for the in-between
processing steps.
ACKNOWLEDGEMENTS
The authors would like to thank Dr. Dallas Meyer, Paul Tyler and Ray Moudry from
Seagate Technology; Chakkrit Supavasuthi and Ittipon Cheowanish from Western
Digital, Thailand; Li Jian from LAFE Group Hong Kong; Chip Ragan from Veeco
Instruments; and Ashok Kumar Muthukumaran from the University of Arizona for
their contributions to this publication.
REFERENCES
1. “Advanced Spin-Valve GMR Head.” Hitoshi Kanai, Kenji Noma and Jognill
Hong, Fujitsu Sci. Tech. J, 37, 2 (December 2001), p. 174-182.
2. “Cell Shape and Patterning Considerations for Magnetic Random Access
Memory (MRAM) Fabrication.” Robert Ditizio, Paul Werbaneth and Jian-Gang
Zhu, Semiconductor Manufacturing Magazine, January 2004.
3. “Large Tunneling Magnetoresistance in GaMnAs/AlAs/GaMnAs Ferromagnetic
Semiconductor Tunnel Junctions.” Masaaki Tanaka and Yutaka Higo, RIKEN
Review, No. 33 (March 2001) pp 35-38.
4. “Advanced Sensor Fabrication Using Integrated Ion Beam Etch and Ion Beam
Deposition Processes.” John Londono, Kurt Williams, and Adrian
Devasahayam, Veeco technical note,
http://www.veeco.com/appnotes/AdvanSensorApplNotes12_00.pdf

5. “Zinc A-10 Lapping Plates.” PACE Technologies,
http://www.metallographic.com/adobe/zinc.pdf.
6. “Electrochemical Investigations during the Abrasion of Aluminum/Titanium
Thin-Film Stacks in Iodate-Based Slurry.” Yan Fang and Srini Raghavan
Journal of the Electrochemical Society, 151 (12) G878-881 (2004).
About the Authors:
Donald C. Zipperian, Ph.D. is the Chief Technical Officer for PACE Technologies. Dr. Zipperian’s background has been in the areas of precision surface finishing and electrochemistry. At PACE Technologies he overseas the lapping and surface finishing developments for the data storage and industrial precision surface finishing markets, which include the development of lapping plates, corrosion inhibitors, lapping and cutting lubricants, diamond slurries, etc. His previous industry experience includes first hand knowledge of the slider lapping process as manager of the Advanced Surface Finishing Group at Seagate Technology and as the Director of Data Storage Marketing for Veeco Instruments, where he was involved with the development of metrology tools for 100% slider inspection
following the lapping process.
([email protected]) (www.metallographic.com)
Dr. Srini Raghavan is a professor of materials science and engineering at the University of Arizona in Tucson. His research interests are in the areas of wet chemical processing in IC manufacturing, chemical mechanical planarization and corrosion and degradation of materials. He is a principal investigator in the NSF-SRC Center for Environmentally Benign Semiconductor Manufacturing at the University of Arizona. He teaches classes in Semiconductor Processing,
Applied Surface Chemistry and Corrosion and Degradation.
- 26 -
- 27 -
ARTICLE: Inertial Sensing for Hard Disk Drive Drop Protection, by Gregory J. Galvin, Ph.D., President and CEO, Kionix, Inc. HDD Protection — A Market Imperative
The worldwide growth rate for portable electronic products, which are more
and more likely to contain a hard disk drive (HDD), is impressive. Earlier this year,
the IT market research specialists at IDC reported that worldwide mobile phone
shipments totaled 194.3 million units in the fourth quarter of 2004; that 46.8 million
digital music players were sold in 2004, with a projection of 132 million in 2009; and
that worldwide PDA shipments totaled 3.4 million units in the first quarter of 2005.
USA Today, in an April 14 special report, indicated that nearly 49 million laptops
were sold worldwide in 2004, almost double the number sold in CY 2000.
These numbers alone add up to a compelling requirement for an active hard
disk drive drop-protection feature in highly portable, “always-on” products. Data
loss, and its resulting impact on productivity, adds another persuasive argument to
the critical need for HDD drop protection.
Objectives and Complexities
The objective in HDD drop detection is to reliably detect, by means of an
inertial sensor (accelerometer), an object in free fall and to signal the drive head to
park safely prior to impact. Very simply, free fall is the descending motion of an
object subject only to gravity.
Drop detection is a simple notion that involves a complicated detection
process, largely because portable electronic products are subject to complex motion
during use. For example, we want to signal free fall when a device is at risk and
tumbling toward the ground. But, we do not want to signal free fall when the device
is responding to typical-use events such as running, where low-g periods are long
enough to look like free-fall, and dancing, where high-g periods can reach 4.2g.
Thus, the process must be capable of distinguishing between typical-use motion and
a genuine fall, so as to not trigger a false positive. Consumers grow tired quickly of

- 28 -
a protection feature that disables a portable computer when the user adjusts its
tabletop position.
The process is further complicated by irregular real-life motions such as
tapping or shaking, the requirements for positioning the motion sensor, the
complexities associated with threshold detection techniques, and the changes in the
center of mass on products such as flip phones and laptops when open or closed.
The Physics of Free Fall
In a simple free fall event, since a = 1 g (9.8 m/s2) and initial velocity is 0 (v0
= 0), the equation of motion can be used to determine the position of an object at
any time after it is dropped.
Equation of Motion z = z0 + v0t + ½ at 2
If the initial height from the ground (z0) is known and the initial velocity (v0) is
zero, then the time it takes for an object to impact the ground is t = (2 z0/g)½.
Therefore, from a height of one meter, an object will take 0.45 seconds (450
milliseconds) to impact the ground.
Unfortunately, free fall is not always simple because hand-held devices rarely
fall without incurring a tumbling spin, thus complicating the physics. A spinning
object is subject to acceleration that can be significant in its centripetal and
centrifugal forces. Centripetal force is that which holds the object in the center of
the spin; centrifugal force is Newton’s “equal and opposite reaction,” displacing the
object from the center of the spin.
Accelerometers for Drop Detection
Silicon micromechanical technology has enabled the production of low-cost,
small form-factor accelerometers capable of detecting linear acceleration on one, two
or three axes. These devices are etched from single-crystal silicon and function on
the principle of differential capacitance. Essentially, it is a mass on a spring. The
mass is capable of motion relative to the substrate and moves in response to
acceleration. This movement results in a change of capacitance that is detected and
transformed into an electrical signal by an Application Specific Integrated Circuit
(ASIC).
An accelerometer at rest measures 1g of acceleration and an accelerometer in
simple free fall measures 0g of acceleration, no matter their orientation. Simple free
fall suggests a very simple drop detection algorithm: When total acceleration equals
0, the object is in free fall.
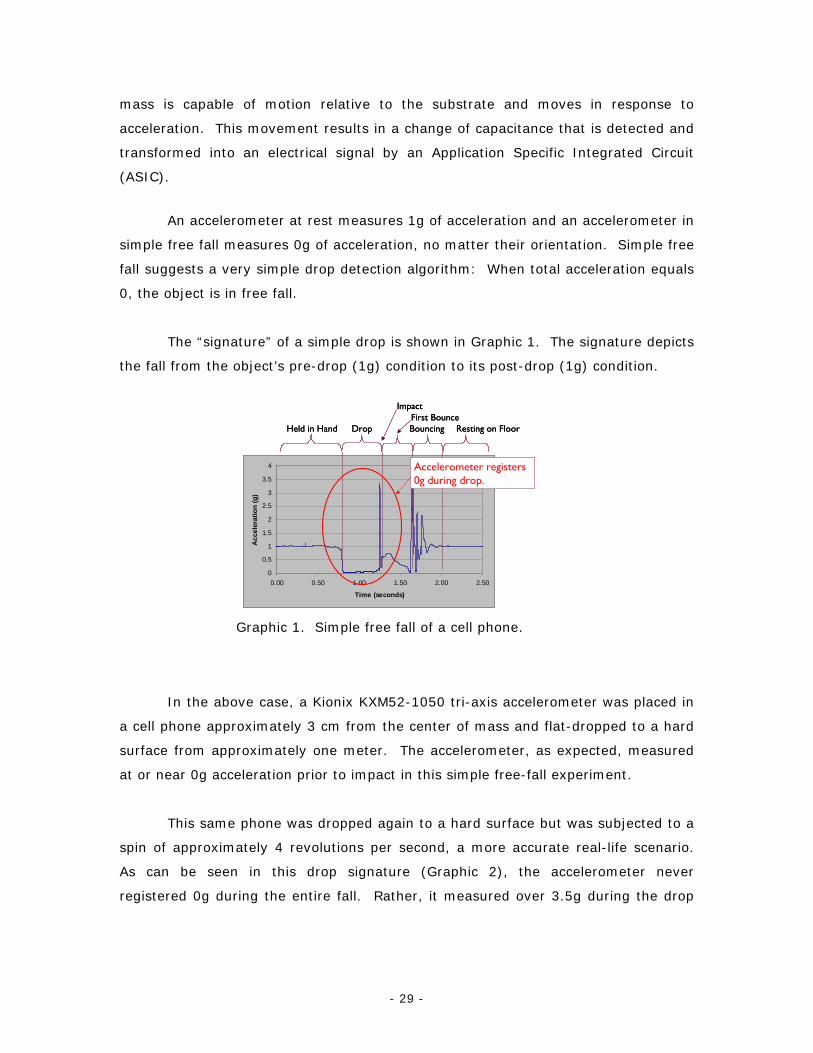
The “signature” of a simple drop is shown in Graphic 1. The signature depicts
the fall from the object’s pre-drop (1g) condition to its post-drop (1g) condition.
0
0.5
1
1.5
2
2.5
3
3.5
4
0.00 0.50 1.00 1.50 2.00 2.50
Time (seconds)
Acc
eler
atio
n (g
)
Impact
Held in Hand DropFirst BounceBouncing Resting on Floor
Accelerometer registers 0g during drop.
0
0.5
1
1.5
2
2.5
3
3.5
4
0.00 0.50 1.00 1.50 2.00 2.50
Time (seconds)
Acc
eler
atio
n (g
)
Impact
Held in Hand DropFirst BounceBouncing Resting on Floor
Accelerometer registers 0g during drop.
Graphic 1. Simple free fall of a cell phone.
In the above case, a Kionix KXM52-1050 tri-axis accelerometer was placed in
a cell phone approximately 3 cm from the center of mass and flat-dropped to a hard
surface from approximately one meter. The accelerometer, as expected, measured
at or near 0g acceleration prior to impact in this simple free-fall experiment.
This same phone was dropped again to a hard surface but was subjected to a
spin of approximately 4 revolutions per second, a more accurate real-life scenario.
As can be seen in this drop signature (Graphic 2), the accelerometer never
registered 0g during the entire fall. Rather, it measured over 3.5g during the drop
- 29 -
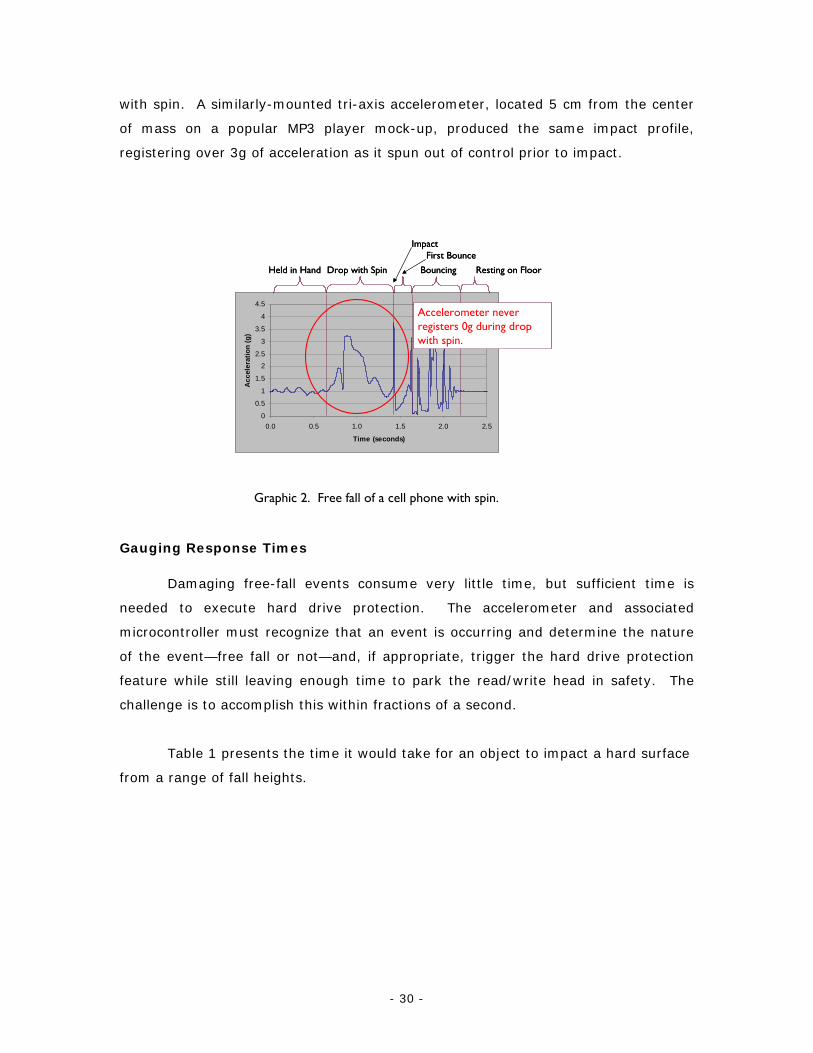
with spin. A similarly-mounted tri-axis accelerometer, located 5 cm from the center
of mass on a popular MP3 player mock-up, produced the same impact profile,
registering over 3g of acceleration as it spun out of control prior to impact.
0
0.5
1
1.5
2
2.5
3
3.5
4
4.5
0.0 0.5 1.0 1.5 2.0 2.5
Time (seconds)
Acc
eler
atio
n (g
)
Held in Hand Drop with Spin
First Bounce
Bouncing Resting on Floor
Impact
Accelerometer never registers 0g during drop with spin.
0
0.5
1
1.5
2
2.5
3
3.5
4
4.5
0.0 0.5 1.0 1.5 2.0 2.5
Time (seconds)
Acc
eler
atio
n (g
)
Held in Hand Drop with Spin
First Bounce
Bouncing Resting on Floor
Impact
Accelerometer never registers 0g during drop with spin.
Graphic 2. Free fall of a cell phone with spin. Gauging Response Times
Damaging free-fall events consume very little time, but sufficient time is
needed to execute hard drive protection. The accelerometer and associated
microcontroller must recognize that an event is occurring and determine the nature
of the event—free fall or not—and, if appropriate, trigger the hard drive protection
feature while still leaving enough time to park the read/write head in safety. The
challenge is to accomplish this within fractions of a second.
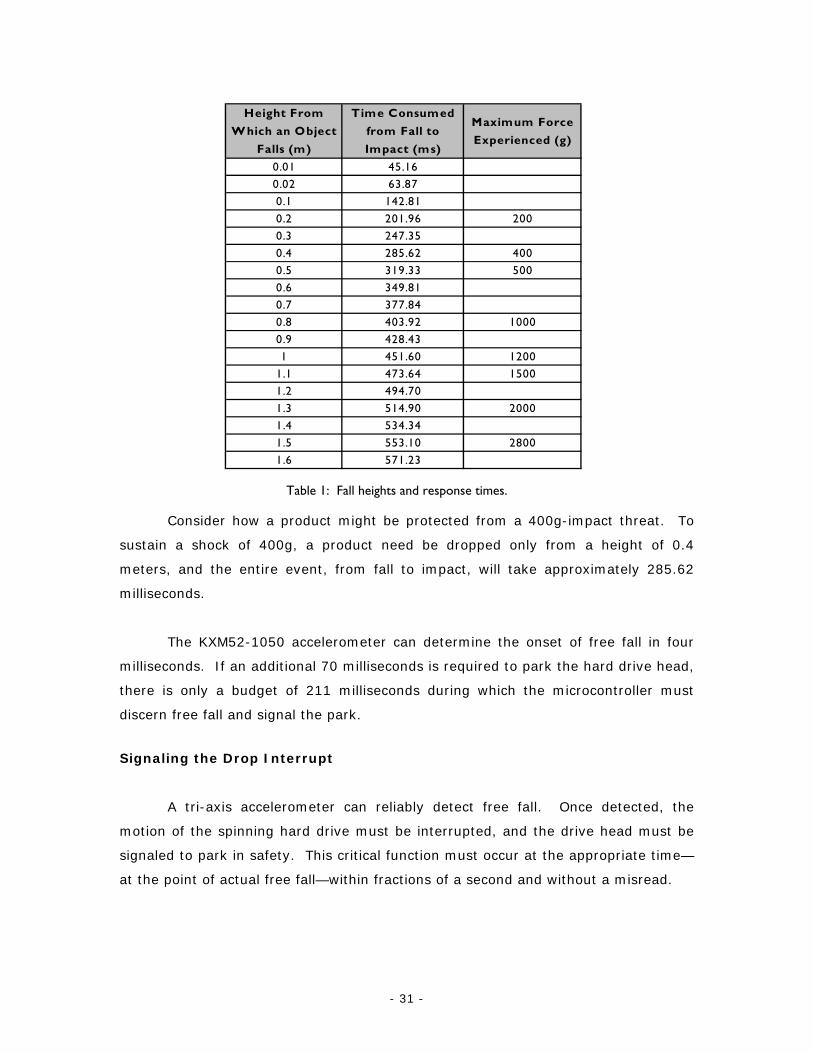
Table 1 presents the time it would take for an object to impact a hard surface
from a range of fall heights.
- 30 -
Height From W hich an Object
Falls (m)
Time Consumed from Fall to Impact (ms)
Maximum Force Experienced (g)
0.01 45.160.02 63.870.1 142.810.2 201.96 2000.3 247.350.4 285.62 4000.5 319.33 5000.6 349.810.7 377.840.8 403.92 10000.9 428.431 451.60 1200
1.1 473.64 15001.2 494.701.3 514.90 20001.4 534.341.5 553.10 28001.6 571.23
Table 1: Fall heights and response times.
Consider how a product might be protected from a 400g-impact threat. To
sustain a shock of 400g, a product need be dropped only from a height of 0.4
meters, and the entire event, from fall to impact, will take approximately 285.62
milliseconds.
The KXM52-1050 accelerometer can determine the onset of free fall in four
milliseconds. If an additional 70 milliseconds is required to park the hard drive head,
there is only a budget of 211 milliseconds during which the microcontroller must
discern free fall and signal the park.
Signaling the Drop Interrupt
A tri-axis accelerometer can reliably detect free fall. Once detected, the
motion of the spinning hard drive must be interrupted, and the drive head must be
signaled to park in safety. This critical function must occur at the appropriate time—
at the point of actual free fall—within fractions of a second and without a misread.
- 31 -
The following considerations are key to determining the correct timing for interrupt
and the choice of low-g or high-g thresholds for triggering the interrupt:
1. Maximum g-forces experienced by the object during typical use.
2. Minimum g-forces experienced by the object during typical use.
3. The length of time an object spends at these levels (dwell time).
4. The maximum allowable g-force on the object.
In other words, we need to determine the maximum and minimum g-force
points along with the length of time spent at these levels in order to determine the
appropriate point to signal a drop interrupt. The time spent above or below a certain
g-force level is the key to differentiating between a typical-use event and a tumbling
drop.
The simple free-fall detection algorithm—an object is in free fall when
acceleration on all three axes equals 0—works only if the object does not spin and/or
the accelerometer is placed at the center of mass. If this placement is not possible,
given the location of the hard drive in a particular product, more complex high-
g/low-g threshold algorithms are required to accurately detect free fall.
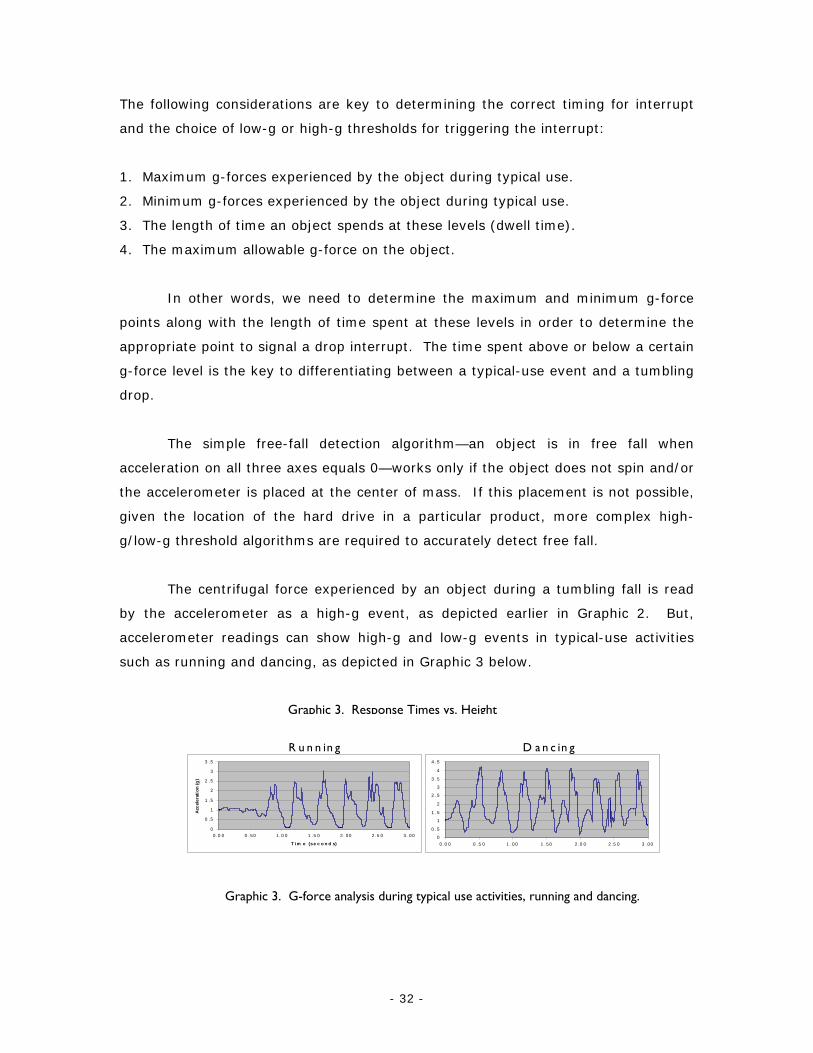
The centrifugal force experienced by an object during a tumbling fall is read
by the accelerometer as a high-g event, as depicted earlier in Graphic 2. But,
accelerometer readings can show high-g and low-g events in typical-use activities
such as running and dancing, as depicted in Graphic 3 below.
0
0 .5
1
1 .5
2
2 .5
3
3 .5
0 .0 0 0 . 50 1
Acc
eler
atio
n (g
)
Graphic 3.
Graphic 3. Response Times vs. Height
0
0 .5
1
1 .5
2
2 .5
3
3 .5
4
4 .5
0 . 0 0 0 .5 0 1 .00 1 .50 2 .0 0 2 .5 0 3 .00
D a n c in g
. 0 0 1 .5 0 2 . 00 2 . 5 0 3 .00
T im e (se c o n d s)
R u n n in g
G-force analysis during typical use activities, running and dancing.
- 32 -
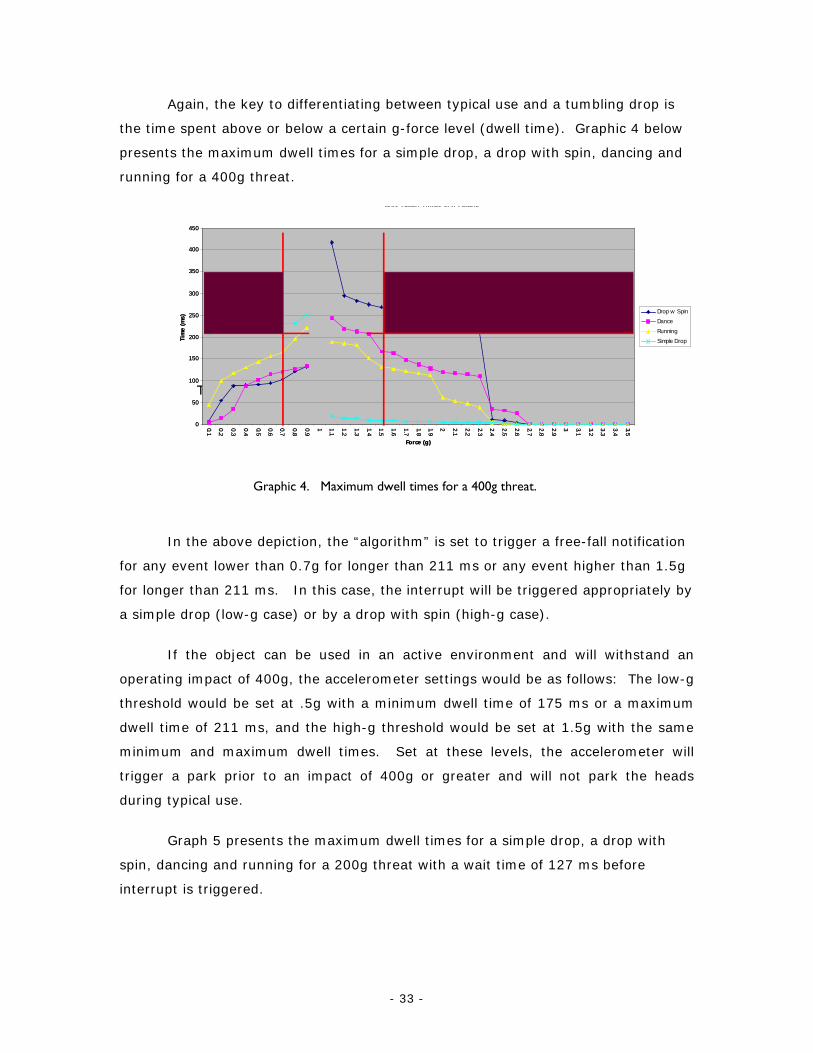
Again, the key to differentiating between typical use and a tumbling drop is
the time spent above or below a certain g-force level (dwell time). Graphic 4 below
presents the maximum dwell times for a simple drop, a drop with spin, dancing and
running for a 400g threat.
Table 4. G-Force analysis during typical use activities and tumbling drop.
Max Dwel l Times at g Leve ls
0
50
100
150
200
250
300
350
400
450
0.1
0.2
0.3
0.4
0.5
0.6
0.7
0.8
0.9
1 1.1
1.2
1.3
1.4
1.5
1.6
1.7
1.8
1.9
2 2.1
2.2
2.3
2.4
2.5
2.6
2.7
2.8
2.9
3 3.1
3.2
3.3
3.4
3.5
Force (g)
Tim
e (m
s)
Drop w Spin
Dance
Running
Simple Drop
Max Dwel l Times at g Leve ls
0
50
100
150
200
250
300
350
400
450
0.1
0.2
0.3
0.4
0.5
0.6
0.7
0.8
0.9
1 1.1
1.2
1.3
1.4
1.5
1.6
1.7
1.8
1.9
2 2.1
2.2
2.3
2.4
2.5
2.6
2.7
2.8
2.9
3 3.1
3.2
3.3
3.4
3.5
Force (g)
Tim
e (m
s)
Drop w Spin
Dance
Running
Simple Drop
.
In the abov
for any event lower
for longer than 211
a simple drop (low-
If the objec
operating impact o
threshold would be
dwell time of 211
minimum and max
trigger a park prio
during typical use.
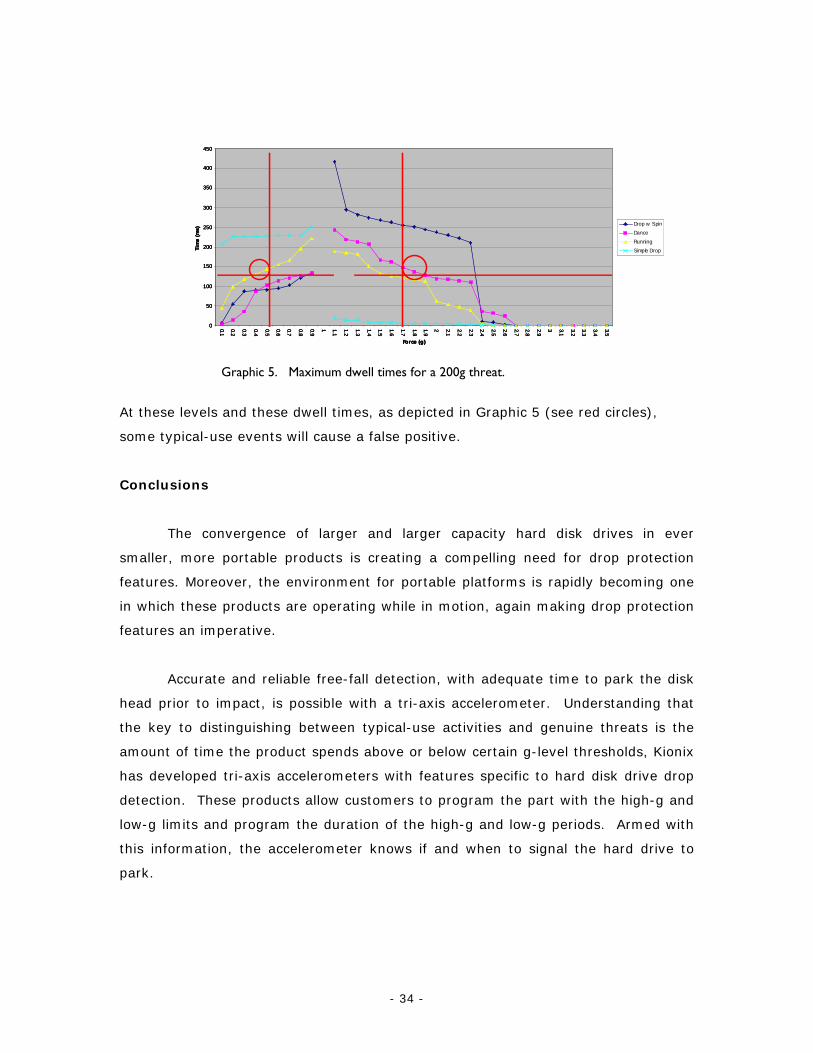
Graph 5 pre
spin, dancing and r
interrupt is triggere
Graphic 4. Maximum dwell times for a 400g threat
e depiction, the “algorithm” is set to trigger a free-fall notification
than 0.7g for longer than 211 ms or any event higher than 1.5g
ms. In this case, the interrupt will be triggered appropriately by
g case) or by a drop with spin (high-g case).
t can be used in an active environment and will withstand an
f 400g, the accelerometer settings would be as follows: The low-g
set at .5g with a minimum dwell time of 175 ms or a maximum
ms, and the high-g threshold would be set at 1.5g with the same
imum dwell times. Set at these levels, the accelerometer will
r to an impact of 400g or greater and will not park the heads
sents the maximum dwell times for a simple drop, a drop with
unning for a 200g threat with a wait time of 127 ms before
d.
- 33 -
0
50
100
150
200
250
300
350
400
450
0.1
0.2
0.3
0.4
0.5
0.6
0.7
0.8
0.9
1 1.1
1.2
1.3
1.4
1.5
1.6
1.7
1.8
1.9
2 2.1
2.2
2.3
2.4
2.5
2.6
2.7
2.8
2.9
3 3.1
3.2
3.3
3.4
3.5
Force (g)
Tim
e (m
s)
Drop w SpinDance
Running
Simple Drop
0
50
100
150
200
250
300
350
400
450
0.1
0.2
0.3
0.4
0.5
0.6
0.7
0.8
0.9
1 1.1
1.2
1.3
1.4
1.5
1.6
1.7
1.8
1.9
2 2.1
2.2
2.3
2.4
2.5
2.6
2.7
2.8
2.9
3 3.1
3.2
3.3
3.4
3.5
Force (g)
Tim
e (m
s)
Drop w SpinDance
Running
Simple Drop
0
50
100
150
200
250
300
350
400
450
0.1
0.2
0.3
0.4
0.5
0.6
0.7
0.8
0.9
1 1.1
1.2
1.3
1.4
1.5
1.6
1.7
1.8
1.9
2 2.1
2.2
2.3
2.4
2.5
2.6
2.7
2.8
2.9
3 3.1
3.2
3.3
3.4
3.5
Force (g)
Tim
e (m
s)
Drop w SpinDance
Running
Simple Drop
Graphic 5. Maximum dwell times for a 200g threat. At these levels and these dwell times, as depicted in Graphic 5 (see red circles),
some typical-use events will cause a false positive.
Conclusions
The convergence of larger and larger capacity hard disk drives in ever
smaller, more portable products is creating a compelling need for drop protection
features. Moreover, the environment for portable platforms is rapidly becoming one
in which these products are operating while in motion, again making drop protection
features an imperative.
Accurate and reliable free-fall detection, with adequate time to park the disk
head prior to impact, is possible with a tri-axis accelerometer. Understanding that
the key to distinguishing between typical-use activities and genuine threats is the
amount of time the product spends above or below certain g-level thresholds, Kionix
has developed tri-axis accelerometers with features specific to hard disk drive drop
detection. These products allow customers to program the part with the high-g and
low-g limits and program the duration of the high-g and low-g periods. Armed with
this information, the accelerometer knows if and when to signal the hard drive to
park.
- 34 -
- 35 -
About the Author:
Dr. Galvin founded Kionix in 1993 to commercialize a novel micromechanical
technology pioneered by researchers at Cornell University. From 1993 to 2000,
Kionix grew from its two founders to over 40 employees and developed products in
inertial sensors, microfluidics, data storage, micro-relays and micro-optics. Late in
2000 Kionix was acquired by Calient Networks of San Jose, CA and renamed Calient
Optical Components. Just prior to the acquisition, a new company was spun out to
then Kionix shareholders to pursue inertial sensor, microfluidics and data storage
markets. This company took back the name Kionix post acquisition. From the
acquisition until June 2002, Dr. Galvin served as president and CEO of Calient Optical
Components and on the boards of both Calient Networks and the new Kionix. In July
2002, he returned full time to Kionix as President and CEO.
Dr. Galvin has a B.S. from the California Institute of Technology in Electrical
Engineering and a Ph.D. in Materials Science from Cornell University (1984). Dr.
Galvin served for over five years as the Deputy Director of the Cornell
Nanofabrication Facility (CNF) in which the Cornell micromechanical research was
conducted. In addition to his doctorate, Dr. Galvin has an M.B.A. degree from Cornell
(1993). Prior to founding Kionix in 1993 he was employed by Cornell University in
the position of Director of Corporate Research Relations, focusing on transferring
technology from the university to industry. Dr. Galvin's graduate research was in the
areas of thermodynamics of silicon under ultrafast melting, ion beam analysis, and
thin film technologies. He has published over 20 technical papers and holds 15
patents. He is a member of several scientific societies and the American Management
Association. Dr. Galvin is a founding member, and former chairman, of the Finger
Lakes Entrepreneurs Forum. He is a member of the Cornell University Council, the
Advisory Council of the Cornell Veterinary College, a Director of the Boyce Thompson
Institute for Plant Research, a Director of the Tompkins County Area Development
Board, and Director of the El Portal de Belén Foundation.
Contact:
Kionix, Inc.
36 Thornwood Drive, Ithaca, New York 14850 USA 607-257-1080
www.kionix.com [email protected]
Upcoming IDEMA Events USA Region DISKCON USA 2005, September 19-22: Santa Clara, CA
Charity for Youth Golf Tournament, September 19 Conference and Tradeshow, September 20-21 Keynote Dinner featuring Mike Wingert, Maxtor President & COO, Sept. 20 Global Standards Meetings, Sept. 22
Asia Pacific Region IDEMA Golf Event, Bangkok, Thailand, July 11 IDEMA Breakfast Meeting, Singapore, July18 IDEMA Asia Pacific Members Night, Bangkok, Thailand. Sept. 26 IDEMA Traveling Symposium, China: October 3-5 Japan Region Quarterly Seminar, Tokyo: October 21 - 36 -