q119 lender update - webassets.infor.com · consulting services and other fees 209.6 207.6 2.0 1.0%...
TRANSCRIPT

1Copyright © 2016. Infor. All Rights Reserved. www.infor.comInfor Confidential
Q119 Lender UpdateSeptember 12, 2018
2Copyright © 2016. Infor. All Rights Reserved. www.infor.comInfor Confidential
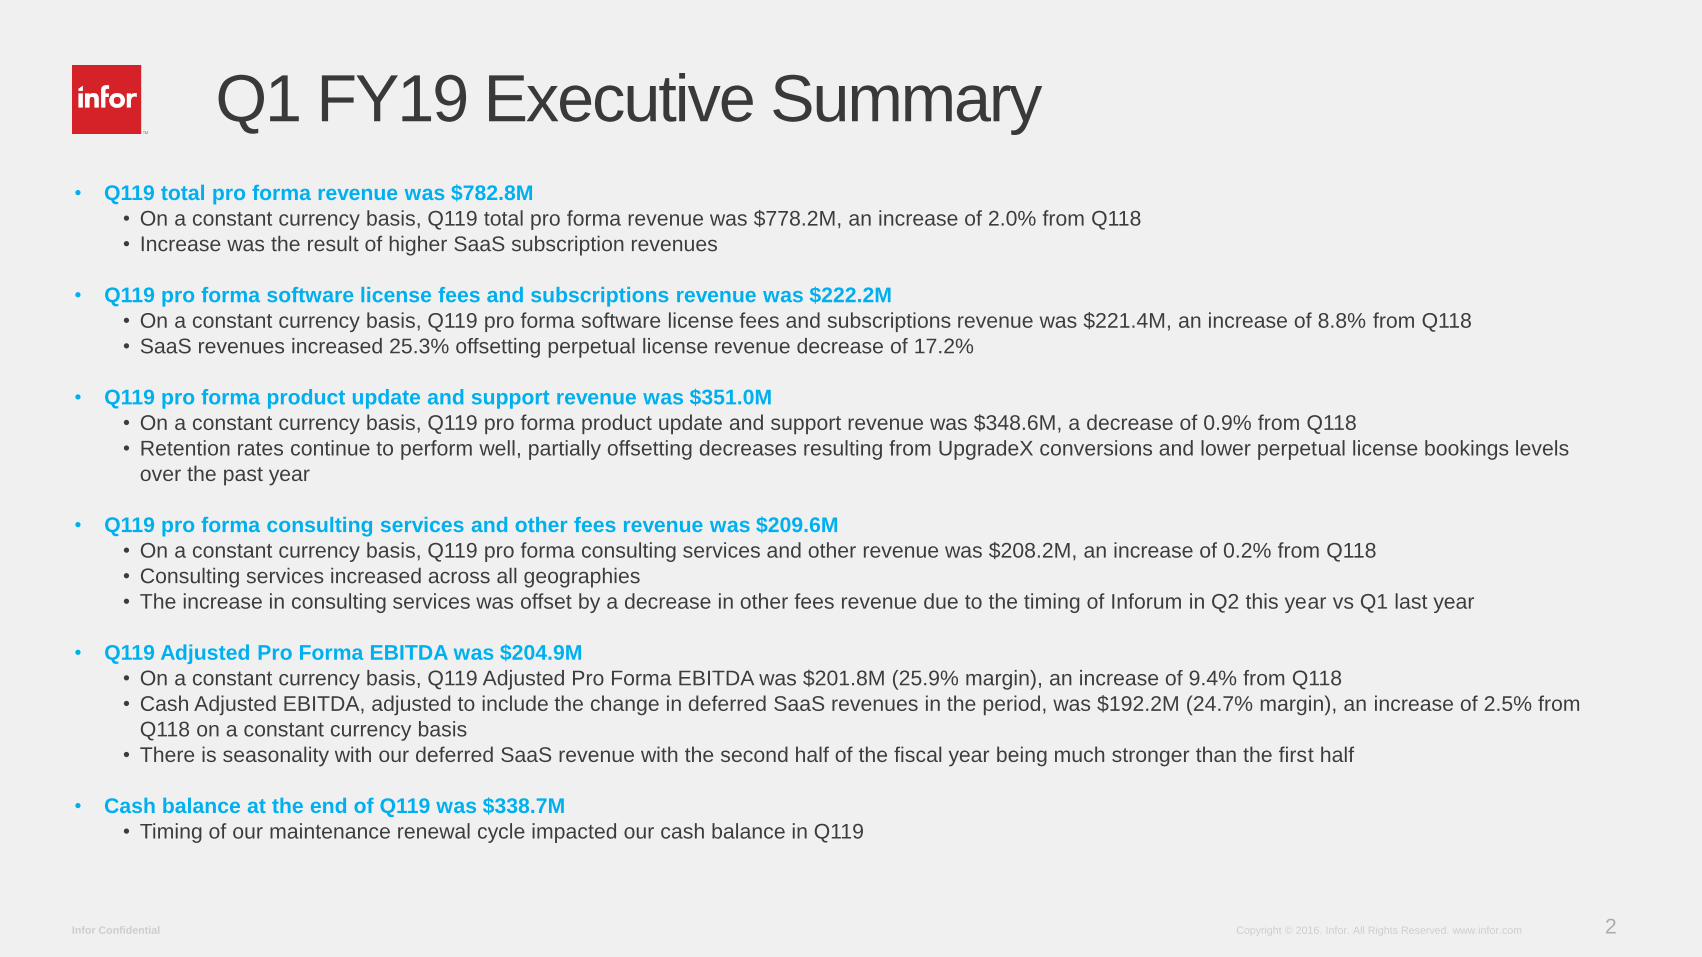
Q1 FY19 Executive Summary
• Q119 total pro forma revenue was $782.8M
• On a constant currency basis, Q119 total pro forma revenue was $778.2M, an increase of 2.0% from Q118
• Increase was the result of higher SaaS subscription revenues
• Q119 pro forma software license fees and subscriptions revenue was $222.2M
• On a constant currency basis, Q119 pro forma software license fees and subscriptions revenue was $221.4M, an increase of 8.8% from Q118
• SaaS revenues increased 25.3% offsetting perpetual license revenue decrease of 17.2%
• Q119 pro forma product update and support revenue was $351.0M
• On a constant currency basis, Q119 pro forma product update and support revenue was $348.6M, a decrease of 0.9% from Q118
• Retention rates continue to perform well, partially offsetting decreases resulting from UpgradeX conversions and lower perpetual license bookings levels
over the past year
• Q119 pro forma consulting services and other fees revenue was $209.6M
• On a constant currency basis, Q119 pro forma consulting services and other revenue was $208.2M, an increase of 0.2% from Q118
• Consulting services increased across all geographies
• The increase in consulting services was offset by a decrease in other fees revenue due to the timing of Inforum in Q2 this year vs Q1 last year
• Q119 Adjusted Pro Forma EBITDA was $204.9M
• On a constant currency basis, Q119 Adjusted Pro Forma EBITDA was $201.8M (25.9% margin), an increase of 9.4% from Q118
• Cash Adjusted EBITDA, adjusted to include the change in deferred SaaS revenues in the period, was $192.2M (24.7% margin), an increase of 2.5% from
Q118 on a constant currency basis
• There is seasonality with our deferred SaaS revenue with the second half of the fiscal year being much stronger than the first half
• Cash balance at the end of Q119 was $338.7M
• Timing of our maintenance renewal cycle impacted our cash balance in Q119
3Copyright © 2016. Infor. All Rights Reserved. www.infor.comInfor Confidential
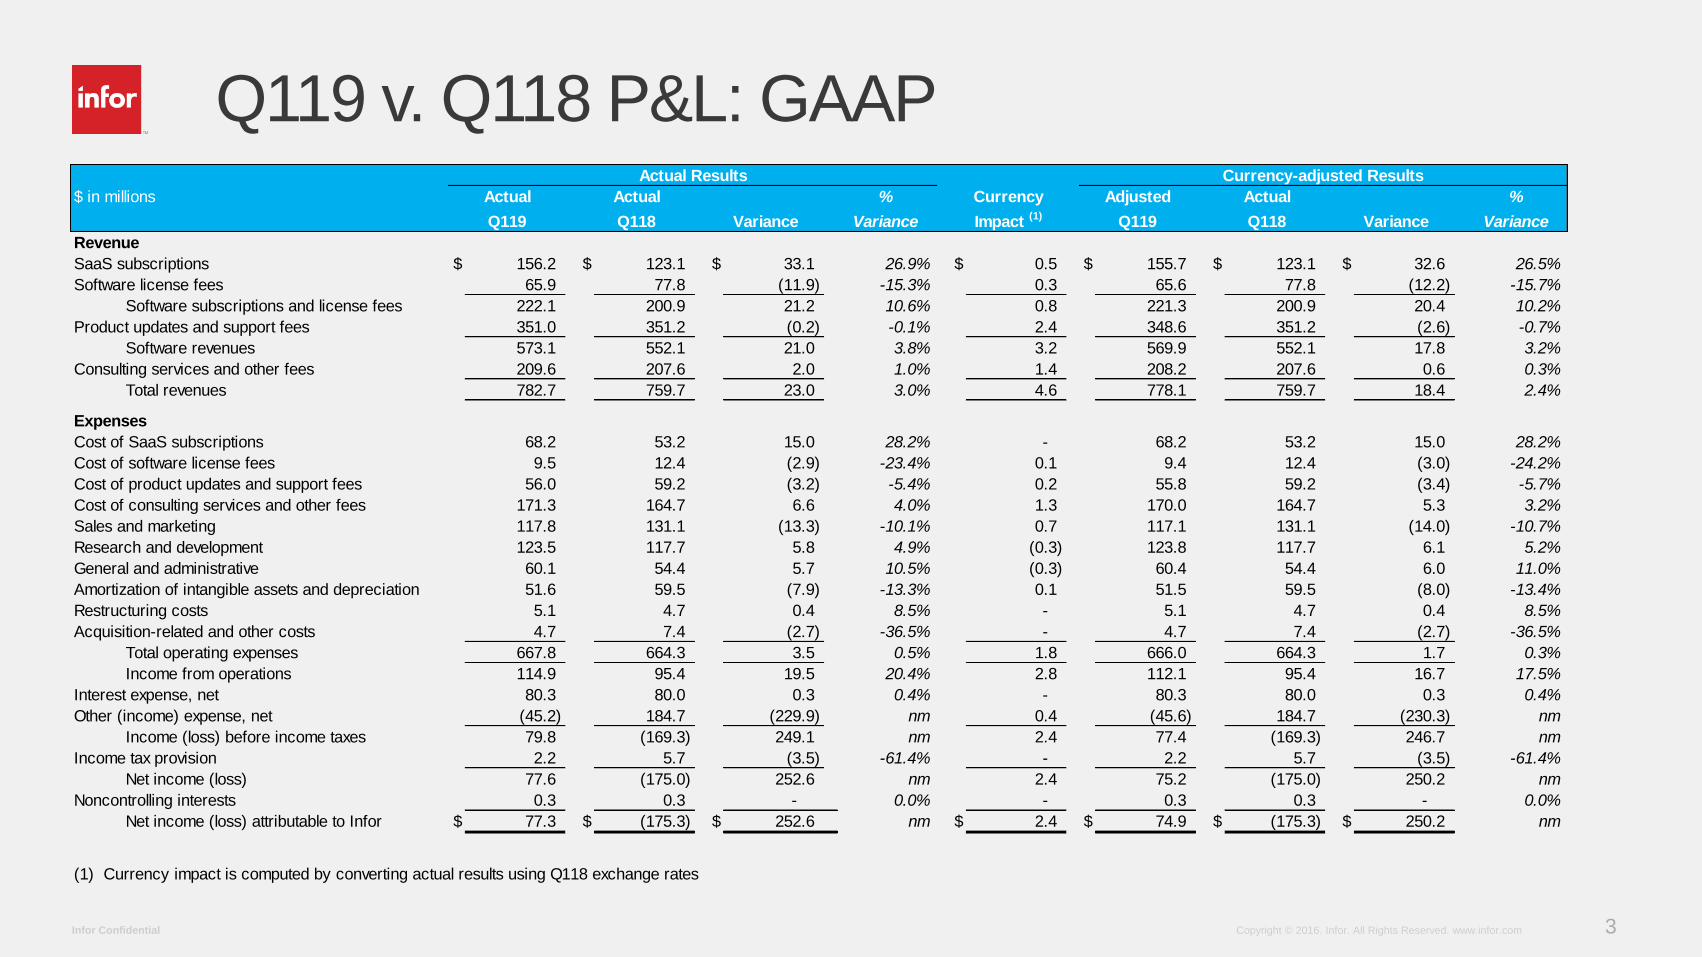
Q119 v. Q118 P&L: GAAP
$ in millions % %
Variance Variance
Revenue
SaaS subscriptions $ 156.2 $ 123.1 $ 33.1 26.9% $ 0.5 $ 155.7 $ 123.1 $ 32.6 26.5%
Software license fees 65.9 77.8 (11.9) -15.3% 0.3 65.6 77.8 (12.2) -15.7%
Software subscriptions and license fees 222.1 200.9 21.2 10.6% 0.8 221.3 200.9 20.4 10.2%
Product updates and support fees 351.0 351.2 (0.2) -0.1% 2.4 348.6 351.2 (2.6) -0.7%
Software revenues 573.1 552.1 21.0 3.8% 3.2 569.9 552.1 17.8 3.2%
Consulting services and other fees 209.6 207.6 2.0 1.0% 1.4 208.2 207.6 0.6 0.3%
Total revenues 782.7 759.7 23.0 3.0% 4.6 778.1 759.7 18.4 2.4%
Expenses
Cost of SaaS subscriptions 68.2 53.2 15.0 28.2% - 68.2 53.2 15.0 28.2%
Cost of software license fees 9.5 12.4 (2.9) -23.4% 0.1 9.4 12.4 (3.0) -24.2%
Cost of product updates and support fees 56.0 59.2 (3.2) -5.4% 0.2 55.8 59.2 (3.4) -5.7%
Cost of consulting services and other fees 171.3 164.7 6.6 4.0% 1.3 170.0 164.7 5.3 3.2%
Sales and marketing 117.8 131.1 (13.3) -10.1% 0.7 117.1 131.1 (14.0) -10.7%
Research and development 123.5 117.7 5.8 4.9% (0.3) 123.8 117.7 6.1 5.2%
General and administrative 60.1 54.4 5.7 10.5% (0.3) 60.4 54.4 6.0 11.0%
Amortization of intangible assets and depreciation 51.6 59.5 (7.9) -13.3% 0.1 51.5 59.5 (8.0) -13.4%
Restructuring costs 5.1 4.7 0.4 8.5% - 5.1 4.7 0.4 8.5%
Acquisition-related and other costs 4.7 7.4 (2.7) -36.5% - 4.7 7.4 (2.7) -36.5%
Total operating expenses 667.8 664.3 3.5 0.5% 1.8 666.0 664.3 1.7 0.3%
Income from operations 114.9 95.4 19.5 20.4% 2.8 112.1 95.4 16.7 17.5%
Interest expense, net 80.3 80.0 0.3 0.4% - 80.3 80.0 0.3 0.4%
Other (income) expense, net (45.2) 184.7 (229.9) nm 0.4 (45.6) 184.7 (230.3) nm
Income (loss) before income taxes 79.8 (169.3) 249.1 nm 2.4 77.4 (169.3) 246.7 nm
Income tax provision 2.2 5.7 (3.5) -61.4% - 2.2 5.7 (3.5) -61.4%
Net income (loss) 77.6 (175.0) 252.6 nm 2.4 75.2 (175.0) 250.2 nm
Noncontrolling interests 0.3 0.3 - 0.0% - 0.3 0.3 - 0.0%
Net income (loss) attributable to Infor $ 77.3 $ (175.3) $ 252.6 nm $ 2.4 $ 74.9 $ (175.3) $ 250.2 nm
(1) Currency impact is computed by converting actual results using Q118 exchange rates
Actual Results Currency-adjusted Results
Actual Actual Currency Adjusted Actual
Q119 Q118 VarianceQ119 Q118 Variance Impact (1)
4Copyright © 2016. Infor. All Rights Reserved. www.infor.comInfor Confidential
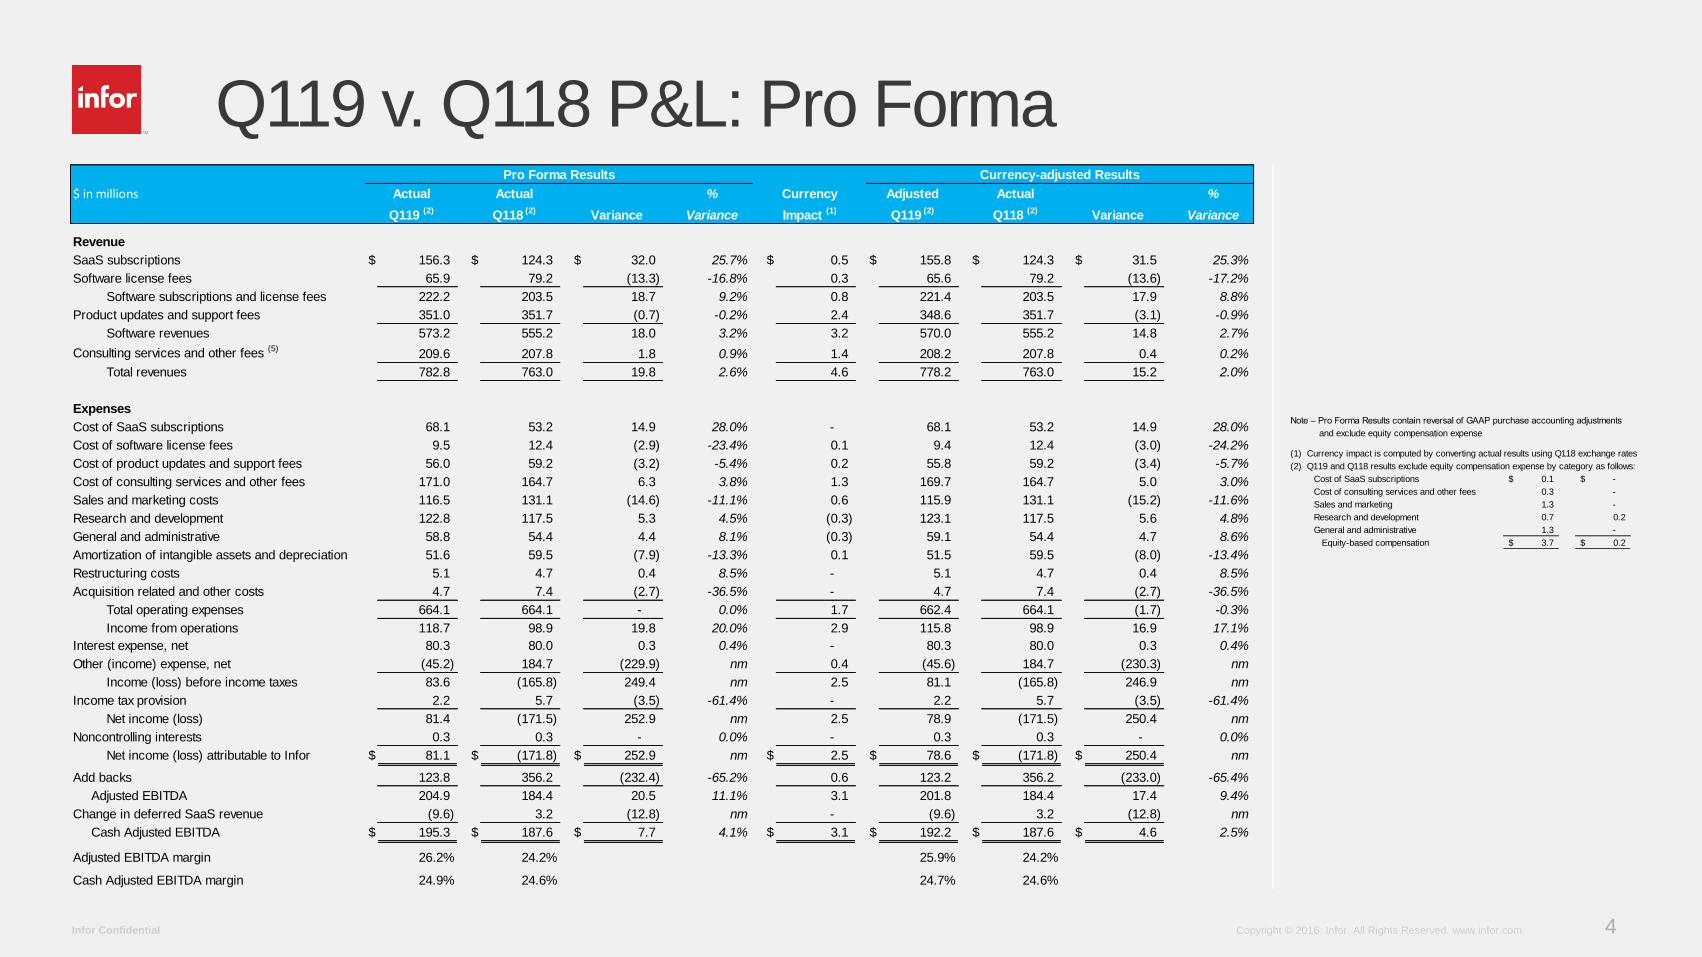
Q119 v. Q118 P&L: Pro Forma$ in millions % %
Variance Variance
Revenue
SaaS subscriptions $ 156.3 $ 124.3 $ 32.0 25.7% $ 0.5 $ 155.8 $ 124.3 $ 31.5 25.3%
Software license fees 65.9 79.2 (13.3) -16.8% 0.3 65.6 79.2 (13.6) -17.2%
Software subscriptions and license fees 222.2 203.5 18.7 9.2% 0.8 221.4 203.5 17.9 8.8%
Product updates and support fees 351.0 351.7 (0.7) -0.2% 2.4 348.6 351.7 (3.1) -0.9%
Software revenues 573.2 555.2 18.0 3.2% 3.2 570.0 555.2 14.8 2.7%
Consulting services and other fees (5)
209.6 207.8 1.8 0.9% 1.4 208.2 207.8 0.4 0.2%
Total revenues 782.8 763.0 19.8 2.6% 4.6 778.2 763.0 15.2 2.0%
Expenses
Cost of SaaS subscriptions 68.1 53.2 14.9 28.0% - 68.1 53.2 14.9 28.0%
Cost of software license fees 9.5 12.4 (2.9) -23.4% 0.1 9.4 12.4 (3.0) -24.2%
Cost of product updates and support fees 56.0 59.2 (3.2) -5.4% 0.2 55.8 59.2 (3.4) -5.7%
Cost of consulting services and other fees 171.0 164.7 6.3 3.8% 1.3 169.7 164.7 5.0 3.0%
Sales and marketing costs 116.5 131.1 (14.6) -11.1% 0.6 115.9 131.1 (15.2) -11.6%
Research and development 122.8 117.5 5.3 4.5% (0.3) 123.1 117.5 5.6 4.8%
General and administrative 58.8 54.4 4.4 8.1% (0.3) 59.1 54.4 4.7 8.6%
Amortization of intangible assets and depreciation 51.6 59.5 (7.9) -13.3% 0.1 51.5 59.5 (8.0) -13.4%
Restructuring costs 5.1 4.7 0.4 8.5% - 5.1 4.7 0.4 8.5%
Acquisition related and other costs 4.7 7.4 (2.7) -36.5% - 4.7 7.4 (2.7) -36.5%
Total operating expenses 664.1 664.1 - 0.0% 1.7 662.4 664.1 (1.7) -0.3%
Income from operations 118.7 98.9 19.8 20.0% 2.9 115.8 98.9 16.9 17.1%
Interest expense, net 80.3 80.0 0.3 0.4% - 80.3 80.0 0.3 0.4%
Other (income) expense, net (45.2) 184.7 (229.9) nm 0.4 (45.6) 184.7 (230.3) nm
Income (loss) before income taxes 83.6 (165.8) 249.4 nm 2.5 81.1 (165.8) 246.9 nm
Income tax provision 2.2 5.7 (3.5) -61.4% - 2.2 5.7 (3.5) -61.4%
Net income (loss) 81.4 (171.5) 252.9 nm 2.5 78.9 (171.5) 250.4 nm
Noncontrolling interests 0.3 0.3 - 0.0% - 0.3 0.3 - 0.0%
Net income (loss) attributable to Infor $ 81.1 $ (171.8) $ 252.9 nm $ 2.5 $ 78.6 $ (171.8) $ 250.4 nm#DIV/0!
Add backs 123.8 356.2 (232.4) -65.2% 0.6 123.2 356.2 (233.0) -65.4%
Adjusted EBITDA 204.9 184.4 20.5 11.1% 3.1 201.8 184.4 17.4 9.4%
Change in deferred SaaS revenue (9.6) 3.2 (12.8) nm - (9.6) 3.2 (12.8) nm
Cash Adjusted EBITDA $ 195.3 $ 187.6 $ 7.7 4.1% $ 3.1 $ 192.2 $ 187.6 $ 4.6 2.5%
Adjusted EBITDA margin 26.2% 24.2% 25.9% 24.2%
Cash Adjusted EBITDA margin 24.9% 24.6% 24.7% 24.6%
Q119 (2)
Q118 (2)
Variance
Currency-adjusted Results
Actual Actual Currency Adjusted Actual
Q119 (2)
Q118 (2)
Variance Impact (1)
Pro Forma Results
Note – Pro Forma Results contain reversal of GAAP purchase accounting adjustments
and exclude equity compensation expense
(1) Currency impact is computed by converting actual results using Q118 exchange rates
(2) Q119 and Q118 results exclude equity compensation expense by category as follows:
Cost of SaaS subscriptions 0.1$ -$
Cost of consulting services and other fees 0.3 -
Sales and marketing 1.3 -
Research and development 0.7 0.2
General and administrative 1.3 -
Equity-based compensation 3.7$ 0.2$
5Copyright © 2016. Infor. All Rights Reserved. www.infor.comInfor Confidential
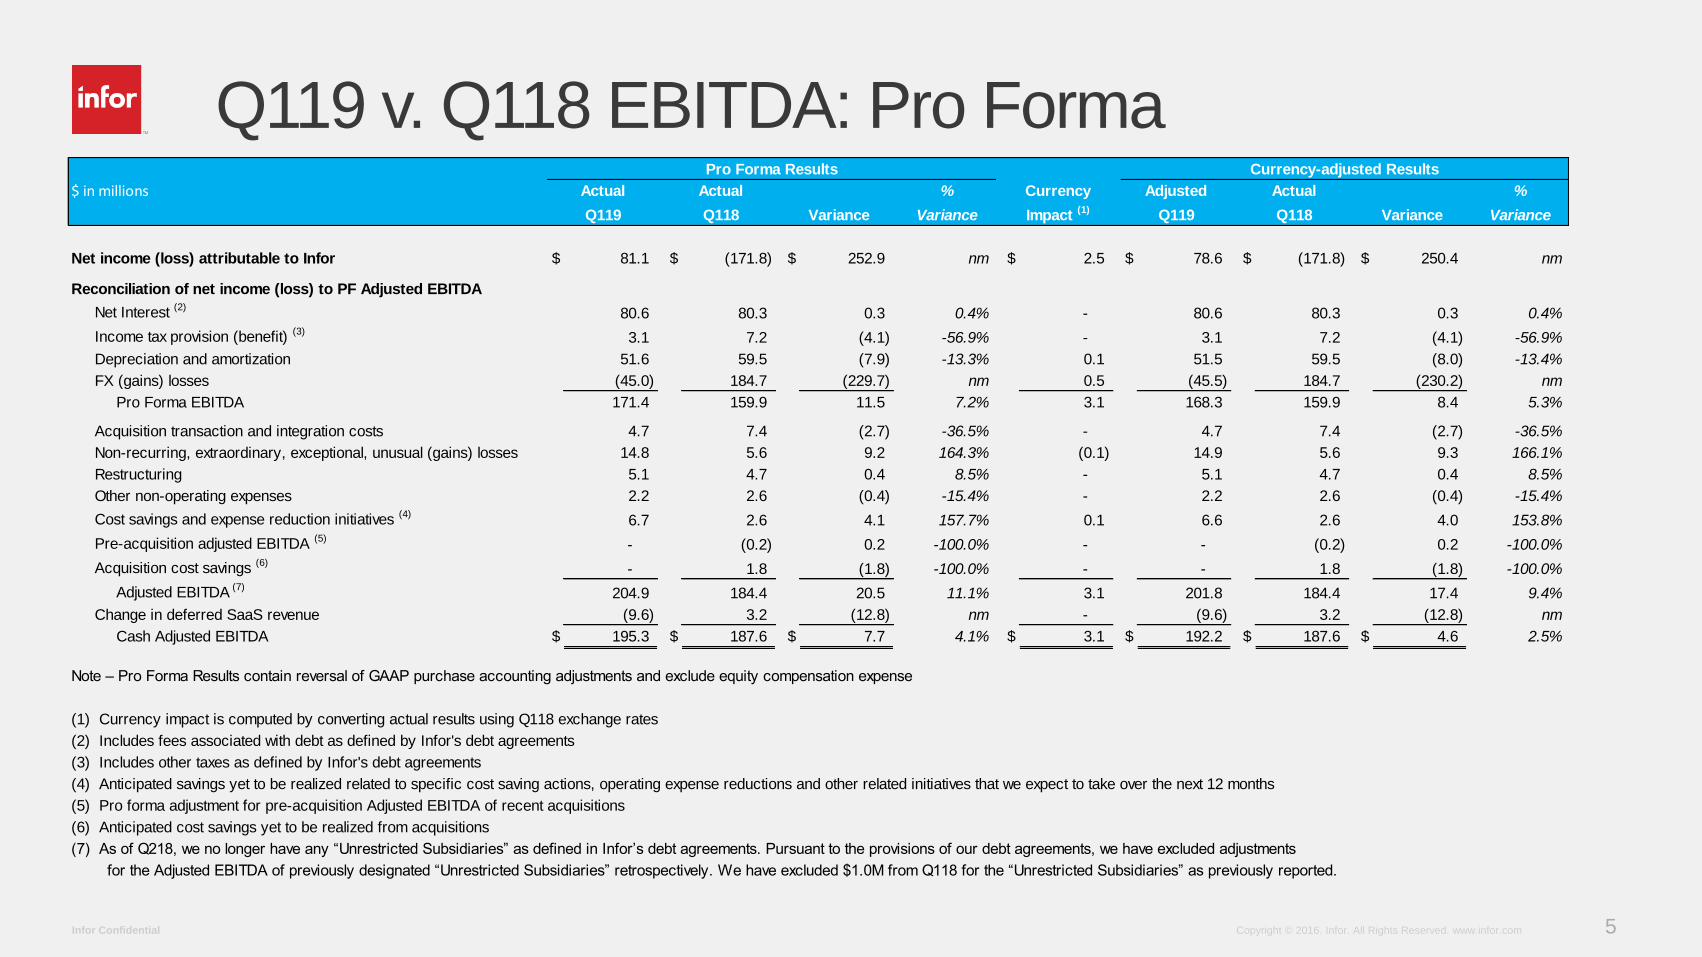
Q119 v. Q118 EBITDA: Pro Forma$ in millions % %
Variance Variance
Net income (loss) attributable to Infor $ 81.1 $ (171.8) $ 252.9 nm $ 2.5 $ 78.6 $ (171.8) $ 250.4 nm
Reconciliation of net income (loss) to PF Adjusted EBITDA
Net Interest (2)
80.6 80.3 0.3 0.4% - 80.6 80.3 0.3 0.4%
Income tax provision (benefit) (3)
3.1 7.2 (4.1) -56.9% - 3.1 7.2 (4.1) -56.9%
Depreciation and amortization 51.6 59.5 (7.9) -13.3% 0.1 51.5 59.5 (8.0) -13.4%
FX (gains) losses (45.0) 184.7 (229.7) nm 0.5 (45.5) 184.7 (230.2) nm
Pro Forma EBITDA 171.4 159.9 11.5 7.2% 3.1 168.3 159.9 8.4 5.3%
Acquisition transaction and integration costs 4.7 7.4 (2.7) -36.5% - 4.7 7.4 (2.7) -36.5%
Non-recurring, extraordinary, exceptional, unusual (gains) losses 14.8 5.6 9.2 164.3% (0.1) 14.9 5.6 9.3 166.1%
Restructuring 5.1 4.7 0.4 8.5% - 5.1 4.7 0.4 8.5%
Other non-operating expenses 2.2 2.6 (0.4) -15.4% - 2.2 2.6 (0.4) -15.4%
Cost savings and expense reduction initiatives (4)
6.7 2.6 4.1 157.7% 0.1 6.6 2.6 4.0 153.8%
Pre-acquisition adjusted EBITDA (5)
- (0.2) 0.2 -100.0% - - (0.2) 0.2 -100.0%
Acquisition cost savings (6)
- 1.8 (1.8) -100.0% - - 1.8 (1.8) -100.0%
Adjusted EBITDA (7)
204.9 184.4 20.5 11.1% 3.1 201.8 184.4 17.4 9.4%
Change in deferred SaaS revenue (9.6) 3.2 (12.8) nm - (9.6) 3.2 (12.8) nm
Cash Adjusted EBITDA $ 195.3 $ 187.6 $ 7.7 4.1% $ 3.1 $ 192.2 $ 187.6 $ 4.6 2.5%
Note – Pro Forma Results contain reversal of GAAP purchase accounting adjustments and exclude equity compensation expense
(1) Currency impact is computed by converting actual results using Q118 exchange rates
(2) Includes fees associated with debt as defined by Infor's debt agreements
(3) Includes other taxes as defined by Infor's debt agreements
(4) Anticipated savings yet to be realized related to specific cost saving actions, operating expense reductions and other related initiatives that we expect to take over the next 12 months
(5) Pro forma adjustment for pre-acquisition Adjusted EBITDA of recent acquisitions
(6) Anticipated cost savings yet to be realized from acquisitions
(7) As of Q218, we no longer have any “Unrestricted Subsidiaries” as defined in Infor’s debt agreements. Pursuant to the provisions of our debt agreements, we have excluded adjustments
for the Adjusted EBITDA of previously designated “Unrestricted Subsidiaries” retrospectively. We have excluded $1.0M from Q118 for the “Unrestricted Subsidiaries” as previously reported.
Pro Forma Results Currency-adjusted Results
Actual Actual Currency Adjusted Actual
VarianceQ119 Q118 Variance Impact (1)
Q119 Q118
6Copyright © 2016. Infor. All Rights Reserved. www.infor.comInfor Confidential
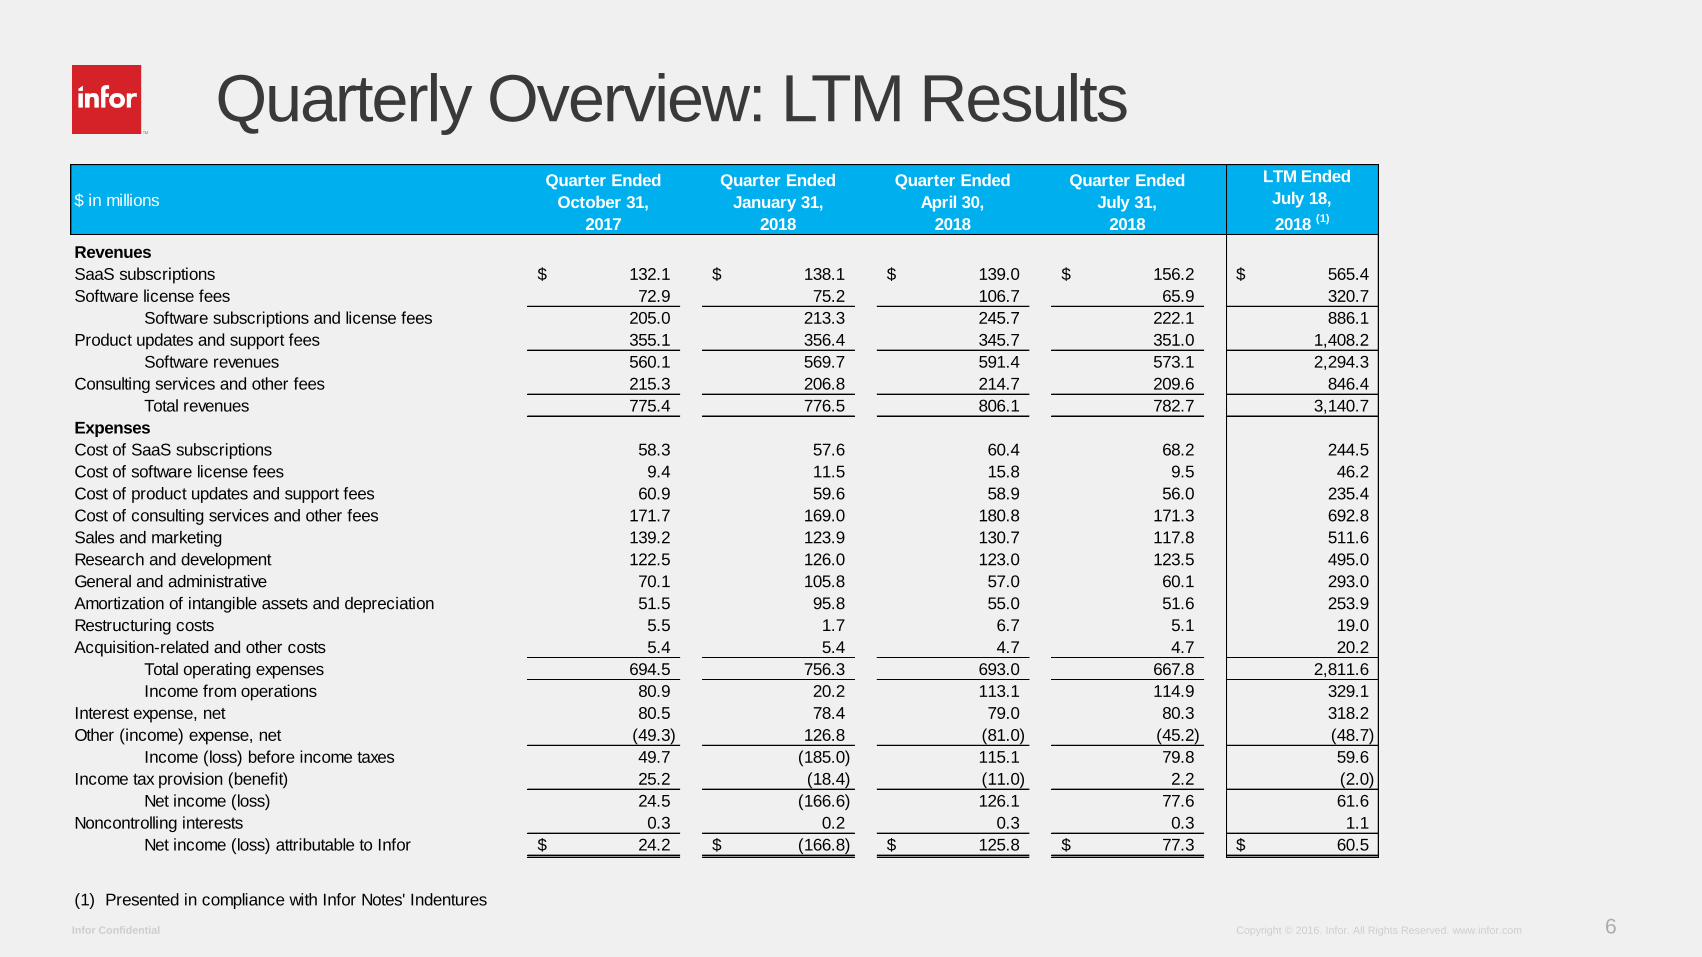
Quarterly Overview: LTM Results
$ in millions
Quarter Ended
October 31,
2017
Quarter Ended
January 31,
2018
Quarter Ended
April 30,
2018
Quarter Ended
July 31,
2018
LTM Ended
July 18,
2018 (1)
Revenues
SaaS subscriptions 132.1$ 138.1$ 139.0$ 156.2$ 565.4$
Software license fees 72.9 75.2 106.7 65.9 320.7
Software subscriptions and license fees 205.0 213.3 245.7 222.1 886.1
Product updates and support fees 355.1 356.4 345.7 351.0 1,408.2
Software revenues 560.1 569.7 591.4 573.1 2,294.3
Consulting services and other fees 215.3 206.8 214.7 209.6 846.4
Total revenues 775.4 776.5 806.1 782.7 3,140.7
Expenses
Cost of SaaS subscriptions 58.3 57.6 60.4 68.2 244.5
Cost of software license fees 9.4 11.5 15.8 9.5 46.2
Cost of product updates and support fees 60.9 59.6 58.9 56.0 235.4
Cost of consulting services and other fees 171.7 169.0 180.8 171.3 692.8
Sales and marketing 139.2 123.9 130.7 117.8 511.6
Research and development 122.5 126.0 123.0 123.5 495.0
General and administrative 70.1 105.8 57.0 60.1 293.0
Amortization of intangible assets and depreciation 51.5 95.8 55.0 51.6 253.9
Restructuring costs 5.5 1.7 6.7 5.1 19.0
Acquisition-related and other costs 5.4 5.4 4.7 4.7 20.2
Total operating expenses 694.5 756.3 693.0 667.8 2,811.6
Income from operations 80.9 20.2 113.1 114.9 329.1
Interest expense, net 80.5 78.4 79.0 80.3 318.2
Other (income) expense, net (49.3) 126.8 (81.0) (45.2) (48.7)
Income (loss) before income taxes 49.7 (185.0) 115.1 79.8 59.6
Income tax provision (benefit) 25.2 (18.4) (11.0) 2.2 (2.0)
Net income (loss) 24.5 (166.6) 126.1 77.6 61.6
Noncontrolling interests 0.3 0.2 0.3 0.3 1.1
Net income (loss) attributable to Infor 24.2$ (166.8)$ 125.8$ 77.3$ 60.5$
(1) Presented in compliance with Infor Notes' Indentures
7Copyright © 2016. Infor. All Rights Reserved. www.infor.comInfor Confidential
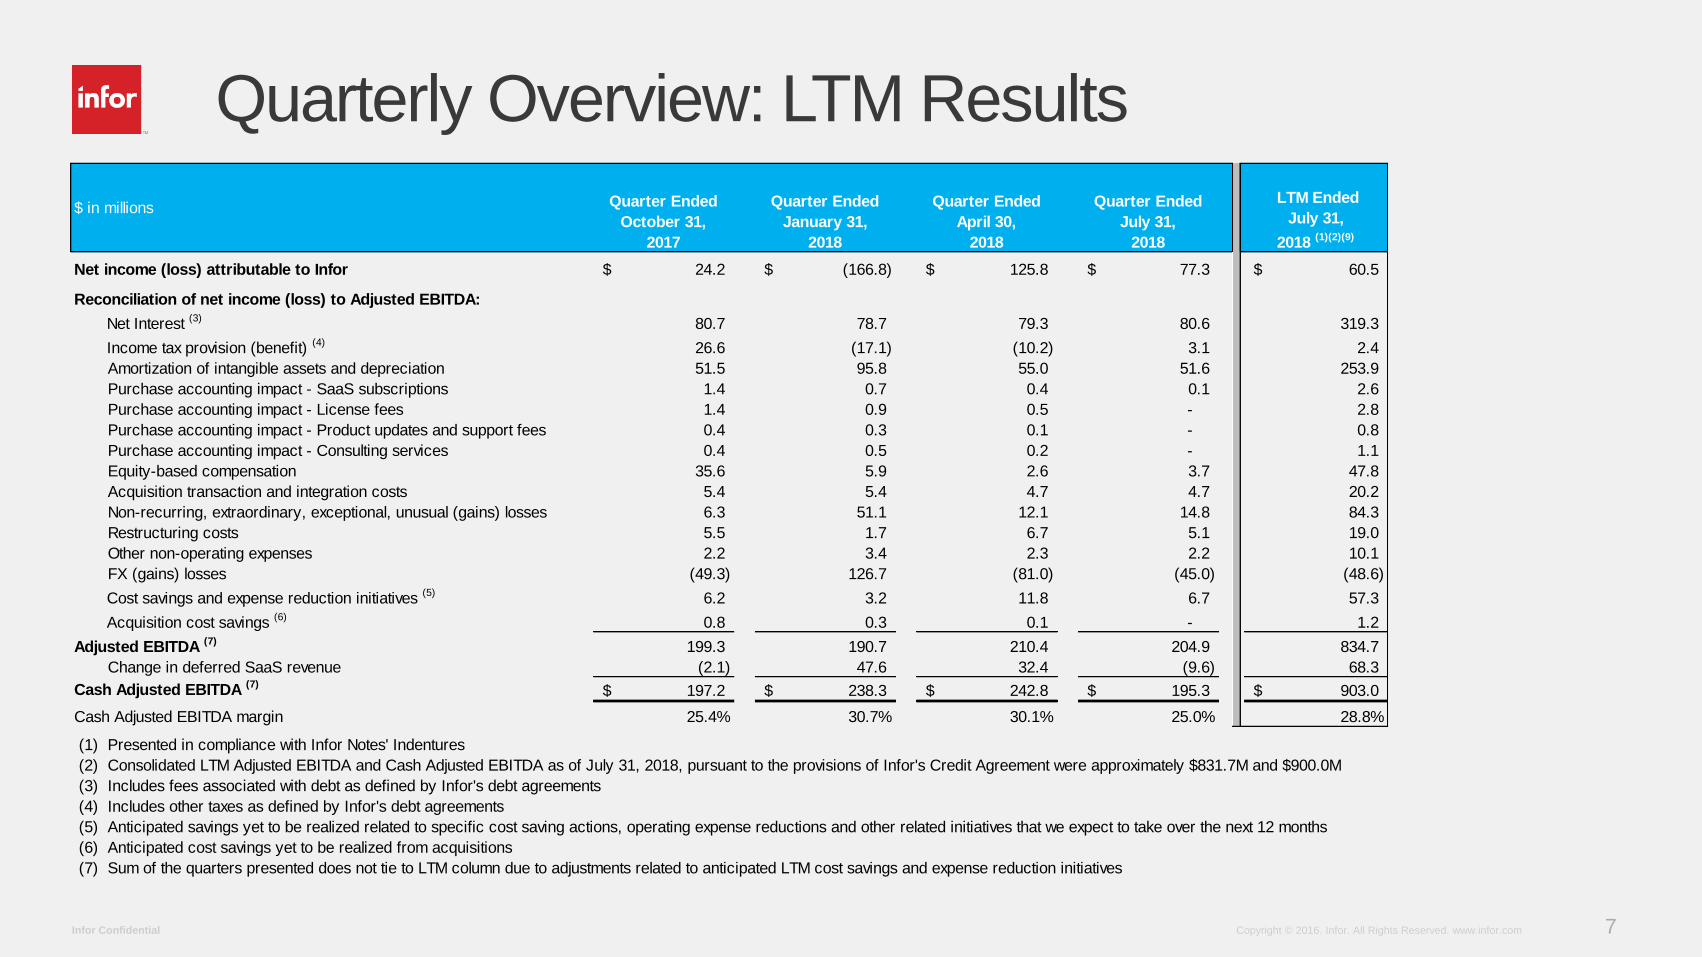
Quarterly Overview: LTM Results
$ in millions Quarter Ended
October 31,
2017
Quarter Ended
January 31,
2018
Quarter Ended
April 30,
2018
Quarter Ended
July 31,
2018
LTM Ended
July 31,
2018 (1)(2)(9)
Net income (loss) attributable to Infor 24.2$ (166.8)$ 125.8$ 77.3$ 60.5$
Reconciliation of net income (loss) to Adjusted EBITDA:
Net Interest (3)
80.7 78.7 79.3 80.6 319.3
Income tax provision (benefit) (4)
26.6 (17.1) (10.2) 3.1 2.4
Amortization of intangible assets and depreciation 51.5 95.8 55.0 51.6 253.9
Purchase accounting impact - SaaS subscriptions 1.4 0.7 0.4 0.1 2.6
Purchase accounting impact - License fees 1.4 0.9 0.5 - 2.8
Purchase accounting impact - Product updates and support fees 0.4 0.3 0.1 - 0.8
Purchase accounting impact - Consulting services 0.4 0.5 0.2 - 1.1
Equity-based compensation 35.6 5.9 2.6 3.7 47.8
Acquisition transaction and integration costs 5.4 5.4 4.7 4.7 20.2
Non-recurring, extraordinary, exceptional, unusual (gains) losses 6.3 51.1 12.1 14.8 84.3
Restructuring costs 5.5 1.7 6.7 5.1 19.0
Other non-operating expenses 2.2 3.4 2.3 2.2 10.1
FX (gains) losses (49.3) 126.7 (81.0) (45.0) (48.6)
Cost savings and expense reduction initiatives (5)
6.2 3.2 11.8 6.7 57.3
Acquisition cost savings (6)
0.8 0.3 0.1 - 1.2
Adjusted EBITDA (7)
199.3 190.7 210.4 204.9 834.7
Change in deferred SaaS revenue (2.1) 47.6 32.4 (9.6) 68.3
Cash Adjusted EBITDA (7)
197.2$ 238.3$ 242.8$ 195.3$ 903.0$
Cash Adjusted EBITDA margin 25.4% 30.7% 30.1% 25.0% 28.8%
(1) Presented in compliance with Infor Notes' Indentures
(2) Consolidated LTM Adjusted EBITDA and Cash Adjusted EBITDA as of July 31, 2018, pursuant to the provisions of Infor's Credit Agreement were approximately $831.7M and $900.0M
(3) Includes fees associated with debt as defined by Infor's debt agreements
(4) Includes other taxes as defined by Infor's debt agreements
(5) Anticipated savings yet to be realized related to specific cost saving actions, operating expense reductions and other related initiatives that we expect to take over the next 12 months
(6) Anticipated cost savings yet to be realized from acquisitions
(7) Sum of the quarters presented does not tie to LTM column due to adjustments related to anticipated LTM cost savings and expense reduction initiatives
8Copyright © 2016. Infor. All Rights Reserved. www.infor.comInfor Confidential
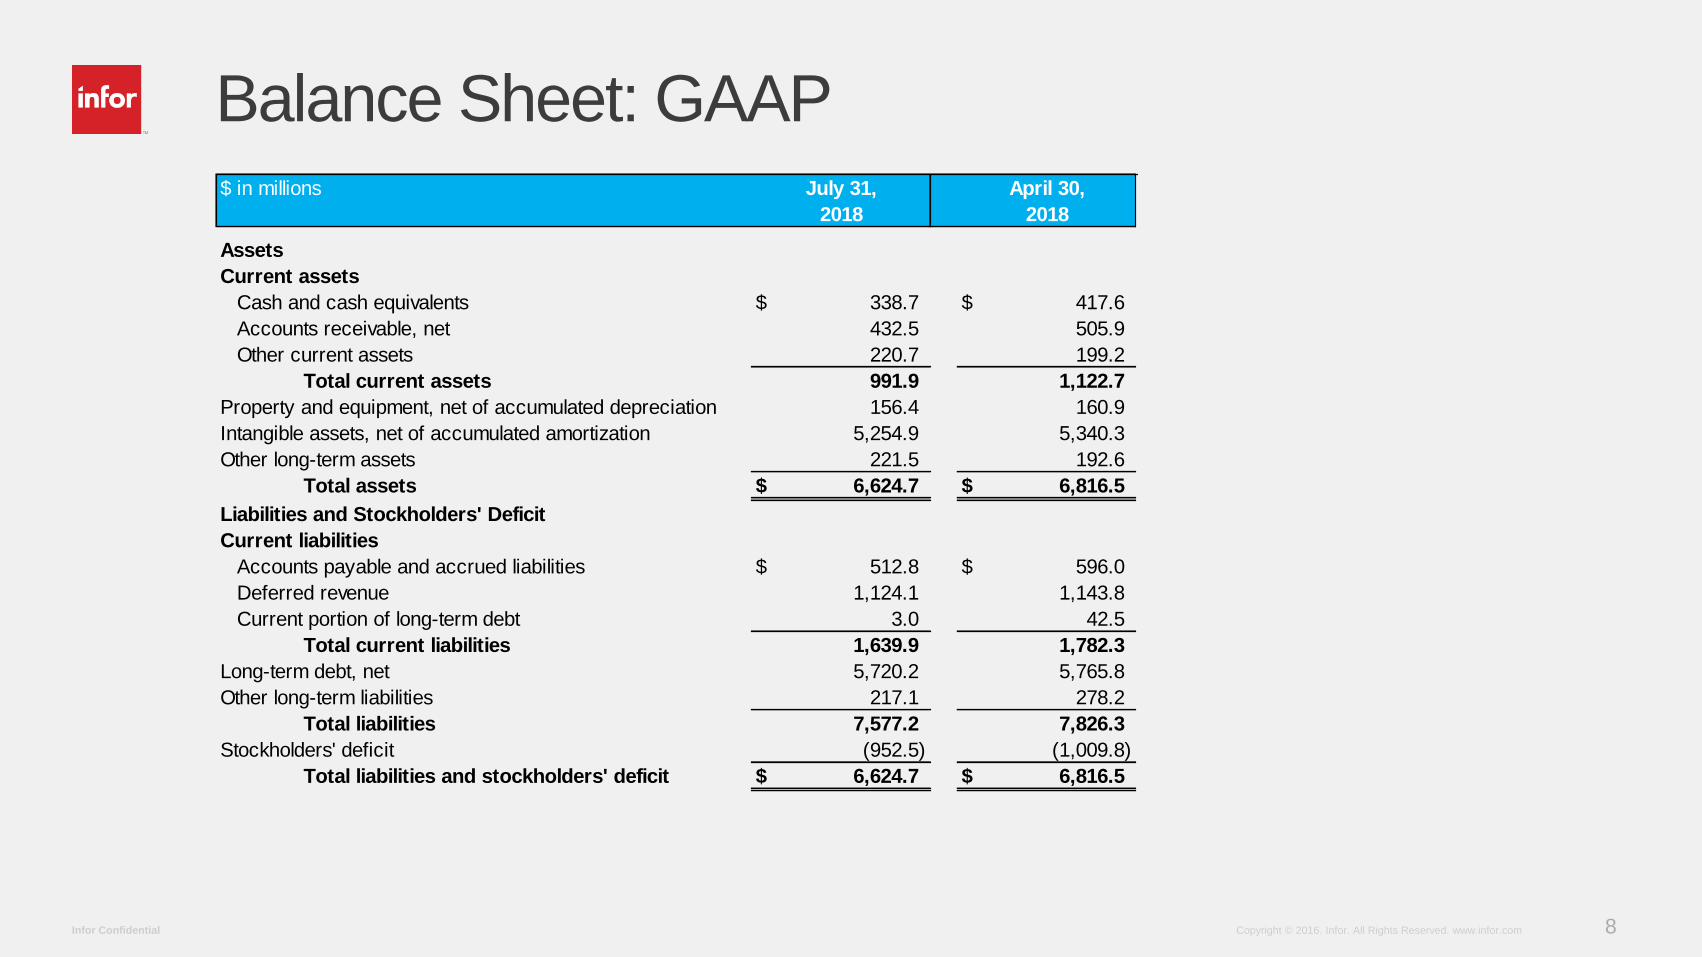
Balance Sheet: GAAP$ in millions July 31, April 30,
2018 2018
Assets
Current assets
Cash and cash equivalents 338.7$ 417.6$
Accounts receivable, net 432.5 505.9
Other current assets 220.7 199.2
Total current assets 991.9 1,122.7
Property and equipment, net of accumulated depreciation 156.4 160.9
Intangible assets, net of accumulated amortization 5,254.9 5,340.3
Other long-term assets 221.5 192.6
Total assets 6,624.7$ 6,816.5$
Liabilities and Stockholders' Deficit
Current liabilities
Accounts payable and accrued liabilities 512.8$ 596.0$
Deferred revenue 1,124.1 1,143.8
Current portion of long-term debt 3.0 42.5
Total current liabilities 1,639.9 1,782.3
Long-term debt, net 5,720.2 5,765.8
Other long-term liabilities 217.1 278.2
Total liabilities 7,577.2 7,826.3
Stockholders' deficit (952.5) (1,009.8)
Total liabilities and stockholders' deficit 6,624.7$ 6,816.5$
9Copyright © 2016. Infor. All Rights Reserved. www.infor.comInfor Confidential
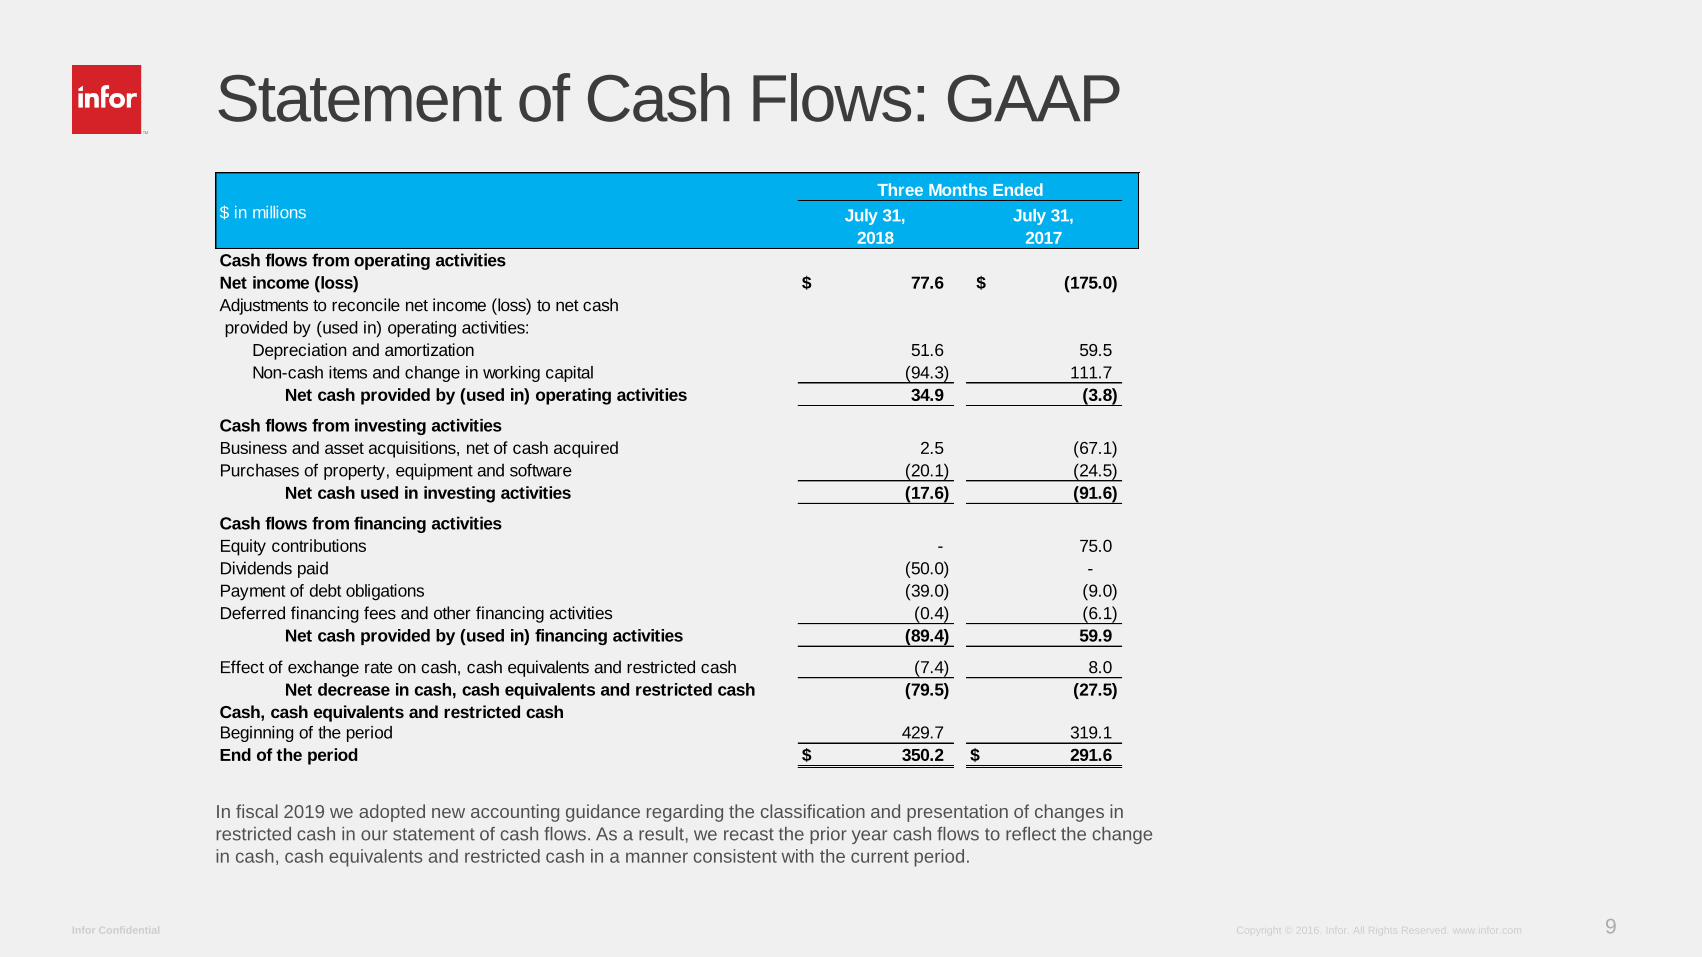
Statement of Cash Flows: GAAP
$ in millions July 31,
2018
July 31,
2017
Cash flows from operating activities
Net income (loss) 77.6$ (175.0)$
Adjustments to reconcile net income (loss) to net cash
provided by (used in) operating activities:
Depreciation and amortization 51.6 59.5
Non-cash items and change in working capital (94.3) 111.7
Net cash provided by (used in) operating activities 34.9 (3.8)
Cash flows from investing activities
Business and asset acquisitions, net of cash acquired 2.5 (67.1)
Purchases of property, equipment and software (20.1) (24.5)
Net cash used in investing activities (17.6) (91.6)
Cash flows from financing activities
Equity contributions - 75.0
Dividends paid (50.0) -
Payment of debt obligations (39.0) (9.0)
Deferred financing fees and other financing activities (0.4) (6.1)
Net cash provided by (used in) financing activities (89.4) 59.9
Effect of exchange rate on cash, cash equivalents and restricted cash (7.4) 8.0
Net decrease in cash, cash equivalents and restricted cash (79.5) (27.5)
Cash, cash equivalents and restricted cash
Beginning of the period 429.7 319.1
End of the period 350.2$ 291.6$
Three Months Ended
In fiscal 2019 we adopted new accounting guidance regarding the classification and presentation of changes in
restricted cash in our statement of cash flows. As a result, we recast the prior year cash flows to reflect the change
in cash, cash equivalents and restricted cash in a manner consistent with the current period.
10Copyright © 2016. Infor. All Rights Reserved. www.infor.comInfor Confidential
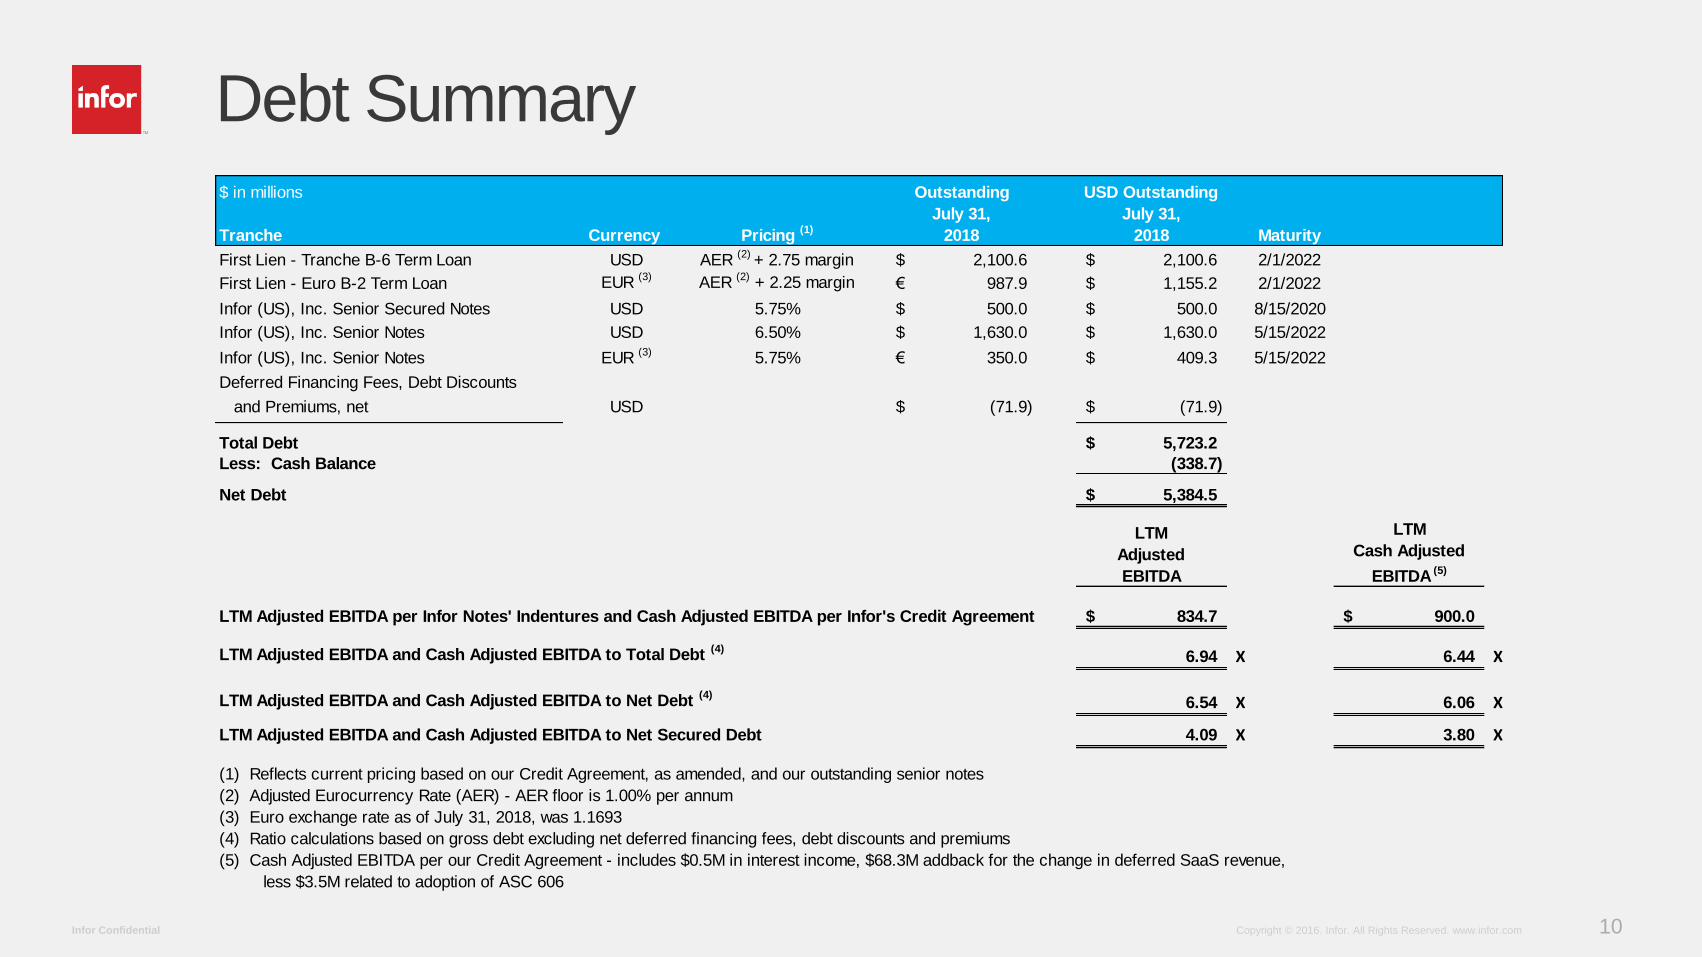
Debt Summary$ in millions Outstanding USD Outstanding
Tranche Currency Pricing (1)
July 31,
2018
July 31,
2018 Maturity
First Lien - Tranche B-6 Term Loan USD AER (2)
+ 2.75 margin 2,100.6$ 2,100.6$ 2/1/2022
First Lien - Euro B-2 Term Loan EUR (3)
AER (2)
+ 2.25 margin 987.9€ 1,155.2$ 2/1/2022
Infor (US), Inc. Senior Secured Notes USD 5.75% 500.0$ 500.0$ 8/15/2020
Infor (US), Inc. Senior Notes USD 6.50% 1,630.0$ 1,630.0$ 5/15/2022
Infor (US), Inc. Senior Notes EUR (3)
5.75% 350.0€ 409.3$ 5/15/2022
Deferred Financing Fees, Debt Discounts
and Premiums, net USD (71.9)$ (71.9)$
Total Debt 5,723.2$
Less: Cash Balance (338.7)
Net Debt 5,384.5$
LTM
Adjusted
EBITDA
LTM
Cash Adjusted
EBITDA (5)
LTM Adjusted EBITDA per Infor Notes' Indentures and Cash Adjusted EBITDA per Infor's Credit Agreement 834.7$ 900.0$
LTM Adjusted EBITDA and Cash Adjusted EBITDA to Total Debt (4)
6.94 X 6.44 X
LTM Adjusted EBITDA and Cash Adjusted EBITDA to Net Debt (4)
6.54 X 6.06 X
LTM Adjusted EBITDA and Cash Adjusted EBITDA to Net Secured Debt 4.09 X 3.80 X
(1) Reflects current pricing based on our Credit Agreement, as amended, and our outstanding senior notes
(2) Adjusted Eurocurrency Rate (AER) - AER floor is 1.00% per annum
(3) Euro exchange rate as of July 31, 2018, was 1.1693
(4) Ratio calculations based on gross debt excluding net deferred financing fees, debt discounts and premiums
(5) Cash Adjusted EBITDA per our Credit Agreement - includes $0.5M in interest income, $68.3M addback for the change in deferred SaaS revenue,
less $3.5M related to adoption of ASC 606
11Copyright © 2016. Infor. All Rights Reserved. www.infor.comInfor Confidential
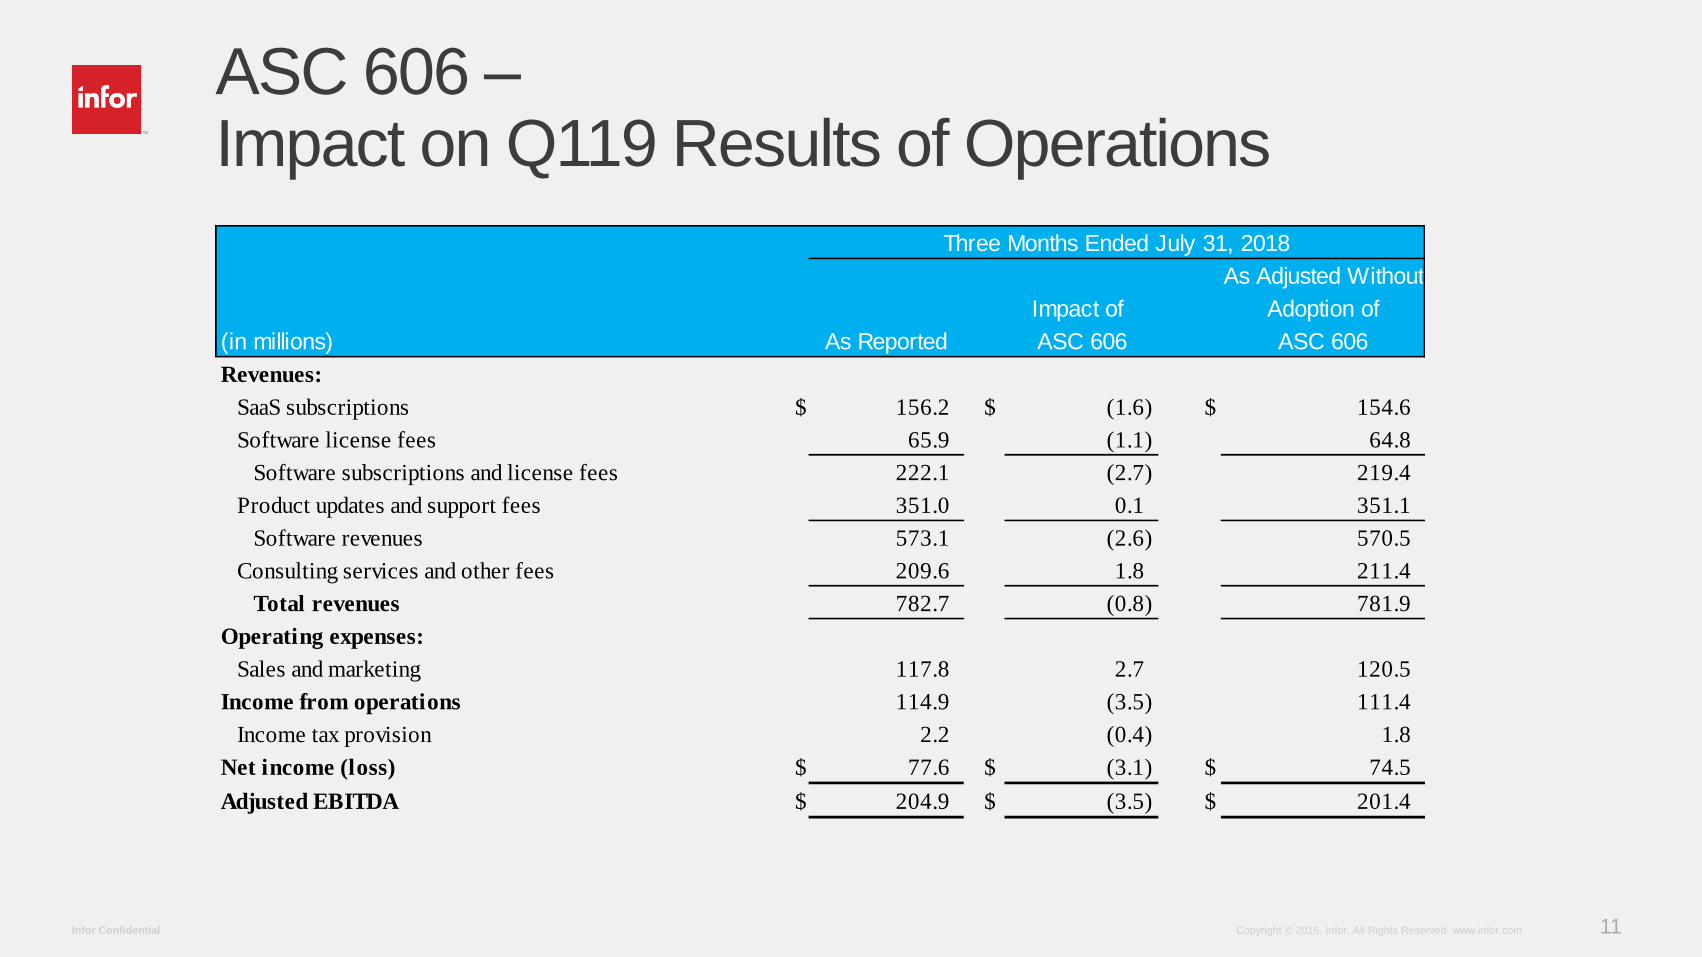
ASC 606 –Impact on Q119 Results of Operations
As Adjusted Without
Impact of Adoption of
(in millions) As Reported ASC 606 ASC 606
Revenues:
SaaS subscriptions $ 156.2 $ (1.6) $ 154.6
Software license fees 65.9 (1.1) 64.8
Software subscriptions and license fees 222.1 (2.7) 219.4
Product updates and support fees 351.0 0.1 351.1
Software revenues 573.1 (2.6) 570.5
Consulting services and other fees 209.6 1.8 211.4
Total revenues 782.7 (0.8) 781.9
Operating expenses:
Sales and marketing 117.8 2.7 120.5
Income from operations 114.9 (3.5) 111.4
Income tax provision 2.2 (0.4) 1.8
Net income (loss) $ 77.6 $ (3.1) $ 74.5
Adjusted EBITDA $ 204.9 $ (3.5) $ 201.4
Three Months Ended July 31, 2018

12Copyright © 2016. Infor. All Rights Reserved. www.infor.comInfor Confidential