q1-q3 2012 conference call - gfk · q1-q3 2012 conference call matthias hartmann, ceo ... financial...
TRANSCRIPT

© GfK 2012 | 9 months Results Conference Call | 14 November 2012 1
Q1-Q3 2012 CONFERENCE CALL
Matthias Hartmann, CEO
Pamela Knapp, CFO
Nine months results conference call, 14 November 2012

© GfK 2012 | 9 months Results Conference Call | 14 November 2012 2
Disclaimer
This presentation constitutes neither an offer nor recommendation to subscribe or buy in any other way securities of GfK SE or any
of the companies that are members of the Group at present or in the future, nor does it form part of such an offer and it should not be
understood as such. The presentation or any part thereof should not form the basis for a contract for the purchase or subscription of
securities of GfK SE or any of the companies that are members of the Group or represent a guarantee in connection with such
contract.
All the information contained in this presentation has been established with care. Nevertheless, we cannot guarantee its reliability or
completeness and the information contained herein should not be deemed as a guarantee in this respect.
The information contained in this presentation may be supplemented, amended and updated. Certain statements made herein may
express future expectations, which are based on current opinions and assumptions of the management and are subject to
foreseeable and unforeseeable risks and uncertainties. Actual results, performance and events may differ considerably from the
statements expressed in the present information, partly due to changing business or market conditions and to the growth prospects
forecast by the management of GfK SE. These and other factors may have an unfavorable impact on the results and financial
consequences described in this presentation. GfK SE does not undertake to update or revise statements on future developments, on
the basis of new information, future events or for other reasons. You should not rely on statements made about future
developments, which simply express expectations as of the date of this presentation.
This document does not constitute an offer of sale of securities in the United States of America. Securities may not be
offered or sold in the United States of America without registration or exemption from registration in accordance with the
U.S. Securities‘ Act of 1933 in its currently valid form.

© GfK 2012 | 9 months Results Conference Call | 14 November 2012 3
1. Highlights of the reporting period
Matthias Hartmann, CEO
2. Financial Results Q1-Q3 2012
Pamela Knapp, CFO
3. Guidance
Pamela Knapp, CFO
4. Q&A
Matthias Hartmann, CEO
Pamela Knapp, CFO
Agenda

© GfK 2012 | 9 months Results Conference Call | 14 November 2012 4
Highlights of the reporting period

© GfK 2012 | 9 months Results Conference Call | 14 November 2012 5
Q1-Q3 2012
Q1-Q3 2011
Financial Highlights for the first nine months 2012
Sales
Total sales growth
Organic growth
Adjusted operating income
Margin1)
EBIT
EBITDA
Cash flow from operating activity
Basic earnings per share
EUR 998.5m
7.1%
7.0%
EUR 130.9m
13.1%
EUR 121.4m
EUR 163.4m
EUR 125.2m
EUR 1.80
EUR 1,096.8m
9.8%
2.2%
EUR 125.8m
11.5%
EUR 104.7m
EUR 147.6m
EUR 73.4m
EUR 1.31
1) Adjusted operating income in relation to sales

© GfK 2012 | 9 months Results Conference Call | 14 November 2012 6
51.0 45.1
≤ -3.0
Sales growth in % for Q1-Q3 2012
Nine month growth 2012 in comparison shows strongest organic
growth momentum among key competitors
0.7 0.9
3.3
Organic growth is
analyst estimate.
9.8
2.2
6.7
Nielsen does not report
organic growth.
0.9 n/a
4.1
1) Consumer Insight segment isolated. WPPs Consumer Insight segment comprises of Kantar, TNS, Millward Brown, and The Futures Company, amongst others.
Total Organic At constant
FX rates
Total Organic At constant
FX rates
Total Organic At constant
FX rates
Total Organic At constant
FX rates
1)

© GfK 2012 | 9 months Results Conference Call | 14 November 2012 7
53.2 44.5
≤ -1.0
Sales growth in % for Q3 2012
Business returned to organic growth in Q3 2012
-0.4 0.8
3.5
Organic growth is
analyst estimate.
11.3
3.2
7.3
Nielsen does not report
organic growth.
0.7 n/a
4.6
1) Consumer Insight segment isolated. WPPs Consumer Insight segment comprises of Kantar, TNS, Millward Brown, and The Futures Company, amongst others.
Total Organic At constant
FX rates
Total Organic At constant
FX rates
Total Organic At constant
FX rates
Total Organic At constant
FX rates
1)

© GfK 2012 | 9 months Results Conference Call | 14 November 2012 8
Revenue growth of +11.3% in Q3
Organic growth of 18.5% in APAC, 9.4% in LATAM and 5.3% in
Southern & Western Europe and 5.7% in North America
o Flat organic growth in CEE
o Northern Europe is only region in decline, but reduced negative
development
Strong revenue growth momentum of 11.3%, of which
3.2% are organic growth
Strong
double digit
revenue growth
in Q3
User Centric acquisition complements SirValUse, creating global
coverage and Leadership in User Experience Consulting & Tracking Strengthening
Digital
Expanding in APAC through organic investment
• South Korea practice ramp & significant first wins
• Strong Leadership addition in China, Greater China, Singapore
and South East Asia
Expanding in Africa through GlobalEDGE acquisition
(FMGC data from 33 countries)
Expanding in
growth markets

© GfK 2012 | 9 months Results Conference Call | 14 November 2012 9
Positive order intake Q3 momentum in Consumer Electronics
Good growth in IT and Stationery
Strong growth within Home & Lifestyle
Q3 wins and global product launches in Consumer Choices confirm
traction and logic of ‘Own the Future’ strategy
Retail Tracking
First NIS data available by year end from global framework contract
with major provider previously announced (two countries) Network
Intelligence
Solution (NIS)
Smart Steps/ Telefonica:
• Global framework contract signed with Telefonica
• Local contracts for product launch being finalized in the UK and
Brazil (for launch Q1 2013)
Successful LPS trial completed with a major US operator –
discussions in progress for commercialization in 2013
Live Population
Services (LPS)

© GfK 2012 | 9 months Results Conference Call | 14 November 2012 10
Network Intelligence Solutions: GfK’s competitive advantages
Extraction Processing Reporting Enrichment Anonymisation Sales
GfK Network Intelligence Solutions transform Telco network data to deliver essential insights on
consumer behavior. This requires deep knowledge of end-to-end network systems and
communications platforms
• Network Intelligence Solution (NIS): IP traffic delivers insights on internet and mobile app
usage
• Live Population Services (LPS): mobile network data delivers location/ consumer journey
information
GfK is uniquely positioned versus other
market research companies through
deep understanding of network data and
the ability to offer our own network
“probes” for NIS.
GfK is uniquely positioned versus big data
analytical companies (incl. operators) by
our marketing science expertise, data
assets (e.g., panels) and trusted reputation
for delivering valuable consumer insights.
Our services will be
promoted across all
GfK vertical customer
sectors
Note: GfK may deliver different elements of this value chain within different operator partnerships

© GfK 2012 | 9 months Results Conference Call | 14 November 2012 11
Microsoft Partnership:
• Double digit million order intake
• Global scale campaign tracking and cross media optimization for important
new product launch campaigns
• Complemented by a Brand Tracker in more than 40 markets
Global Tracker (86 countries/ 20 languages):
• Worldwide b2b satisfaction tracking program of a global telecommunications
equipment company out of the Emerging Asian markets
• Strong central management as well as local specialized field capacities were
crucial to win contract
Latin America: contract with a leading Telecom operator
• 3 year contract includes various types of research programs around the full
cycle of customer experience
Global contract wins in Consumer Experiences confirm GfK’s
strategic direction
Technology
China:
• One of the world leading healthcare companies, extending our relationship
with this client into China
• Investment strategy in Asia and healthcare crucial in winning contract from
competition
Healthcare
New global Brand and Customer Experience (BaCE) product launched: CBR
(Customer Brand Relationship)
• First wins from China Southern Airlines and Coca-Cola
Rollout of
BaCE offerings

© GfK 2012 | 9 months Results Conference Call | 14 November 2012 12
Financial Results Q1-Q3 2012

© GfK 2012 | 9 months Results Conference Call | 14 November 2012 13
Detailed group and sector figures for Q1-Q3 2012
In EUR m Sales Growth rate in % Operating Income Margin in %
Q1-Q3
2011 Q1-Q3
2012 Total Organic
Q1-Q3
2011 Q1-Q3
2012 Q1-Q3
2011 Q1-Q3
2012
Consumer
Choices 396.8 423.6 6.7 3.5 99.7 97.3 25.1 23.0
Consumer
Experiences 598.1 669.5 11.9 1.4 37.4 35.0 6.3 5.2
Other 3.6 3.7 2.8 1.3 -6.2 -6.6
Total 998.5 1,096.8 9.8 2.2 130.9 125.8 13.1 11.5

© GfK 2012 | 9 months Results Conference Call | 14 November 2012 14
Main influences for operating margin development
Price/cost
(CH, S, NL,
F, POR,
CEE)
ERP
CC
business
ramp up
CE
business
ramp up
CC
depreciation
AM assets
Evogenius
impairment
Other
effects
-0,1% -0,7%
-0,2% -0,2% +0,4%
13,1%
-0,9%
11,5%
+0,1%
Q3
Ye
ar
To
Da
te
-0,4%
11,8%
-0,2% -1,1%
-0,1% -1,0%
-0,5% +1,2%
13,9%
Q3
Is
ola
ted

© GfK 2012 | 9 months Results Conference Call | 14 November 2012 15
Regional growth
42.0 45.6
2011 2012
Latin America
146.9
196.8
2011 2012
North America
203.8 208.5
2011 2012
Southern and Western Europe
85.9 86.6
2011 2012
CEE and META
85.6
113.5
2011 2012
Asia and the Pacific
2011 2012
Northern Europe
+34.0%
Sales in EUR million for Q1-Q3 year on year
+2.4%
Total
Growth
Organic
Growth
+2.6%
-1.1%
0.9%
+1.0%
+8.7%
+10.1%
+2.3%
+2.3%
+32.5%
+16.0%
445.8 434.4
© GfK 2012 | 9 months Results Conference Call | 14 November 2012 16
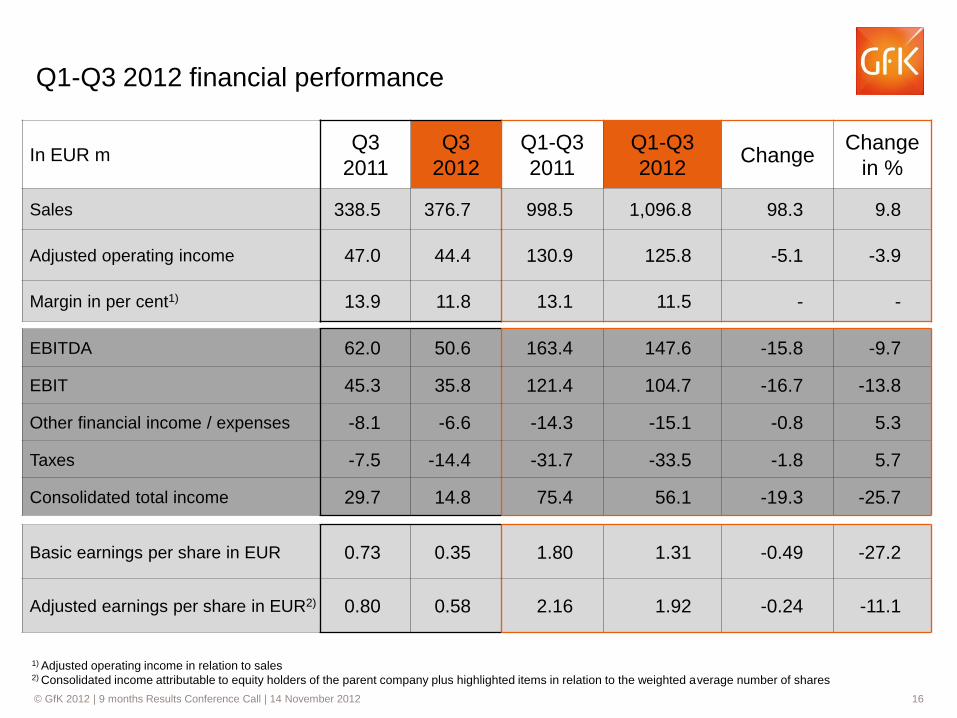
Q1-Q3 2012 financial performance
In EUR m Q3
2011
Q3
2012
Q1-Q3
2011
Q1-Q3
2012 Change
Change
in %
Sales 338.5 376.7 998.5 1,096.8 98.3 9.8
Adjusted operating income 47.0 44.4 130.9 125.8 -5.1 -3.9
Margin in per cent1) 13.9 11.8 13.1 11.5 - -
1) Adjusted operating income in relation to sales 2) Consolidated income attributable to equity holders of the parent company plus highlighted items in relation to the weighted average number of shares
EBITDA 62.0 50.6 163.4 147.6 -15.8 -9.7
EBIT 45.3 35.8 121.4 104.7 -16.7 -13.8
Other financial income / expenses -8.1 -6.6 -14.3 -15.1 -0.8 5.3
Taxes -7.5 -14.4 -31.7 -33.5 -1.8 5.7
Consolidated total income 29.7 14.8 75.4 56.1 -19.3 -25.7
Basic earnings per share in EUR 0.73 0.35 1.80 1.31 -0.49 -27.2
Adjusted earnings per share in EUR2) 0.80 0.58 2.16 1.92 -0.24 -11.1

© GfK 2012 | 9 months Results Conference Call | 14 November 2012 17
Highlighted items for Q1-Q3 2012
In EUR m Q1-Q3
2011
Q1-Q3
2012 Change
Write-downs/write-ups of additional assets
identified on acquisitions -7.6 -8.6 -1.0
Income and expenses in connection with
share and asset deals 1.9 -1.0 -2.9
Income and expenses in connection with
reorganization and improvement projects -3.4 -6.8 -3.4
Personnel expenses for share-based incentive
payments -4.3 -3.2 1.1
Currency conversion differences 1.2 -2.1 -3.3
Income and expenses related to one-off
effects and other exceptional circumstances -0.8 -0.4 0.4
Highlighted items -12.9 -22.1 -9.2

© GfK 2012 | 9 months Results Conference Call | 14 November 2012 18
Cash flow for the first nine months 2012
Free cash flow before acquisitions, other
investments and asset disposals 89.1 18.9 -70.2
In EUR m Q1-Q3
2011 Q1-Q3
2012 Change
Cash flow from operating activity 125.2 73.4 -51.8
Capital expenditure -36.1 -54.5 -18.4
Free cash flow after acquisitions, other
investments and asset disposals 82.4 -76.2 -158.6
Acquisitions -10.3 -95.9 -85.6
Other financial investments/ Asset disposals 3.6 0.8 -2.8

© GfK 2012 | 9 months Results Conference Call | 14 November 2012 19
Capital Expenditure increase in Q1-Q3 2012
In EUR m Q1-Q3 2011 Q1-Q3 2012 Change
Intangible assets 21.3 23.8 2.5
including
-Software 16.8 19.3 2.5
-Panel 2.4 3.7 1.3
Tangible assets 14.8 30.7 15.9
including
-Real estate 0.0 7.8 7.8
-Other plant and equipment 14.5 19.5 5.0
Capital Expenditure 36.1 54.5 18.4

© GfK 2012 | 9 months Results Conference Call | 14 November 2012 20
375 376
309
237
256
347
187
166
189
210 215
196
2008 2009 2010 2011 Q3 2011 Q3 2012
Net Debt in EURm (covenantdefinition)
EBITDA in EURm (covenantdefinition)
Net debt development
1) EBITDA and Net Debt are calculated according to bank covenant definition on rolling four quarter basis
2008 2009 2010 2011 Q3 2011 Q3 2012
Net debt headroom
in EUR m
233 162 305 446 442 290
Net debt/EBITDA 1)
covenant definition
2.01 2.27 1.63 1.13 1.19 1.77
Net debt/EBITDA
IFRS
2.51 3.14 2.19 1.63 1.65 2.23

© GfK 2012 | 9 months Results Conference Call | 14 November 2012 21
Guidance

© GfK 2012 | 9 months Results Conference Call | 14 November 2012 22
Guidance
Under the assumption that the FX ratios remain on a similar level as YTD, GfK expects for 2012
• EUR 1.5bn in sales which represents a total growth of around 9% year-on-year
• to achieve a margin (AOI to sales) between 12.2 and 12.7%
For 2015 we aim to achieve around EUR 2.0bn in sales and an AOI margin of 16.0%

© GfK 2012 | 9 months Results Conference Call | 14 November 2012 23
Q&A

© GfK 2012 | 9 months Results Conference Call | 14 November 2012 24
THANK YOU