q1 asia pacific office - cushman & wakefield/media/global-reports/q1... · large scale...
TRANSCRIPT

A CUSHMAN & WAKEFIELD QUARTERLY RESEARCH PUBLICATION
Q1 ASIA PACIFIC OFFICE OVERVIEW
J a n u a r y - M a r c h | 2 0 1 7

TokyoRental growth momentum stall-ing, landlords competing for ten-ants, rentals likely to soften by end of 2017, large influx of new supply in 2018
SeoulHeadquarter relocations in the Central Business District (CBD), increasing vacancies across all submarkets, flat to moderating rentals over short term
ChinaTier 1 – Rental contrast between Beijing (up) and Shanghai (flat to moderating), competition from landlords in suburban markets, vacancies expected to rise in the second half of 2017
Tier 2 – Vacancies higher than historical averages, rental decline to continue in the short term, supply will exceed market activi-ty over the next 12 months
Hong KongNew large-scale supply in the second half to intensify com-petition in Kowloon, increasing rentals in Greater Central to widen the gap between core and decentralized areas
TaipeiSupply surge through 2018, flight to quality driving market activity, rising vacancies
IndiaMost of the new supply in 2017 already pre-leased in tech cit-ies, sub-10% vacancy levels and rising rentals will continue in the short term, landlord favorable
Delayed new supply and be-low trend market activity in Delhi-National Capital Region (NCR), Mumbai, and Kolkata, tenant favorable conditions to continue through 2017
AustraliaIncentives stabilized, rental growth in Sydney and Mel-bourne, service sector employ-ment growth to drive market activity, healthy demand and landlord favorable conditions will continue through 2018
JakartaNew large-scale supply pushing up vacancies, moderating rent-als, flight to quality among lower grade buildings, increasing com-petition among landlords
Kuala LumpurDownsizing/subleasing by tenants, growing competition among landlords and declining rents, market activity to remain below trend in the short term
ManilaHealthy leasing activity and rental growth in the first quarter of 2017, upcoming large-scale supply will slowdown rental growth in the short term, tech-nology-outsourcing sector diver-sifying to remain resilient
SingaporeHealthy take-up in new projects, Co-working and serviced offices gain momentum, reduced supply pipeline post 2017, rentals to bot-tom in the short term and return to growth by 2018
BangkokContinued rental growth, limited new supply, mixed-use projects in the CBD driven by scarcity and high prices of freehold plots
Ho Chi Minh CityShortage of space options in first quarter of 2017, new supply in second half of 2017 will provide multiple space options, rents to stabilize
2017 OCCUPIER CONDITIONS
VIETNAMTenant Favorable
Hanoi Ho Chi Minh City
KOREATenant Favorable
Seoul
JAPANNeutral
Tokyo
AUSTRALIATenant Favorable
Brisbane
Landlord Favorable
Melbourne Sydney
SINGAPORETenant Favorable
Singapore
INDONESIATenant Favorable
Jakarta
MALAYSIATenant Favorable
Kuala Lumpur
THAILANDLandlord Favorable
Bangkok
TAIWANTenant Favorable
Taipei
PHILIPPINESNeutral
Manila
INDIATenant Favorable
Ahmedabad Delhi-NCR Kolkata Mumbai
Landlord Favorable
Bengaluru Chennai Hyderabad Pune
GREATER CHINATenant Favorable
Chongqing Chengdu Tianjin Shenyang Landlord Favorable
Beijing Hong Kong
2 3
ASIA PACIFIC OFFICE OVERVIEW | Q1A CUSHMAN & WAKEFIELD QUARTERLY RESEARCH PUBLICATION

KEY TAKEAWAYSRegaining the momentumFirst quarter of 2017 has wit-nessed healthy economic activ-ity across most markets in the region. Growth in China, at 6.9%, was better than the consensus forecasts on the back of govern-ment spending, pickup in in-dustrial activity, and real estate. Likewise, Hong Kong’s growth was the highest in last six years. India has bucked the anticipated downtrend due to demonetiza-tion and is gearing up to roll out tax reforms later this year. On the other hand, strengthening external demand and rising ex-ports supported by a weaker yen are likely to underpin positive economic performance in Japan. Thailand, Indonesia, and South Korea have also recorded growth picking up due to recovering exports. Australia has multiple large scale infrastructure proj-ects either under construction or proposed, all of which will have a direct positive impact on the real estate sector. Most central banks (except China) have kept their policy rates steady and accom-modative during the quarter.
Healthy start to 2017 Public investment in infrastruc-ture continues to be a big boost to office markets across the region. Cities in Australia, India, and emerging Southeast Asia have witnessed demand growing and rentals rising due to ongo-ing/upcoming projects that are set to improve public transporta-tion and suburban accessibility.
Tier 1 cities in China led the mar-ket activity, followed by Bengal-uru and Manila. Office demand in China is largely driven by domes-tic enterprises. The market for
high-tech, creative, telecommu-nications and green industries has been steadily growing in Shenzhen, where absorption was highest at above 4 million square feet (msf) during the quarter. Office demand in India and the Philippines hasn’t witnessed any noticeable impact due to poli-cy shifts in the technology and outsourcing sector. Accordingly, rentals in cities such as Benga-luru, Hyderabad and Chennai have grown in double digits on an annual basis. Elsewhere in the region, markets with tight vacancies such as Sydney, Bang-kok, and Hong Kong’s Greater Central have seen rentals moving up steadily while supply-heavy markets such as Jakarta, Kuala Lumpur, Singapore, and Shang-hai are witnessing rentals grad-ually declining during the same period.
Better than anticipated growth supports a positive outlook The International Monetary Fund (IMF) has estimated that Asia Pacific will remain a “world leader” with 5.5% economic growth during 2017. Solid funda-mentals and sustained momen-tum in demand-driving sectors should support healthy leasing activities in the region. Rentals in most core markets are set to grow further in the short term with the exception of Singapore and Shanghai. We expect the services sector will increasingly adopt new technologies that will shape up market dynamics going forward.
OCCUPANCY COSTSRanking
Q1 2016
Q4 2016
Q1 2017
US$/sf/mo
1 1 1 Hong Kong 11.63
2 2 2 Tokyo 8.94
4 3 3 Sydney 6.82
5 4 4 Delhi - CBD 6.52
3 5 5 Singapore 6.05
6 6 6 Beijing 5.24
7 7 7 Ho Chi Minh City 4.48
10 8 8 Mumbai - SBD 4.23
8 9 9 Brisbane 4.16
11 11 10 Melbourne 3.98
9 10 11 Shanghai 3.78
12 13 12 Shenzhen 3.60
13 12 13 Mumbai - CBD 3.57
14 14 14 Seoul 3.38
16 15 15 Hanoi 2.77
15 16 16 Jakarta 2.68
17 18 17 Canberra 2.54
19 17 18 Bangkok 2.54
18 19 19 Guangzhou 2.30
20 20 20 Taipei 2.29
22 21 21 Gurgaon - CBD 2.14
23 22 22 Manila 1.74
21 23 23 Kuala Lumpur 1.63
24 24 24 Chengdu 1.41
25 25 25 Pune 1.11
26 26 26 Bengaluru 1.08
28 27 27 Chennai 0.98
29 29 28 Hyderabad 0.92
27 28 29 Kolkata 0.86
30 30 30 Ahmedabad 0.66
China’s One Belt, One RoadSince the proposal of the initiative in 2013, the Chinese has moved with extraordinary speed to make President’s Xi’s vision a reality. The Asia In-frastructure Investment Bank, founded to plug an estimated US$21 trillion financing gap in infrastructure investment, was established in 2016 and just in May, the Chinese held its first One Belt, One Road summit in the Chinese capital. With an overland and maritime route that runs through at least 65 countries including China, the route will impact 60% of the world’s population and 30% of its GDP. When completed, it will be the largest intra-re-gional collaborative trade platform in the world. Besides pushing China’s exports to the next phase of growth, it has the potential to reshape the trade and business land-scape across six major eco-nomic corridors. Large-scale investments in infrastructure, cross-border trade, business and job growth, boost to logistics and warehousing in-dustries, and positive spillover effects on retail and residen-tial sectors will be the expect-ed benefits for developing nations that are part of the program, especially in Central Asia, Africa and Southeast Asia. Despite all hurdles and risks involved, many emerging markets could benefit a great deal in the long term.
ASIA PACIFIC OVERVIEW STATISTICS
VACANCY RATESRanking
Q1 2016
Q4 2016
Q1 2017
%
1 1 1 Manila 2.4%
2 2 2 Tokyo 3.9%
14 4 3 Ho Chi Minh City 4.0%
13 3 4 Gurgaon - CBD 5.1%
3 7 5 Singapore 5.3%
12 12 6 Hyderabad 5.8%
11 6 7 Bengaluru 6.2%
7 10 8 Hong Kong 6.3%
10 8 9 Melbourne 6.5%
6 9 10 Beijing 6.6%
4 5 11 Bangkok 6.9%
8 11 12 Sydney 7.3%
20 14 13 Taipei 8.0%
9 13 14 Mumbai - CBD 8.7%
15 18 15 Chennai 9.2%
19 16 16 Pune 9.4%
22 15 17 Canberra 9.8%
21 17 18 Seoul 10.5%
18 19 19 Brisbane 12.0%
16 22 20 Guangzhou 12.8%
27 24 21 Hanoi 13.8%
17 20 22 Shanghai 13.9%
5 21 23 Shenzhen 14.5%
24 23 24 Kuala Lumpur 15.1%
25 25 25 Delhi - CBD 18.8%
23 26 26 Mumbai - SBD 20.7%
26 27 27 Jakarta 23.3%
28 28 28 Kolkata 33.8%
29 29 29 Chengdu 35.0%
30 30 30 Ahmedabad 38.7%
4 5
ASIA PACIFIC OFFICE OVERVIEW | Q1A CUSHMAN & WAKEFIELD QUARTERLY RESEARCH PUBLICATION
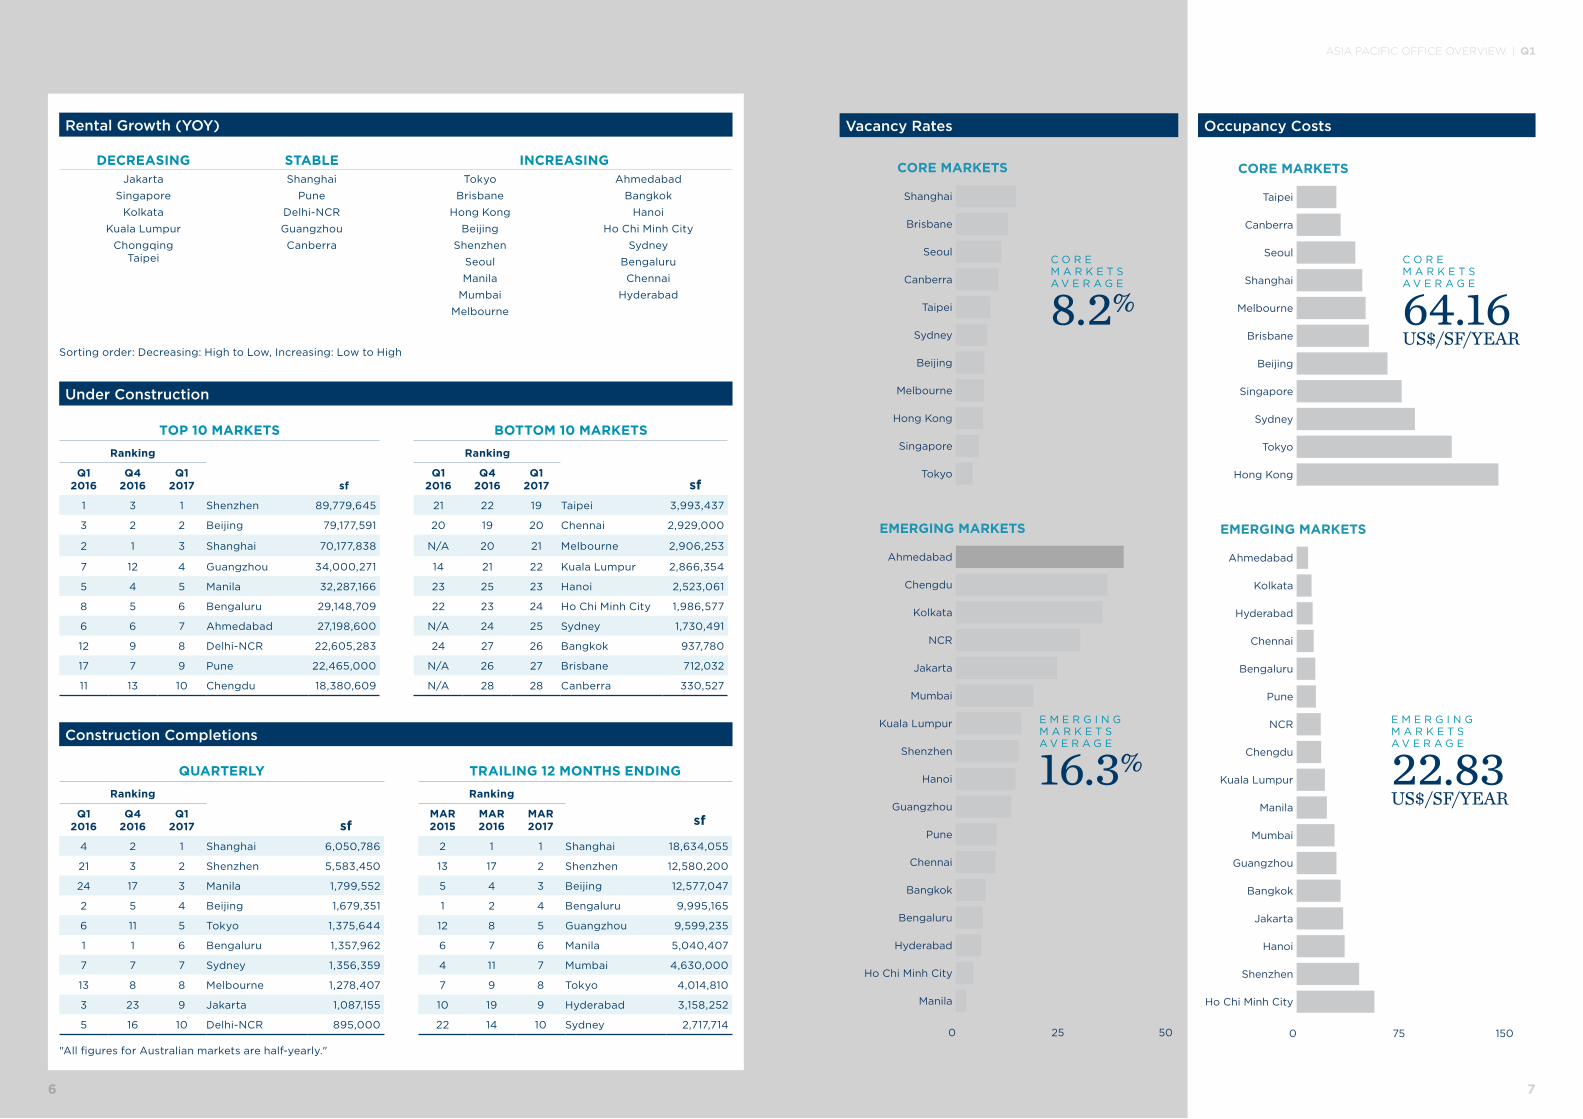
Rental Growth (YOY)
DECREASING STABLE INCREASINGJakarta
Singapore
Kolkata
Kuala Lumpur
Chongqing Taipei
Shanghai
Pune
Delhi-NCR
Guangzhou
Canberra
Tokyo
Brisbane
Hong Kong
Beijing
Shenzhen
Seoul
Manila
Mumbai
Melbourne
Ahmedabad
Bangkok
Hanoi
Ho Chi Minh City
Sydney
Bengaluru
Chennai
Hyderabad
Sorting order: Decreasing: High to Low, Increasing: Low to High
Under Construction
TOP 10 MARKETS BOTTOM 10 MARKETS
Ranking Ranking
Q1 2016
Q4 2016
Q1 2017 sf
Q1 2016
Q4 2016
Q1 2017 sf
1 3 1 Shenzhen 89,779,645 21 22 19 Taipei 3,993,437
3 2 2 Beijing 79,177,591 20 19 20 Chennai 2,929,000
2 1 3 Shanghai 70,177,838 N/A 20 21 Melbourne 2,906,253
7 12 4 Guangzhou 34,000,271 14 21 22 Kuala Lumpur 2,866,354
5 4 5 Manila 32,287,166 23 25 23 Hanoi 2,523,061
8 5 6 Bengaluru 29,148,709 22 23 24 Ho Chi Minh City 1,986,577
6 6 7 Ahmedabad 27,198,600 N/A 24 25 Sydney 1,730,491
12 9 8 Delhi-NCR 22,605,283 24 27 26 Bangkok 937,780
17 7 9 Pune 22,465,000 N/A 26 27 Brisbane 712,032
11 13 10 Chengdu 18,380,609 N/A 28 28 Canberra 330,527
Construction Completions
QUARTERLY TRAILING 12 MONTHS ENDING
Ranking Ranking
Q1 2016
Q4 2016
Q1 2017 sf
MAR 2015
MAR 2016
MAR 2017 sf
4 2 1 Shanghai 6,050,786 2 1 1 Shanghai 18,634,055
21 3 2 Shenzhen 5,583,450 13 17 2 Shenzhen 12,580,200
24 17 3 Manila 1,799,552 5 4 3 Beijing 12,577,047
2 5 4 Beijing 1,679,351 1 2 4 Bengaluru 9,995,165
6 11 5 Tokyo 1,375,644 12 8 5 Guangzhou 9,599,235
1 1 6 Bengaluru 1,357,962 6 7 6 Manila 5,040,407
7 7 7 Sydney 1,356,359 4 11 7 Mumbai 4,630,000
13 8 8 Melbourne 1,278,407 7 9 8 Tokyo 4,014,810
3 23 9 Jakarta 1,087,155 10 19 9 Hyderabad 3,158,252
5 16 10 Delhi-NCR 895,000 22 14 10 Sydney 2,717,714
"All figures for Australian markets are half-yearly."
Vacancy Rates Occupancy Costs
0 25 50
Manila
Ho Chi Minh City
Hyderabad
Bengaluru
Bangkok
Chennai
Pune
Guangzhou
Hanoi
Shenzhen
Kuala Lumpur
Mumbai
Jakarta
NCR
Kolkata
Chengdu
Ahmedabad
EMERGING MARKETS
Tokyo
Singapore
Hong Kong
Melbourne
Beijing
Sydney
Taipei
Canberra
Seoul
Brisbane
Shanghai
CORE MARKETS
0 75 150
Ho Chi Minh City
Shenzhen
Hanoi
Jakarta
Bangkok
Guangzhou
Mumbai
Manila
Kuala Lumpur
Chengdu
NCR
Pune
Bengaluru
Chennai
Hyderabad
Kolkata
Ahmedabad
EMERGING MARKETS
Hong Kong
Tokyo
Sydney
Singapore
Beijing
Brisbane
Melbourne
Shanghai
Seoul
Canberra
Taipei
CORE MARKETS
C O R E M A R K E T S A V E R A G E
8.2%
C O R E M A R K E T S A V E R A G E
64.16 US$/SF/YEAR
E M E R G I N G M A R K E T S A V E R A G E
16.3%
E M E R G I N G M A R K E T S A V E R A G E
22.83 US$/SF/YEAR
6 7
ASIA PACIFIC OFFICE OVERVIEW | Q1A CUSHMAN & WAKEFIELD QUARTERLY RESEARCH PUBLICATION

ABOUT THE DATA
Absorption and Supply
Availability and Space Under Construction
0
8
16
Southeast AsiaSouth AsiaNorth AsiaGreater ChinaAustralia
Supply
Absorption
0
175
350
Southeast AsiaSouth AsiaNorth AsiaGreater ChinaAustralia
Space UnderConstruction
Availability
Disclaimer:
Cushman & Wakefield (C&W) is known the world-over as an industry knowledge leader. Through the delivery of timely, accurate, high-quality research reports on the leading trends, markets around the world and business issues of the day, we aim to assist our clients in making property decisions that meet their objectives and enhance their competitive position. In addition to producing regular reports such as global rankings and local quarterly updates available on a regular basis, C&W also provides customized studies to meet specific information needs of owners, occupiers and investors.
Cushman & Wakefield is a leading global real estate services firm that helps clients transform the way people work, shop, and live. Our 45,000 employees in more than 70 countries help occupiers and investors optimize the value of their real estate by combining our global perspective and deep local knowledge with an impressive platform of real estate solutions. Cushman & Wakefield is among the largest commercial real estate services firms with revenue of $6 billion across core services of agency leasing, asset services, capital markets, facility services (C&W Services), global occupier services, investment & asset management (DTZ Investors), project & development services, tenant representation, and valuation & advisory. 2017 marks the 100-year anniversary of the Cushman & Wakefield brand. 100 years of taking our clients’ ideas and putting them into action. To learn more, visit www.cushwakecentennial.com, www.cushmanwakefield.com or follow @CushWake on Twitter.
This report has been prepared solely for information purposes. It does not purport to be a complete description of the markets or developments contained in this material. The information on which this report is based has been obtained from sources we believe to be reliable, but we have not independently verified such information and we do not guarantee that the information is accurate or complete. Published by Corporate Communications.
©2017 Cushman & Wakefield, Inc. All rights reserved.
Cushman & Wakefield, Singapore3 Church Street#09-03 Samsung HubSingapore 049483www.cushmanwakefield.com
For more information about C&W Research, contact:
SIGRID ZIALCITA Managing Director, Research, Asia Pacific +(65) 6232 0875 [email protected]
Million sf
Million sf
Market coverage includes premium and Grade A properties in CBD and where relevant new prime centers that are well located, with office spaces that have higher design standards, large contiguous floor plates, managed professionally, are well leased to high quality tenants and suitable for institutional grade portfolios.
Under construction space includes all projects that have broken ground but not stalled as of the reporting quarter.
Construction completions includes all new supply with projects that have completed and ready/fit for possession.
Absorption refers to incremental new space take-up, and exclude renewals.
Occupancy costs include standardized market rents or net leasable area basis and service charges are included as applicable.
Data for Australia are based on bi-annual numbers as available from PCA.
"All figures for Australian markets are half-yearly."
2.65
0.48
3.45
11.98
14.51
1.89
4.463.91
3.03 2.89
7.15 12.065.35
45.58
304.86
26.10
71.96
137.94
19.35
62.38
8 9
ASIA PACIFIC OFFICE OVERVIEW | Q1A CUSHMAN & WAKEFIELD QUARTERLY RESEARCH PUBLICATION

Cushman & Wakefield, Singapore 3 Church Street Samsung Hub #09-03 Singapore 049483 www.cushmanwakefield.com
©2017 Cushman & Wakefield, Inc. All rights reserved.
Q1 ASIA PACIFIC OFFICE OVERVIEW