q1 2021 earnings update -- 5-3-21
TRANSCRIPT

Q1 2021 Earnings CallMay 3, 2021

2
Forward-Looking Statements
Certain statements in this presentation constitute “forward-looking” statements, which include any statements related to the novel coronavirus ("COVID-19"),the Freshpet Kitchens Expansion, and the Company's general operating and economic environment. These statements are based on management's currentopinions, expectations, beliefs, plans, objectives, assumptions or projections regarding future events or future results. These forward-looking statements areonly predictions, not historical fact, and involve certain risks and uncertainties, as well as assumptions. Actual results, levels of activity, performance,achievements and events could differ materially from those stated, anticipated or implied by such forward-looking statements. While Freshpet believes that itsassumptions are reasonable, it is very difficult to predict the impact of known factors, and, of course, it is impossible to anticipate all factors that could affectactual results. There are many risks and uncertainties that could cause actual results to differ materially from forward-looking statements made hereinincluding, most prominently, the risks discussed under the heading “Risk Factors” in the Company's latest annual report on Form 10-K and quarterly reports onForm 10-Q filed with the Securities and Exchange Commission. Such forward-looking statements are made only as of the date of this presentation. Freshpetundertakes no obligation to publicly update or revise any forward-looking statement because of new information, future events or otherwise, except asotherwise required by law. If we do update one or more forward-looking statements, no inference should be made that we will make additional updates withrespect to those or other forward-looking statements.
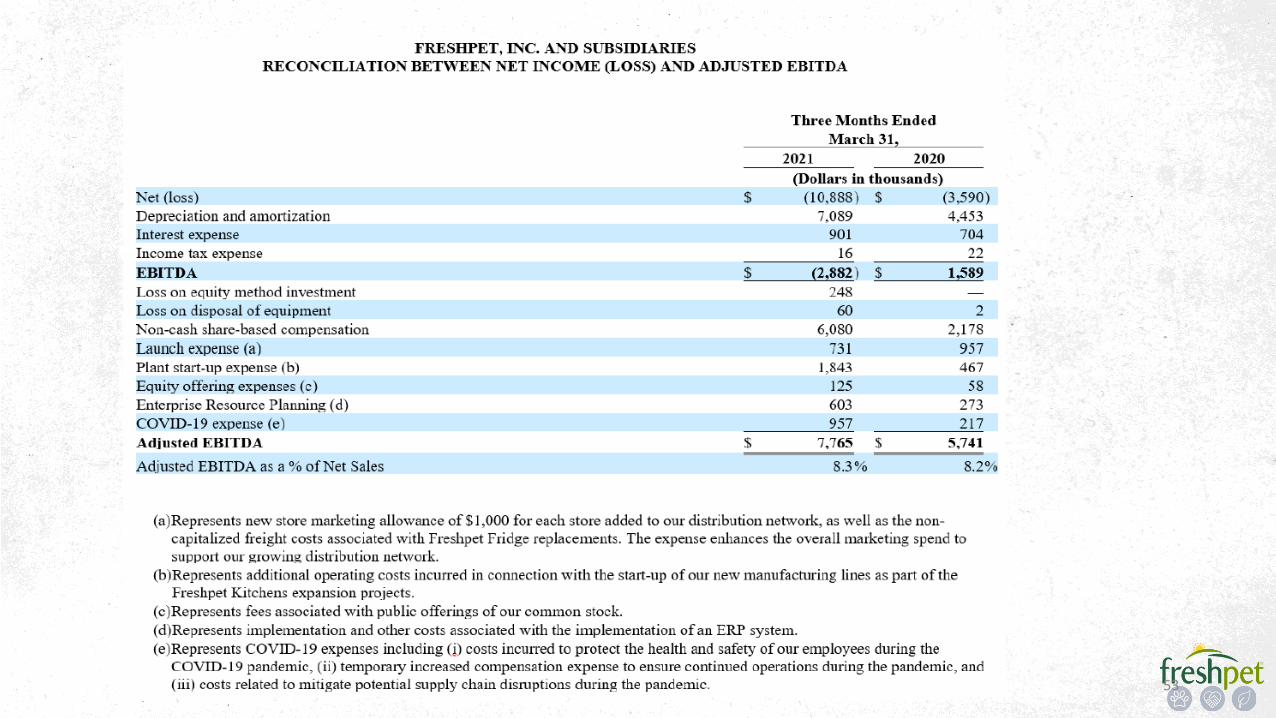
Non-GAAP Measures
Freshpet uses certain non-GAAP financial measures, including EBITDA, Adjusted EBITDA, Adjusted EBITDA as a % of net sales, Adjusted Gross Profit, AdjustedGross Profit as a % of net sales (Adjusted Gross Margin), Adjusted SG&A and Adjusted SG&A as a % of net sales. These non-GAAP financial measures should beconsidered as supplements to GAAP reported measures, should not be considered replacements for, or superior to, GAAP measures and may not becomparable to similarly named measures used by other companies.
Freshpet defines EBITDA as net income (loss) plus interest expense, income tax expense and depreciation and amortization expense, and Adjusted EBITDA asEBITDA plus net income (loss) on equity method investment, plant start-up expense, non-cash share-based compensation, launch expense, fees related toequity offerings of our common stock, implementation and other costs associated with the implementation of an ERP system, and other expenses, includingloss on disposal of equipment and COVID-19 expenses.
Forward Looking Statements & Non-GAAP Measures

3
Freshpet defines Adjusted Gross Profit as gross profit before depreciation expense, plant start-up expense, COVID-19 expenses and non-cash share-basedcompensation, and Adjusted SG&A as SG&A expenses before depreciation and amortization expense, non-cash share-based compensation, launch expense,gain (loss) on disposal of equipment, fees related to equity offerings of our common stock, implementation and other costs associated with theimplementation of an ERP system and COVID-19 expenses.
Management believes that the non-GAAP financial measures are meaningful to investors because they provide a view of the Company with respect to ongoingoperating results. Non-GAAP financial measures are shown as supplemental disclosures in this presentation because they are widely used by the investmentcommunity for analysis and comparative evaluation. They also provide additional metrics to evaluate the Company’s operations and, when considered withboth the Company’s GAAP results and the reconciliation to the most comparable GAAP measures, provide a more complete understanding of the Company’sbusiness than could be obtained absent this disclosure. Adjusted EBITDA is also an important component of internal budgeting and setting managementcompensation. The non-GAAP measures are not and should not be considered an alternative to the most comparable GAAP measures or any other figurecalculated in accordance with GAAP, or as an indicator of operating performance. The Company’s calculation of the non-GAAP financial measures may differfrom methods used by other companies. Management believes that the non-GAAP measures are important to an understanding of the Company's overalloperating results in the periods presented. The non-GAAP financial measures are not recognized in accordance with GAAP and should not be viewed as analternative to GAAP measures of performance.
Certain of these measures present the Company’s guidance for fiscal year 2021. The Company does not provide guidance for the most directly comparableGAAP measure and similarly cannot provide a reconciliation to such measure without unreasonable effort due to the unavailability of reliable estimates forcertain items. These items are not within the Company’s control and may vary greatly between periods and could significantly impact future financial results.
Forward Looking Statements & Non-GAAP Measures (cont.)

Q1 2021 Results

6
Q1 2021: Strong growth on both Net Sales & Adj. EBITDA
$70.1
$93.4
$5.7
$7.8
$0.0
$2.0
$4.0
$6.0
$8.0
$10.0
$12.0
$20.0
$30.0
$40.0
$50.0
$60.0
$70.0
$80.0
$90.0
$100.0
Q1 2020 Q1 2021
Freshpet Net Sales & Adj. EBITDA Performance
Net Sales ($ millions) Adj. EBITDA ($ millions)
+28%
+33%
+35%
Net Income (Loss) ($ millions)
($10.9)($3.6)
+106%
Net Sales Adj. EBITDA
7
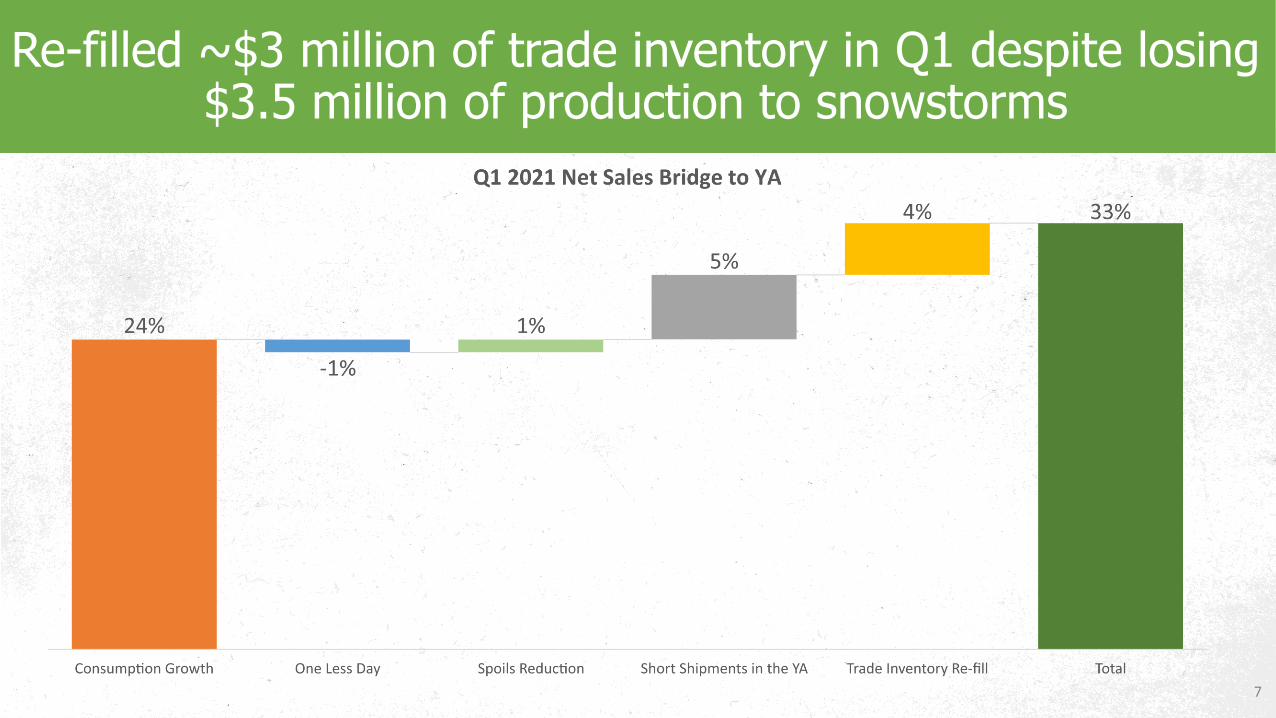
Re-filled ~$3 million of trade inventory in Q1 despite losing $3.5 million of production to snowstorms
8
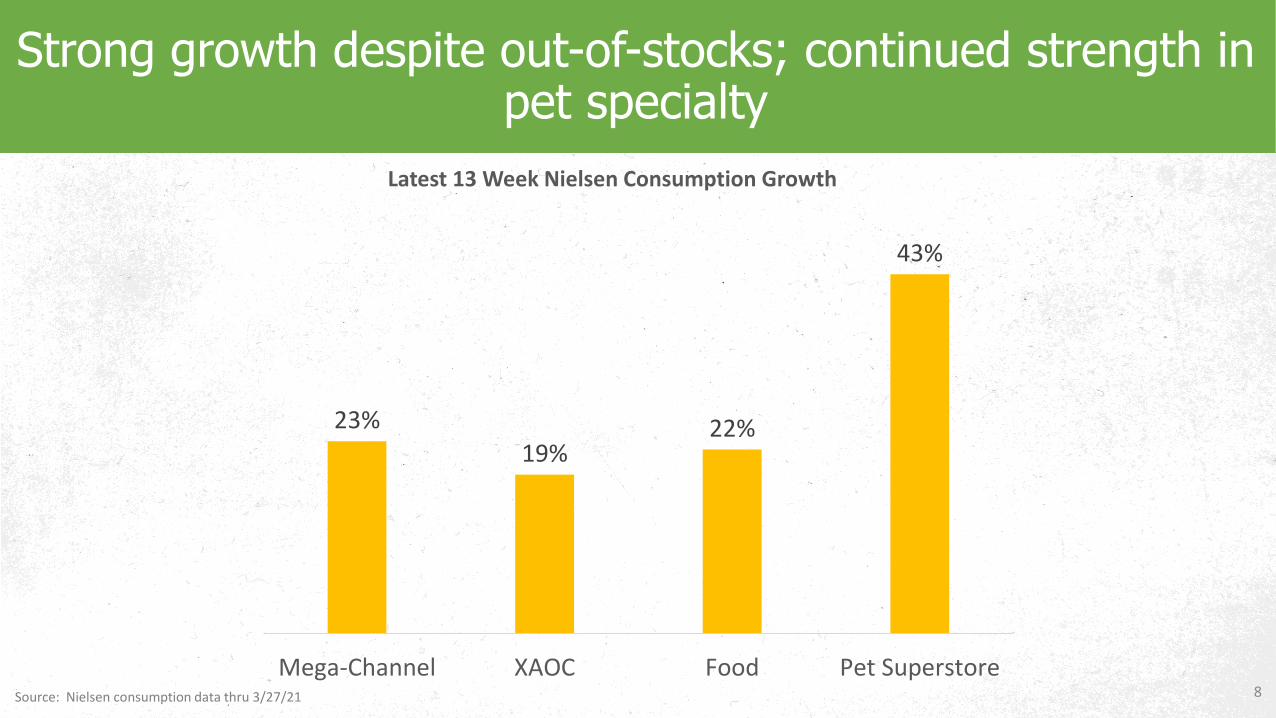
Strong growth despite out-of-stocks; continued strength in pet specialty
23%
19%22%
43%
Mega-Channel XAOC Food Pet Superstore
Latest 13 Week Nielsen Consumption Growth
Source: Nielsen consumption data thru 3/27/21
9
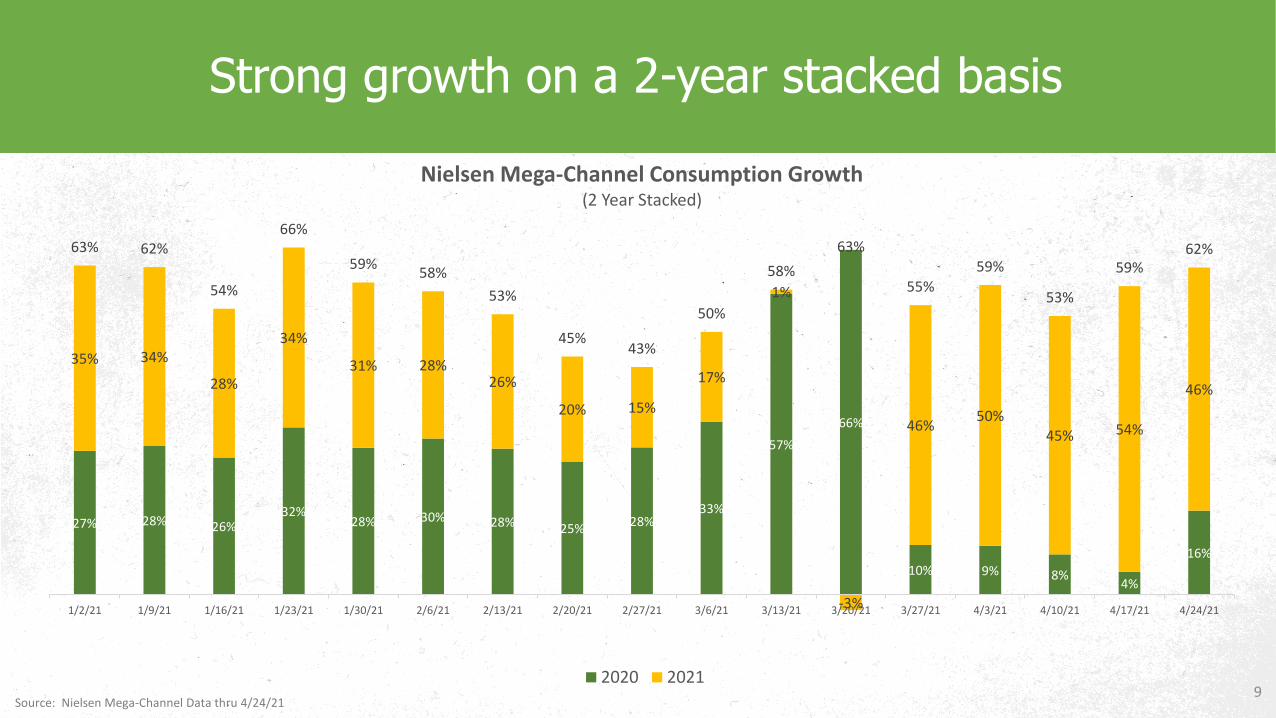
Strong growth on a 2-year stacked basis
Source: Nielsen Mega-Channel Data thru 4/24/21
27% 28% 26%32%
28% 30% 28% 25%28%
33%
57%
66%
10% 9% 8%4%
16%
35% 34%
28%
34%
31% 28%26%
20% 15%
17%
1%
-3%
46%50%
45% 54%
46%
63% 62%
54%
66%
59%58%
53%
45%43%
50%
58%
63%
55%
59%
53%
59%62%
1/2/21 1/9/21 1/16/21 1/23/21 1/30/21 2/6/21 2/13/21 2/20/21 2/27/21 3/6/21 3/13/21 3/20/21 3/27/21 4/3/21 4/10/21 4/17/21 4/24/21
Nielsen Mega-Channel Consumption Growth(2 Year Stacked)
2020 2021

10
Building meaningful share of the category
10.610.1 10.2 10.0
5.6 5.4 5.5 5.5
4.7 4.6 4.7 4.7
2.4 2.6 2.6 2.5
4wk 13wk 26wk 52wk
Freshpet Share of Wet + Dry Dog
Freshpet $ Share of Wet & Dry Dog
Total US Food Total US xAOC Mega-Channel Pet Superstore
Source: Nielsen Mega-Channel Data thru 3/27/21
-$25
$25
$75
$125
$175
$225
$275
Fres
hp
et T
ota
l RFG
Pu
rin
a O
NE
Dry
Do
g Fo
od
Blu
e B
uff
alo
Dry
Do
g Fo
od
Ces
ar W
et
Do
g Fo
od
Rac
hae
l Ray
Dry
Do
g Fo
od
Pu
rin
a B
ene
ful D
ry D
og
Ped
igre
e D
ry D
og
Foo
d
Ped
igre
e W
et D
og
Foo
d
Pri
vate
Lab
el D
ry D
og
IAM
S D
ry D
og
Foo
d
Pu
rin
a D
og
Ch
ow
Dry
Do
g Fo
od
Blu
e B
uff
alo
Wet
Do
g Fo
od
Ben
efu
l Wet
Do
g
Kib
ble
& B
its
Dry
Do
g Fo
od
Pri
vate
Lab
el W
et
Do
g Fo
od
Pu
rin
a O
NE
We
t D
og
Foo
d
Pu
rin
a A
lpo
Dry
Do
g
Nat
ure
s R
eci
pe
Dry
Do
g
Rac
hae
l Ray
We
t D
og
Foo
d
Pu
rin
a M
ois
t &
Me
aty
Dry
Do
g Fo
od
Nu
tro
Dry
Do
g Fo
od
Alp
o W
et
Do
g Fo
od
Pu
rin
a P
up
py
Ch
ow
Nat
ure
's R
ecip
e W
et D
og
Pu
rin
a B
eyo
nd
Wet
Do
g Fo
od
Ces
ar D
ry D
og
Mill
ion
s
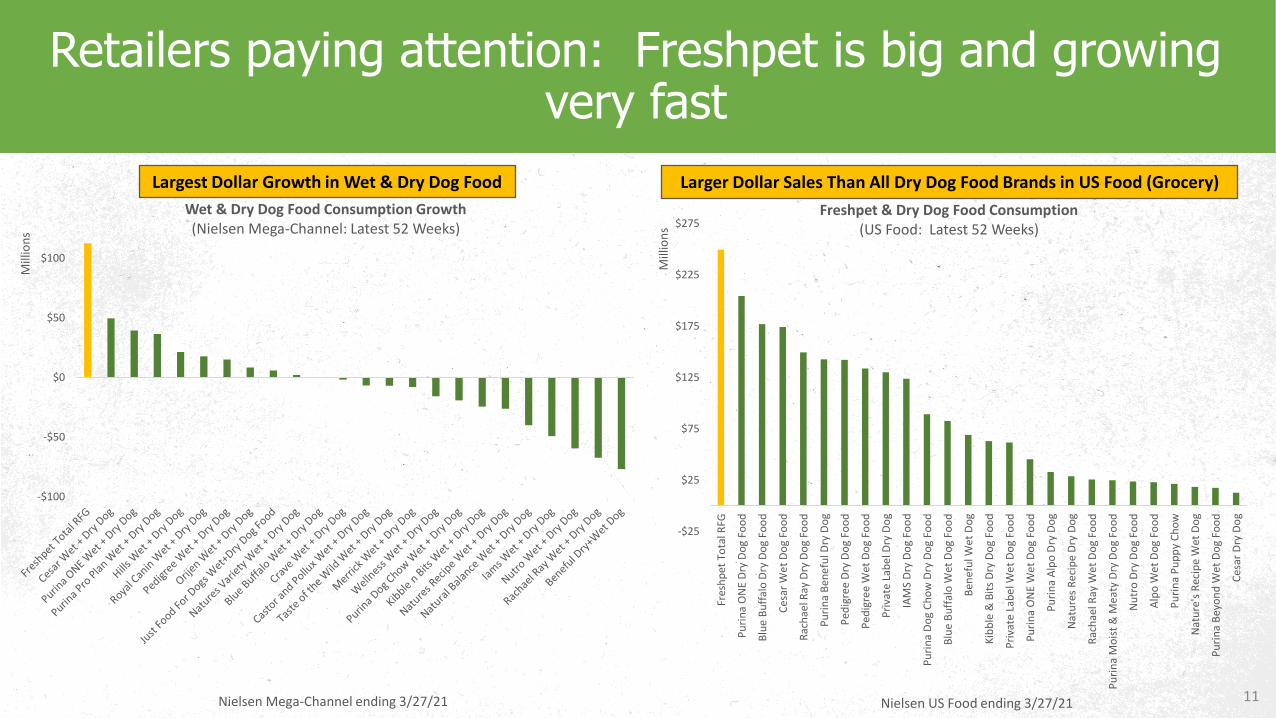
Freshpet & Dry Dog Food Consumption(US Food: Latest 52 Weeks)
-$100
-$50
$0
$50
$100
Mill
ion
s
Wet & Dry Dog Food Consumption Growth(Nielsen Mega-Channel: Latest 52 Weeks)
11
Retailers paying attention: Freshpet is big and growing very fast
Largest Dollar Growth in Wet & Dry Dog Food Larger Dollar Sales Than All Dry Dog Food Brands in US Food (Grocery)
Nielsen Mega-Channel ending 3/27/21 Nielsen US Food ending 3/27/21
12
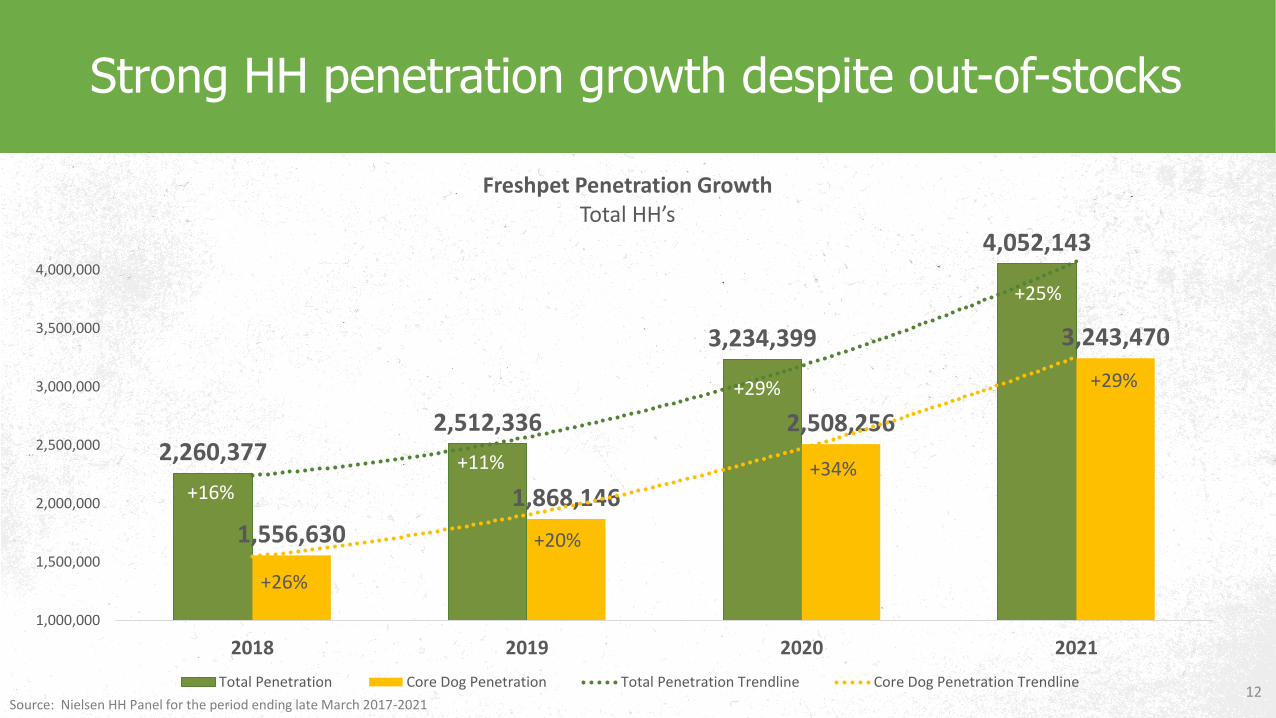
Strong HH penetration growth despite out-of-stocks
2,260,3772,512,336
3,234,399
4,052,143
1,556,630
1,868,146
2,508,256
3,243,470
1,000,000
1,500,000
2,000,000
2,500,000
3,000,000
3,500,000
4,000,000
2018 2019 2020 2021
Freshpet Penetration GrowthTotal HH’s
Total Penetration Core Dog Penetration Total Penetration Trendline Core Dog Penetration Trendline
+34%
+20%
+29%
+25%
+16%
Source: Nielsen HH Panel for the period ending late March 2017-2021
+26%
+29%
+11%
13
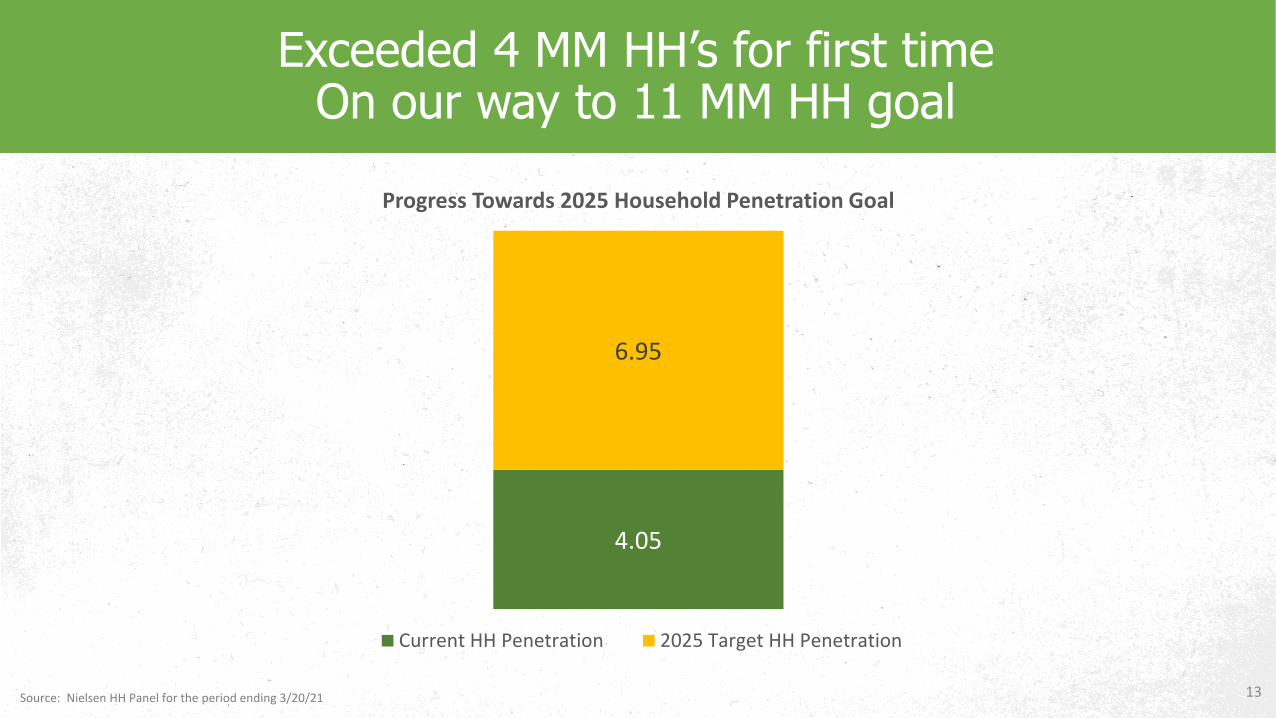
Exceeded 4 MM HH’s for first time On our way to 11 MM HH goal
4.05
6.95
Progress Towards 2025 Household Penetration Goal
Current HH Penetration 2025 Target HH Penetration
Source: Nielsen HH Panel for the period ending 3/20/21

14
Buying rate continues to grow despite out-of-stocks
Source: Nielsen HH Panel for the period ending late March 2018, 2019, 2020, 2021 and company internal data
$99.63
$115.92 $115.53$119.36
$123.44
$138.57$135.48 $136.99
$60.00
$70.00
$80.00
$90.00
$100.00
$110.00
$120.00
$130.00
$140.00
2018 2019 2020 2021
Freshpet Buying Rate
Total Buying Rate Core Dog Buying Rate
+1%
+3%+0%
+12% -2%
+6%
+16% +0%
15
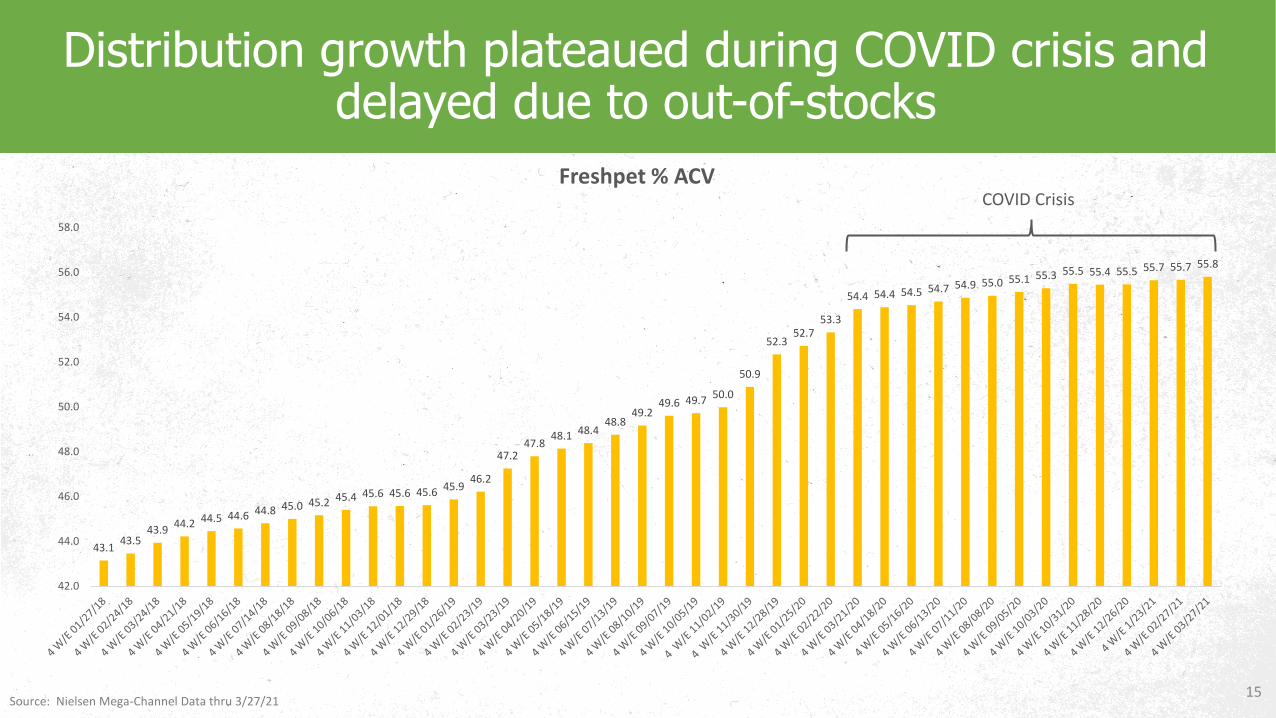
Distribution growth plateaued during COVID crisis and delayed due to out-of-stocks
43.143.5
43.944.2 44.5 44.6 44.8 45.0 45.2 45.4 45.6 45.6 45.6 45.9
46.2
47.247.8
48.1 48.448.8
49.249.6 49.7 50.0
50.9
52.352.7
53.3
54.4 54.4 54.5 54.7 54.9 55.0 55.1 55.3 55.5 55.4 55.5 55.7 55.7 55.8
42.0
44.0
46.0
48.0
50.0
52.0
54.0
56.0
58.0
Freshpet % ACV
Source: Nielsen Mega-Channel Data thru 3/27/21
COVID Crisis
16
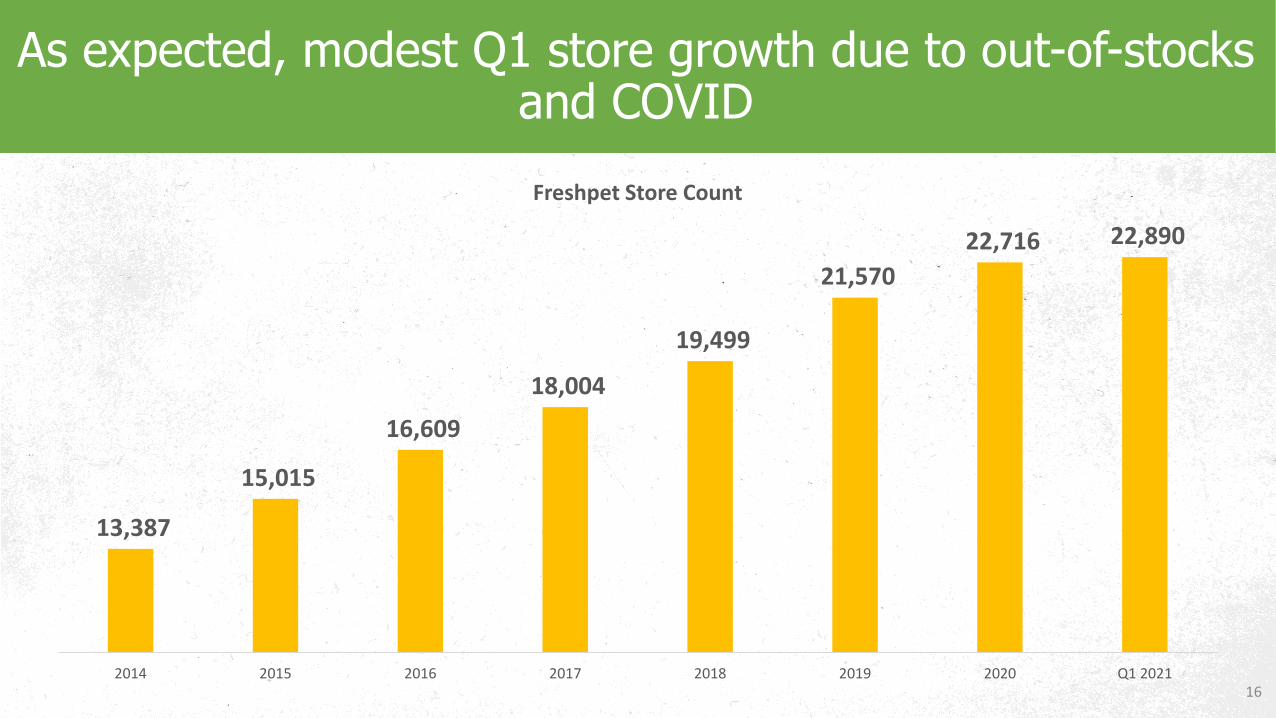
As expected, modest Q1 store growth due to out-of-stocks and COVID
13,387
15,015
16,609
18,004
19,499
21,570
22,716 22,890
2014 2015 2016 2017 2018 2019 2020 Q1 2021
Freshpet Store Count
17
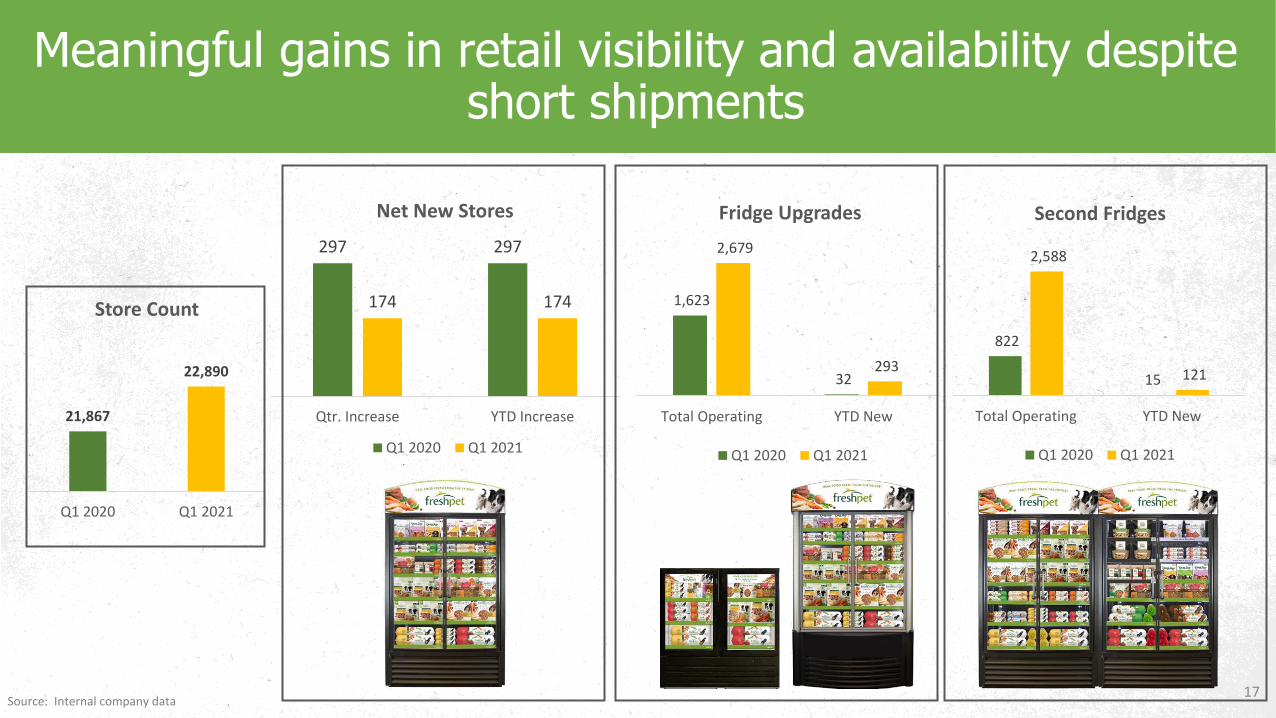
Meaningful gains in retail visibility and availability despite short shipments
297 297
174 174
Qtr. Increase YTD Increase
Net New Stores
Q1 2020 Q1 2021
1,623
32
2,679
293
Total Operating YTD New
Fridge Upgrades
Q1 2020 Q1 2021
822
15
2,588
121
Total Operating YTD New
Second Fridges
Q1 2020 Q1 2021
21,867
22,890
Q1 2020 Q1 2021
Store Count
Source: Internal company data
18
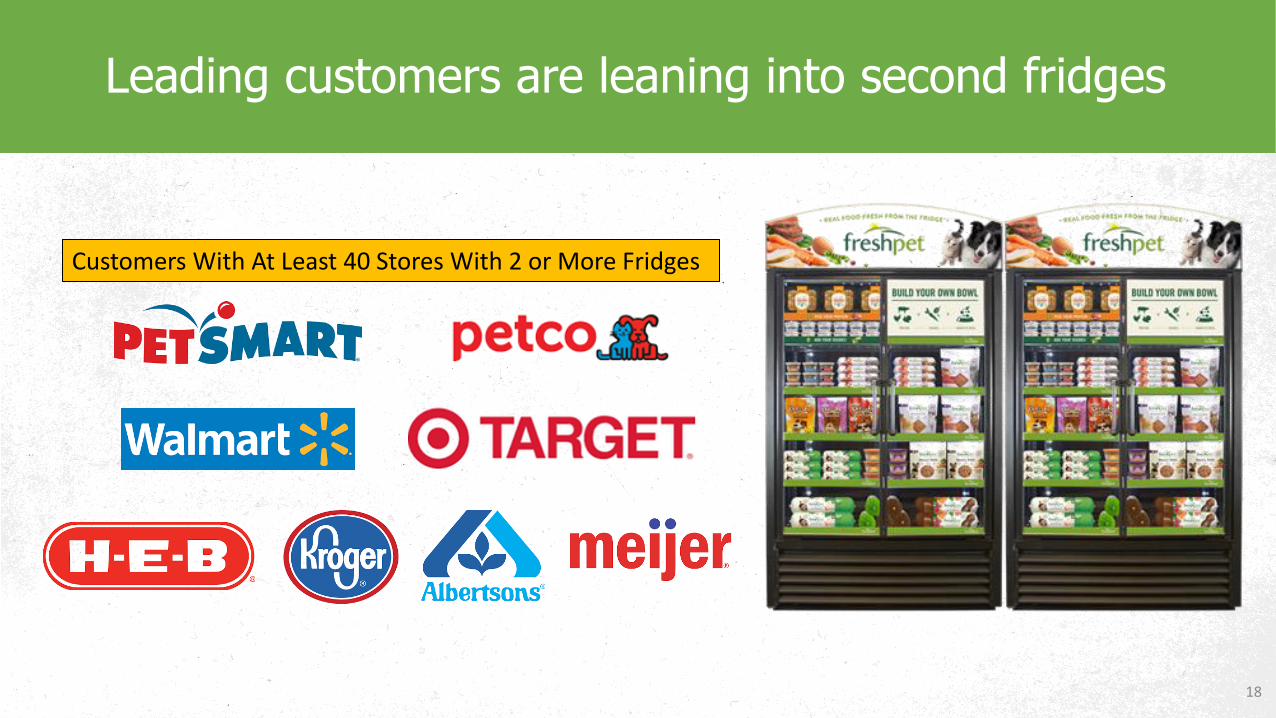
Leading customers are leaning into second fridges
Customers With At Least 40 Stores With 2 or More Fridges
19
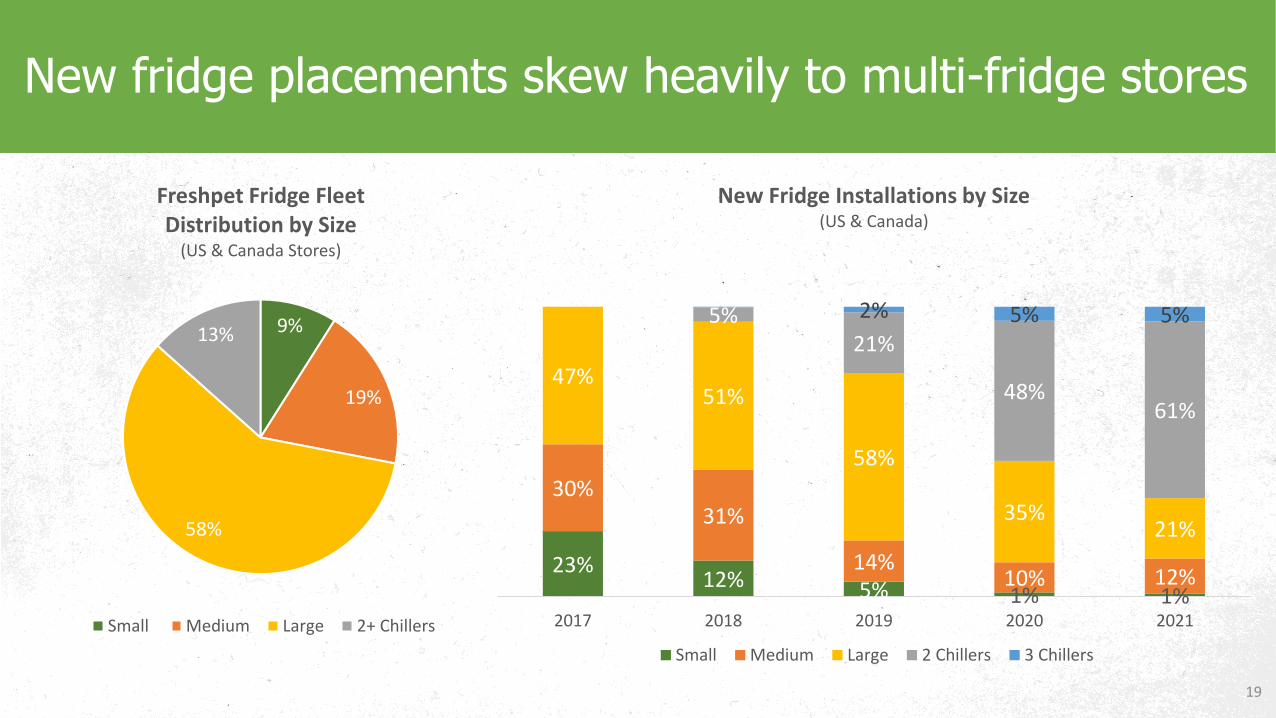
New fridge placements skew heavily to multi-fridge stores
9%
19%
58%
13%
Freshpet Fridge FleetDistribution by Size
(US & Canada Stores)
Small Medium Large 2+ Chillers
23%12% 5% 1% 1%
30%31%
14%10% 12%
47%51%
58%
35%21%
5%21%
48%61%
2% 5% 5%
2017 2018 2019 2020 2021
New Fridge Installations by Size(US & Canada)
Small Medium Large 2 Chillers 3 Chillers
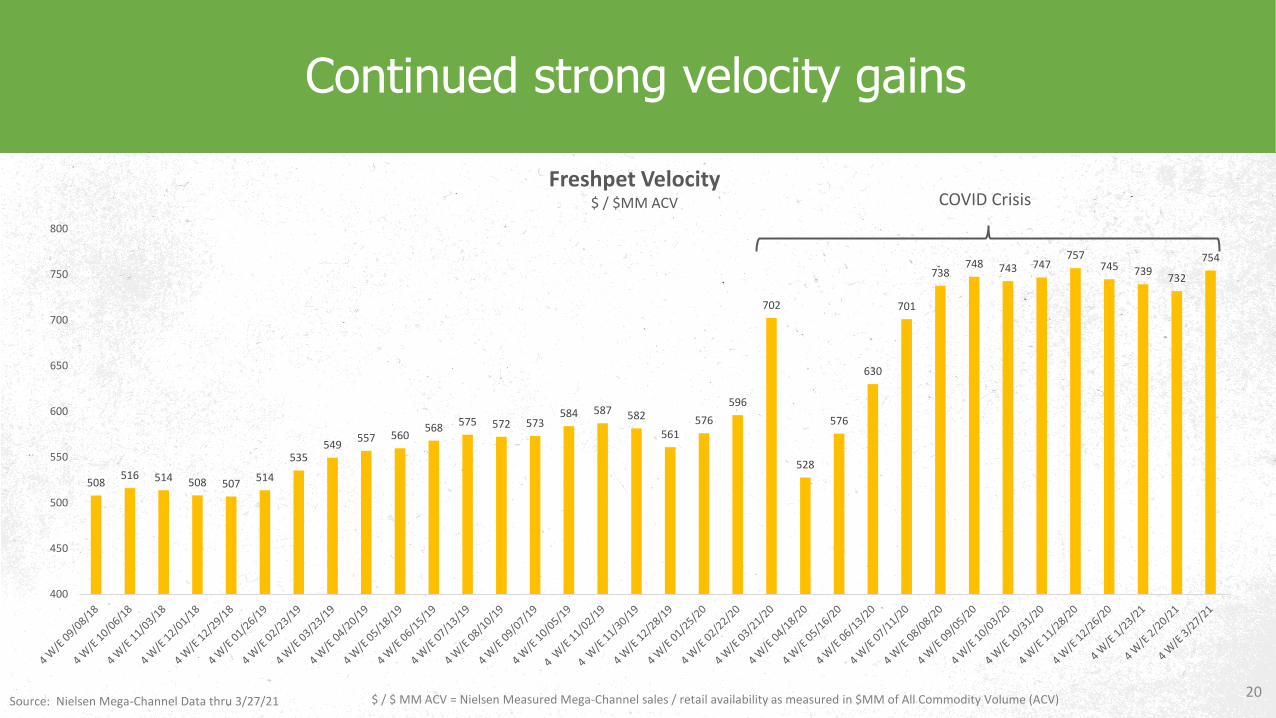
508516 514 508 507
514
535549
557 560568 575 572 573
584 587 582
561576
596
702
528
576
630
701
738748 743 747
757745 739
732
754
400
450
500
550
600
650
700
750
800
Freshpet Velocity$ / $MM ACV
20
Continued strong velocity gains
COVID Crisis
$ / $ MM ACV = Nielsen Measured Mega-Channel sales / retail availability as measured in $MM of All Commodity Volume (ACV)Source: Nielsen Mega-Channel Data thru 3/27/21

21
Q1 2021 Freshpet E-Com grew +156% vs. YA
29%Last Mile Delivery
62%Click & Collect
$6.2MM
9%Online
Fresh Delivery
6.3% 1Q 21 mix of e-commerce sales
91% of Sales Contribute to Brick
& Mortar
$-
$10,000.00
$20,000.00
$30,000.00
$40,000.00
$50,000.00
$60,000.00
$70,000.00
$80,000.00
$90,000.00
20
18
01
20
18
04
20
18
07
20
18
10
20
18
13
20
18
16
20
18
19
20
18
22
20
18
25
20
18
28
20
18
31
20
18
34
20
18
37
20
18
40
20
18
43
20
18
46
20
18
49
20
18
52
20
19
03
20
19
06
20
19
09
20
19
12
20
19
15
20
19
18
20
19
21
20
19
24
20
19
27
20
19
30
20
19
33
20
19
36
20
19
39
20
19
42
20
19
45
20
19
48
20
19
51
20
20
01
20
20
04
20
20
07
20
20
10
20
20
13
20
20
16
20
20
19
20
20
22
20
20
25
20
20
28
20
20
31
20
20
34
20
20
37
20
20
40
20
20
43
20
20
46
20
20
49
20
20
52
20
21
03
20
21
06
20
21
09
20
21
12
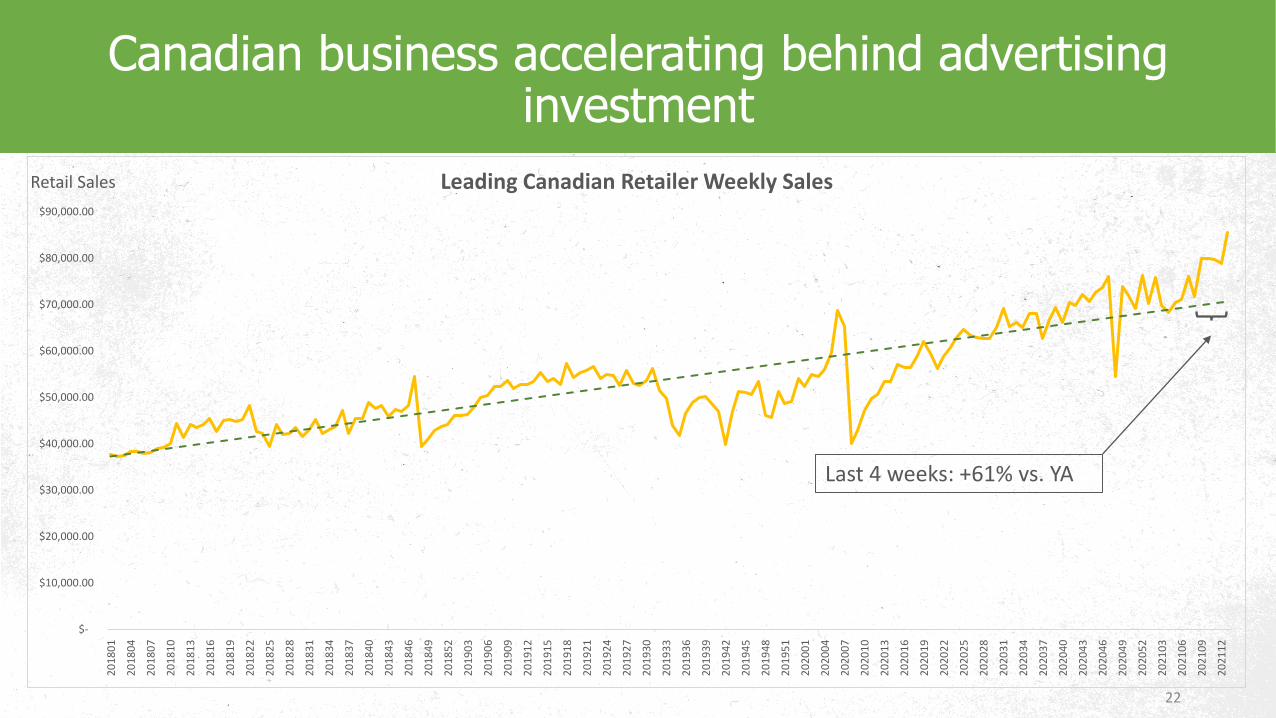
Leading Canadian Retailer Weekly Sales
22
Last 4 weeks: +61% vs. YA
Retail Sales
Canadian business accelerating behind advertising investment
£0
£2,000
£4,000
£6,000
£8,000
£10,000
£12,000
£14,000
£16,000
£18,000
£20,000
8-S
ep
22-
Sep
6-O
ct
20-
Oct
3-N
ov
17-
No
v
1-D
ec
15-
Dec
29-
Dec
12-
Jan
26-
Jan
9-F
eb
23-
Feb
8-M
ar
22-
Mar
5-A
pr
19-
Ap
r
3-M
ay
17-
May
31-
May
14-
Jun
28-
Jun
12-
Jul
26-
Jul
9-A
ug
23-
Au
g
6-S
ep
20-
Sep
4-O
ct
18-
Oct
1-N
ov
15-
No
v
29-
No
v
13-
Dec
27-
Dec
10-
Jan
24-
Jan
7-F
eb
21-
Feb
7-M
ar
21-
Mar
4-A
pr
18-
Ap
r
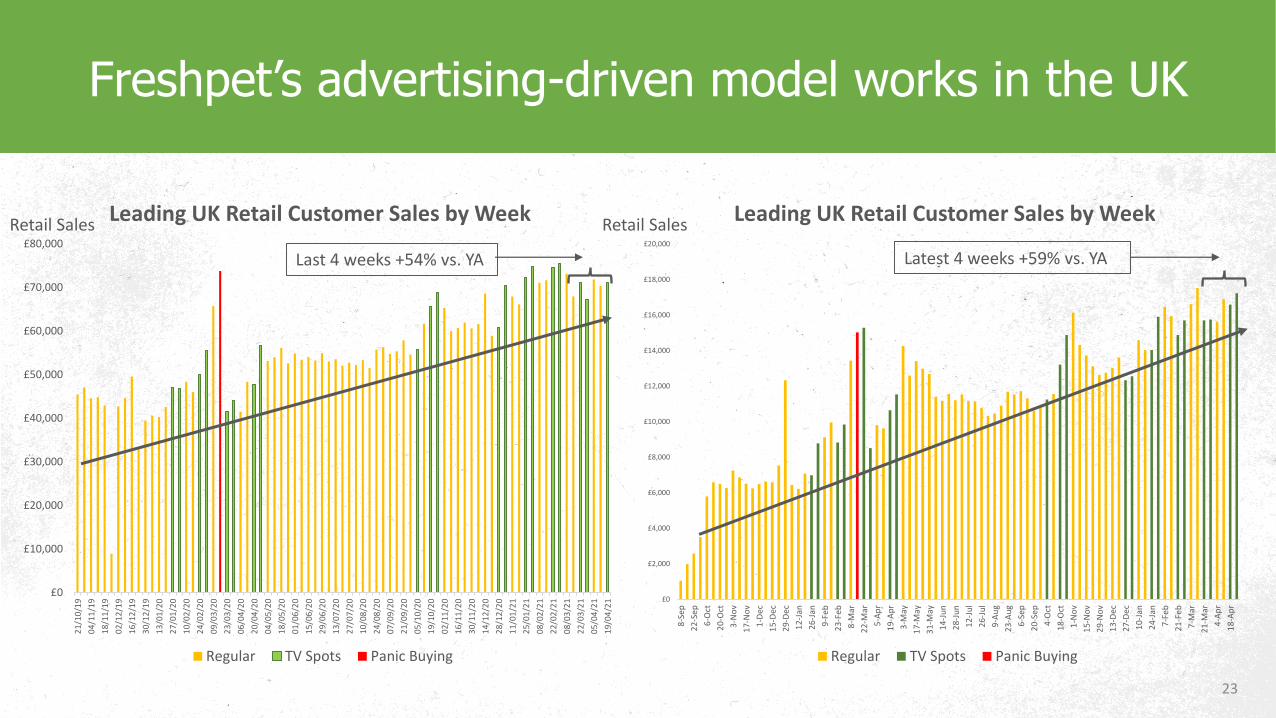
Leading UK Retail Customer Sales by Week
Regular TV Spots Panic Buying
£0
£10,000
£20,000
£30,000
£40,000
£50,000
£60,000
£70,000
£80,000
21/
10/1
9
04/
11/1
9
18/
11/1
9
02/
12/1
9
16/
12/1
9
30/
12/1
9
13/
01/2
0
27/
01/2
0
10/
02/2
0
24/
02/2
0
09/
03/2
0
23/
03/2
0
06/
04/2
0
20/
04/2
0
04/
05/2
0
18/
05/2
0
01/
06/2
0
15/
06/2
0
29/
06/2
0
13/
07/2
0
27/
07/2
0
10/
08/2
0
24/
08/2
0
07/
09/2
0
21/
09/2
0
05/
10/2
0
19/
10/2
0
02/
11/2
0
16/
11/2
0
30/
11/2
0
14/
12/2
0
28/
12/2
0
11/
01/2
1
25/
01/2
1
08/
02/2
1
22/
02/2
1
08/
03/2
1
22/
03/2
1
05/
04/2
1
19/
04/2
1
Leading UK Retail Customer Sales by Week
Regular TV Spots Panic Buying
23
Freshpet’s advertising-driven model works in the UK
Latest 4 weeks +59% vs. YALast 4 weeks +54% vs. YA
Retail Sales Retail Sales
24
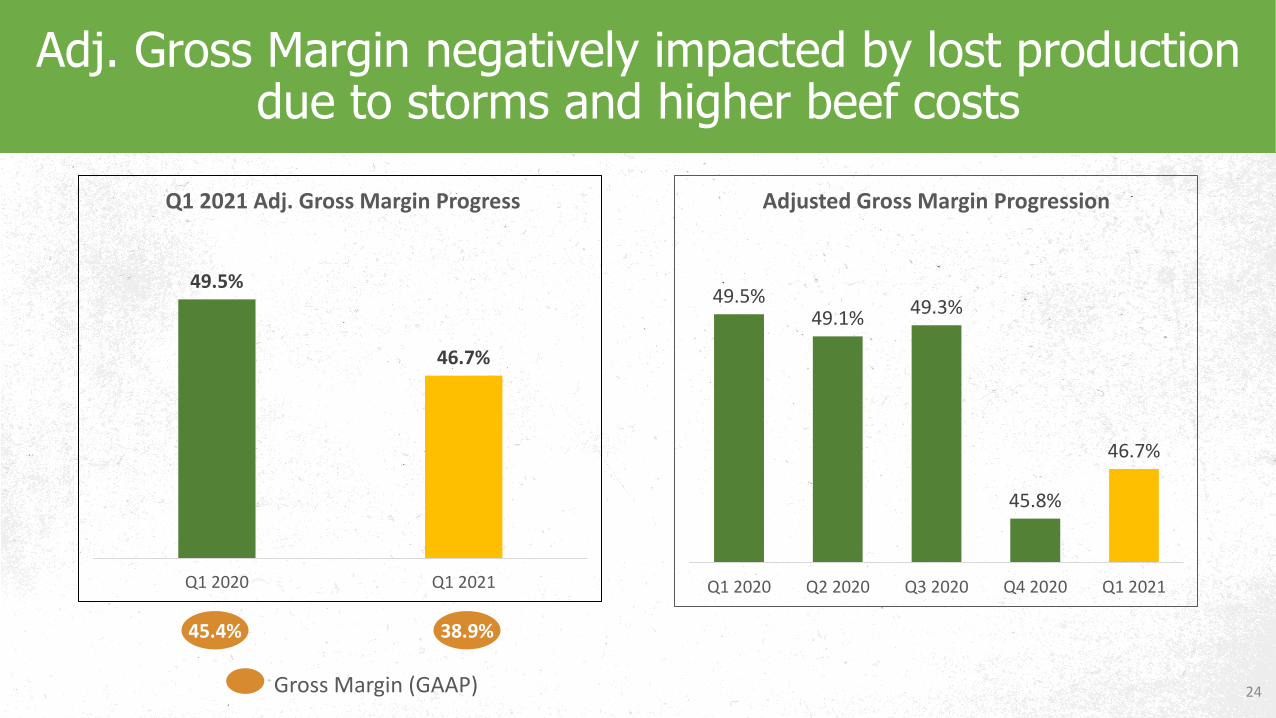
Adj. Gross Margin negatively impacted by lost production due to storms and higher beef costs
49.5%
46.7%
Q1 2020 Q1 2021
Q1 2021 Adj. Gross Margin Progress
Gross Margin (GAAP)
38.9%45.4%
49.5%49.1%
49.3%
45.8%
46.7%
Q1 2020 Q2 2020 Q3 2020 Q4 2020 Q1 2021
Adjusted Gross Margin Progression
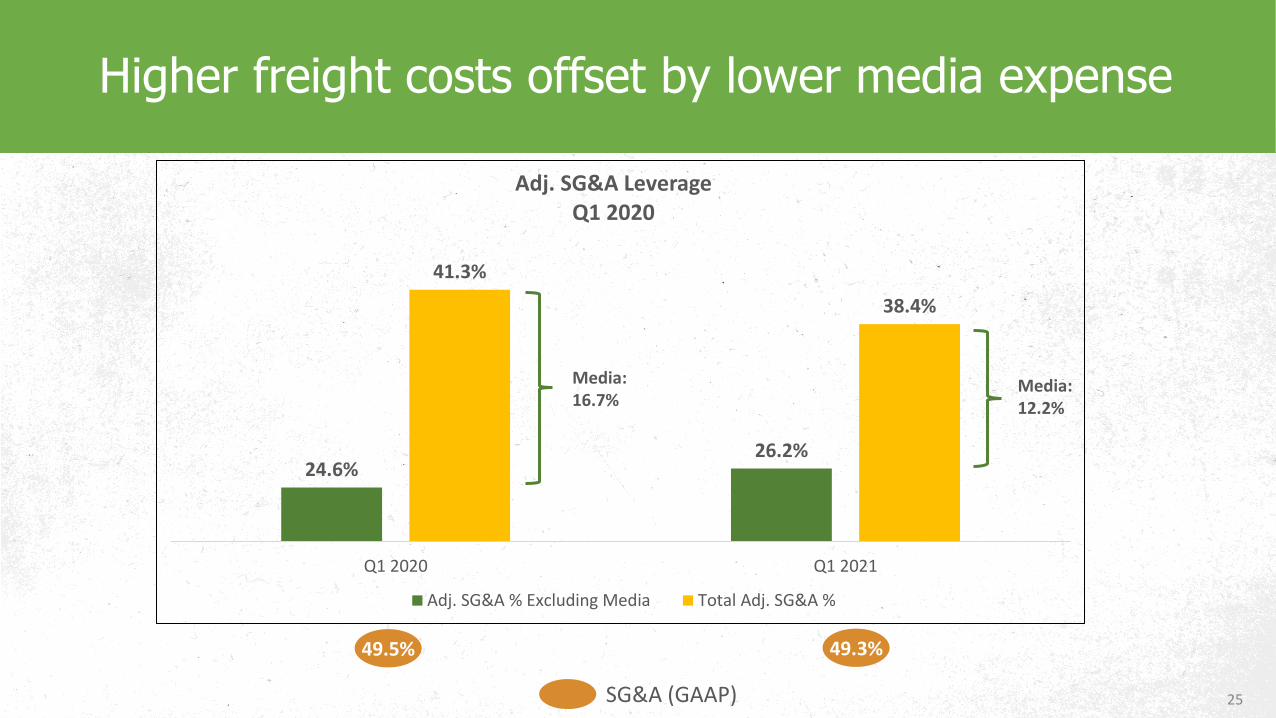
24.6%26.2%
41.3%
38.4%
Q1 2020 Q1 2021
Adj. SG&A Leverage Q1 2020
Adj. SG&A % Excluding Media Total Adj. SG&A %
25
Higher freight costs offset by lower media expense
Media: 12.2%
Media: 16.7%
49.3%49.5%
SG&A (GAAP)
26
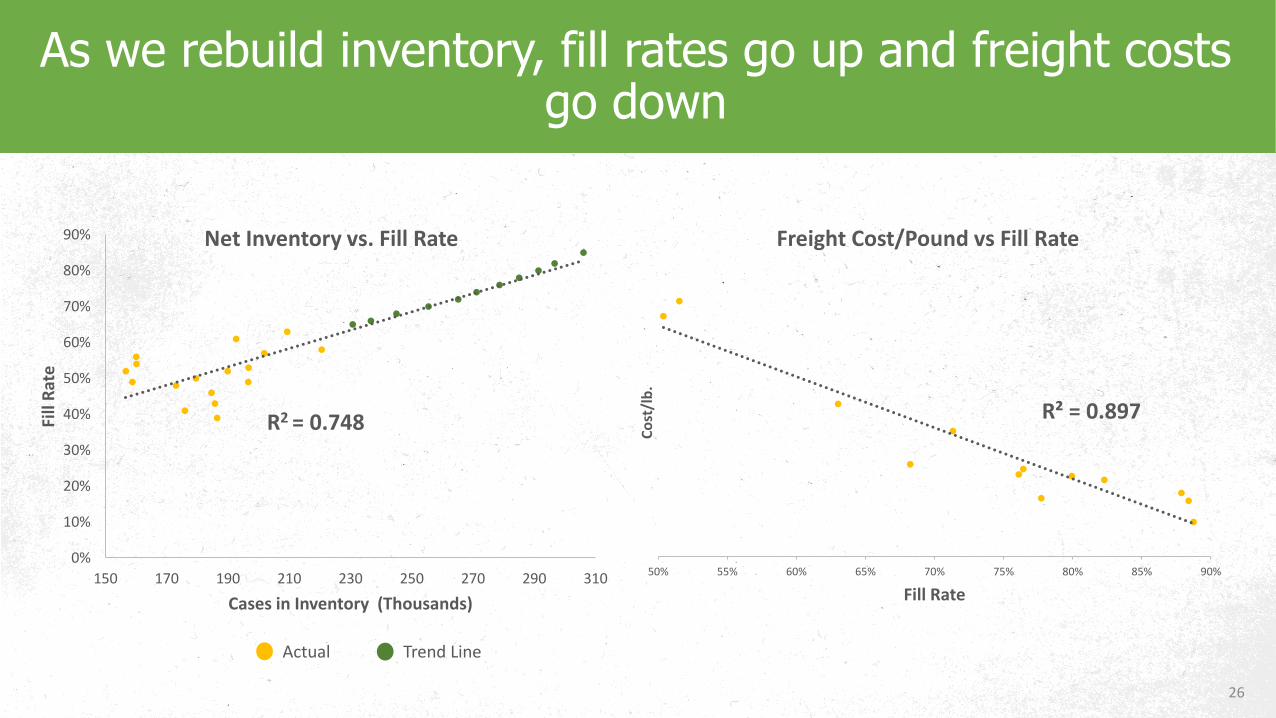
As we rebuild inventory, fill rates go up and freight costs go down
0%
10%
20%
30%
40%
50%
60%
70%
80%
90%
150 170 190 210 230 250 270 290 310
Fill
Rat
e
Cases in Inventory (Thousands)
Net Inventory vs. Fill Rate
Actual Trend Line
R2 = 0.748 R² = 0.897
50% 55% 60% 65% 70% 75% 80% 85% 90%
Co
st/l
b.
Fill Rate
Freight Cost/Pound vs Fill Rate

Guidance

28
2021 Guidance Re-Affirmed
2020 2021 % Change
Net Sales $318.8 >$430 +35%
Adjusted EBITDA $46.9 >$61 +30%
$ in Millions
• ERP Conversion: Tentatively targeted for 10/1/21
• COVID Addback: Anticipating $2.0 million in COVID-related costs in 2021 until broadscale vaccination has occurred – currently projected to occur within Q3
29
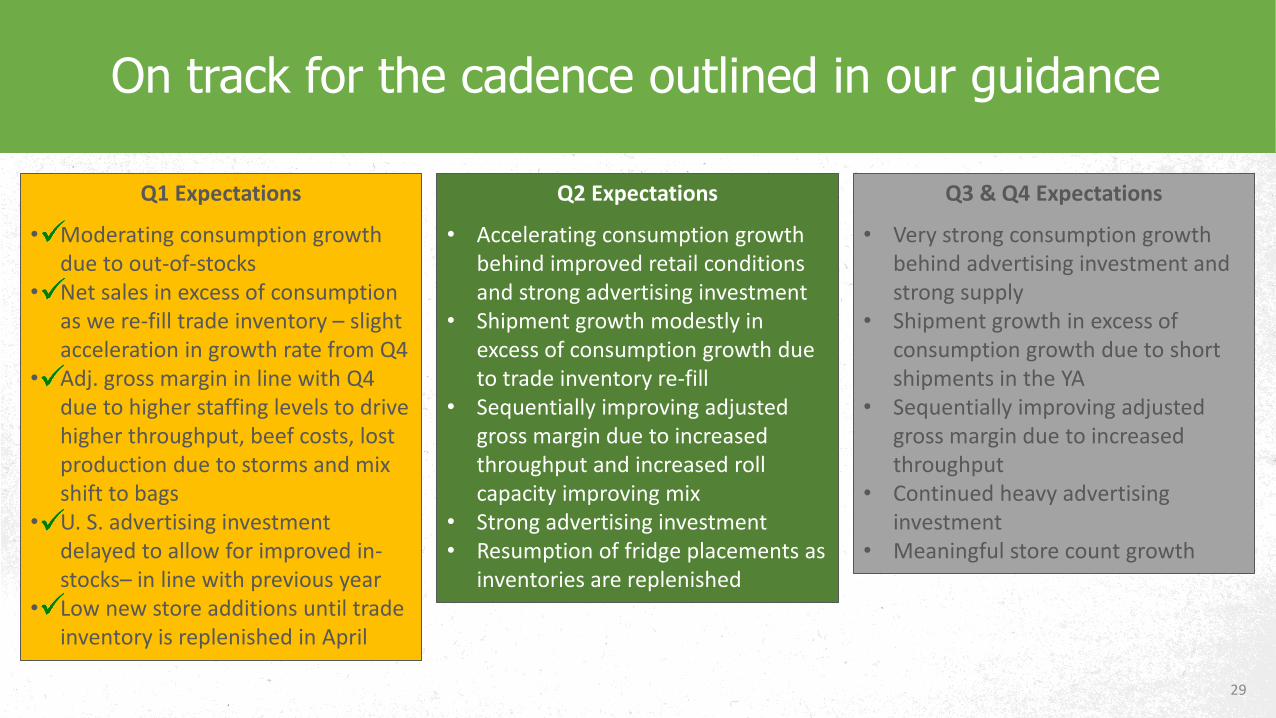
On track for the cadence outlined in our guidance
Q1 Expectations
• Moderating consumption growth due to out-of-stocks
• Net sales in excess of consumption as we re-fill trade inventory – slight acceleration in growth rate from Q4
• Adj. gross margin in line with Q4 due to higher staffing levels to drive higher throughput, beef costs, lost production due to storms and mix shift to bags
• U. S. advertising investment delayed to allow for improved in-stocks– in line with previous year
• Low new store additions until trade inventory is replenished in April
Q2 Expectations
• Accelerating consumption growth behind improved retail conditions and strong advertising investment
• Shipment growth modestly in excess of consumption growth due to trade inventory re-fill
• Sequentially improving adjusted gross margin due to increased throughput and increased roll capacity improving mix
• Strong advertising investment• Resumption of fridge placements as
inventories are replenished
Q3 & Q4 Expectations
• Very strong consumption growth behind advertising investment and strong supply
• Shipment growth in excess of consumption growth due to short shipments in the YA
• Sequentially improving adjusted gross margin due to increased throughput
• Continued heavy advertising investment
• Meaningful store count growth
30
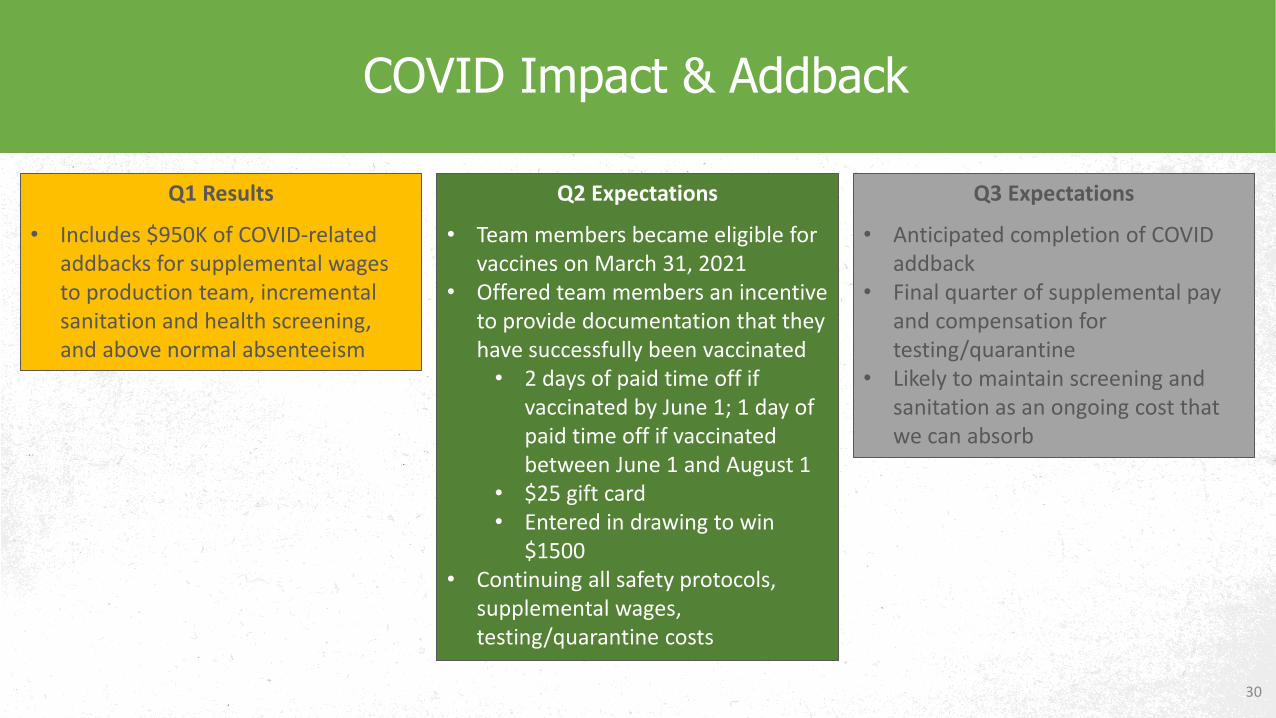
COVID Impact & Addback
Q1 Results
• Includes $950K of COVID-related addbacks for supplemental wages to production team, incremental sanitation and health screening, and above normal absenteeism
Q2 Expectations
• Team members became eligible for vaccines on March 31, 2021
• Offered team members an incentive to provide documentation that they have successfully been vaccinated• 2 days of paid time off if
vaccinated by June 1; 1 day of paid time off if vaccinated between June 1 and August 1
• $25 gift card• Entered in drawing to win
$1500• Continuing all safety protocols,
supplemental wages, testing/quarantine costs
Q3 Expectations
• Anticipated completion of COVID addback
• Final quarter of supplemental pay and compensation for testing/quarantine
• Likely to maintain screening and sanitation as an ongoing cost that we can absorb
6,000,000
6,500,000
7,000,000
7,500,000
8,000,000
8,500,000
9,000,000
9,500,000
10,000,000
10,500,000
11,000,000
1/4/2020 2/4/2020 3/4/2020 4/4/2020 5/4/2020 6/4/2020 7/4/2020 8/4/2020 9/4/2020 10/4/2020 11/4/2020 12/4/2020 1/4/2021 2/4/2021 3/4/2021 4/4/2021
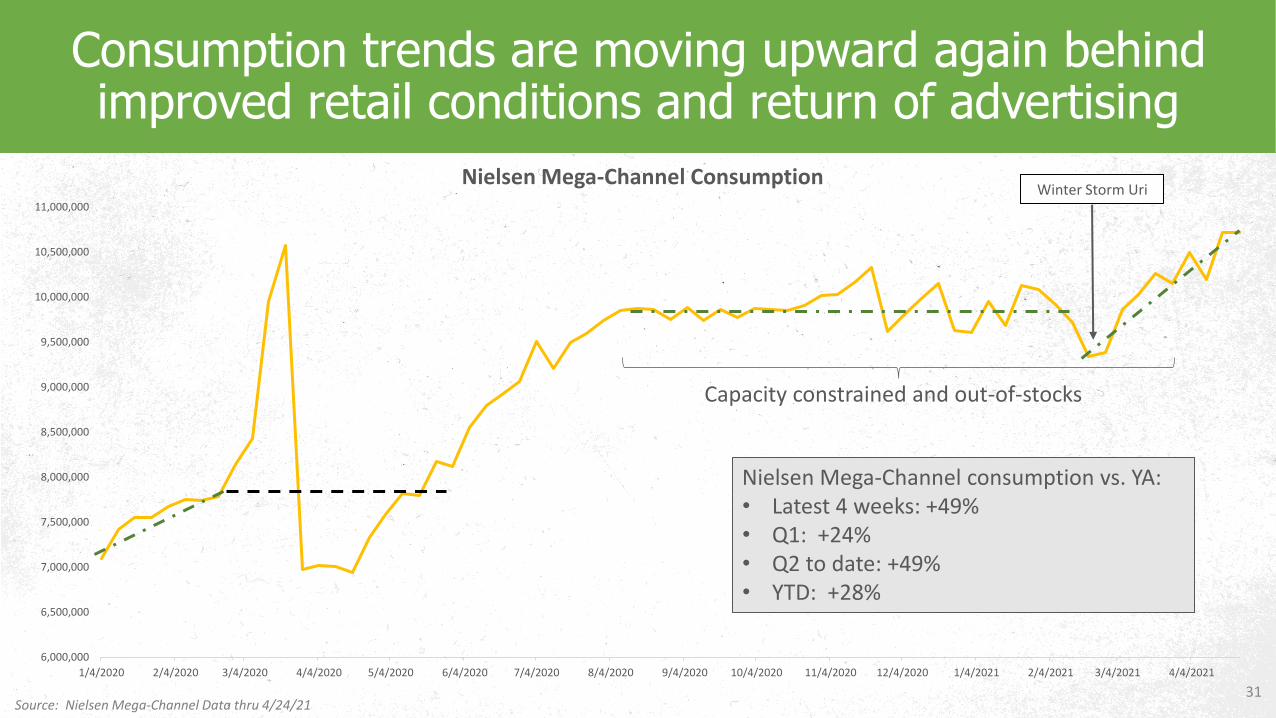
Nielsen Mega-Channel Consumption
31
Consumption trends are moving upward again behind improved retail conditions and return of advertising
Nielsen Mega-Channel consumption vs. YA:• Latest 4 weeks: +49%• Q1: +24%• Q2 to date: +49%• YTD: +28%
Capacity constrained and out-of-stocks
Source: Nielsen Mega-Channel Data thru 4/24/21
Winter Storm Uri
32
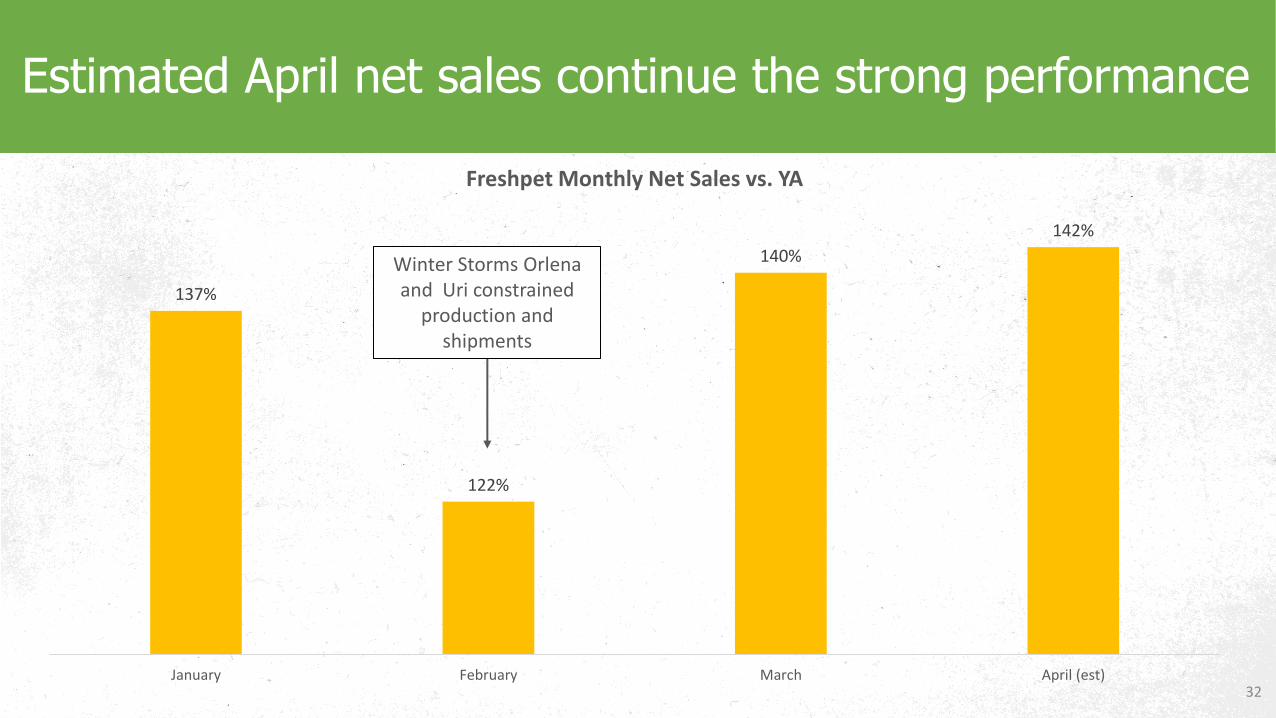
Estimated April net sales continue the strong performance
Winter Storms Orlena and Uri constrained
production and shipments
137%
122%
140%
142%
January February March April (est)
Freshpet Monthly Net Sales vs. YA
33
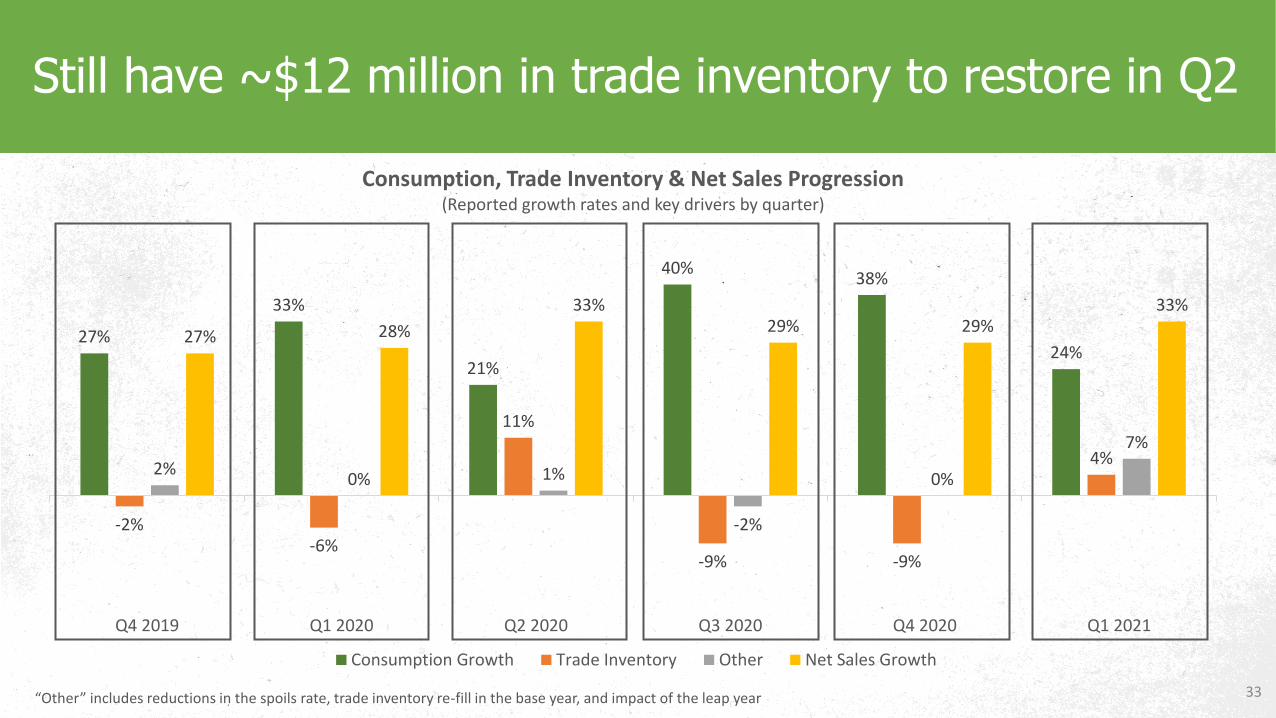
Still have ~$12 million in trade inventory to restore in Q2
27%
33%
21%
40%38%
24%
-2%-6%
11%
-9% -9%
4%2%
0% 1%
-2%
0%
7%
27% 28%
33%29% 29%
33%
Q4 2019 Q1 2020 Q2 2020 Q3 2020 Q4 2020 Q1 2021
Consumption, Trade Inventory & Net Sales Progression(Reported growth rates and key drivers by quarter)
Consumption Growth Trade Inventory Other Net Sales Growth
“Other” includes reductions in the spoils rate, trade inventory re-fill in the base year, and impact of the leap year

Progress Towards Improved Retail Conditions
200,000
250,000
300,000
350,000
400,000
450,000
500,000
550,000
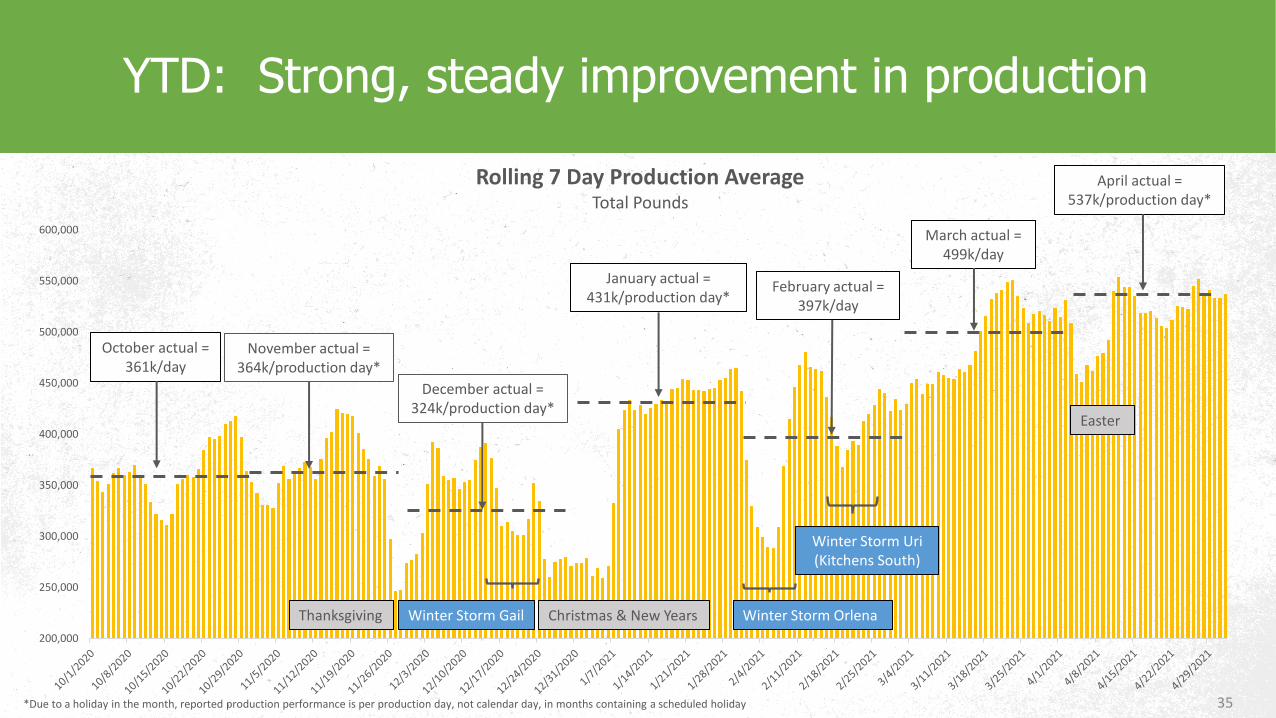
600,000
Rolling 7 Day Production AverageTotal Pounds
January actual = 431k/production day*
December actual = 324k/production day*
Winter Storm Orlena
Winter Storm Uri (Kitchens South)
February actual = 397k/day
March actual = 499k/day
35
YTD: Strong, steady improvement in production
Easter
April actual = 537k/production day*
*Due to a holiday in the month, reported production performance is per production day, not calendar day, in months containing a scheduled holiday
Winter Storm Gail Christmas & New YearsThanksgiving
November actual = 364k/production day*
October actual = 361k/day
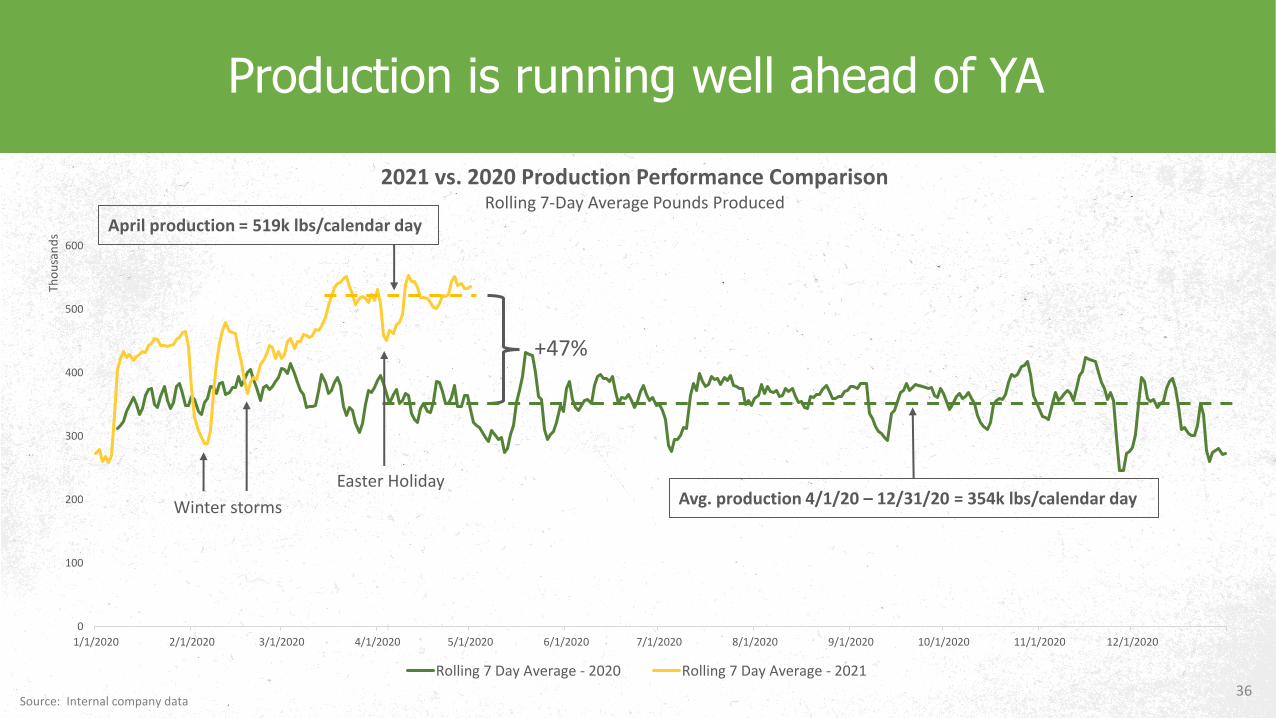
0
100
200
300
400
500
600
1/1/2020 2/1/2020 3/1/2020 4/1/2020 5/1/2020 6/1/2020 7/1/2020 8/1/2020 9/1/2020 10/1/2020 11/1/2020 12/1/2020
Tho
usa
nd
s
2021 vs. 2020 Production Performance ComparisonRolling 7-Day Average Pounds Produced
Rolling 7 Day Average - 2020 Rolling 7 Day Average - 2021
36
Production is running well ahead of YA
+47%
Avg. production 4/1/20 – 12/31/20 = 354k lbs/calendar day
April production = 519k lbs/calendar day
Easter Holiday
Winter storms
Source: Internal company data
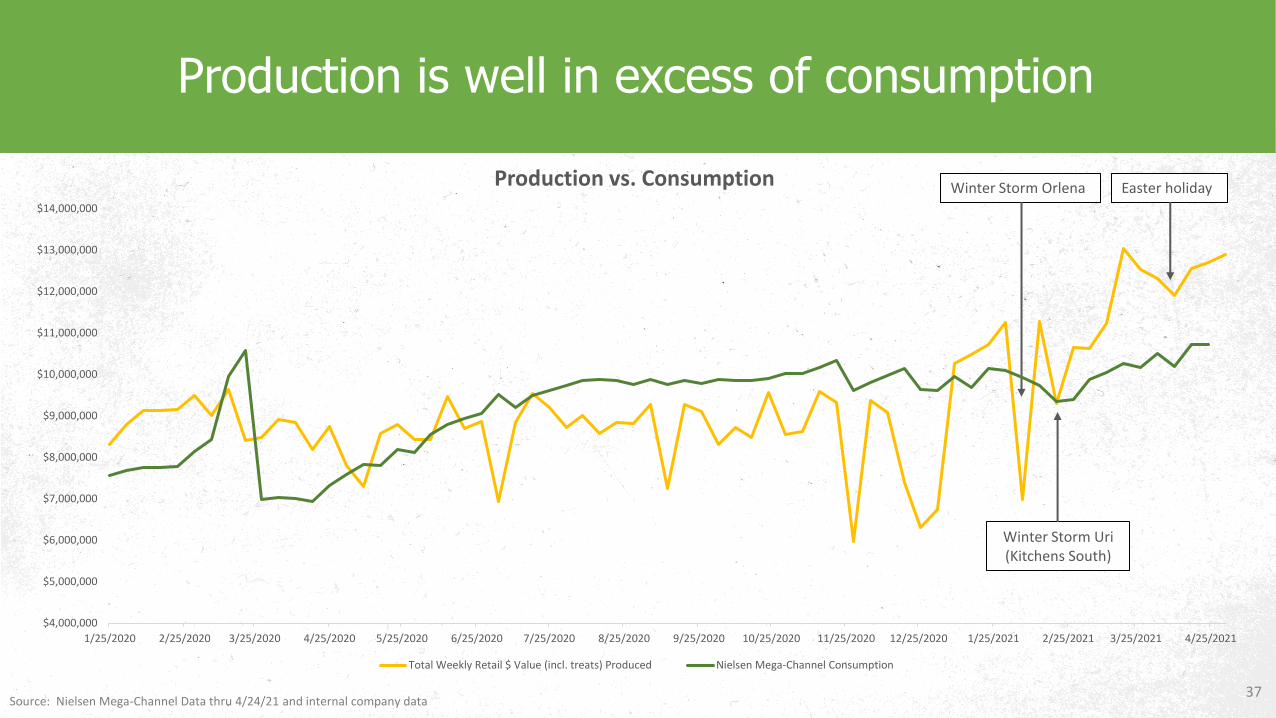
37
Production is well in excess of consumption
Winter Storm Orlena
Winter Storm Uri (Kitchens South)
Source: Nielsen Mega-Channel Data thru 4/24/21 and internal company data
Easter holiday
$4,000,000
$5,000,000
$6,000,000
$7,000,000
$8,000,000
$9,000,000
$10,000,000
$11,000,000
$12,000,000
$13,000,000
$14,000,000
1/25/2020 2/25/2020 3/25/2020 4/25/2020 5/25/2020 6/25/2020 7/25/2020 8/25/2020 9/25/2020 10/25/2020 11/25/2020 12/25/2020 1/25/2021 2/25/2021 3/25/2021 4/25/2021
Production vs. Consumption
Total Weekly Retail $ Value (incl. treats) Produced Nielsen Mega-Channel Consumption
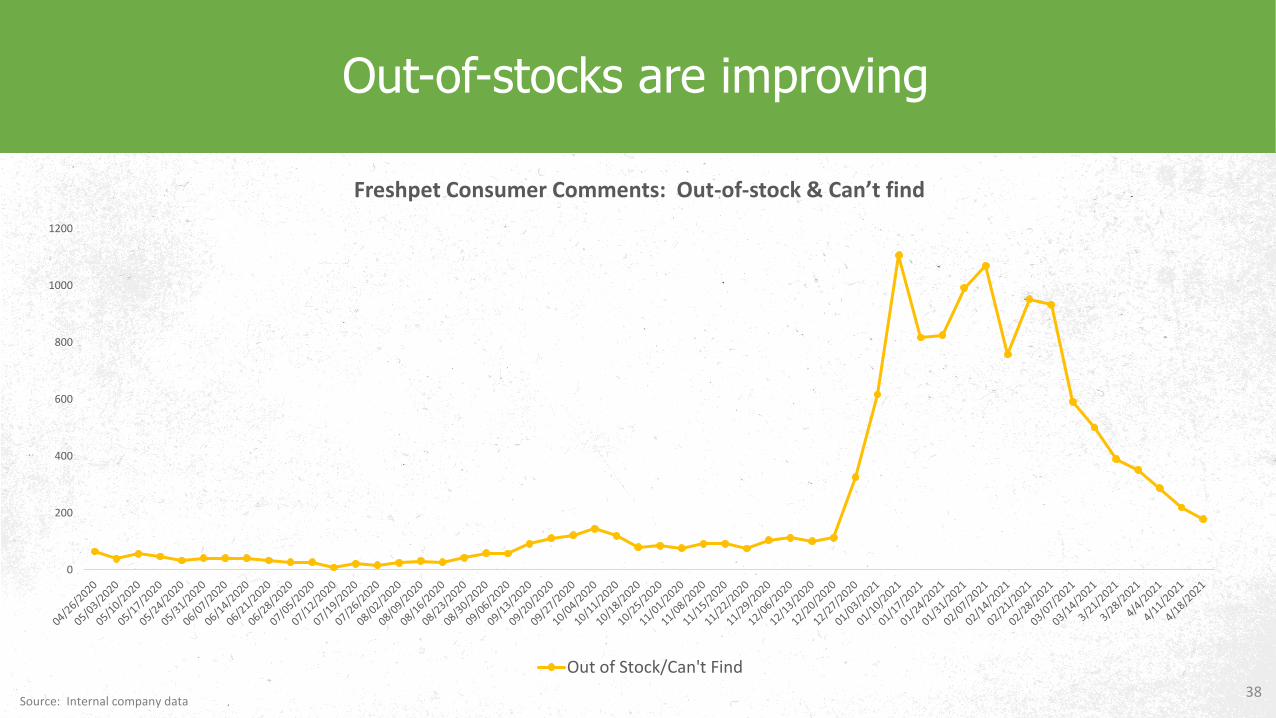
38
Out-of-stocks are improving
0
200
400
600
800
1000
1200
Freshpet Consumer Comments: Out-of-stock & Can’t find
Out of Stock/Can't Find
Source: Internal company data
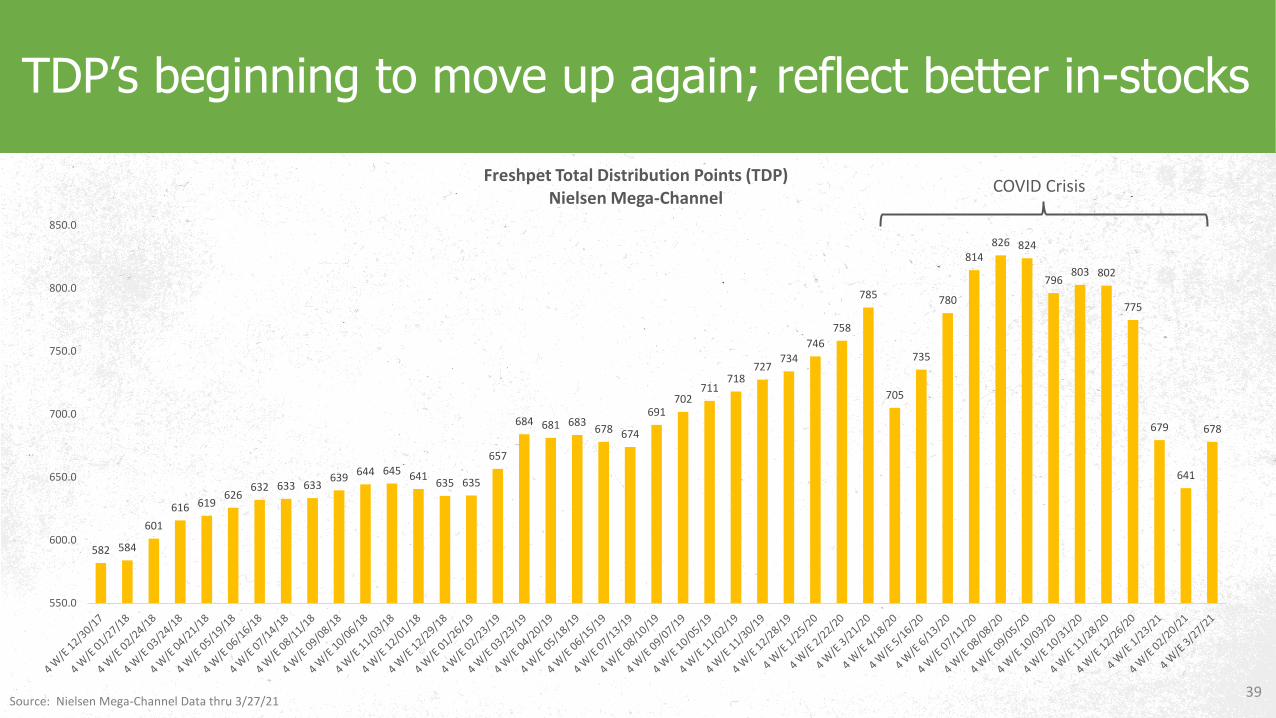
39
TDP’s beginning to move up again; reflect better in-stocks
582 584
601
616 619626
632 633 633639
644 645 641635 635
657
684 681 683678 674
691702
711718
727734
746
758
785
705
735
780
814826 824
796803 802
775
679
641
678
550.0
600.0
650.0
700.0
750.0
800.0
850.0
Freshpet Total Distribution Points (TDP)Nielsen Mega-Channel
Source: Nielsen Mega-Channel Data thru 3/27/21
COVID Crisis

40
Actively communicating with consumers via social media to explain the out-of-stocks
79% 77%81%
88% 87%
94%
80%86%
Jan. 2020 4/13/20 4/27/20 5/4/20 5/18/20 6/15/20 2/19/21 4/26/21
Freshpet Item Wanted Available On Last Shopping Trip
Posted on:
Source: FP Panel, n=389 FP Users
41
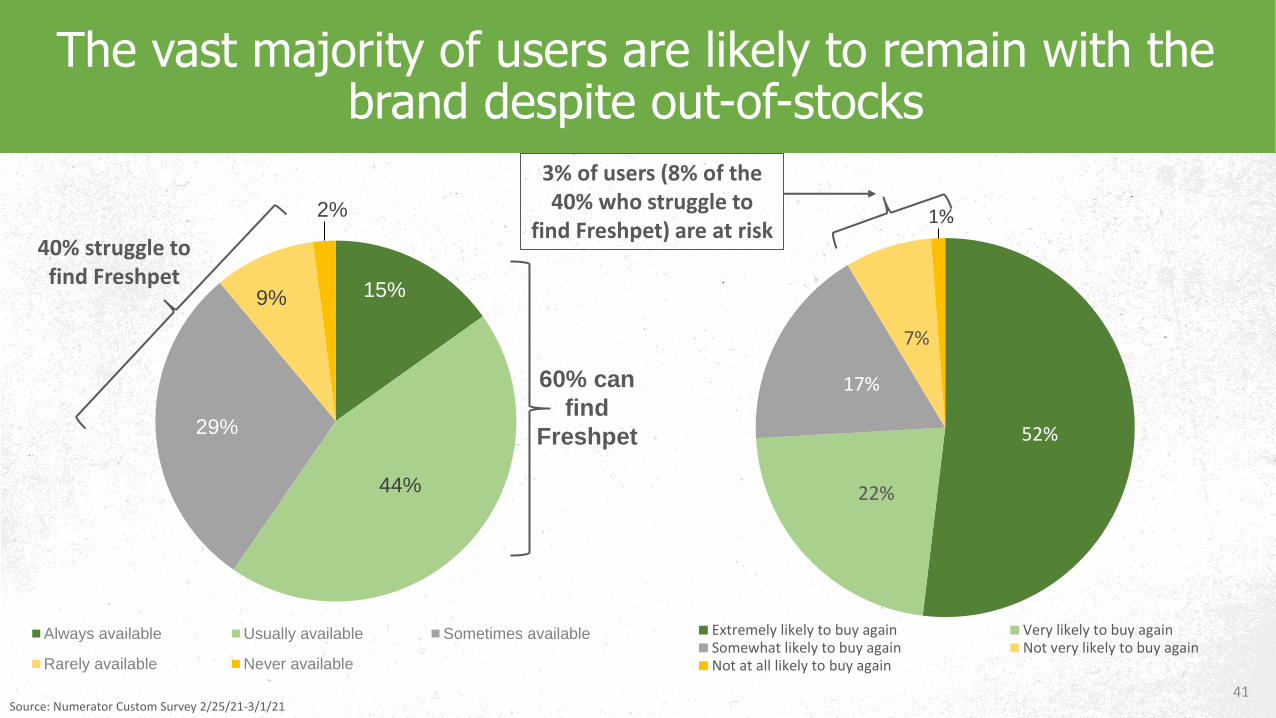
The vast majority of users are likely to remain with the brand despite out-of-stocks
15%
44%
29%
9%
2%
Always available Usually available Sometimes available
Rarely available Never available
60% can
find
Freshpet 52%
22%
17%
7%
1%
Extremely likely to buy again Very likely to buy againSomewhat likely to buy again Not very likely to buy againNot at all likely to buy again
40% struggle to find Freshpet
Source: Numerator Custom Survey 2/25/21-3/1/21
3% of users (8% of the 40% who struggle to
find Freshpet) are at risk
Projects to Increase Capacity
43
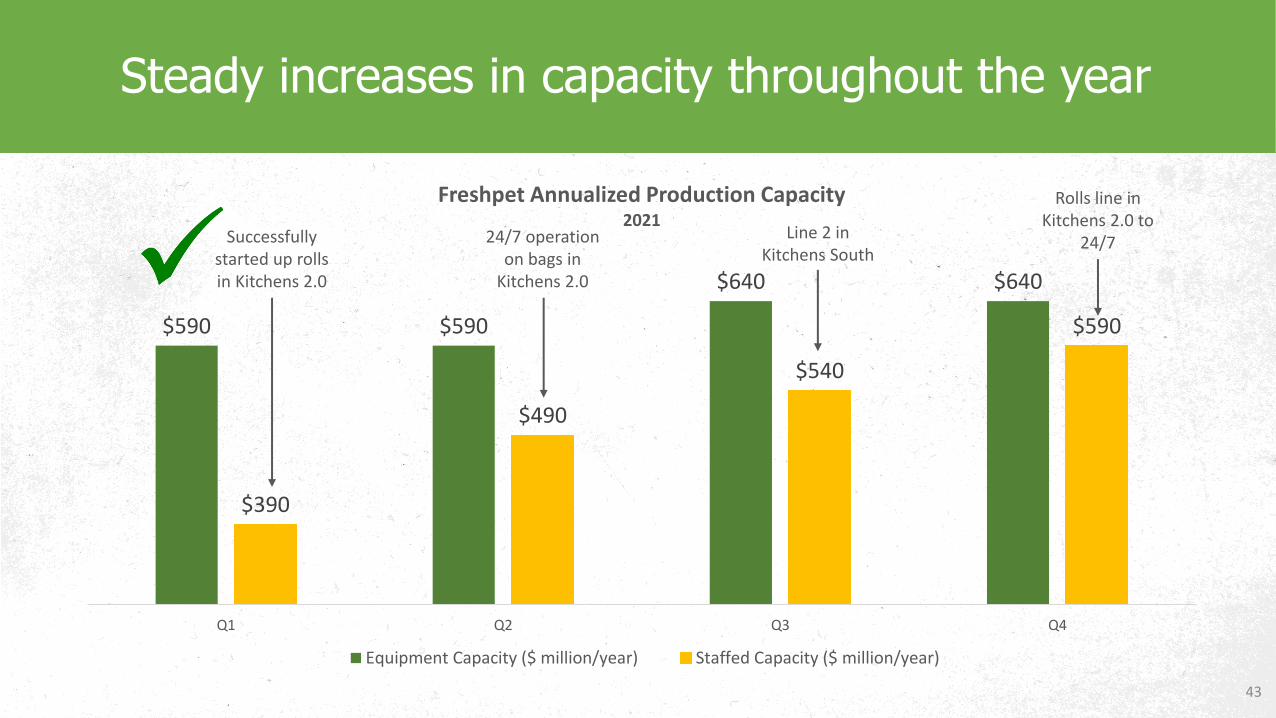
Steady increases in capacity throughout the year
$590 $590
$640 $640
$390
$490
$540
$590
Q1 Q2 Q3 Q4
Freshpet Annualized Production Capacity2021
Equipment Capacity ($ million/year) Staffed Capacity ($ million/year)
Successfully started up rolls in Kitchens 2.0
24/7 operation on bags in
Kitchens 2.0
Line 2 in Kitchens South
Rolls line in Kitchens 2.0 to
24/7
44
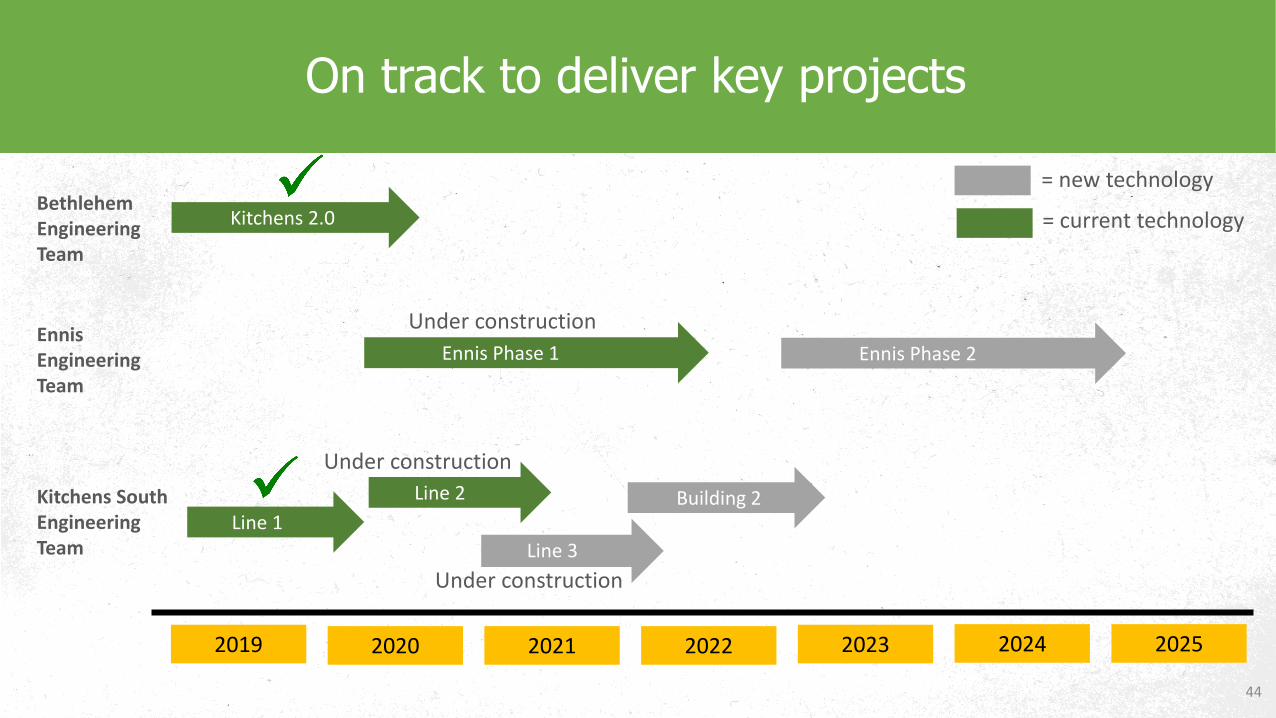
On track to deliver key projects
2019 2020 2021 2022 2023 2024 2025
Kitchens 2.0Bethlehem Engineering Team
Ennis Engineering Team
Ennis Phase 1
Kitchens South Engineering Team
Line 1 Phase 1
Line 2 Phase 1 Line 3
Building 2
Ennis Phase 2
= new technology
= current technology
Under construction
Under construction
Under construction

45
Almost $2 billion in net sales production capacity by 2025
$300
$50
$260$150
$400$300
$500
$300 $350
$610$760
$1,160
$1,460
$1,960
Kitchens 1.0 South Line #1 Kitchens 2.0 &Innovation Line
South Lines #2 & #3 Ennis Phase 1 Kitchens South Bldg. 2 Ennis Phase 2
Freshpet CapacityNet Sales Potential
New Capacity Cumulative Capacity
Won’t commit until 2023
Opens in 2023
Pulled forward one quarter
46
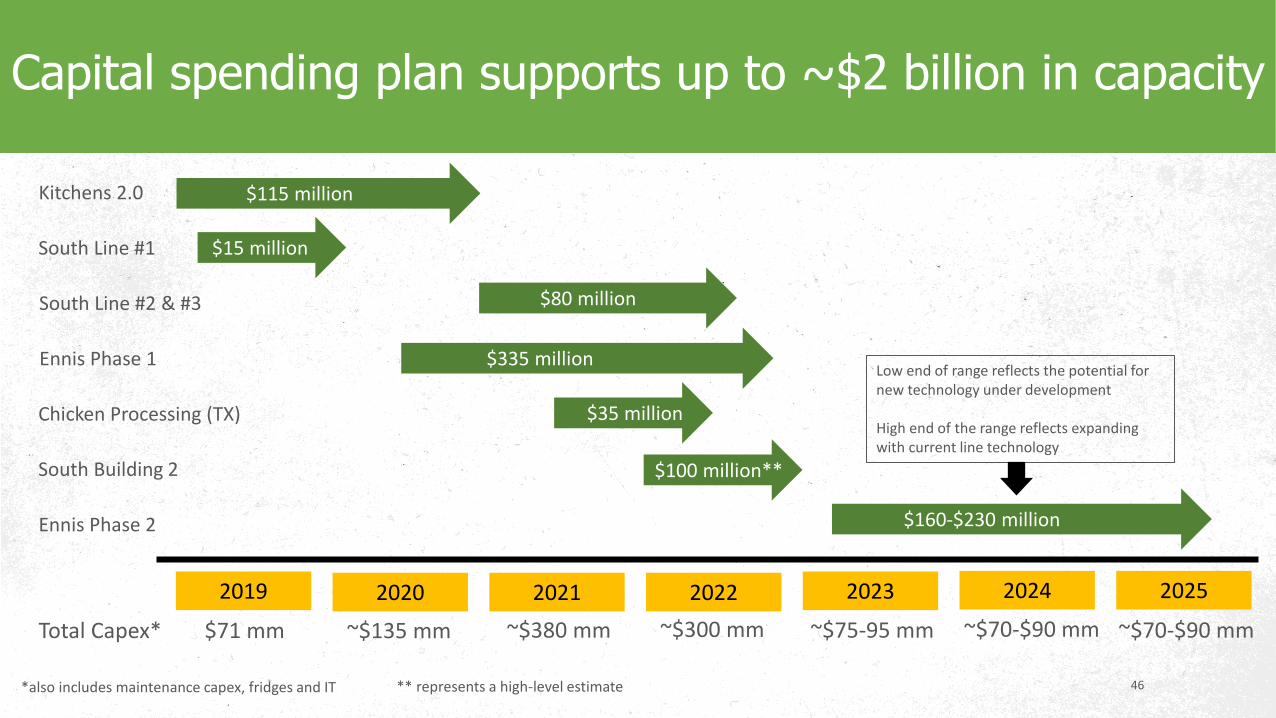
Capital spending plan supports up to ~$2 billion in capacity
$115 millionKitchens 2.0
2019
$15 millionSouth Line #1
Ennis Phase 1 $335 million
$160-$230 millionEnnis Phase 2
South Line #2 & #3 $80 million
Total Capex* $71 mm ~$135 mm ~$380 mm ~$300 mm ~$75-95 mm ~$70-$90 mm
*also includes maintenance capex, fridges and IT
2020 2021 2022 2023 2024 2025
~$70-$90 mm
Low end of range reflects the potential for new technology under development
High end of the range reflects expanding with current line technology
South Building 2 $100 million**
** represents a high-level estimate
Chicken Processing (TX) $35 million

47
Kitchens 2.0: Expanding shifts in Q2
48
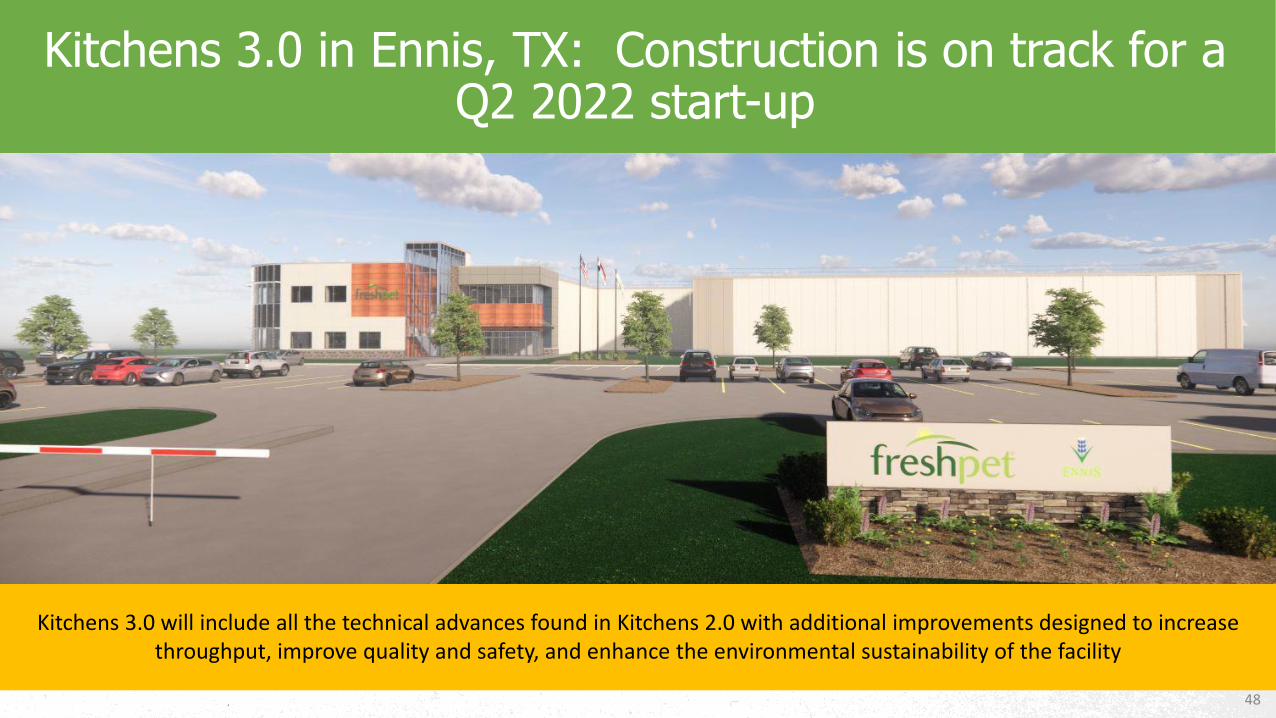
Kitchens 3.0 in Ennis, TX: Construction is on track for a Q2 2022 start-up
Kitchens 3.0 will include all the technical advances found in Kitchens 2.0 with additional improvements designed to increase throughput, improve quality and safety, and enhance the environmental sustainability of the facility

Appendix

51
52
53