q1 2019 sales - faurecia.com q1 sales vdef.pdf · q1 2019 sales –april 23, 2019 resilient sales...
TRANSCRIPT

Q1 2019 Sales – April 23, 2019
Q1 2019 SalesResilient sales in a challenging environment
Ex-currency outperformance of 580bps
Full-year guidance confirmed
Michel FAVRE, Group CFO
April 23, 2019

Q1 2019 Sales – April 23, 2019
Q1 2019 included a positive contribution from bolt-ons of €104.5m
As announced on February 18, Q1 2019 sales were impacted by the end of production of two Seating programs,
representing a combined negative effect of €(95)m vs. Q1 2018:
One for Daimler (GLE/GLS) in Cottondale (USA), representing a negative impact of €(56)m in Q1
One for PSA (Berlingo) in Vigo (Europe), representing a negative impact of €(39)m in Q1
Q1 2019 sales were also affected by the negative impact from the wind-down of our activities in Iran as from June 30, 2018
for an amount of €(9)m vs. Q1 2018
Fourth new Business Group “Faurecia Clarion Electronics” as from January 1, 2019:
In Q1, it only included sales from Coagent (consolidated as from January 1, 2018 and previously classified
within “Interiors”) and Parrot Automotive (sales consolidated as from January 1, 2019)
As from April 1, it will also include sales from Clarion
Q1 2019 Sales - Key Facts
2
Sales (in €m) Business Group Region Conso as from Q1 2019
Hug Engineering Clean Mobility Europe Q2 2018 13.6
JV with Wuling Interiors Asia Q2 2018 20.9
JV with BYD Seating Asia Q3 2018 58.5
Parrot Automotive Faurecia Clarion Electronics Europe / Asia Q1 2019 11.5
Total 104.5

Q1 2019 Sales – April 23, 2019
Resilient sales of €4,325m, up 0.2% on a reported basis:
Currencies had a positive impact of 1.3%
Down 1.1% at constant currencies Outperformance of 580bps
Sales outperformed automotive production in Europe,
Asia and South America*:
Europe: -1.9% vs. IHS@ -4.9% +300bps
Asia: +5.1% vs. IHS@ -8.0% +1,310bps
South America: +4.2% vs. IHS@ -4.7% +890bps
North America, as expected, was impacted by the end of
production of a significant Seating program:
-2.9% vs. IHS@ -2.5% -40bps
All Business Groups outperformed worldwide automotive
production*:
Seating: +700bps
Interiors: +140bps
Clean Mobility: +820bps
Confirmed full-year guidance
Q1 2019 Sales - Key Messages
€4,315m€4,325m
Q1 2018 Q1 2019Currency effect Sales growth*
€56m
€(46)m
Vs. automotive
production
growth** of -6.9%
* At constant currencies
** Source: IHS Markit forecast dated April 16, 2019
(vehicles segment in line with CAAM for China)3
+1.3% -1.1%

Q1 2019 Sales – April 23, 2019
Europe (51% of Group sales)
Solid outperformance in a challenging environment
Q1 2019 sales amounted to €2,217m, down 1.9%*:
Excluding a limited negative currency impact of 0.9%
(mainly the TRY vs. the euro)
Outperformance of 300bps vs. European automotive
production (-4.9%**)
Negative impact, as expected, by the end of production
of a Seating program for PSA (Berlingo) in Vigo (Spain)
Positive contribution from Hug Engineering (consolidated as
from Q2 2018) and Parrot Automotive (sales consolidated
since January 1, 2019)
€2,279m
€2,217m
Q1 2018 Q1 2019
-0.9%
Currency effect Sales growth*
€(18)m
€(44)m
Vs. automotive
production
growth** of -4.9%
* At constant currencies
** Source: IHS Markit forecast dated April 16, 2019
(vehicles segment in line with CAAM for China)4
-1.9%

Q1 2019 Sales – April 23, 2019
North America (26% of Group sales)
Significant negative impact from the end of production of a Seating program
Q1 2019 sales amounted to €1,117m, up 5.1% on a reported basis,
driven by a strong positive currency impact of 8.0% due to the USD
vs. the euro
Sales were down 2.9% at constant currencies, slightly
underperforming North American automotive production by 40bps
This underperformance reflected, as expected, the negative
impact from the end of production of the Seating program
for Daimler (GLE/GLS) in Cottondale (Alabama)
Robust growth of Clean Mobility
Q1 2018 Q1 2019Currency effect Sales growth*
Vs. automotive
production
growth** of -2.5%€1,063m
€1,117m
€85m
€(31)m
* At constant currencies
** Source: IHS Markit forecast dated April 16, 2019
(vehicles segment in line with CAAM for China)5
+8.0%
-2.9%

Q1 2019 Sales – April 23, 2019
Asia (18% of sales)
Strong outperformance thanks to increased sales to Chinese OEMs
Q1 2019 sales amounted to €798m, up 5.1%*:
Excluding a positive currency impact of 2.4%
(mainly the CNY vs. the euro)
Including a positive contribution from bolt-ons of €81m,
representing 10.9% of last year sales: mainly the JV with BYD
for Seating (consolidation as from Q3 2018), the JV with
Wuling for Interiors (consolidated as from Q2 2018)
Outperformance of 1,310bps vs. Asian automotive
production (-8.0%**) and of 220bps excluding bolt-ons
In China, sales represented €604m, up 4.7% at constant
currencies:
Outperformance of 1,990bps vs Chinese automotive
production (-15.2%**) and of 560bps excluding bolt-ons
Sales to Chinese OEMs almost doubled vs Q1 2018,
reaching €224m and representing 39% of the Group’s sales
in the country (vs. 20% in Q1 2018)
€742m
€798m
Q1 2018 Q1 2019
+5.1%
Currency effect Sales growth*
€18m
€38m
Vs. automotive
production
growth** of -8.0%
* At constant currencies
** Source: IHS Markit forecast dated April 16, 2019
(vehicles segment in line with CAAM for China)6
+2.4%
Q1 2019 Sales – April 23, 2019
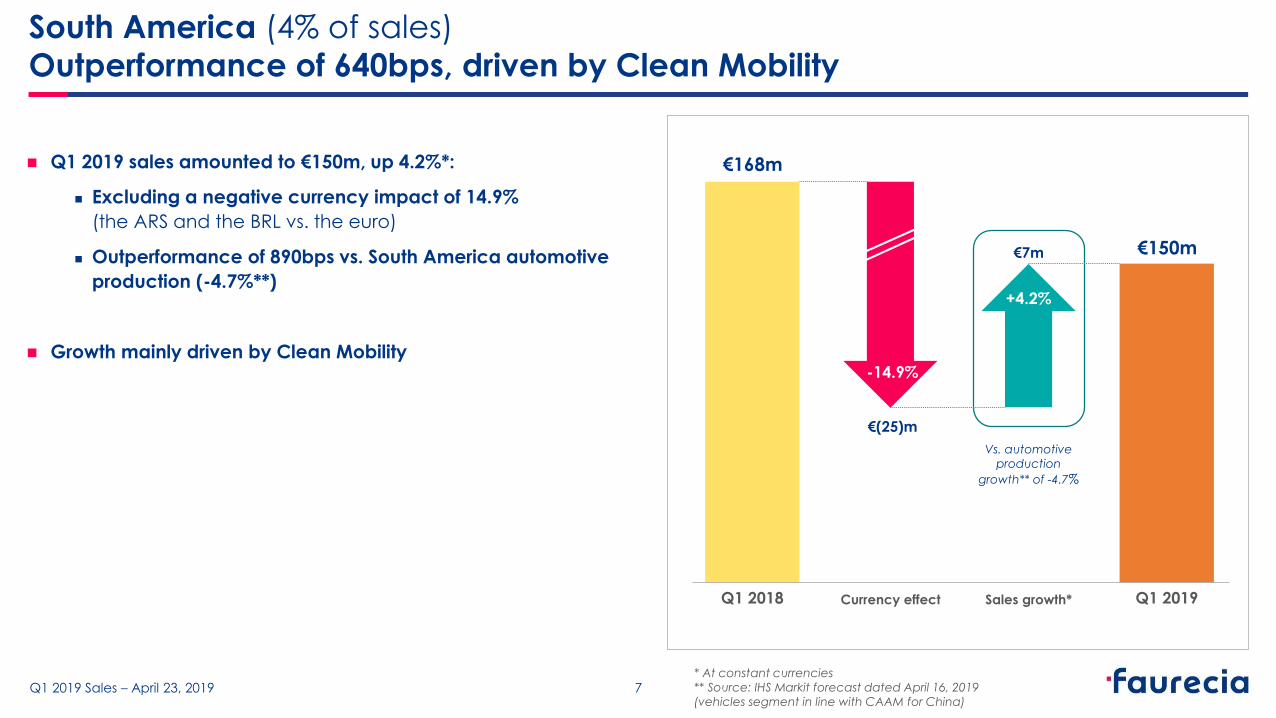
South America (4% of sales)
Outperformance of 640bps, driven by Clean Mobility
Q1 2019 sales amounted to €150m, up 4.2%*:
Excluding a negative currency impact of 14.9%
(the ARS and the BRL vs. the euro)
Outperformance of 890bps vs. South America automotive
production (-4.7%**)
Growth mainly driven by Clean Mobility
€168m
€150m
Q1 2018 Q1 2019
-14.9%
+4.2%
Currency effect Sales growth*
€(25)m
€7m
Vs. automotive
production
growth** of -4.7%
* At constant currencies
** Source: IHS Markit forecast dated April 16, 2019
(vehicles segment in line with CAAM for China)7

Q1 2019 Sales – April 23, 2019
Seating (43% of Group sales)
Solid performance thanks to Asia offsetting end of production of two programs
Q1 2019 sales amounted to €1,841m, up 0.1% vs. last year*:
Excluding a positive currency impact of 1.2%
(mainly the USD and the CNY vs. the euro)
Including the positive bolt-on contribution for €58m
from the JV with BYD in China
Outperformance of 700bps vs. worldwide automotive
production growth (-6.9%**)
Europe (-2.1%*) and North America (-9.3%*) reflected
the end of production of two Seating programs
(one for Daimler in the USA and one for PSA in Spain)
Asia grew by double-digits (+25.5%*) driven by strong growth
with Chinese OEMs
South America was broadly stable
€1,817m
€1,841m
Q1 2018 Q1 2019Currency effect Sales growth*
Vs. automotive
production
growth** of -6.9%
* At constant currencies
** Source: IHS Markit forecast dated April 16, 2019
(vehicles segment in line with CAAM for China)8
€22m
+1.2%
€2m
+0.1%
The Volkswagen Chattanooga (USA) Seating business, which was transferred to
Faurecia at the beginning of the year and represents €1.3 billion of lifetime sales, is
not included in consolidated sales figures, as it is accounted for by the equity
method (sales for this business amounted to €46 million in Q1 2019)

Q1 2019 Sales – April 23, 2019
Interiors (30% of Group sales)
Slight outperformance in a challenging environment
Q1 2019 sales amounted to €1,294m, down 4.7%*:
Excluding a limited positive currency impact of 0.7%
(mainly attributable to the USD vs. the euro)
Including a bolt-on contribution of €21m from JV with Wuling
in Asia (consolidated as from Q2 2018)
Outperformance of 140bps vs. worldwide automotive
production (-6.9%**)
Growth with:
VW in Europe,
FCA and Tesla in North America,
And Chinese OEMs
did not offset challenging market conditions faced by other OEMs
€1,358m
€1,294m
Q1 2018 Q1 2019
+0.7%
-5.5%
Currency effect Sales growth*
€(74)m
Vs. automotive
production
growth** of -6.9%
* At constant currencies
** Source: IHS Markit forecast dated April 16, 2019
(vehicles segment in line with CAAM for China)9
€10m
+0.7%

Q1 2019 Sales – April 23, 2019
Clean Mobility (26% of Group sales)
Outperformance in all regions
Q1 2019 sales amounted to €1,144m, up 1.3%*:
Excluding a positive currency impact of 2.1%
(mainly attributable to the USD vs. the euro)
Outperformance of 820bps vs. worldwide automotive
production growth (-6.9%**)
Outperformance in all regions:
Europe: +880bps
North America: +510bps
Asia: +390bps
South America: +2,470bps
Solid growth from commercial vehicles
€1,106m
€1,144m
Q1 2018 Q1 2019
+1.3%
Currency effect Sales growth*
€23m
€15m
Vs. automotive
production
growth** of -6.9%
* At constant currencies
** Source: IHS Markit forecast dated April 16, 2019
(vehicles segment in line with CAAM for China)10
+2.1%

Q1 2019 Sales – April 23, 2019
Main events since January 1, 2019
11
CLARION ACQUISITION FINALIZED AND
START OF FAURECIA CLARION ELECTRONICS
Success of the Faurecia tender offer for Clarion
Since March 28, 2019, Clarion has become a wholly-owned
company of Faurecia
As from April 1, 2019, Clarion operations will be
consolidated in the new Business Group “Faurecia Clarion
Electronics” combined with those of Coagent and Parrot
Automotive :
Atsushi Kawabata, former President and Chief
Executive Officer of Clarion, appointed Executive Vice
President and member of Faurecia’s Comex
Jean-Paul Michel, former Finance Vice President of
Faurecia Interiors, appointed Deputy Executive Vice
President
CREATION OF “SYMBIO, A FAURECIA
MICHELIN HYDROGEN COMPANY”
TO BECOME A WORLD LEADER
IN HYDROGEN FUEL CELL SYSTEMS
On March 11, announcement of the signature of a MoU to
create a JV, to be owned equally by Faurecia and
Michelin, bringing together all their fuel cell related
activities
This JV will develop, produce and market hydrogen fuel
cell systems for light vehicles, utility vehicles, trucks and
other applications
Shared strong conviction of the importance of hydrogen
technology in tomorrow's world of zero emissions mobility,
The joint venture is able to immediately offer a unique
range of hydrogen fuel cell systems for all use cases

Q1 2019 Sales – April 23, 2019
We fully confirm our full-year 2019 guidance, as announced on February 18, 2019.
This guidance is based on Faurecia’s assumption that worldwide automotive production should be
down 1% in 2019 vs. 2018, with a difficult first half and growth resuming in the second half.
Faurecia’s full-year 2019 financial targets* are:
Confirmed full-year guidance
Sales
FY 2019 sales at constant
currencies should outperform
worldwide automotive production
between 150 and 350bps
Profitability
FY 2019 operating income
should increase in value
and operating margin
should be at least 7% of sales
Net cash flow
FY 2019 net cash flow
should be at least €500m
(including Clarion consolidation as from April 1)(excluding Clarion consolidation) (including Clarion consolidation as from April 1)
* Currency assumptions: USD/€ @ 1.18 and CNY/€ @ 7.77, on average,
and taking into account IFRS16 implementation12

Q1 2019 Sales – April 23, 2019
Q1 2019 Sales
Appendices

Q1 2019 Sales – April 23, 2019
Q1 2019 sales by Business Group
Sales (in €m)Reported Currency effect Growth ex-currencies Reported
Q1 2018 value % value % Q1 2019 %
Seating 1,817.3 22.2 1.2% 2.0 0.1% 1,841.5 1.3%
of which bolt-ons 58.5 3.2%
Interiors 1,357.7 9.9 0.7% -74.1 -5.5% 1,293.5 -4.7%
of which bolt-ons 20.9 1.5%
Clean Mobility 1,105.9 23.0 2.1% 14.6 1.3% 1,143.5 3.4%
of which bolt-ons 13.6 1.2%
Faurecia Clarion Electronics 33.7 0.8 2.4% 11.7 34.5% 46.2 37.1%
of which bolt-ons 11.5 34.1%
Group 4,314.6 56.0 1.3% -46.0 -1.1% 4,324.6 0.2%
of which bolt-ons 104.5 2.4%
14

Q1 2019 Sales – April 23, 2019
Q1 2019 sales by region
Sales (in €m)Reported Currency effect Growth ex-currencies Reported
Q1 2018 value % value % Q1 2019 %
Europe 2,278.9 -18.1 -0.9% -44.3 -1.9% 2,216.5 -2.7%
of which bolt-ons 23.6 1.0%
North America 1,062.8 85.2 8.0% -31.3 -2.9% 1,116.7 5.1%
Asia 742.1 17.6 2.4% 38.1 5.1% 797.8 7.5%
of which China 565.4 11.8 2.1% 26.5 4.7% 603.7 6.8%
of which bolt-ons 80.9 10.9%
South America 168.3 -25.0 -14.9% 6.9 4.2% 150.2 -10.8%
RoW 62.5 -3.6 -5.8% -15.5 -24.8% 43.4 -30.6%
Group 4,314.6 56.0 1.3% -46.0 -1.1% 4,324.6 0.2%
of which bolt-ons 104.5 2.4%
15

Q1 2019 Sales – April 23, 2019
2018 sales by quarter with Coagent presented separately from Interiors
Sales (in €m) Q1 2018 Q2 2018 Q3 2018 Q4 2018 FY 2018
Seating 1,817.3 1,964.2 1,742.7 1,913.8 7,438.0
Interiors (restated for Coagent) 1,357.7 1,437.9 1,185.0 1,382.1 5,362.7
Clean Mobility 1,105.9 1,254.4 1,060.5 1,194.2 4,615.0
Coagent (to be incl. into Faurecia Clarion Electronics) 33.7 20.2 25.6 29.5 109.0
Group 4,314.5 4,676.8 4,013.8 4,519.6 17,524.7
16

Q1 2019 Sales – April 23, 2019
Until April 25, 2019 Shanghai International Automobile Industry Exhibition
May 28, 2019 Annual Shareholders’ Meeting in Paris
July 23, 2019 H1 2019 results announcement
October 17, 2019 Q3 2019 sales announcement
November 26, 2019 Capital Markets Day in Paris, presenting:
Strategic roadmap and medium-term objectives
for the new Business Group Faurecia Clarion Electronics
New medium-term Group objectives
Calendar
17

Q1 2019 Sales – April 23, 2019
Contact & share data
Investor Relations
Marc MAILLET
Tel: +33 1 72 36 75 70
E-mail: [email protected]
Anne-Sophie JUGEAN
Tel: +33 1 72 36 71 31
E-mail: [email protected]
23-27, avenue des Champs Pierreux
92000 Nanterre (France)
Web site: www.faurecia.com
Share Data
Bloomberg Ticker: EO:FP
Reuters Ticker: EPED.PA
Datastream: F:BERT
ISIN Code: FR0000121147
Bonds ISIN Codes
2023 bonds: XS1384278203
2025 bonds: XS1785467751
2026 bonds: XS1963830002
18

Q1 2019 Sales – April 23, 2019
Safe Harbor Statement
This report contains statements that are not historical facts but rather forward-looking statements. The words "will,"
"may," "designed to," "outlook," "believes," "should," "anticipates," "plans," "expects," "intends," "estimates" and similar
expressions identify these forward-looking statements. All such statements are based upon our current
expectations and various assumptions, and apply only as of the date of this report.
Our expectations and beliefs are expressed in good faith and we believe there is a reasonable basis for them.
However, there can be no assurance that forward-looking statements will materialize or prove to be correct.
Because such statements involve risks and uncertainties such as automotive vehicle production levels, mix and
schedules, financial distress of key customers, energy prices, raw material prices, the strength of the European or
other economies, currency exchange rates, cancellation of or changes to commercial contracts, liquidity, the
ability to execute on restructuring actions according to anticipated timelines and costs, the outcome could differ
materially from those set out in the statements.
Except for our ongoing obligation to disclose information under law, we undertake no obligation to update
publicity any forward-looking statements whether as a result of new information or future events.
19

Q1 2019 Sales – April 23, 2019