q1 2016 revenue
TRANSCRIPT

Q1 2016 revenue Analyst presentation
May 18th, 2016

Disclaimer
This presentation contains forward-looking statements that involve risks and uncertainties concerning the
Group's expected growth and/or profitability in the future. Actual events or results may differ from those
described in this document.
Consequently the company cannot guarantee the accuracy and the completeness of said forward-looking
statements due to a number of uncertainties, many of which the company is not aware of.
For additional information concerning any important factor that may cause the company's actual results to
materially differ from expectations and underlying assumptions, please refer to the reports filed by the
company with the “Autorité des Marchés Financiers » (AMF).
2

1 Key figures & facts
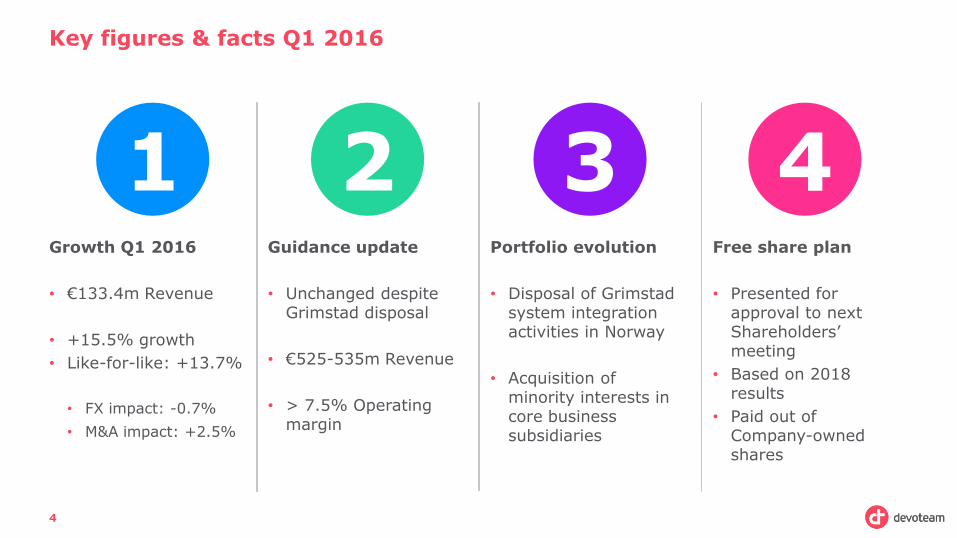
Key figures & facts Q1 2016
4
1 Growth Q1 2016
• €133.4m Revenue
• +15.5% growth
• Like-for-like: +13.7%
• FX impact: -0.7%
• M&A impact: +2.5%
2 Guidance update
• Unchanged despite Grimstad disposal
• €525-535m Revenue
• > 7.5% Operating margin
3 Portfolio evolution
• Disposal of Grimstad system integration activities in Norway
• Acquisition of minority interests in core business subsidiaries
4 Free share plan
• Presented for approval to next Shareholders’ meeting
• Based on 2018 results
• Paid out of Company-owned shares

Evolution of our positioning – Q1 2016 overview
5
Offers (excl. Between, Be Team & acquisitions)
Clients & verticals (organic scope excluding Between)
Business data – not audited
Legacy Business -24.6% YoY Growth
Social Mobility Analytics Cloud Security
+24.1% YoY Growth
Mature Business
+5.7% YoY Growth
€39.4m
€20.4m
€49.7m
Top 3
14% of the revenue
• ENGIE
• Sanofi
• BNP Paribas
Next 7
21% of the revenue
• Vodafone
• Major electricity provider
• SNCF
• CA/CL
• Deutsche Telekom
• Société Générale
• Carrefour

2 Q1 2016 Revenues

Q1 2016 Revenue analysis by Region
7
In millions of euros Q1 2016 Q1 2015
France* 56.4 50.3
Variation 12.3%
L-f-l variation 11.9%
Northern Europe & Benelux 28.4 27.1
Variation 4.8%
L-f-l variation 7.2%
Central Europe 13.0 13.0
Variation 0.2%
L-f-l variation 0.4%
Rest of the world* 16.2 13.2
Variation 23.2%
L-f-l variation -4.9%
Corporate (0.1) 0.0
Between 18.2 9.0
Variation 102.7%
L-f-l variation 102.7%
Divestments (2015-2016) 1.1 2.9
Total 133.4 115.5
Variation 15.5%
L-f-l variation 13.7%
L-f-l variation excluding Between 6.2%
In mill ions o f euros Q1 2 0 16 Q1 2 0 15
France 0 .2 -
myG France, consolidated as of October 1st
2015 0.2 -
R est o f t he world 3 .8 -
Drago, consolidated as of October 1st
2015 3.7 -
myG Spain, consolidated as of October 1st
2015 0.1 -
*Of which contribut ion of the acquisit ions:
France driving the “excluding Between” growth figures thanks to SMACS attraction

Resources analysis – Headcount, utilisation rate and billable ratio*
8
*Billable ratio = productive headcount / total headcount
Grimstad divestment: about <30>
employees in May
Q1 2015 Q2 2015 Q3 2015 Q4 2015 FY 2015 Q1 2016
83.0% 84.5% 85.0% 84.8% 84.3% 82.8%
Utilization rate of internal resources, excluding divested entities
+ 59 employees over Q1 2016, on a good utilisation level

3 Prospects Update

2016 guidance – unchanged despite Grimstad exit
10
• +7.4 to 9.4% like-for-like vs. +7-9% previously
• -0.6% FX impact (negative: Norwegian krone, pound sterling,
Swiss franc, Turkish lira / positive: UAE dirham) vs. -0.5% previously
• +1.4% M&A impact vs. +2% previously due to Grimstad exit
• Drago & myG: €11m (€15m FY 16 – €4m in Q4 15)
• Exa ECS: -€1.1m (Q1 2015)
• Norway Grimstad: -€3.3m (May-Dec 2015)
Hypothesis: stable economic environment and exchange rates
• Main improvement coming from scissor effect
• Slight positive impacts of working days: +0.4 days
(excl. Drago & myG)
• Dilutive effect of Between

2016 guidance in a 10-year view
11
EAGLE plan benefits
Growth on DIGITAL EAGLE plan initiation Telco crisis
A history of strong growth

4 Appendix

Devoteam, entrepreneurs in disruptive technology
13
At Devoteam we deliver innovative technology
consulting for business, to make our clients win their
digital battle
•
20 years of transformation experience
Listed on
Euronext
Digital Business Transformation
IT Services Transformation
IT Infrastructure Transformation
IT Service Management
DevOps Agile
Client Relationship Operations Efficiency
2015 1995 2005
€485m Turnover in 2015
20 Countries
4000 Professionals
Cloud Data
Data Centres Security
Networks

Shareholding structure
14

15
Customers buy differently
People work like they live
New services appear everyday
Leverage the power of data with connected cars and transform the driver- experience
Empower collective intelligence thanks to cloud-based collaborative platform
Optimise the management of field operations using field force geo-localisation services
Create a single digital platform with self-service portal and establish paperless administration
Dematerialise the sales process to improve customer purchasing-journey
Provide consistent customer experience and build multi-channel strategy for a retailer
Utilities Public sector Industry
Retail Banking & Insurance Automotive
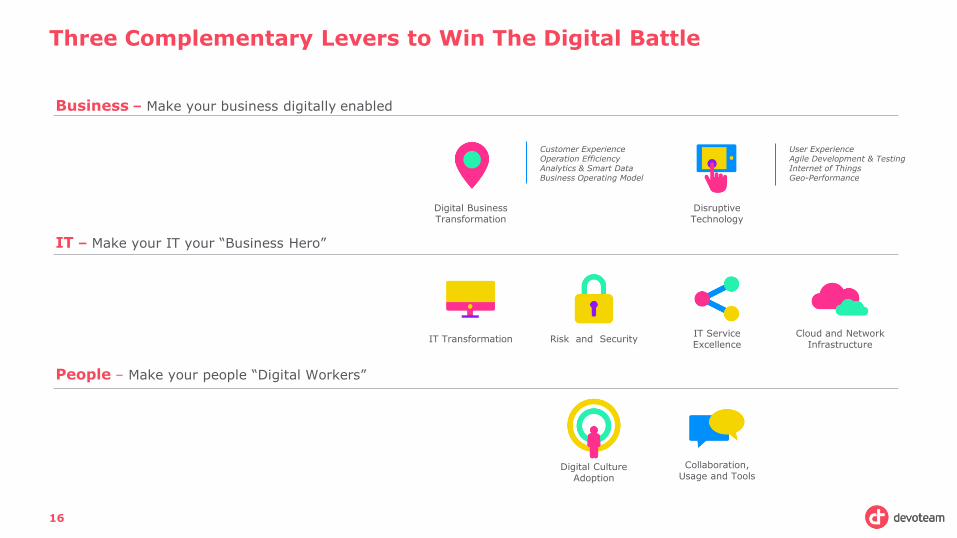
Three Complementary Levers to Win The Digital Battle
16
People – Make your people “Digital Workers”
IT – Make your IT your “Business Hero”
Business – Make your business digitally enabled
Collaboration, Usage and Tools
Digital Culture Adoption
Cloud and Network Infrastructure
Risk and Security IT Service Excellence
IT Transformation
Customer Experience Operation Efficiency Analytics & Smart Data Business Operating Model
Digital Business Transformation
Disruptive Technology
User Experience Agile Development & Testing Internet of Things Geo-Performance

In millions of euros FY 2015
France
Group contribution 207.7
Operating margin 21.8
In % of Group contribution 10.5%
Northern Europe & Benelux
Group contribution 110.1
Operating margin 6.9
In % of Group contribution 6.2%
Central Europe
Group contribution 53.9
Operating margin 3.2
In % of Group contribution 5.8%
Rest of the world
Group contribution 60.0
Operating margin 4.5
In % of Group contribution 7.5%
17
In millions of euros FY 2015
France
Group contribution 207.7
Operating margin 21.8
In % of Group contribution 10.5%
Northern Europe & Benelux
Group contribution 110.1
Operating margin 6.9
In % of Group contribution 6.2%
Central Europe
Group contribution 53.9
Operating margin 3.2
In % of Group contribution 5.8%
Rest of the world
Group contribution 60.0
Operating margin 4.5
In % of Group contribution 7.5%
Corporate
Group contribution 0.1
Operating margin (3.9)
Between
Group contribution 46.8
Operating margin 0.9
In % of Group contribution 1.9%
Divestments (2015-2016)
Group contribution 6.7
Operating margin 0.6
In % of Group contribution 8.3%
Total
Group contribution 485.3
Operating margin 33.9
In % of Group contribution 7.0%
FY 2015 Revenue and operating margin Based on 2016 new reporting structure

Glossary
Like-for-like or l-f-l variation: At comparable perimeter and exchange rates
Between: "Between", a subsidiary operating in the Netherlands on the market of sourcing of IT
professionals, has a very volatile contribution to revenue since, depending on the terms and conditions of
the contracts signed, the revenue consolidated at Group level may be based on the contract's gross
margin or on the full amount invoiced to the final customer. As a consequence, the Group decided to
isolate this subsidiary when calculating the growth rate of the consolidated revenues
Divestments (2015-2016) or divested entities: In 2016, Divestments include Grimstad activities in
Norway, deconsolidated on May 1st 2016. In 2015, it also includes Exa ECS, deconsolidated on April 1st
2015
Utilization rate of internal resources: Measures the percentage of working hours (excluding paid holidays)
of billable employees that were billed to a client
Operating margin: Defined as the current operating result before amortization of intangible assets related
to acquisitions and excluding the impact of stock options
18