q1 2015 - indus · 2 indus interim report – q1 2015 letter to the shareholders dear shareholders,...
TRANSCRIPT

Q1 | 2015Growth course continues

327.9
Q1 2015 Q1 2014
Sales 327.9 287.2
EBITDA 43.4 39.2
EBIT 31.5 28.3
Net result for the period 15.9 13.3
Earnings per share (in EUR) of continuing operations 0.65 0.60
Operating cash flow 3.5 -9.8
31.3.2015 31.12.2014
Total assets 1,357.4 1,308.4
Equity capital 569.7 549.9
Net debt 366.4 345.9
Equity ratio (in %) 42.0 42.0
Investments (as of the reporting date) 42 42
KEY FIGURES (in EUR millions)
JANUARY 1 TO MARCH 31, 2015
SALES IN THE FIRST THREE MONTHS OF 2015 SEGMENT TREND Q1 2015 IN COMPARISON TO Q1 2014
GROUP SALES GROUP EBIT
14 % 11 %Construction/Infrastructure Sales -4 % EBIT +2 %
Automotive Technology Sales +6 % EBIT +13 %
Engineering Sales +62 % EBIT +79 %
Medical Engineering/Life Science Sales +25 % EBIT +7 %
Metals Technology Sales +6 % EBIT -24 %EUR million

1INDUS INTERIM REPORT – Q1 2015
CONTENTS
LETTER TO THE SHAREHOLDERSGROWTH PLATFORM INDUS INDUS ON THE CAPITAL MARKETINTERIM MANAGEMENT REPORTCONSOLIDATED INTERIM FINANCIAL STATEMENTS AS OF MARCH 31, 2015
CONTACT AND FINANCIAL CALENDAR
p. 02
p. 04
p. 06
p. 07
p. 19
p. 36
AS THE LEADING SPECIALIST IN THE FIELD OF SUSTAINABLE INVESTMENT AND GROWTH IN GERMAN- SPEAKING SMALL AND MEDIUM-SIZED COMPANIES, INDUS PRIMARILY ACQUIRES OWNER-MANAGED COMPANIES AND HELPS THEIR BUSINESS GROW OVER THE LONG TERM. WE ENSURE IN THE PROCESS THAT THEY ARE ABLE TO RETAIN THEIR PARTICULAR STRENGTH:
THEIR IDENTITY AS MEDIUM-SIZED COMPANIES.

2 INDUS INTERIM REPORT – Q1 2015LETTER TO THE SHAREHOLDERS
DEAR SHAREHOLDERS,The economic environment at the start of 2015 lacked momentum. While the situation has
improved in some economies in the Eurozone, economic momentum was surprisingly weak
in the USA. Most emerging markets are also reporting weak economic growth. China, Brazil
and Russia will grow less than in the previous year in 2015. The markets are determined
by monetary policy. Although the Federal Reserve has allowed its bond buying program to
end, the first interest rate increase is not to be expected before fall. The ECB is sticking with its
very expansionary monetary policy and buying EUR 60 billion worth of bonds a month.
In contrast, the German economy grew surprisingly rapidly in the fourth quarter of 2014 after
a weak third quarter. This positive sentiment continues. For the time being, both the decrease
in the oil price and the depreciation of the euro will have a positive impact on the German
economy in 2015.
INDUS is now generating around half its sales abroad. The products sold in Germany are
often indirectly exported via our customers on a continuing basis. The shape of the global
economy and not just Germany therefore plays a decisive role in our business success.
We are deliberately cautious at the moment: The markets are currently primarily money-
market-driven. Various crises flaring up may slow down the economy or even send it into
a downturn at any time. Some investors and analysts therefore assess our planning for the
current fiscal year as “too moderate”.
We expect stable business for 2015 – providing the current conditions do not change. Our
group is a truly healthy, well-positioned company with very good operating results and with
at least equally good prospects for the future. Our COMPASS 2020 strategy is increasingly
paying off. We expect organic sales growth of at least 1.5 % (in line with German GDP growth),
but very much see opportunities for an increase in sales to up to EUR 1.3 billion (that would
be equivalent to 3.6 %). We want to generate an operating result of EUR 125 to 130 million.
That represents a Group-wide EBIT margin of 10 %.
LETTER TO THE SHAREHOLDERS

3INDUS INTERIM REPORT – Q1 2015LETTER TO THE SHAREHOLDERS
The interim result for the first three months confirms our expectation. With sales of
approximately EUR 328 million, we were able to achieve an operating result of approximately
EUR 31.5 million. INDUS has thus made a satisfying and good start to the year.
We have already made strong investments in the first three months: around EUR 22 million
has been put into growth-strengthening acquisitions and property, plant and equipment. At
the beginning of the year, we acquired the ESDA production site in Glauchau for our portfolio
company OFA and its integration. With the acquisition of the Dutch company NEA in May,
we then acquired a profitable addition for OFA. By the middle of the year, we are looking to
complete two more acquisitions. They are to come from the fields of medical engineering/life
science and automation.
We want to provide information and personally answer your questions on all this and
further development at our AGM in Cologne on June 3. INDUS will not only present itself
in a whole new light to you there, but also propose a dividend increase. We are thus rein-
forcing our promise of shareholders participating fairly in the company’s success. We are
looking forward to your visit and the dialog.
Bergisch Gladbach, May 2015
Yours, The Board of Management
Jürgen Abromeit Dr. Johannes Schmidt Rudolf Weichert
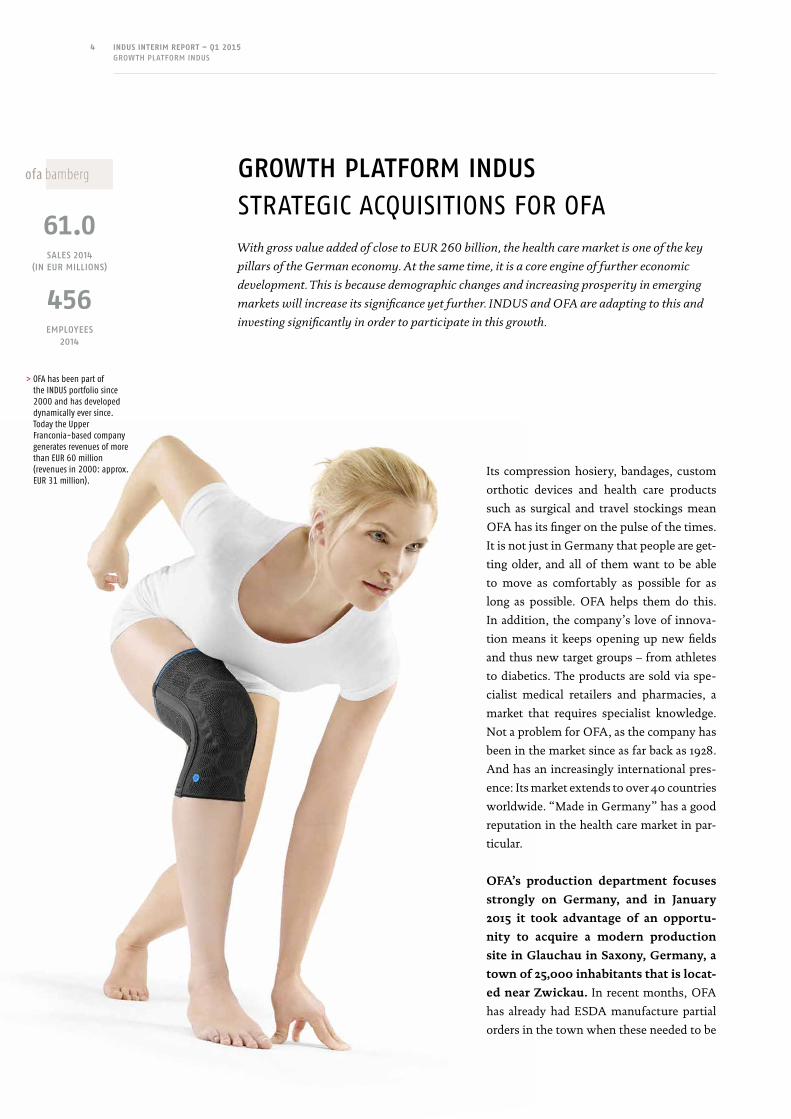
4 INDUS INTERIM REPORT – Q1 2015GROWTH PLATFORM INDUS
GROWTH PLATFORM INDUSSTRATEGIC ACQUISITIONS FOR OFAWith gross value added of close to EUR 260 billion, the health care market is one of the key
pillars of the German economy. At the same time, it is a core engine of further economic
development. This is because demographic changes and increasing prosperity in emerging
markets will increase its significance yet further. INDUS and OFA are adapting to this and
investing significantly in order to participate in this growth.
Its compression hosiery, bandages, custom
orthotic devices and health care products
such as surgical and travel stockings mean
OFA has its finger on the pulse of the times.
It is not just in Germany that people are get-
ting older, and all of them want to be able
to move as comfortably as possible for as
long as possible. OFA helps them do this.
In addition, the company’s love of innova-
tion means it keeps opening up new fields
and thus new target groups – from athletes
to diabetics. The products are sold via spe-
cialist medical retailers and pharmacies, a
market that requires specialist knowledge.
Not a problem for OFA, as the company has
been in the market since as far back as 1928.
And has an increasingly international pres-
ence: Its market extends to over 40 countries
worldwide. “Made in Germany” has a good
reputation in the health care market in par-
ticular.
OFA’s production department focuses
strongly on Germany, and in January
2015 it took advantage of an opportu-
nity to acquire a modern production
site in Glauchau in Saxony, Germany, a
town of 25,000 inhabitants that is locat-
ed near Zwickau. In recent months, OFA
has already had ESDA manufacture partial
orders in the town when these needed to be
> OFA has been part of the INDUS portfolio since 2000 and has developed dynamically ever since. Today the Upper Franconia-based company generates revenues of more than EUR 60 million (revenues in 2000: approx. EUR 31 million).
61.0SALES 2014
(IN EUR MILLIONS)
456EMPLOYEES
2014

5INDUS INTERIM REPORT – Q1 2015GROWTH PLATFORM INDUS
outsourced from Bamberg because of lim-
ited production capacity. When the parent
company DAUN & Cie. decided to give up
the site at the end of 2014, OFA took action
and acquired the complete production site
with INDUS’s support. The Bamberg-based
company had already been looking for op-
portunities to extend its production set-up
for a long time and this can now take place
at an accelerated rate in Saxony. Thanks to
trained staff and modern machines, OFA
will in future be able to react even quicker
to changed market circumstances, further
reduce delivery times and acquire addition-
al manufacturing contracts. In the medium
term, the plan is to concentrate custom
manufacturing in Bamberg and mass pro-
duction in Glauchau. By decoupling the two
product segments, the processes in each
segment can be further improved.
In addition to the acquisition in Saxo-
ny, OFA made use of a second growth
opportunity at the start of the year and
acquired the Dutch company NEA In-
ternational B.V. (NEA). OFA had already
been the exclusive sales partner for NEA
products for the German and Austrian mar-
kets for some years and is developing the area
for medical bandages more strongly with the
OFA dynamics product area. As a developer
and manufacturer of orthopedic premium
bandages and orthotic devices (OBO), NEA
is a specialist in the area of the treatment
of joint injuries and chronic conditions. To
date, NEA has concentrated primarily on
developing and improving products and on
distribution via exclusive distribution part-
ners. The Dutch company uses external sup-
pliers for its non-critical production steps.
The NEA acquisition is a lucky find for OFA.
The acquisition gives OFA the complete val-
ue chain in this promising sector, meaning it
will be able to significantly expand its range
in the area of bandages.
The additional production unit in Saxony
and the acquisition in the Netherlands mean
INDUS has opened up new growth options
for OFA.
THE GERMAN HEALTH CARE SECTOR WORLDWIDE
■ The export volume of the medical
technology and pharmaceutical industry
in Germany was more than EUR 83 billion
in 2013. The sector thus generated around
8 % of Germany’s foreign trade revenue. ■ Medical, orthopedic and optical
equipment generate an export volume
of EUR 22 billion. ■ The sector has high growth momentum. ■ By opening up emerging markets, exports
could be significantly further increased.
THE MARKET FOR ORTHOPEDIC BANDAGES AND
ORTHOTIC DEVICES (OBO)
■ The OBO market volume in Europe in 2015
is around USD 765 million. That is equi-
valent to almost a tenth of the European
market for orthopedic technology. ■ Annual growth of around 3.5 % is expected
for the orthopedic market until 2019. ■ The OBO orthopedic sub-market is a more
stable and relatively non-cyclical market. ■ The OBO market is also a rapidly growing
market globally. It is shaped by the growing
global population and increasing spending
per capita on health care.

6 INDUS INTERIM REPORT – Q1 2015INDUS ON THE CAPITAL MARKET
INDUS ON THE CAPITAL MARKET
THE INDUS SHARE AT A GLANCE *
Q1 2015 Full-year 2014
High (in EUR) 46.70 40.90
Low (in EUR) 36.37 28.00
Closing price at reporting date (in EUR) 46.38 38.11
Average daily trading volume (number of shares) 59,196 53,935
Number of shares outstanding 24,450,509 24,450,509
Market capitalization (in EUR millions) 1,134.0 931.8
* share price acc. to XETRA, trading volume acc. to Deutsche Börse
THE CAPITAL MARKET SEES FURTHER GROWTH OPPORTUNITIES FOR INDUS
The very positive share price performance in 2014 has continued in 2015 In the first three
months, the INDUS share outperformed the SDAX and the DAX. The INDUS share’s liquid-
ity also further increased. Revenues. As of March 31, 2015, the share was up roughly 43 %,
thus substantially outperforming the markets at the close of 2014 (SDAX +16 %, DAX +24 %).
This rally culminated in a new all-time high for the INDUS share of EUR 49.92 on April 24.
Current price targets for the INDUS share range between EUR 39 and EUR 57. All analysts are
recommending to either buy or hold.
SHARE PRICE PERFORMANCE OF THE INDUS SHARE JANUARY TO APRIL 2015 (in %)
35
30
25
20
15
10
5
0
-5
31.12.2014 28.2.2015
INDUS Holding AG SDAX PERF. INDEX DAX INDEX
30.4.201531.12.2014 28.2.2015 30.4.201531.1.2015 31.3.2015

7INDUS INTERIM REPORT – Q1 2015INTERIM MANAGEMENT REPORT
7INDUS INTERIM REPORT – Q1 2015INTERIM MANAGEMENT REPORT
INTERIM MANAGEMENT REPORT
INDUS GROUP BUSINESS PERFORMANCEIN THE FIRST THREE MONTHS OF 2015SEGMENT REPORT EMPLOYEES FINANCIAL POSITION OPPORTUNITIES AND RISKSEVENTS AFTER THE REPORTING DATEOUTLOOK
p. 08
p. 11
p. 14
p. 15
p. 17
p. 17
p. 18

8 INDUS INTERIM REPORT – Q1 2015INTERIM MANAGEMENT REPORT
INDUS GROUP BUSINESS PERFORMANCEIN THE FIRST THREE MONTHS OF 2015
CONSOLIDATED STATEMENT OF INCOME (in EUR millions)
Q1 2015 Q1 2014
Sales 327.9 287.2
Other operating income 5.9 4.1
Own work capitalized 0.7 0.6
Changes in inventories 13.5 15.1
Overall performance 348.0 307.0
Cost of materials -165.4 -144.5
Personnel expenses -94.6 -84.1
Other operating expenses -44.7 -39.4
Income from shares accounted for using the equity method 0.1 0.2
EBITDA 43.4 39.2
Depreciation and amortization -11.9 -10.9
Operating result (EBIT) 31.5 28.3
Net interest -6.7 -5.0
Earnings before taxes (EBT) 24.8 23.3
Taxes -8.9 -8.5
Earnings attributable to discontinued operations 0.0 -1.5
Earnings after taxes 15.9 13.3
of which allocable to non-controlling shareholders 0.1 0.2
of which allocable to INDUS shareholders 15.8 13.1

9INDUS INTERIM REPORT – Q1 2015INTERIM MANAGEMENT REPORT
The first quarter of 2015 went largely according to INDUS’s business plan. The consolidated
sales of INDUS Holding AG reached EUR 327.9 million at the end of March 2015 (previous
year: EUR 287.2 million).
Cost of materials rose from EUR 144.5 million to EUR 165.4 million and was thus in line with
the increase in sales. At 50.4 %, the cost of materials ratio was on par with the previous year’s
level of 50.3 %. Personnel costs rose from EUR 84.1 million to EUR 94.6 million, primarily
reflecting a larger post-acquisition workforce; the personnel cost ratio was 28.9 % (previous
year: 29.2 %).
EBITDA (earnings before interest, taxes, depreciation, and amortization) came in at EUR 43.4
million, up EUR 4.2 million versus last year’s EUR 39.2 million. Due to the substantial in-
vestments made in the previous years, depreciation and amortization increased to a total of
EUR 11.9 million (previous year: EUR 10.9 million).
The operating result (EBIT) for the first three months of 2015 came in at EUR 31.5 million, a
significant increase on the previous year. The EBIT margin came to 9.6 % on Group average
(previous year: 9.8 %). Detailed notes on the earnings position can be found in the segment
report.
Net interest expense decreased from EUR -5.0 million to EUR -6.7 million, in particular due
to results owed to third parties from shares in acquired companies with call/put options.
This is solely due to the structure of recent company acquisitions. Earnings before tax (EBT)
improved to EUR 24.8 million (previous year: EUR 23.3 million). At EUR -8.9 million, tax
expenses remained in line with the previous year’s level of EUR 8.5 million, corresponding
to a tax rate of 35.9 % (previous year: 36.5 %). After deducting minority interests, the net result
for the period improved to EUR 15.9 million (previous year: EUR 13.2 million). Earnings per
share for continuing operations came to EUR 0.65 (previous year: EUR 0.60).

10 INDUS INTERIM REPORT – Q1 2015INTERIM MANAGEMENT REPORT
CAPITAL EXPENDITURE AND ACQUISITIONS IN THE MEDICAL ENGINEERING/LIFE SCIENCE AND
AUTOMOTIVE TECHNOLOGY SEGMENTS
At the start of the year, the INDUS portfolio company OFA Bamberg GmbH expanded its
business and acquired a manufacturing site from ESDA GmbH in Glauchau, Saxony, Germa-
ny. A modern production site for textile products was built there in 1995 and closed in 2014.
With the acquisition, OFA is planning to move its outsourced contract manufacturing back
from Eastern Europe and wants to react quicker to changed market conditions and further re-
duce delivery times by manufacturing in Saxony. At the start of May, OFA also acquired 100 %
of the shares in the Dutch company NEA International B.V. (NEA) from its parent company,
Macintosh Retail Group N.V., Maastricht, the Netherlands. NEA develops orthopedic band-
ages and orthotic devices for specific use in the area of treatment of joint injuries and chronic
conditions. The bandages are sold in more than 30 countries to customers from the medical
and sports sectors. OFA Bamberg has been a distribution partner for NEA products in Ger-
many and Austria since the start of the 1990s.
The INDUS portfolio company SELZER Fertigungstechnik, Driedorf, also acquired the re-
maining 10 % minority interest in Selzer Automotiva do Brasil. This ensures closer connection
of the Brazilian activities to the German parent company. The previous minority shareholder
Albert Rempel founded the Brazilian company together with SELZER Fertigungstechnik at
the Vinhedo site near São Paulo. Dating back to 2005, the site mainly makes gear parts for the
domestic truck market.

11INDUS INTERIM REPORT – Q1 2015INTERIM MANAGEMENT REPORT
SEGMENT REPORTThe INDUS Holding AG investment portfolio is organized into five segments: Construction/
Infrastructure, Automotive Technology, Engineering, Medical Engineering/Life Science,
and Metals Technology. The investment portfolio encompassed 42 operating units as of
March 31, 2015.
INDUS CONSTRUCTION/INFRASTRUCTURE SEGMENT
STABLE ORDER SITUATION
Continuous high demand for construction services ensures a stable order situation for the
segment companies. The companies also have a good order backlog for the coming months.
At EUR 47.3 million, segment sales in the first three months of 2015 came in just under the
EUR 49.1 million achieved in 2014. Earnings before interest and taxes (EBIT) rose slightly
year-on-year to EUR 4.7 million (previous year: EUR 4.6 million). Consequently, at 9.9 % the
EBIT margin (previous year: 9.4 %) reached a very good level for the first quarter; business
in this segment is usually often somewhat weaker at the start of the year for weather-related
reasons and gradually increases over the course of the year. INDUS continues to plan a margin
in a range of between 12 and 14 % for the Construction/Infrastructure segment this fiscal year.
KEY FIGURES – CONSTRUCTION/INFRASTRUCTURE (in EUR millions)
1.1.–31.3.2015 1.1.–31.3.2014
Sales with external third parties 47.3 49.1
EBITDA 6.2 5.9
Depreciation and amortization -1.5 -1.3
EBIT 4.7 4.6
EBIT margin in % 9.9 9.4
Capital expenditure 2.9 2.9
Employees 1,118 1,093
SALES -3.7 %EBIT MARGIN 9.9 %
> SALES CLOSE TO PREVIOUS YEAR’S LEVEL
> SLIGHTLY INCREASED EBIT AND IMPROVED MARGIN

12 INDUS INTERIM REPORT – Q1 2015INTERIM MANAGEMENT REPORT
INDUS AUTOMOTIVE TECHNOLOGY SEGMENT
FULL ORDER BOOKS
The global automotive business is doing well, particularly for German manufacturers, among
others. Consequently, the segment companies were able to further increase their sales year on
year, from EUR 84.4 million to EUR 89.2 million. The operating result also improved year
on year and reached a higher figure at EUR 6.2 million. With an EBIT margin of 7.0 %, the
segment has already achieved a figure in the target range for 2015 (of between 6 % and 8 %) in
the first quarter.
KEY FIGURES – AUTOMOTIVE TECHNOLOGY (in EUR millions)
1.1.–31.3.2015 1.1.–31.3.2014
Sales with external third parties 89.2 84.4
EBITDA 10.7 10.2
Depreciation and amortization -4.5 -4.7
EBIT 6.2 5.5
EBIT margin in % 7.0 6.5
Capital expenditure 5.8 4.3
Employees 3,228 3,094
INDUS ENGINEERING SEGMENT
NEW ACQUISITIONS SUCCESSFULLY INTEGRATED
Segment sales increased from EUR 42.4 million to EUR 68.7 million and thus grew by more
than 60 % on a percentage basis. The sales growth is characterized by the first-time consolida-
tion of the new portfolio company MBN Neugersdorf. EBIT has also increased by almost 80 %
from EUR 5.3 million to EUR 9.5 million. The improvement of the EBIT margin compared
to the previous year to 13.8 % is pleasing (previous year: 12.6 %). As already reported in the
section on events after the reporting date for the 2015 fiscal year, the going-concern forecast
for SEMET is negative. As a result, the business will be discontinued in the middle of the year.
SALES +5.7 %EBIT MARGIN 7.0 %
> ECONOMIC SITUATION IN THE AUTOMO-TIVE BUSINESS STABLE
> STABLE MARGIN OF UP TO 7 % EXPECTED OVER THE COURSE OF THE YEAR
SALES +62.0 %EBIT MARGIN 13.8 %
> SALES GROWTH DUE TO NEW ACQUISITIONS
> HIGH PROFIT MARGIN

13INDUS INTERIM REPORT – Q1 2015INTERIM MANAGEMENT REPORT
KEY FIGURES – ENGINEERING (in EUR millions)
1.1.–31.3.2015 1.1.–31.3.2014
Sales with external third parties 68.7 42.4
EBITDA 11.3 6.8
Depreciation and amortization -1.8 -1.5
EBIT 9.5 5.3
EBIT margin in % 13.8 12.5
Capital expenditure 2.5 0.9
Employees 1,368 1,141
INDUS MEDICAL ENGINEERING/LIFE SCIENCE SEGMENT
JUMP IN SALES THANKS TO FULL CONSOLIDATION OF ROLKO
The Medical Engineering/Life Science segment is sustained by stable consumer demand and
good prospects for the health care sector. Segment sales increased by around 25 % to EUR 31.5
million in the first three months (previous year: EUR 25.1 million); this is primarily due to
the full consolidation of ROLKO – the company was acquired in the second quarter of 2015.
Earnings before interest and taxes (EBIT) only rose slightly year-on-year to EUR 4.7 million
(previous year: EUR 4.4 million). The impact of the one-off integration costs in OFA, result-
ing from the acquisition of the Glauchau production site in January, can be felt in segment
earnings. The EBIT margin of 14.9 % (previous year: 17.5 %) is therefore still slightly below the
target value range of around 15 %, but will improve over the course of the year.
KEY FIGURES – MEDICAL ENGINEERING/LIFE SCIENCE (in EUR millions)
1.1.–31.3.2015 1.1.–31.3.2014
Sales with external third parties 31.5 25.1
EBITDA 5.7 5.0
Depreciation and amortization -1.0 -0.6
EBIT 4.7 4.4
EBIT margin in % 14.9 17.5
Capital expenditure 5.7 0.6
Employees 921 699
SALES +25.5 %EBIT MARGIN 14.9 %
> SALES AND EARNINGS GROWTH AS A RESULT OF ACQUISITION OF ROLKO
> GOOD PROFIT MARGIN DESPITE GROWTH- RELATED INTEGRATION COSTS

14 INDUS INTERIM REPORT – Q1 2015INTERIM MANAGEMENT REPORT
INDUS METALS TECHNOLOGY SEGMENT
SEGMENT EARNINGS BELOW EXPECTATIONS
The Metals Technology segment has, as expected, decreased significantly compared to the
same quarter of the previous year. The significant appreciation of the Swiss franc in mid-Janu-
ary 2015 worsened the competitive situation for our Swiss companies in the segment. INDUS
currently believes that this topic could directly and indirectly have an impact of up to EUR 2
million on Group operating result. For the most part, this impact has been noticeable in the
first quarter already. However, restructuring efforts have been made, which are expected to
take effect over the course of the year. The good order situation in the segment led to an ap-
proximately 6 % increase in sales in the first quarter, with sales rising from EUR 86.3 million
to EUR 91.2 million. However, earnings before interest and taxes fell noticeably, decreasing
from EUR 9.4 million to EUR 7.1 million. At 7.8 % (previous year: 10.9 %), the margin was
significantly below the target planned for 2015 of more than 9 %.
KEY FIGURES – METALS TECHNOLOGY (in EUR millions)
1.1.–31.3.2015 1.1.–31.3.2014
Sales with external third parties 91.2 86.3
EBITDA 10.1 12.1
Depreciation and amortization -3.0 -2.7
EBIT 7.1 9.4
EBIT margin in % 7.8 10.9
Capital expenditure 5.1 3.2
Employees 1,376 1,273
EMPLOYEESAs the year began, the number of employees working for the various INDUS Group com-
panies held steady as a result of the order situation. At 28.8 % of sales, the personnel ratio is
roughly at the previous year’s level (previous year: 29.2 %). As of March 31, 2015, the company
had 8,037 employees (previous year: 7,323 employees).
SALES +5.7 %EBIT MARGIN 7.8 %
> SALES REMAIN STABLE, BUT EARNINGS ARE DOWN
> IMPROVEMENT MEASURES INTRODUCED

15INDUS INTERIM REPORT – Q1 2015INTERIM MANAGEMENT REPORT
FINANCIAL POSITION
CONSOLIDATED STATEMENT OF CASH FLOWS, CONDENSED (in EUR millions)
Q1 2015 Q1 2014
Operating cash flow 3.5 -9.8
Interest -3.9 -4.2
Cash flow from operating activities -0.4 -14.0
Cash outflow for investments -22.2 -12.0
Cash inflow from the disposal of assets 0.3 0.6
Cash flow from investing activities -21.9 -11.4
Cash inflow from the assumption of debt 17.0 36.0
Cash outflow from the repayment of debt -17.7 -16.9
Cash flow from financing activities -0.7 19.1
Net cash change in financial facilities -23.0 -6.3
Changes in cash and cash equivalents caused by currency exchange rates 1.7 0.0
Cash and cash equivalents at the beginning of the period 116.5 115.9
Cash and cash equivalents at the end of the period 95.2 109.6
STATEMENT OF CASH FLOWS:
SIGNIFICANT INVESTING ACTIVITY PLANNED AT THE START OF THE YEAR
Based on earnings after tax of EUR 15.9 million from continuing operations (previous year:
EUR 14.9 million), at EUR 3.5 million operating cash flow in the first three months of 2015 in-
creased significantly compared to the same period the previous year (previous year: EUR -9.8
million). The change in provisions is primarily due to the increased pension provisions as
a consequence of low interest rates applied and also a provision for the closure costs for the
portfolio company SEMET. Due to the stable economic situation, there was a further increase
in inventories and trade receivables. An additional effect resulted from cash outflows for lia-
bilities decreasing in comparison to the previous year.
At EUR -3.9 million, cash flow for interest paid was lower year-on-year in the first three
months (previous year: EUR -4.3 million). Due to the effects mentioned above, cash flow
from operating activities increased to EUR -0.4 million (previous year: EUR -14.0 million).

16 INDUS INTERIM REPORT – Q1 2015INTERIM MANAGEMENT REPORT
Cash outflow for investing activities was EUR -21.9 million in the first quarter (previous year:
EUR -11.4 million); the acquisition of the manufacturing site in Glauchau for OFA Bamberg
and increased investment as part of the increased internationalization of some portfolio com-
panies are included in this item.
Cash inflow from financing activities dropped from EUR 19.1 million to EUR -0.7 million. At
the start of last year, new credit lines were opened to ensure we can meet debt service obliga-
tions and to develop adequate reserve liquidity. At EUR 95.2 million as of the reporting date,
cash and cash equivalents are slightly below the previous year’s level.
CONSOLIDATED STATEMENT OF FINANCIAL POSITION, CONDENSED (in EUR millions)
March 31, 2015 Dec. 31, 2014
Assets
Noncurrent assets 757.4 748.0
Fixed assets 752.8 742.8
Accounts receivable and other current assets 4.6 5.2
Current assets 600.0 560.4
Inventories 295.3 265.7
Accounts receivable and other current assets 209.5 178.2
Cash and cash equivalents 95.2 116.5
Total assets 1,357.4 1,308.4
Equity and liabilities
Noncurrent liabilities 1,048.3 1,029.6
Equity 569.7 549.9
Debt 478.6 479.7
of which provisions 33.3 28.7
of which payables and income taxes 445.3 451.0
Current liabilities 309.1 178.8
of which provisions 56.7 52.0
of which liabilities 252.4 226.8
Total equity and liabilities 1,357.4 1,308.4
STATEMENT OF FINANCIAL POSITION:
EQUITY RATIO REMAINS AT 42 %, LIQUIDITY REMAINS HIGH
The INDUS Group’s consolidated total assets were higher primarily due to the increase in
working capital and amounted to EUR 1,357.4 million as of March 31 this year (December 31,
2014: EUR 1,308.4 million). The slight rise in long-term assets is largely due to the growth in
property, plant and equipment; the acquisition of the production site for OFA in Glauchau
had a particular impact here. The rise in current assets is primarily due to the growth in in-
ventories and receivables. Cash and cash equivalents amounted to EUR 95.2 million as of the
reporting date.

17INDUS INTERIM REPORT – Q1 2015INTERIM MANAGEMENT REPORT
Cash outflow for investing activities was EUR -21.9 million in the first quarter (previous year:
EUR -11.4 million); the acquisition of the manufacturing site in Glauchau for OFA Bamberg
and increased investment as part of the increased internationalization of some portfolio com-
panies are included in this item.
Cash inflow from financing activities dropped from EUR 19.1 million to EUR -0.7 million. At
the start of last year, new credit lines were opened to ensure we can meet debt service obliga-
tions and to develop adequate reserve liquidity. At EUR 95.2 million as of the reporting date,
cash and cash equivalents are slightly below the previous year’s level.
CONSOLIDATED STATEMENT OF FINANCIAL POSITION, CONDENSED (in EUR millions)
March 31, 2015 Dec. 31, 2014
Assets
Noncurrent assets 757.4 748.0
Fixed assets 752.8 742.8
Accounts receivable and other current assets 4.6 5.2
Current assets 600.0 560.4
Inventories 295.3 265.7
Accounts receivable and other current assets 209.5 178.2
Cash and cash equivalents 95.2 116.5
Total assets 1,357.4 1,308.4
Equity and liabilities
Noncurrent liabilities 1,048.3 1,029.6
Equity 569.7 549.9
Debt 478.6 479.7
of which provisions 33.3 28.7
of which payables and income taxes 445.3 451.0
Current liabilities 309.1 178.8
of which provisions 56.7 52.0
of which liabilities 252.4 226.8
Total equity and liabilities 1,357.4 1,308.4
STATEMENT OF FINANCIAL POSITION:
EQUITY RATIO REMAINS AT 42 %, LIQUIDITY REMAINS HIGH
The INDUS Group’s consolidated total assets were higher primarily due to the increase in
working capital and amounted to EUR 1,357.4 million as of March 31 this year (December 31,
2014: EUR 1,308.4 million). The slight rise in long-term assets is largely due to the growth in
property, plant and equipment; the acquisition of the production site for OFA in Glauchau
had a particular impact here. The rise in current assets is primarily due to the growth in in-
ventories and receivables. Cash and cash equivalents amounted to EUR 95.2 million as of the
reporting date.
The Group’s equity has increased to EUR 569.7 million (December 31, 2014: EUR 549.9 mil-
lion) as a consequence of the increase in other reserves as a result of the allocation of retained
earnings. Non-current liabilities fell slightly by EUR 5.7 million despite increased pension
provisions (as a consequence of the application of lower interest rates). Current liabilities in-
creased by EUR 25.6 million due mainly to a seasonal increase in working capital and higher
trade payables. The equity ratio was unchanged from year-end 2014 at 42.0 % (December 31,
2014: 42.0 %). At EUR 461.6 million, following the first quarter of 2015, financial liabilities
remain at the year-end level (December 31, 2014: EUR 462.3 million). Net debt in the Group
rose slightly to EUR 366.4 million due to increased investments in growth (December 31,
2014: EUR 345.9 million).
OPPORTUNITIES AND RISKS INDUS Holding AG and its portfolio companies are exposed to a multiplicity of risks as a
result of their international activities. Entrepreneurial activity is inextricably linked with
risk-taking. At the same time, this enables the company to seize new opportunities and thus
defend and strengthen the market position of the portfolio companies. The company oper-
ates an efficient risk management system for the early detection, comprehensive analysis, and
systematic handling of risks. The structuring of the risk management system and significance
of particular risks are discussed in detail in the 2014 annual report on pages 122 ff. Here it is
stated that the company does not view itself as subject to any risks that could endanger its
continued existence as a going concern. The INDUS Holding AG annual report can be down-
loaded free of charge at www.indus.de.
EVENTS AFTER THE REPORTING DATEThrough a contract dated May 12, 2015, OFA Bamberg GmbH acquired 100 % of the shares
in the Dutch company NEA International B.V. (NEA). As a developer and manufacturer of
orthopedic premium bandages and orthotic devices (OBO), NEA is a specialist in the area of
treating joint injuries and chronic conditions. The purchase price allocation is not yet com-
pleted.

18 INDUS INTERIM REPORT – Q1 2015INTERIM MANAGEMENT REPORT
OUTLOOKThe economic outlook for 2015 improved during the first three months of the year. At year-
end 2014, although the expectations of the industry associations relevant for INDUS were
positive overall, they did not expect growth rates of more than 2 %. The German govern-
ment’s economic assessment currently forecasts GDP growth of 1.5 % for 2015. However, the
improved expectations (the Ifo Business Climate Index rose from 102 to 103.5 points from
January to April 2015) primarily result not from an economic recovery, but are driven by the
capital markets; the massive bond purchases by the ECB have caused the euro to depreciate
significantly in the last few months. This weakness of the euro improves the competitiveness
of the export-oriented German economy. In addition, the prices of raw materials and energy
costs were stable.
INDUS reported significant growth in sales and achieved a good operating result in the first
three months; the sales growth is primarily due to acquisitions. All business performance
was in line with the plan. INDUS therefore reiterates its sales and earnings forecasts of more
than EUR 1.3 billion and EBIT of around EUR 125 to 130 million before the inclusion of the
proportional sales and earnings contributions from the acquisitions made over the course of
the year.
> SALES WILL EXCEED EUR 1.3 BILLION IN 2015
> OPERATING RESULT OF EUR 125 TO 130 MILLION EXPECTED

19INDUS INTERIM REPORT – Q1 2015CONSOLIDATED INTERIM FINANCIAL STATEMENTS
CONSOLIDATED INTERIM FINANCIAL STATEMENTS
CONSOLIDATED STATEMENT OF INCOMESTATEMENT OF INCOME AND ACCUMULATED EARNINGSCONSOLIDATED STATEMENT OF FINANCIAL POSITIONCONSOLIDATED STATEMENT OF EQUITYCONSOLIDATED STATEMENT OF CASH FLOWSNOTES
p. 20
p. 21
p. 22
p. 23
p. 24
p. 25
INDUS INTERIM REPORT – Q1 2015CONSOLIDATED INTERIM FINANCIAL STATEMENTS
19

20 INDUS INTERIM REPORT – Q1 2015CONSOLIDATED INTERIM FINANCIAL STATEMENTS
in EUR ’000 Notes Q1 2015 Q1 2014
Sales 327,870 287,187
Other operating income 5,874 4,121
Own work capitalized 740 564
Change in inventories 13,540 15,081
Cost of materials [4] -165,440 -144,533
Personnel expenses [5] -94,613 -84,097
Depreciation and amortization -11,932 -10,900
Other operating expenses [6] -44,702 -39,391
Income from shares accounted for using the equity method 119 207
Financial result 41 39
Operating result (EBIT) 31,497 28,278
Interest income 82 94
Interest expenses -6,801 -5,047
Net interest [7] -6,719 -4,953
Earnings before taxes 24,778 23,325
Taxes [8] -8,923 -8,477
Income from discontinued operations 0 -1,559
Earnings after taxes 15,855 13,289
of which allocable to non-controlling interests 81 171
of which allocable to INDUS shareholders 15,774 13,118
Earnings per share undiluted and diluted in EUR (continuing operations) [9] 0.65 0.60
CONSOLIDATED STATEMENT OF INCOME

21INDUS INTERIM REPORT – Q1 2015CONSOLIDATED INTERIM FINANCIAL STATEMENTS
in EUR ’000 Q1 2015 Q1 2014
Earnings after taxes 15,855 13,289
Actuarial gains and losses -4,350 -848
Deferred taxes 1,253 244
Items not reclassified to profit or loss -3,097 -604
Currency translation adjustment 6,615 -423
Change in the market values of derivative financial instruments (cash flow hedge) 543 -792
Deferred taxes -86 125
Items to be reclassified to profit or loss in future 7,072 -1,090
Other income 3,975 -1,694
Overall result 19,829 11,595
of which allocable to non-controlling shareholders 81 171
of which allocable to INDUS shareholders 19,748 11,424
The income and expenses of EUR 3,975,000 recognized directly in equity under other in-
come include EUR -4,350,000 in actuarial losses from pension plans and similar obligations.
These resulted primarily from lowering the interest rate on domestic commitments from
2.40 % as of December 31, 2014, to 1.44 % as of March 31, 2015.
Net income from currency translation of EUR 6,615,000 is derived from the translated
financial statements of consolidated international subsidiaries. The change in fair values of
derivative financial instruments in the amount of EUR 543,000 was chiefly the result of
interest rate swaps transacted by the holding company in order to hedge interest rate move-
ments.
STATEMENT OF INCOME AND ACCUMULATED EARNINGS

22 INDUS INTERIM REPORT – Q1 2015CONSOLIDATED INTERIM FINANCIAL STATEMENTS
in EUR ’000 Notes March 31, 2015 Dec. 31, 2014
ASSETS
Goodwill 369,662 368,239
Other intangible assets [10] 43,865 44,029
Property, plant, and equipment [11] 315,289 306,818
Investment property 6,095 6,131
Financial assets 10,753 10,526
Shares accounted for using the equity method 7,152 7,033
Other noncurrent assets 1,145 1,685
Deferred taxes 3,422 3,482
Noncurrent assets 757,383 747,943
Inventories [12] 295,301 265,690
Accounts receivable [13] 187,396 162,091
Other current assets 17,427 12,282
Current income taxes 4,692 3,890
Cash and cash equivalents 95,206 116,491
Current assets 600,022 560,444
Total assets 1,357,405 1,308,387
EQUITY AND LIABILITIES
Subscribed capital 63,571 63,571
Capital reserve 239,833 239,833
Other reserves 264,259 244,511
Equity held by INDUS shareholders 567,663 547,915
Non-controlling interests in the equity 2,038 1,957
Equity 569,701 549,872
Provisions for pensions 31,750 27,174
Other noncurrent provisions 1,551 1,561
Noncurrent financial liabilities 361,202 367,935
Other noncurrent liabilities 51,186 49,844
Deferred taxes 32,892 33,165
Noncurrent liabilities 478,581 479,679
Other current provisions 56,715 52,014
Current financial liabilities 100,371 94,381
Trade accounts payable 66,621 47,942
Other current liabilities 80,756 77,836
Current income taxes 4,660 6,663
Current liabilities 309,123 278,836
Total equity and liabilities 1,357,405 1,308,387
CONSOLIDATED STATEMENT OF FINANCIAL POSITION

23INDUS INTERIM REPORT – Q1 2015CONSOLIDATED INTERIM FINANCIAL STATEMENTS
CONSOLIDATED STATEMENT OF EQUITYin EUR ’000
Subscribed capital
Capital reserve
Retained earnings
Other earnings
Equity held by INDUS
shareholders
Interests allocable to
non-controlling shareholders
Group equity
Balance Dec. 31, 2013 63,571 239,833 216,024 -4,725 514,703 627 515,330
Income after taxes 13,118 13,118 171 13,289
Other income -1,694 -1,694 -1,694
Overall result 13,118 -1,694 11,424 171 11,595
Balance March 31, 2014 63,571 239,833 229,142 -6,419 526,127 798 526,925
Balance March 31, 2014 63,571 239,833 252,270 -7,759 547,915 1,957 549,872
Income after taxes 15,774 15,774 81 15,855
Other income 3,975 3,975 3,975
Overall result 15,774 3,975 19,748 81 19,829
Balance March 31, 2015 63,571 239,833 268,044 -3,784 567,663 2,038 569,701
Interests held by non-controlling shareholders essentially consist of the non-controlling in-
terests in WEIGAND Bau GmbH and subsidiaries of the ROLKO Group. Non-controlling
interests in limited partnerships and limited liability companies for which, at the time of
purchase, the economic ownership of the relevant non-controlling interests had already been
passed on under reciprocal option agreements are shown under other liabilities.

24 INDUS INTERIM REPORT – Q1 2015CONSOLIDATED INTERIM FINANCIAL STATEMENTS
in EUR ’000 Q1 2015 Q1 2014
Income after taxes generated by continuing operations 15,855 14,850
Depreciation/write-ups of noncurrent assets 11,932 10,900
Taxes 8,923 8,477
Net interest 6,719 4,953
Cash earnings of discontinued operations 0 -1,033
Other non-cash transactions 1,582 -1,568
Changes in provisions 9,267 1,801
Increase (-)/decrease (+) in inventories, trade accounts receivable, and other assets -60,266 -39,086
Increase (+)/decrease (-) in trade accounts payable and other liabilities 20,757 -504
Income taxes received/paid -11,307 -8,570
Operating cash flow 3,462 -9,780
Interest paid -3,907 -4,330
Interest received 82 94
Cash flow from operating activities -363 -14,016
Cash outflow from investments in
property, plant, and equipment, and in intangible assets -21,626 -11,857
financial assets and shares accounted for using the equity method -609 -185
Cash inflow from the disposal of other assets 382 660
Cash flow from investing activities -21,853 -11,382
Cash inflow from the assumption of debt 17,000 35,959
Cash outflow from the repayment of debt -17,744 -16,917
Cash flow from financing activities -744 19,042
Net cash change in financial facilities -22,960 -6,356
Changes in cash and cash equivalents caused by currency exchange rates 1,675 5
Cash and cash equivalents at the beginning of the period 116,491 115,921
Cash and cash equivalents at the end of the period 95,206 109,570
CONSOLIDATED STATEMENT OF CASH FLOWS

25INDUS INTERIM REPORT – Q1 2015CONSOLIDATED INTERIM FINANCIAL STATEMENTS
NOTESBASIC PRINCIPLES
[1] GENERAL INFORMATION
INDUS Holding AG, based in Bergisch Gladbach, Germany, prepared its consolidated finan-
cial statements for the period January 1 through March 31, 2015, in accordance with Inter-
national Financial Reporting Standards (IFRS) and interpretations of these standards by the
International Financial Reporting Standards Interpretations Committee (IFRS IC) as to their
applicability in the European Union (EU). The consolidated financial statements are prepared
in euros (EUR). Unless otherwise indicated, all amounts are stated in thousands of euros
(EUR ’000).
These interim financial statements are prepared in accordance with IAS 34 in condensed form.
The interim report has not been audited, nor subjected to perusal or review by an auditor.
New obligatory standards are reported on separately in the section “Changes in Accounting
Guidelines”. Otherwise, the same accounting methods were applied as in the consolidated
financial statements for the 2014 fiscal year. They are described there in detail. Because this
interim financial report does not provide the full scope of information found in the annual
financial statements, these financial statements should be considered within the context of
the last annual financial statements.
In the Board of Management’s view, this quarterly report includes all of the usual ongoing ad-
justments that are necessary for an appropriate presentation of the Group’s financial position
and financial performance. The results achieved in the first quarter of the 2015 fiscal year do
not necessarily predict future business performance.
The preparation of consolidated financial statements is influenced by accounting and valua-
tion principles, and requires assumptions and estimates to be made which have an impact on
the recognized value of the assets, liabilities, and contingent liabilities, as well as on income
and expenses. When estimates are made regarding the future, actual values may deviate from
the estimates. If the original basis for the estimates changes, the statement of the relevant
items is adjusted through profit and loss.

26 INDUS INTERIM REPORT – Q1 2015CONSOLIDATED INTERIM FINANCIAL STATEMENTS
[2] CHANGES IN ACCOUNTING GUIDELINES
All obligatory accounting standards in effect as of fiscal year 2015 have been implemented in
these interim financial statements.
The new standards do not affect in any way the presentation of the financial position and
financial performance of INDUS Holding AG in the consolidated financial statements.
[3] SCOPE OF CONSOLIDATION
The consolidated financial statements include all subsidiaries, in which INDUS Group is
able to directly or indirectly control the financial and business policies of said subsidiaries.
A parent company controls a subsidiary when the parent is exposed, or has rights, to variable
returns from its involvement with the subsidiary and has the ability to affect those returns
through its power over the subsidiary. Associated companies whose financial and business
policies can be significantly influenced are consolidated using the equity method. Companies
purchased during the course of the fiscal year are consolidated as of the date on which control
over their finance and business policy is transferred. Companies which are sold are no longer
included in the scope of consolidation as of the date on which the business is transferred.
After the date on which the decision is made to divest the company in question, these are
classified as “held for sale”.

27INDUS INTERIM REPORT – Q1 2015CONSOLIDATED INTERIM FINANCIAL STATEMENTS
NOTES TO THE STATEMENT OF INCOME
[4] COST OF MATERIALS
in EUR ’000 Q1 2015 Q1 2014
Raw materials and goods for resale -136,980 -126,581
Purchased services -28,460 -17,952
Total -165,440 -144,533
[5] PERSONNEL EXPENSES
in EUR ’000 Q1 2015 Q1 2014
Wages and salaries -80,435 -71,523
Social security -13,406 -11,776
Pensions -772 -798
Total -94,613 -84,097
[6] OTHER OPERATING EXPENSES
in EUR ’000 Q1 2015 Q1 2014
Selling expenses -17,352 -15,635
Operating expenses -15,767 -14,546
Administrative expenses -8,830 -7,817
Other expenses -2,753 -1,393
Total -44,702 -39,391

28 INDUS INTERIM REPORT – Q1 2015CONSOLIDATED INTERIM FINANCIAL STATEMENTS
[7] NET INTEREST
in EUR ’000 Q1 2015 Q1 2014
Interest and similar income 82 94
Interest and similar expenses -4,312 -4,184
Interest from operations -4,230 -4,090
Other: Market value of interest-rate swaps 60 172
Other: Non-controlling interests -2,549 -1,035
Other interest -2,489 -863
Total -6,719 -4,953
[8] INCOME TAXES
Income tax expense is calculated for the interim financial statements based on the assump-
tions of current tax planning.
[9] EARNINGS PER SHARE
in EUR ’000 Q1 2015 Q1 2014
Earnings attributable to INDUS shareholders 15,774 13,118
Earnings attributable to discontinued operations 0 -1,559
Earnings attributable to continuing operations 15,774 14,677
Weighted average shares outstanding (in thousands) 24,451 24,451
Earnings per share, continuing operations (in EUR) 0.65 0.60
Earnings per share, discontinued operations (in EUR) 0.00 -0.06

29INDUS INTERIM REPORT – Q1 2015CONSOLIDATED INTERIM FINANCIAL STATEMENTS
NOTES TO THE CONSOLIDATED STATEMENT OF FINANCIAL POSITION
[10] OTHER INTANGIBLE ASSETS
in EUR ’000 March 31, 2015 Dec. 31, 2014
Capitalized development costs 9,748 9,501
Property rights, concessions, and other intangible assets 34,117 34,528
Total 43,865 44,029
[11] PROPERTY, PLANT, AND EQUIPMENT
in EUR ’000 March 31, 2015 Dec. 31, 2014
Land and buildings 174,677 167,478
Plant and machinery 90,859 88,076
Other equipment, factory, and office equipment 41,770 41,294
Advance payments and work in process 7,982 9,970
Total 315,289 306,818
[12] INVENTORIES
in EUR ’000 March 31, 2015 Dec. 31, 2014
Raw materials and supplies 93,494 82,638
Unfinished goods 89,667 80,220
Finished goods and goods for resale 91,640 86,429
Prepayments for inventories 20,500 16,403
Total 295,301 265,690
[13] ACCOUNTS RECEIVABLE
in EUR ’000 March 31, 2015 Dec. 31, 2014
Accounts receivable from customers 167,385 144,421
Accounts receivable from construction contracts 12,972 11,649
Accounts receivable from associated companies 7,039 6,021
Total 187,396 162,091

30 INDUS INTERIM REPORT – Q1 2015CONSOLIDATED INTERIM FINANCIAL STATEMENTS
OTHER DISCLOSURES
[14] SEGMENT REPORTING
SEGMENT INFORMATION BY OPERATION (CONTINUING OPERATIONS)
FOR THE FIRST QUARTER OF 2015
SEGMENT INFORMATION IN ACCORDANCE WITH IFRS 8 (in EUR ’000)
Construction/Infrastructure
Automotive Technology
Engineering
Medical Engineering/
Life Science
Metals Technology
Total Segments
Reconciliation
Consolidated financial
statements
Q1 2015
Sales with external third parties 47,344 89,245 68,712 31,450 91,169 327,920 -50 327,870
Sales with Group companies 2,059 9,647 10,612 1,828 7,749 31,895 -31,895 0
Sales 49,403 98,892 79,324 33,278 98,918 359,815 -31,945 327,870
Segment earnings (EBIT) 4,695 6,209 9,513 4,707 7,145 32,269 -772 31,497
Earnings from equity valuation 0 119 0 0 0 119 0 119
Depreciation and amortization -1,489 -4,515 -1,771 -1,033 -2,969 -11,777 -155 -11,932
Segment EBITDA 6,184 10,724 11,284 5,740 10,114 44,046 -617 43,429
Capital expenditure 2,879 5,782 2,497 5,653 5,112 21,923 312 22,235
Q1 2014
Sales with external third parties 49,142 84,371 42,443 25,066 86,309 287,331 -144 287,187
Sales with Group companies 2,680 8,605 8,727 409 7,731 28,152 -28,152 0
Sales 51,822 92,976 51,170 25,475 94,040 315,483 -28,296 287,187
Segment earnings (EBIT) 4,572 5,536 5,330 4,379 9,377 29,194 -916 28,278
Earnings from equity valuation 0 207 0 0 0 207 0 207
Depreciation and amortization -1,316 -4,692 -1,442 -589 -2,722 -10,761 -139 -10,900
Segment EBITDA 5,888 10,228 6,772 4,968 12,099 39,955 -777 39,178
Capital expenditure 2,943 4,255 906 567 3,202 11,873 169 12,042

31INDUS INTERIM REPORT – Q1 2015CONSOLIDATED INTERIM FINANCIAL STATEMENTS
The table below reconciles the total operating results of segment reporting with the income
before tax in the consolidated income statement:
RECONCILIATION (in EUR ’000)
Q1 2015 Q1 2014
Segment earnings (EBIT) 32,269 29,194
Areas not allocated, incl. holding company -808 -939
Consolidations 36 23
Net interest -6,719 -4,953
Earnings before taxes 24,778 23,325
The classification of segments corresponds unchanged to the current status of internal re-
porting. The information relates to continuing activities. The companies are allocated to the
segments on the basis of their selling markets insofar as the bulk of their product range is sold
in that market environment (Automotive Technology, Medical Engineering/Life Science).
Otherwise they are classified by common features in their production structure (Construc-
tion/Infrastructure, Engineering, Metals Technology).
The reconciliations contain the figures of the holding company, non-operational units not al-
located to any segment, and consolidations. See the discussion provided in the management
report regarding the products and services that generate segment sales.
The central control variable for the segments is operating earnings (EBIT) as defined in the
consolidated financial statements. The segment information has been ascertained in compli-
ance with the reporting and valuation methods that were applied during the preparation of
the consolidated financial statements. Intersegment prices are based on arm’s length prices to
the extent that they can be established in a reliable manner and are determined on the basis of
the cost-plus pricing method.
32 INDUS INTERIM REPORT – Q1 2015CONSOLIDATED INTERIM FINANCIAL STATEMENTS
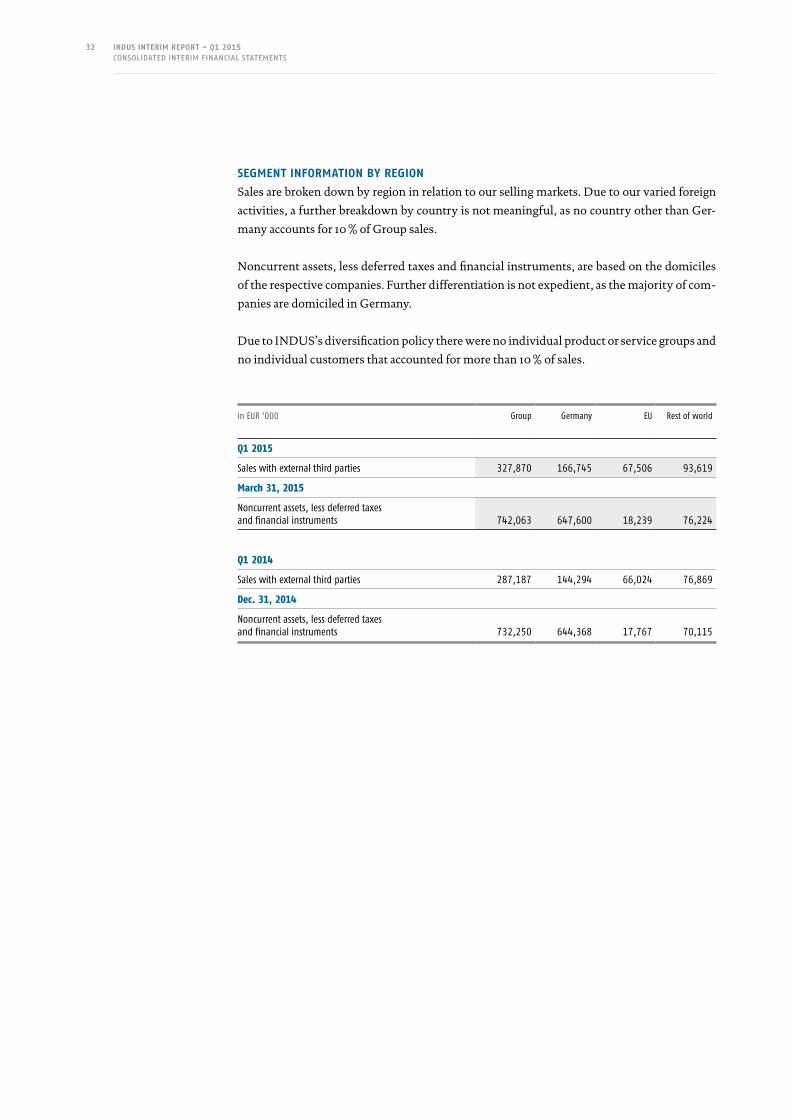
SEGMENT INFORMATION BY REGION
Sales are broken down by region in relation to our selling markets. Due to our varied foreign
activities, a further breakdown by country is not meaningful, as no country other than Ger-
many accounts for 10 % of Group sales.
Noncurrent assets, less deferred taxes and financial instruments, are based on the domiciles
of the respective companies. Further differentiation is not expedient, as the majority of com-
panies are domiciled in Germany.
Due to INDUS’s diversification policy there were no individual product or service groups and
no individual customers that accounted for more than 10 % of sales.
in EUR ’000 Group Germany EU Rest of world
Q1 2015
Sales with external third parties 327,870 166,745 67,506 93,619
March 31, 2015
Noncurrent assets, less deferred taxes and financial instruments 742,063 647,600 18,239 76,224
Q1 2014
Sales with external third parties 287,187 144,294 66,024 76,869
Dec. 31, 2014
Noncurrent assets, less deferred taxes and financial instruments 732,250 644,368 17,767 70,115

33INDUS INTERIM REPORT – Q1 2015CONSOLIDATED INTERIM FINANCIAL STATEMENTS
[15] INFORMATION ON THE SIGNIFICANCE OF FINANCIAL INSTRUMENTS
The table below shows the carrying amounts of financial instruments. The fair value of a
financial instrument is the price that would be paid in an orderly transaction between
market participants for the sale of an asset or transfer of a liability on the measurement date.
FINANCIAL INSTRUMENTS AS OF MARCH 31, 2015 (in EUR ’000)
Balance sheet value
IFRS 7 not applicable
Financial instruments IFRS 7
Measured at fair value
Measured at amortized cost
Financial assets 10,753 10,753 10,753
Cash and cash equivalents 95,206 95,206 95,206
Accounts receivable 187,396 12,972 174,424 174,424
Other assets 18,572 2,731 15,841 760 15,081
Financial Instruments: ASSETS 311,927 15,703 296,224 760 295,464
Financial liabilities 461,573 461,573 461,573
Trade accounts payable 66,621 66,621 66,621
Other liabilities 131,943 37,614 94,329 43,896 50,433
Financial Instruments: LIABILITIES 660,137 37,614 622,523 43,896 578,627
FINANCIAL INSTRUMENTS AS OF DEC. 31, 2014 (in EUR ’000)
Balance sheet value
IFRS 7 not applicable
Financial instruments IFRS 7
Measured at fair value
Measured at amortized cost
Financial assets 10,526 10,526 10,526
Cash and cash equivalents 116,491 116,491 116,491
Accounts receivable 162,091 11,649 150,442 150,442
Other assets 13,967 890 13,077 586 12,491
Financial Instruments: ASSETS 303,075 12,539 290,536 586 289,950
Financial liabilities 462,316 462,316 462,316
Trade accounts payable 47,942 47,942 47,942
Other liabilities 127,679 34,785 92,894 44,557 48,337
Financial Instruments: LIABILITIES 637,937 34,785 603,152 44,557 558,595

34 INDUS INTERIM REPORT – Q1 2015CONSOLIDATED INTERIM FINANCIAL STATEMENTS
FINANCIAL INSTRUMENTS BY VALUATION CATEGORIES IAS 39 (in EUR ’000)
March 31, 2015 Dec. 31, 2014
Measured at fair value through profit and loss 760 586
Loans and receivables 293,593 288,075
Available-for-sale financial assets 1,871 1,875
Financial instruments: ASSETS 296,224 290,536
Measured at fair value through profit and loss 43,896 44,557
Financial liabilities measured at their residual carrying amounts 578,627 558,595
Financial instruments: LIABILITIES 622,523 603,152
Available-for-sale financial assets are long-term financial investments for which no pricing
on an active market is available and the fair value of which cannot be reliably determined.
These are carried at cost.
[16] RELATED PARTY DISCLOSURES
Related party disclosures primarily involve the ongoing remuneration of members of man-
agement in key positions, the Board of Management, and the Supervisory Board. Further-
more, there are consulting contracts and rent or leasing contracts in place with non-con-
trolling shareholders or members of their families, and business relations with associated
companies.
The quarterly financial statements do not contain information about changes in relationships
that significantly differ from those in the 2014 annual financial statements.
[17] EVENTS AFTER THE QUARTERLY REPORTING DATE
Through a contract dated May 12, 2015, OFA Bamberg GmbH acquired 100 % of the shares in
the Dutch company NEA International B.V. (NEA), Maastricht. NEA develops orthopedic
bandages and orthoses for specific use in the area of treatment of joint injuries and chronic
conditions.
The purchase price allocation process has not yet been completed.

35INDUS INTERIM REPORT – Q1 2015CONSOLIDATED INTERIM FINANCIAL STATEMENTS
[18] APPROVAL FOR PUBLICATION
The Board of Management of INDUS Holding AG approved this IFRS interim financial
statement for publication on May 19, 2015.
Bergisch Gladbach, May 19, 2015
INDUS Holding AG
The Board of Management
Jürgen Abromeit Dr. Johannes Schmidt Rudolf Weichert

36 INDUS INTERIM REPORT – Q1 2015CONTACT | FINANCIAL CALENDAR | IMPRINT
IMPRINT
Responsible member of the
Management Board:
Jürgen Abromeit
Head of Public Relations &
Investor Relations:
Regina Wolter
Phone: +49 (0)2204/40 00-70
Fax: +49 (0)2204/40 00-20
E-mail: [email protected]
Publisher:
INDUS Holding AG, Bergisch Gladbach
Concept/Design:
Berichtsmanufaktur GmbH, Hamburg
Photos:
Cover: OFA
Page 4: OFA
CONTACT
FINANCIAL CALENDAR 2015
INDUS Holding AG
Kölner Straße 32
51429 Bergisch Gladbach
P.O. Box 10 03 53
51403 Bergisch Gladbach
Phone: +49 (0)2204/40 00-0
Fax: +49 (0)2204/40 00-20
Internet: www.indus.de
E-mail: [email protected]
June 3, 2015 Annual Shareholders’ meeting 2015
June 4, 2015 Payout of dividend
August 18, 2015 Interim report on June 30, 2015
November 17, 2015 Interim report on September 30, 2015

This interim report is also available in German. Only the German version of the interim report is legally binding.
Disclaimer: This interim report contains forward-looking statements based on assumptions and estimates made by the Board of Management of INDUS Holding AG. Although the Board of Management is of the opinion that these assumptions and estimates are accurate, they are subject to certain risks and uncertainty. Actual future results may deviate substantially from these assumptions and estimates due to a variety of factors. These factors include changes in the general economic situation, the business, economic and competitive situation, foreign exchange and interest rates, and the legal setting. INDUS Holding AG shall not be held liable for the future development and actual future results being in line with the assumptions and estimates included in this interim report. Assumptions and estimates made in this interim report will not be updated.

WWW. INDUS.DE