q1 2009 earning report of convergys corp
TRANSCRIPT

First Quarter 2009 Earnings Presentation
April 28, 2009

2
Forward-Looking Statements and Non-GAAP Measures
This presentations contains “forward-looking statements,” - that is, statements relating to future, not past, events.
Forward-looking statements by their nature address matters that are, to different degrees, uncertain. For us,
particular uncertainties that could adversely or positively affect our future results include: the behavior of financial
markets, including fluctuations in interest or exchange rates; continued volatility and further deterioration of the
capital markets; the impact of regulation and regulatory, investigative and legal actions; strategic actions, including
acquisitions and dispositions; future integration of acquired businesses; future financial performance of major
industries which we serve; the loss of a significant client or significant business from a client; difficulties in
completing a contract or implementing its provisions; and numerous other matters of national, regional and global
scale, including those of the political, economic, business and competitive nature. These uncertainties may cause
our actual future results to be materially different than those expressed in our forward-looking statements. Please
refer to Convergys’ most recent news releases and filings with the SEC for additional information including risk
factors. We do not undertake to update our forward-looking statements as a result of new information or future
events or developments.
This presentation also includes non-GAAP financial measures including free cash flow. These non-GAAP measures
should not be construed as being more important than comparable GAAP measures. Convergys’ management
believes free cash flow provides the users of the financial statements with a more comprehensive understanding of
the Company’s underlying performance. A reconciliation of these non-GAAP measures is available on the
Convergys website at www.convergys.com
Today’s presentation is intended to be reviewed in connection with Convergys’ first quarter 2009 earnings call.
3
Agenda
Operating ResultsOperating Results
Financial ReviewFinancial Review
Business OutlookBusiness Outlook
4
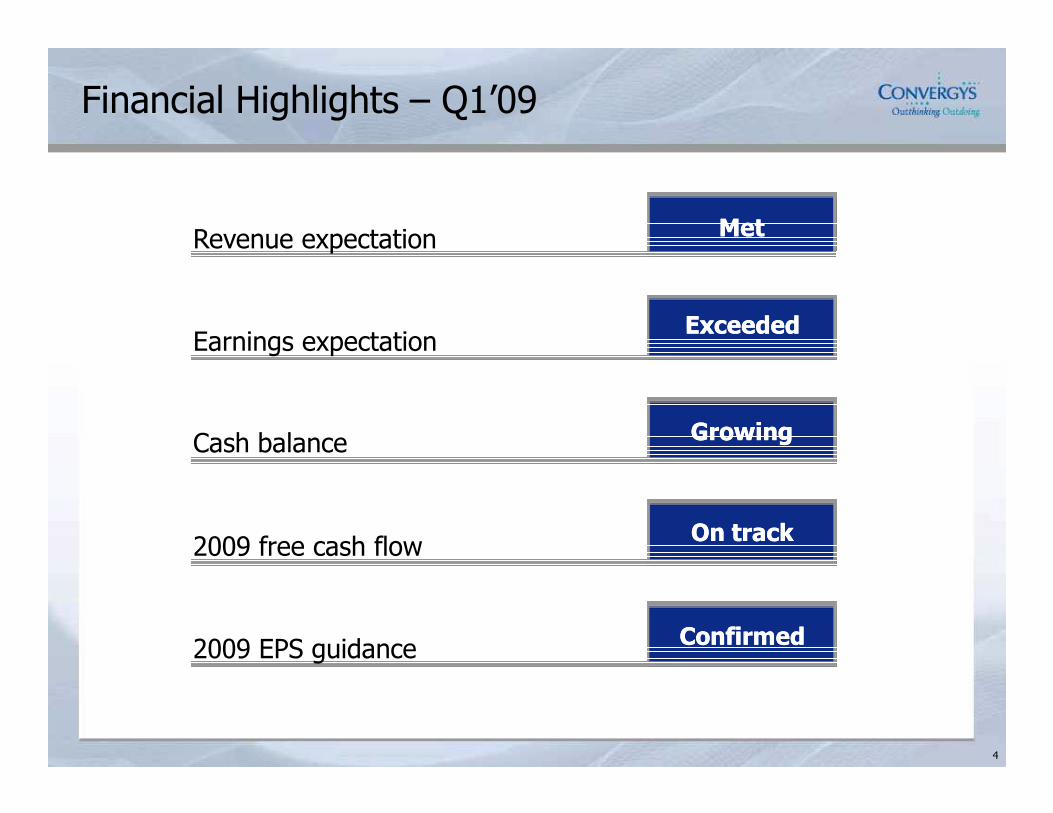
Financial Highlights – Q1’09
Revenue expectation MetMet
Earnings expectationExceededExceeded
Cash balance GrowingGrowing
2009 free cash flowOn trackOn track
2009 EPS guidanceConfirmedConfirmed

5
Convergys ImplicationsConvergys ImplicationsClient ImpactsClient Impacts
CUSTOMER MANAGEMENT
Slow Economy Driving Demand for Quality
• Set to meet demand for full range of capabilities:
– agent-assisted
– automated
• Volume declines with some existing programs
• Winning new programs with existing and new clients
• Leverage record of delivering quality service at lower cost
• Business slowdown
– limited growth with new consumers
– heightened risk of churn with current consumers
• Clients focused on:
– retaining consumers
– increasing customer satisfaction
– reducing cost
Ranked #1 or #2 with top clientsRanked #1 or #2 with top clients

6
CUSTOMER MANAGEMENT
Positioning for Growth and Improving Operations
Q1’09 Revenue Progress
• Signing contracts
– new programs
– longer cycle
– strong renewal rates
• Intervoice contributing
• Robust pipeline
Customer ManagementOperating Income ($M)
$40
$28$22
Q1'08 Q4'08 Q1'09
Margin
4.6% 5.3% 7.8%

7
INFORMATION MANAGEMENT
Focused on Improving Productivity
Q1’09 Status
• Revenue
– sequential declines slowing, recurring revenue stream visibility
• Operating income
– stabilizing with double-digit margins
• New business
– growing pipeline, signing contracts, some delays
• Investing for growth
– enhancing BSS/OSS, new market and application capabilities

8
HR MANAGEMENT
Taking Actions to Limit Risk and Reduce Cost
Q1’09 Status
• Fortune 50 “go-lives”
– over half employees being served
• Implementation challenges
– complexity and cost
• Working to limit risk and reduce cost
– negotiating future phases, leveraging partners
• Not signing contracts with implementation risk

9
Priorities in Challenging Environment
• Manage cash and liquidity
• Continue relationship management strategy execution
• Position Information Management for growth in a recovery
• Execute HR Management partner-based implementation strategy
• Ensure cost structure aligned with revenue
Emerge stronger and better positionedEmerge stronger and better positioned

10
Agenda
Operating ResultsOperating Results
Financial ReviewFinancial Review
Business OutlookBusiness Outlook

11
Financial Summary – Q1’09
Revenue$695 million$695 million
Operating income$39 million$39 million
Earnings per share$0.23$0.23
Cash balance$278 million$278 million

12
CUSTOMER MANAGEMENT
Revenues
Q1’09 Summary
• Up 9% yoy
• Intervoice: $43 million
• Soft economy
– volume declines
– technology sales slow
• Delivery capacity expansion
– Philippines
– Latin America
• Robust pipeline
Customer ManagementRevenues ($M)
$476$527 $517
Q1'08 Q4'08 Q1'09
INTV

13
CUSTOMER MANAGEMENT
Operating Income
$Millions Q1’08 Q4’08 Q1’09
Restructuring costs $5 $9 -
Operating income $22 $28 $40
Margin 4.6% 5.3% 7.8%
Q1’09 impacts
• Operating improvement
– tight workforce management, price increases, overhead reductions
• 100 bps negative impact from foreign exchange
• Investments
– technology infrastructure, sales resources, consulting

14
INFORMATION MANAGEMENT
Revenues
Q1’09 Summary
• North America revenue
– new client
– migration impact
• International revenue
– project completions
• Declines slowing
• Emerging opportunities
Information ManagementRevenues ($M)
$108 $114
$163
Q1'08 Q4'08 Q1'09
North American consolidation

15
INFORMATION MANAGEMENT
Operating Income
$Millions Q1’08 Q4’08 Q1’09
Restructuring costs $7 $3 -
Operating income $30 $12 $13
Margin 18.1% 10.2% 11.6%
Q1’09 impacts
• Operating performance
– revenue decline, good cost management
• Investments
– $4 million increase in R&D
– $1 million increase in sales resources
16
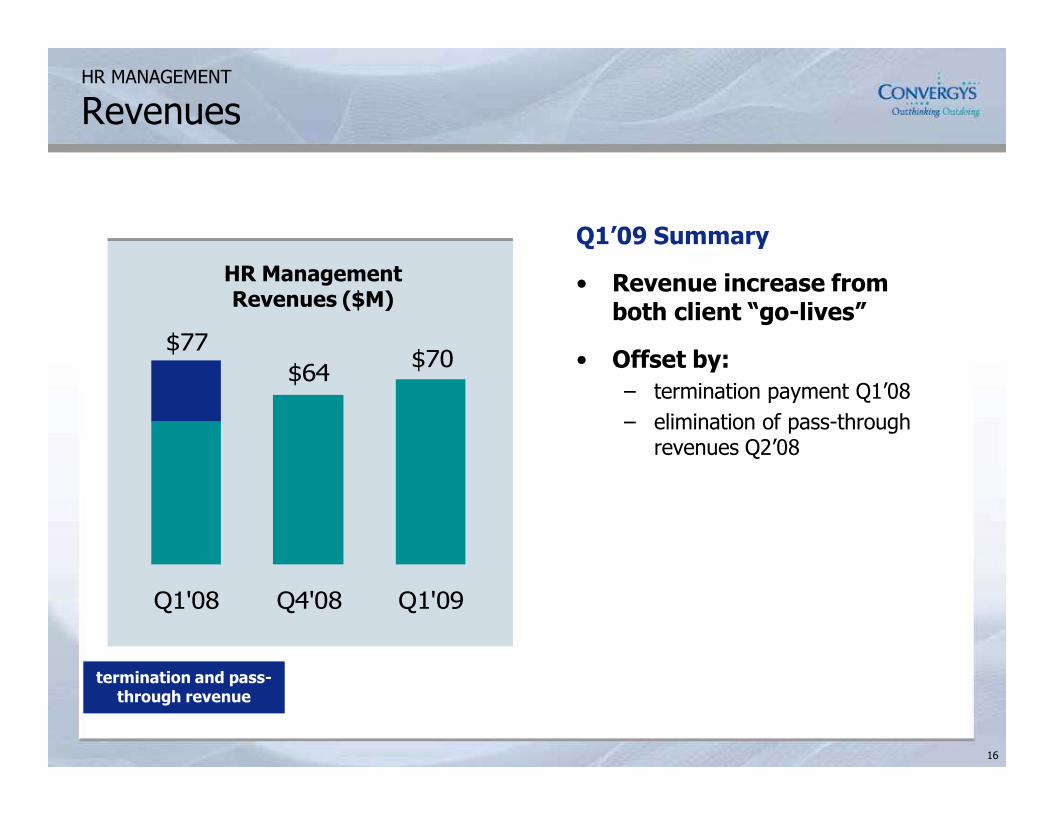
HR MANAGEMENT
Revenues
Q1’09 Summary
• Revenue increase from both client “go-lives”
• Offset by:
– termination payment Q1’08
– elimination of pass-through revenues Q2’08
HR ManagementRevenues ($M)
$70$64
$77
Q1'08 Q4'08 Q1'09
termination and pass-through revenue

17
HR MANAGEMENT
Operating Income
$Millions Q1’08 Q4’08 Q1’09
Implementation and restructuring costs $2 $70 $9
Operating income $(5) $(70) $(10)
Margin NM NM NM
Q1’09
• Excess implementation cost
– $9 million expensed rather than capitalized
• Negotiating with clients to reduce risk

18
Non-operating Items
$Millions Q1’08 Q4’08 Q1’09
Cellular partnership earnings $7 $10 $11
Other income $(1) $6 $(5)
Interest expense $(4) $(9) $(7)
Total non-operating items $2 $7 $(1)
Q1’09 impacts
• Other income
– currency fluctuations
• Interest expense
– higher debt (Intervoice acquisition) and interest rates
• Tax rate 25%
19
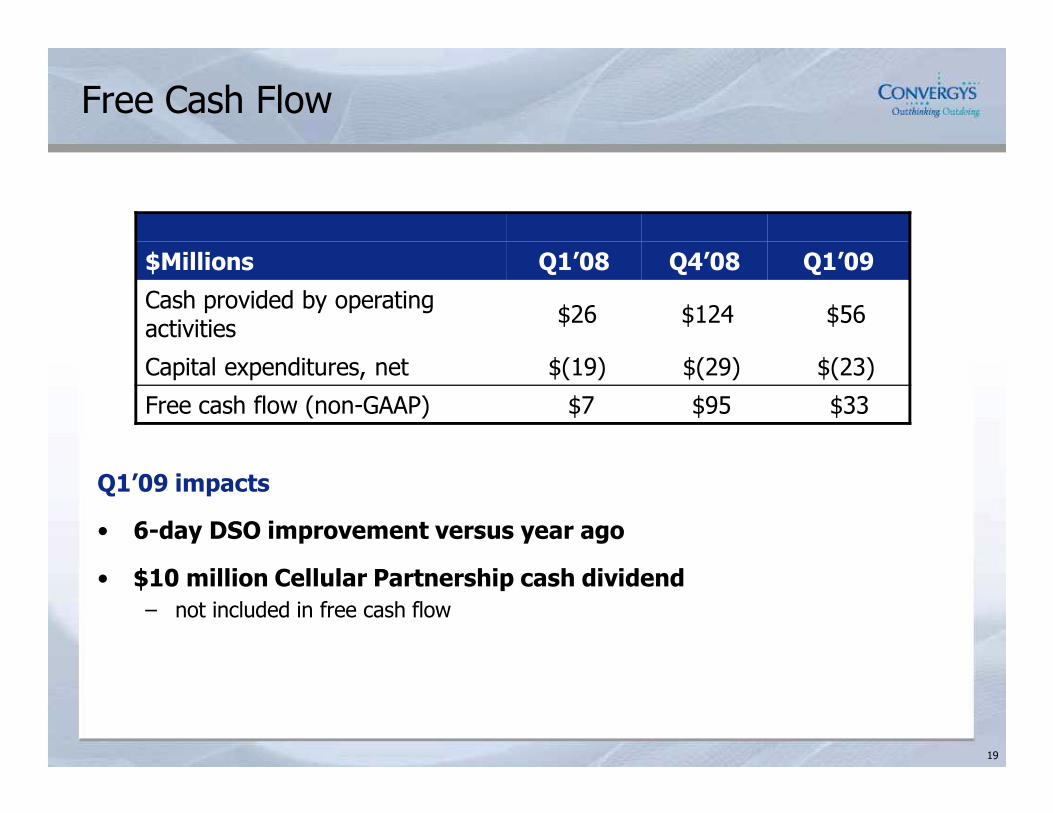
Free Cash Flow
$Millions Q1’08 Q4’08 Q1’09
Cash provided by operating activities
$26 $124 $56
Capital expenditures, net $(19) $(29) $(23)
Free cash flow (non-GAAP) $7 $95 $33
Q1’09 impacts
• 6-day DSO improvement versus year ago
• $10 million Cellular Partnership cash dividend
– not included in free cash flow

20
Agenda
Operating ResultsOperating Results
Financial ReviewFinancial Review
Business OutlookBusiness Outlook

21
Confirming 2009 Business Outlook
2009 Guidance
Revenue
Operating income and margin
Earnings per diluted share $0.90 to $1.10
Free cash flow ~$200 million
Interest expense
Customer Management
Information Management
HR Management

22
Financial Highlights – Q1’09
Revenue expectation MetMet
Earnings expectationExceededExceeded
Cash balance GrowingGrowing
2009 free cash flowOn trackOn track
2009 EPS guidanceConfirmedConfirmed