q-value effects in the synthesis of superheavy elements...superheavy elements (z&104) only exist...
TRANSCRIPT

TECHNISCHE UNIVERSITAT MUNCHEN
Lehrstuhl fur Radiochemie
Q-value effects in the synthesis of superheavy elements
Reimar Graeger
Vollstandiger Abdruck der von der Fakultat fur Chemie
der Technischen Universitat Munchen zur Erlangung des akademischen Grades eines
Doktors der Naturwissenschaften (Dr. rer. nat.)
genehmigten Dissertation.
Vorsitzender: Univ.-Prof. Dr. K. Kohler
Prufer der Dissertation:
1. Univ.-Prof. Dr. A. Turler
2. Univ.-Prof. Dr. R. Krucken
3. Priv.-Doz. Dr. A. Yakushev
Die Dissertation wurde am 14.06.2010 bei der Technischen Universitat Munchen eingereicht
und durch die Fakultat fur Chemie am 02.07.2010 angenommen.

Abstract
Superheavy elements (Z&104) only exist due to nuclear shell effects, which stabilize
them against spontaneous fission (SF). Theoretical calculations predict these shell sta-
bilization effects to reach a maximum at the closures of the next spherical proton and
neutron shells, which are anticipated in the region between Z=114 and Z=126 and at
N=184. More recent calculations, that also consider deformed nuclear shapes extended
this picture and predicted deformed shell closures at Z=108 and at N=162, creating a
region of enhanced stability around 270Hs, confirmed in recent Hs chemistry experiments
by measuring the decay of 270Hs for the first time.
Recently, the formation of deformed doubly-magic 270Hs in the 4n evaporation chan-
nel in the fusion reactions 248Cm(26Mg, 4n), 244Pu(30Si, 4n), 238U(36S, 4n), and 226Ra(48Ca,
4n) was studied theoretically using a two-parameter Smoluchowski equation. Simple en-
trance channel arguments make compound nucleus (CN) formation appear favorable for
systems with larger mass asymmetry. However, due to a lower reaction Q value, the
reactions 238U(36S, 4n)270Hs and 226Ra(48Ca, 4n)270Hs are predicted to have higher cross
sections compared to the reactions 248Cm(26Mg, 4n)270Hs and 244Pu(30Si, 4n)270Hs.
The aim of the research done in the framework of this thesis was to study the influence
of the reaction (B-Q)-value on the yield of SHE produced in nuclear fusion reactions.
Therefore the most promising reactions 36S+238U and 48Ca+226Ra have been investigated
and compared with the already measured reaction 26Mg+248Cm. The reaction 36S+238U
was investigated at two beam energies. One correlated decay chain attributed to 270Hs
was found at E*=51 MeV resulting in a cross section of 0.8+2.6−0.7 pb. The reaction 48Ca +
226Ra was investigated at three beam energies. Six correlated decay chains attributed
to 270Hs were detected at E*=40 MeV corresponding to a cross section of 8.3+6.7−3.7 pb.
Since all reactions result in the same CN (274Hs), the exit channel is nearly identical
for them at the same excitation energy and could not explain possible differences in cross
sections. Hence, the entrance channel and in particular the fusion probability, depending
on the (B-Q)-value and the reaction asymmetry have a major impact on the production
cross section. For intermediate energies (E*≈40 MeV) the fusion probability is mainly
influenced by the (B-Q)-value and therefore the reaction 48Ca + 226Ra, whose fusion
probability is already saturated for such energies in contrast to both other reactions
provides largest measured 4n cross sections. At high excitation (E*≈50 MeV) the fusion
probability of all three reactions is saturated and hence the most asymmetric reaction26Mg + 248Cm with the largest saturation level provides largest production cross section.
The slightly better (B-Q)-value of the reaction 36S + 238U compared with 26Mg + 248Cm
is not affecting the cross section at all, in contrast to theoretical calculations.

Zusammenfassung
Superschwere Elemente (Z≥104) existieren nur durch Kernschaleneffekte, welche sie
gegen Spontanspaltung stabilisieren. Theoretische Berechnungen sagen ein Maximum
diese Stabilisierungseffekte fur die nachste geschlossenen Protonen- und Neutronenschale
voraus, welche in der Region zwischen Z=114 und Z=126 und fur N=184 angenommen
wird. Aktuellere Berechnungen, welche auch Kerndeformationen berucksichtigen erweit-
ern dieses Bild und sagen deformierte Schalenabschlusse fur Z=108 und N=162 voraus.
Um 270Hs bildet sich somit eine Region erhohter Stabilitat, was kurzlich in Hs Chemie-
experimenten durch die erstmalige Messung des Zerfalls von 270Hs nachgewiesen wurde.
Kurzlich wurde die Bildung des deformierten doppelt magischen 270Hs im 4n Kanal
der Fusionreaktionen 248Cm(26Mg, 4n), 244Pu(30Si, 4n), 238U(36S, 4n), und 226Ra(48Ca,
4n) theoretisch mithilfe einer zwei-Parameter Smoluchowskigleichung studiert. Einfache
Eingangskanalargumente bevorzugen die CN Bildung fur Systeme grosser Massenasym-
metrie. Aufgrund niedriger Reaktions-Q-Werte, sollen die Reaktionen 238U(36S, 4n)270Hs
und 226Ra(48Ca, 4n)270Hs hohere Wirkunsquerschnitte im Vergleich zu den Reaktionen248Cm(26Mg, 4n)270Hs und 244Pu(30Si, 4n)270Hs aufweisen.
Das Ziel der Forschung im Rahmen dieser Dissertation war das Studium des Einflusses
des Reaktions (B-Q)-Werts auf den Ertrag an SHE in Fusionsreaktionen. Es wurden die
erfolgversprechendsten Reaktionen 36S + 238U und 48Ca + 226Ra untersucht und mit der
schon gemessenen Reaktion 26Mg + 248Cm verglichen. Die Reaktion 36S + 238U wurde
bei zwei Strahlenergien untersucht. Eine Zerfallskette von 270Hs wurde gefunden bei
E*=51 MeV, womit sich ein Wirkungsquerschnitt von 0.8+2.6−0.7 pb ergab. Die Reaktion
48Ca + 226Ra wurde bei drei Strahlenergien untersucht. Sechs Zerfallsketten von 270Hs
wurden gefunden bei E*=40 MeV. Der Wirkungsquerschnitt betragt 8.3+6.7−3.7 pb.
Alle Reaktionen ergeben denselben CN (274Hs), der Ausgangkanal ist somit fast iden-
tisch bei gleichen Anregungsenergien und erklart keine Querschnitteunterschiede. Da-
her hat der Eingangskanal und besonders die Fusionswahrscheinlichkeit, abhangig vom
(B-Q)-Wert den grossten Einfluss auf den Produktionsquerschnitt. Bei mittleren En-
ergien (E*≈40 MeV) ist die Fusionswahrscheinlichkeit hauptsachlich vom (B-Q)-Wert
abhangig, daher hat die Reaktion 48Ca+226Ra den hochsten gemessenen 4n Querschnitt,
da die Fusionswahrscheinlichkeit bei solchen Energien bereits gesattigt ist, im Gegensatz
zu den anderen beiden Reaktionen. Bei hoheren Anregungsenergien (E*≈50 MeV) ist
die Fusionswahrscheinlichkeit von allen drei Reaktionen gesattigt, daher weist die asym-
metrischte Reaktion 26Mg + 248Cm den grossten Querschnitt auf. Der wenig gunstigere
(B-Q)-Wert der Reaktion 36S + 238U verglichen mit 26Mg + 248Cm beeinflusst den Quer-
schnitt nicht, im Gegensatz zu theoretischen Berechnungen.

vi
Acknowledgements
This thesis was conducted in the frame of research at the Institut fur Radiochemie
at the Technische Univerversitat Munchen from March 2007 until April 2010 under the
kind guidance of Prof. Dr. A. Turler and PD Dr. A. Yakushev.
It is a pleasure to thank those who made this thesis possible. This thesis would not
have been possible without the support, hard work, and endless efforts of a large number
of persons. I want to thank all of you, my colleagues, my friends, and my family, who
helped and inspired me during my conferral of a doctorate.
In the first place, I owe my deepest and sincerest gratitude to my mentor, PD Dr.
A. Yakushev. I would like to record my thankfulness to him for his neverending effort,
advice, and guidance from the very early stage of this research as well as giving me
extraordinary experiences through out the work. During the last three years and the
plenty time we spent at experiments, conferences, or invitations of his wife and him, I
became acquainted with him. He has an admirable personality which I am very appre-
ciative of, always honest, helpful, loyal, and sacrificially careing. Above all, he provided
me unflinching encouragement, always ready to help, patiently answering my rudimen-
tary questions, supporting me in every possible way. His truly scientist intuition has
made him as a constant oasis of ideas and passions in science. He taught me everything
I know about the ”superheavies”, sharing a small part of his huge knowledge to me. I
am indebted to him more than he knows.
I gratefully acknowledge Prof. Dr. A Turler for his confidence he has placed in me
and allowing me to participate such an important and exciting research field. To work
with him during the last three years was always enlightened. His firm support helped
me with any problem I was confronted. I deeply appreciate his kind cordiality, which
allowes us to enjoy many interesting friendly discussions. One could not wish for a better
and friendlier supervisor.
vii

viii
Many thanks go to the group Kernchemie at GSI, where we spend so much time
on our experiments. All members of the group were very helpful and working very
professionally. Because of the friendly atmosphere in the group, we spent extraordinary
pleasant times during our experiments. In particular, I would like to acknowledge Dr. M.
Schadel, who always granted me his time even for answering some of my questions, Dr.
Ch. Dullmann, who helped me with many problems and found always time to support
me, Dipl.-Ing. E. Jager, who has particular skills in handling delicate equipments, J.
Krier and E. Schimpf, who can construct them, Dr. A. Semchenkov, who could answer
lots of my questions, and B. Schausten, the good soul of the group.
For their help and support beside the group Kernchemie, concerning the TUM Hs
chemistry experiment, I want to thank first of all J. Dvorak from LBNL, who has helped
so much with the experimental setup; M. Chelnokov, V. Chepigin, A. Kuznetsov and O.
Petrushkin from FLNR; J. Even, D. Hild, J. V. Kratz and J. Runke from Universitat
Mainz; D. Ackermann, F. P. Hessberger and J. Khuyagbaatar from the SHIP group at
GSI; J. P. Omtvedt and F. Samadani from Oslo university; K. Nishio from JAEA; Q. Zhi
from IMP; D. Rudolph from Lund university; H. Nitsche from LBNL and A. Hubner,
B. Kindler, B. Lommel from GSI target laboratory.
Many thanks go to the group of the DGFRS at FLNR in Dubna, Russia, who invited
us two times for an experiment, which was a main part of this thesis. In particular, I
would like to acknowledge Prof. Dr. Yu. Oganessian, member of RAS, who gave me the
chance to participate these exciting experiments and Dr. V. Utyonkov, who supported
and helped me in so many ways during the experiment but also in the time after. I am
indepted to him and I really enjoyed the work with him. But also I want to thank all
others of the DGFRS group, F. Abdullin, A. Poliakov, R. Sagaidak, I. Shirokovski, Y.
Tsyganov, A. Voinov and V. Krashonkin.
I benefited from an extraordinary team of coworkers, which I had an opportunity to
meet every day at Institut fur Radiochemie. I am grateful for giving me such a pleasant
time when working together. It will be difficult to ever find again a group of people,
which posses not only high professional skills, but which are at the same time so caring,
so human. I deeply appreciate the conditions, which they prepared for my research.
Many thanks goes to members of our small group of superheavy elements, in particular
to A. Gorshkov, who helped me to make things clear and who was a great friend. Most
time I spend with my collegues Ch. Barkhausen, A. Klaschwitz, F. Ried, S. Lehenberger
and B. Rohrmoser. I had a great time with these fantastic collegues, who became real
good friends. I appreciate the openness of all scientific coworkers at the RCM, which

ix
shared with me the beauty of radiochemistry, showed me its broadness and usefulness.
I would like to thank for extensive support from our workshop, because without their
fast and yet precise work no experiments would be possible. I acknowledge I. Kaul for
her help with administrative tasks. I owe my gratitude to the members of the group
of radiation safety, who helped us every time with all our concerns in a very friendly
manner.
I would like to thank the staff and crew of the GSI UNILAC for providing stable and
intense 36S beams. This project was supported by BMBF Projects No. 06MP247I and
06MZ223I.
Finally I deeply acknowledge my family and in particular, my father, my mother and
my sister, who helped and supported me over the years so much. I am so grateful to
them, more than they know.
Reimar Graeger

x

Contents
1 Introduction 1
1.1 Motivation . . . . . . . . . . . . . . . . . . . . . . . . . . . . . . . . . . . 1
1.1.1 History of the synthesis of heaviest elements . . . . . . . . . . . . 1
1.1.2 History of the investigation of the doubly magic nucleus 270Hs and
perspectives for SHE synthesis . . . . . . . . . . . . . . . . . . . . 8
1.2 Stability of SHE . . . . . . . . . . . . . . . . . . . . . . . . . . . . . . . . 9
1.2.1 Liquid drop model . . . . . . . . . . . . . . . . . . . . . . . . . . 10
1.2.2 Nuclear shell model . . . . . . . . . . . . . . . . . . . . . . . . . . 12
1.2.3 Strutinski method and the stability of SHE . . . . . . . . . . . . . 16
1.3 Synthesis of SHE . . . . . . . . . . . . . . . . . . . . . . . . . . . . . . . 17
1.3.1 Introduction . . . . . . . . . . . . . . . . . . . . . . . . . . . . . . 17
1.3.2 Theory of the complete fusion of heavy nuclei . . . . . . . . . . . 19
1.3.3 Predicted cross sections for the formation of 270Hs from different
nuclear fusion reactions . . . . . . . . . . . . . . . . . . . . . . . . 28
1.3.4 Experimental challenges on the production of SHE . . . . . . . . 35
1.4 Decay properties of SHE . . . . . . . . . . . . . . . . . . . . . . . . . . . 36
1.4.1 Decay properties and stability of heaviest elements . . . . . . . . 36
1.4.2 Decay properties and production of isotopes near Z=108, N=162 . 40
1.5 Kinematic separators . . . . . . . . . . . . . . . . . . . . . . . . . . . . . 42
xi
xii Contents
1.5.1 Overview . . . . . . . . . . . . . . . . . . . . . . . . . . . . . . . 42
1.5.2 Theory and layout of gas-filled separators . . . . . . . . . . . . . . 43
1.6 Chemistry of SHE . . . . . . . . . . . . . . . . . . . . . . . . . . . . . . . 47
1.6.1 Introduction of chemical properties of SHE . . . . . . . . . . . . . 47
1.6.2 Hs chemistry . . . . . . . . . . . . . . . . . . . . . . . . . . . . . 49
1.7 Summary and purpose . . . . . . . . . . . . . . . . . . . . . . . . . . . . 52
2 Experimental setup 57
2.1 Overview . . . . . . . . . . . . . . . . . . . . . . . . . . . . . . . . . . . . 57
2.2 Chemistry experiments . . . . . . . . . . . . . . . . . . . . . . . . . . . . 58
2.2.1 Overview . . . . . . . . . . . . . . . . . . . . . . . . . . . . . . . 58
2.2.2 Preparation of 36SO2 . . . . . . . . . . . . . . . . . . . . . . . . . 61
2.2.3 Irradiation Setup . . . . . . . . . . . . . . . . . . . . . . . . . . . 62
2.2.4 COMPACT . . . . . . . . . . . . . . . . . . . . . . . . . . . . . . 68
2.2.5 Gas system . . . . . . . . . . . . . . . . . . . . . . . . . . . . . . 73
2.3 DGFRS experiments . . . . . . . . . . . . . . . . . . . . . . . . . . . . . 77
2.3.1 The DGFRS . . . . . . . . . . . . . . . . . . . . . . . . . . . . . . 77
2.3.2 Irradiation setup . . . . . . . . . . . . . . . . . . . . . . . . . . . 79
2.3.3 Detection system . . . . . . . . . . . . . . . . . . . . . . . . . . . 82
3 Analysis of the experimental data 85
3.1 Analysis of experimental data from the DGFRS experiments . . . . . . . 85
3.1.1 Experiments on the reaction 48Ca + 226Ra . . . . . . . . . . . . . 85
3.2 Analysis of experimental data from the TUM Hs chemistry experiment . 87
3.2.1 Experiment on the reaction 36S + 238U . . . . . . . . . . . . . . . 87
3.3 Overall efficiency . . . . . . . . . . . . . . . . . . . . . . . . . . . . . . . 90
Contents xiii
3.3.1 Transport efficiency . . . . . . . . . . . . . . . . . . . . . . . . . . 90
3.3.2 Detection efficiency of COMPACT . . . . . . . . . . . . . . . . . 91
3.4 Time correlation search . . . . . . . . . . . . . . . . . . . . . . . . . . . . 99
3.4.1 Correlation search in subsequent time windows . . . . . . . . . . . 101
3.4.2 Search efficiency of the subsequent time windows method . . . . . 102
3.4.3 Conclusion on correlation search method . . . . . . . . . . . . . . 103
4 Results and discussion 105
4.1 TUM chemistry experiments . . . . . . . . . . . . . . . . . . . . . . . . . 105
4.1.1 Results on experiments on the reaction 36S+ 238U . . . . . . . . . 106
4.1.2 Excitation function of the complete fusion reaction 36S+238U . . . 108
4.2 FLNR separator experiments . . . . . . . . . . . . . . . . . . . . . . . . . 110
4.2.1 Results . . . . . . . . . . . . . . . . . . . . . . . . . . . . . . . . . 110
4.2.2 Excitation function of the complete fusion reaction 48Ca+226Ra . 117
4.3 Discussion of the measured excitation functions . . . . . . . . . . . . . . 118
4.4 New results on decay properties of hassium isotopes near N=162 and their
daughters . . . . . . . . . . . . . . . . . . . . . . . . . . . . . . . . . . . 126
5 Conclusions and outlook 129
Bibliography 135
List of Figures 149
List of Tables 153

xiv

Chapter 1
Introduction
1.1 Motivation
1.1.1 History of the synthesis of heaviest elements
Since the birth of civilization a great dream of mankind was to change and manipulate
arbitrarily the matter surrounding us. As an example I would like to mention the desire
of the ancient alchemists to turn lead to gold. Without knowing and understanding the
fundamentals of nature, these ambitions were of course not successful.
Nowadays we know that all molecules are composed of atoms. In the latter, the
negatively charged electron shells surround the positively charged nucleus consisting of
electrically neutral neutrons and positively charged protons. Beside the attractive nu-
clear force binding the nucleons inside of the nucleus, the electrostatic force between the
protons acts repulsive, reducing the binding energy of the nucleons. After reaching the
maximum binding energy in the iron/nickel region of the nuclear chart, this repulsion
is destabilizing the nucleus successively with increasing proton number until an end of
stability is reached in the lead region (Z=82). Similar to the electron shells in atoms,
closed nucleon shells with magic numbers of protons or neutrons in nuclei bring addi-
tional stabilization. Nuclei with larger proton numbers as lead decay towards the lead
region, increasing their stability due to shell stabilizations.
The heaviest nuclei found in nature in weighable quantities are the primordial, qua-
sistable uranium and thorium isotopes 238U, 235U, and 232Th synthesized in supernova
explosions billions of years ago and their decay products. These isotopes only exist to-
1
2 Introduction
day because of their very long half-lives comparable with the age of the earth. Heavier
nuclei can only be synthesized artificially using nuclear reactions. Below an overview
about the exciting history of their synthesis based on [1] is presented.
The starting point of the synthesis of heavier elements than uranium was the pro-
duction of 239Np via neutron capture of 238U followed by a β− - decay:
23892U + 1
0n→ 23992U + γ
23992U
β−−−−−−−−−→t1/2=23.5 min
23993Np
This experiment was performed by E. M. McMillan et al. in 1939/1940 at the Uni-
versity of California at Berkeley. This type of reaction corresponds to the astrophysical
s-process (slow-process) due to the orders of magnitude lower neutron flux, which can be
achieved on earth, with respect to the r-process (rapid-process). However, a limit of this
technique is reached, if the neutron absorption is in equilibrium with the decay of the
reaction products, which just means, that even heavier elements cannot be synthesized
due to the immediate decay of the mother nucleus.
For the separation or isolation of the new element, chemical techniques have been used,
separating the target material from the sample and measuring the half-life of the remain-
ing activity. The same technique was also used for all experiments, up to the synthesis
of element 100.
In the year 1940, another synthesis technique was introduced to produce even heavier
elements, the nuclear fusion reaction. Instead of successive neutron absorption followed
by β− - decay, the desired nuclei is directly produced by the nuclear fusion reaction of
two lighter nuclei, a so called target nucleus which is bombarded by a so called pro-
jectile nucleus. Due to the electrostatic repulsion originating from the presence of the
positively charged protons, a sufficiently high projectile energy is necessary to overcome
the barrier, which is the case when the repulsive Coulomb force is in equilibrium with
the attractive nuclear force. This type of nuclear reaction was applied for the first time
to produce plutonium (238Pu) by the bombardment of 238U with 2H followed by two
neutron emission and a β− - decay with a half-life of 2.12 days:
23892U + 2
1H→ 23893Np + 21
0n
23893Np
β−−−−−−−−−→t1/2=2.12 days
23894Pu

Introduction 3
This experiment was performed by G. T. Seaborg et al. using the 60-inch cyclotron at
Berkeley University to accelerate the deuterons.
During 1941, 239Pu was identified for the first time after β− - decay of 239Np. When
the potential of 239Pu as a source of nuclear energy and hence its application in nuclear
weapons was realized, the possibility of producing large quantities of that isotope was
studied after the first experiments. This was performed in 1941 using neutrons from
the bombardment of a beryllium target by deuterons delivered by the 60-inch cyclotron.
During a two day bombardment, 0.5 µg of 239Pu have been produced, used to demon-
strate, that the probability of fission induced by thermal neutrons is about 50% larger
than that for 235U.
Due to the fact, that the aforementioned technique is only able to produce minor quanti-
ties, other approaches were searched leading to the breeding of 239Pu in nuclear reactors,
like the U.S. plant at Savannah river. With these facilities it was possible to gain macro-
scopic amounts of material, enough to build nuclear weapons.
Later during the war, a few experiments were conducted to produce even heavier ele-
ments by neutron absorption of 239Pu, but without success, due to the limited instru-
mentation.
However in summer 1944, the new elements americium and curium were synthesized for
the first time. 24195Am was produced by two neutron absorption of 239Pu followed by a
β− - decay:
23994Pu + 1
0n→ 24094Pu + γ
24094Pu + 1
0n→ 24194Pu + γ
24194Pu
β−−−−−−−−−−→t1/2=14.4 years
24195Am
24296Cm was produced by the nuclear fusion of 239Pu and 4He delivered by the 60-inch
cyclotron.
23994Pu + 4
2He→ 24296Cm + 1
0n
Another way of producing 24296Cm was the further neutron absorption of 241
95Am:
24195Am + 1
0n→ 24295Am + γ
24295Am
β−−−−−−−−−−→t1/2=16.0 hours
24296Cm
Due to very similar chemical properties of americium and curium, these elements could
4 Introduction
only be separated chemically in fall of 1945 and fall of 1947, respectively.
The next step in the direction of producing even heavier elements was the synthesis
of the elements 97 and 98, berkelium and californium, respectively. The only available
tools at that time were the aforementioned neutron and helium bombardment of the
target material. Hence, it was necessary to produce a sufficient amount of Am and Cm
target material, at least a few mg. After the successful production of enough 24195Am in
a high-flux reactor, element 97 was synthesized by Thompson, Ghiorso, and Seaborg in
December 1949 for the first time by the bombardment of 24195Am with 35 MeV helium
ions delivered by the 60 inch cyclotron:
24195Am + 4
2He→ 24397Bk + 21
0n
Californium, element 98, was produced the first time in spring 1950 by Street, Ghiorso,
and Seaborg in Berkeley, using a similar production reaction and chemical separation
and detection concepts:
24296Cm + 4
2He→ 24598Cf + 1
0n
The next two elements, einsteinium and fermium were unexpectedly discovered in the
debris from the first thermonuclear explosion in the Pacific, by airplanes equipped with
filters, flying after the explosion through the cloud and collecting the activity.
During the evaluation of the sample, new very neutron rich uranium and plutonium
isotopes up to 246Pu were found leading to the conclusion, that the 238U from the bomb
was exposed to an integrated neutron flux of 1 · 1024 to 4 · 1024 neutrons, being provided
in a few nanoseconds. Beside this, also at that time unknown activities have been found
in the sample, identified as the new elements 99 and 100, einsteinium and fermium,
respectively, produced via successive neutron capture and β−-decay. This was actually
a simulation of the r-process.
With element 100, the ending point of heaviest element synthesis by successive neu-
tron capture was reached due to the decreasing half-life with increasing atomic number
and the limited neutron flux which could be reached even by high-flux reactors. It was
also speculated that heavier elements could not be synthesized due to a region of beta-
delayed fission, that would prevent multiple beta decays from reaching elements with
higher atomic number.
From element 101, mendelevium, on, all new elements have been synthesized by nuclear
fusion evaporation reactions. Apart from that, also new separation and detection tech-
niques have been introduced because of the very low production yield, demanding highly

Introduction 5
efficient methods, dealing with only one atom at a time.
One of the new techniques was the recoil method, which is used until today as a stan-
dard approach for the production of superheavy elements (SHE). It is characterized by
depositing the target material on a foil and bombarding it with the projectiles. The
fusion evaporation products are recoiling out of the rear side of the target, due to the
momentum of the projectiles. These recoils are caught by a foil, which is removed after
a certain time and analyzed or transported with a gas/aerosol jet to a separation and
detection unit.
In 1955, mendelevium was synthesized and its decay detected for the first time using
the following fusion evaporation reaction:
25399Es + 4
2He→ 256101Md + 1
0n
The experiment was performed again at the Berkeley 60-inch cyclotron. The identifica-
tion of element 101 was a little bit more complicated than for previous new elements,
due to the decay properties of the isotope 256101Md by electron capture followed by spon-
taneous fission of the daughter nuclide 256100Fm. But because of the high quality of the
chemical separation, mendelevium could be unambiguously identified.
In 1958, element 102, nobelium, was also produced by a fusion evaporation reaction
using the first time projectiles heavier than He, 12C in this case. This was necessary,
because fusion reactions dealing with helium projectiles to produce nobelium would need
fermium targets, which cannot be made due to the short half-life of fermium. The car-
bon ions were delivered using the new Berkeley Heavy Ion Linear Accelerator (HILAC).
In this experiment, only the daughter nuclide of Nobelium could be identified due to the
short half life of the mother:
24496Cm + 12
6C→ 252102No + 41
0n
252102No
α−−−−−→t1/2∼ 3 s
250100Fm
Parallel to the Berkeley group, G. N. Flerov et al. of the Dubna group, could clearly
identify an alpha-decaying nobelium isotope (252No) produced in the complete fusion
reaction of 239Pu with 16O ions.
The next discovered element was element 103, lawrencium, which was produced by the
bombardment of a californium target which consisted of a mixture of the isotopes 24998Cf
to 25298Cf with heavy ion beams of 10
5B and 115B, again at the HILAC in Berkeley.
With the first synthesis of element 103, all actinide elements were explored. The next

6 Introduction
step to even heavier nuclei led to the group of transactinide elements, the so-called super-
heavy elements, starting from element 104. Due to the decreasing half-lives of the nuclei
with increasing proton numbers, which are down to the range of seconds for the heaviest
actinide elements, offline chemical separation techniques could not be applied anymore.
This problem could be overcome by the development of chemical online separation meth-
ods, which was attempted for the confirmation of element 104, rutherfordium, produced
in the hot fusion reaction:
2210Ne + 242
94Pu→ 259104Rf + 51
0n
Meanwhile the Berkeley group established pure physical identification techniques, by
measuring the decay of the produced nuclei in detail, to establish a link to already
known elements. The first successful application of this method was done during the
synthesis of element 106, seaborgium, by using the hot fusion reaction:
186O + 249
98Cf→ 263106Sg + 41
0n
The produced evaporation residues (EVR), recoiling from the target were caught by NaCl
aerosol clusters and transported by a capillary to the Vertical Wheel, where they were
deposited on. After a certain time, the wheel moved into the next position. During the
collection and the next 7 steps, the α particles, emitted from the sample were measured
using silicon detectors, during the collection from one side and during the next steps
from both sides, to identify correlated decay chains. In addition, a so called daughter
mode existed, waiting for the decay of the grand daughter.
Since the nuclear fusion reactions, which have been used to produce elements up to
seaborgium, were all hot fusion reactions, the excitation energies of the compound nuclei
(CN) were quite high (usually 40-50 MeV) corresponding to projectile energies as high
as to overcome the Coulomb barrier. This affects the effective yield of the surviving
evaporation residues, due to the competition of neutron evaporation and fission during
each of the 4-5 neutron evaporation steps. These are necessary to cool down the highly
excited CN to the ground state.
A different approach has been proposed by Yuri Oganessian in from Dubna, the so
called cold fusion. A cold fusion reaction is characterized by a small excitation energy
(10-20 MeV) of the CN, close to the Coulomb barrier. This is caused by the nuclear
structure of the target nuclei. The typical cold fusion targets are lead (20882Pb) and
Introduction 7
bismuth (20993Bi) with 208
82Pb having closed proton and neutron shells and 20993Bi having the
same configuration plus one proton.
Due to these closed shells, the binding energy of these nuclei is very high resulting in a
very low Q-value, which causes the low excitation energy at near-barrier energies and so
the emission of one or two neutrons is sufficient to de-excite the CN:
AZX + 208
92Pb→ 208+A82+ZN + 11
0n
Q = EN + En − EPb − EX
On the other side, due to an increased symmetry of cold fusion reaction, capture cross
section and compound nucleus formation probability are decreased. However, the re-
duced capture cross section and compound nucleus formation probability due to the
increased symmetry is overcompensated by the increased survival probability. Hence,
losses due to fission during the de-excitation process is significantly reduced.
Because of the higher symmetry of cold fusion reactions, compared with hot fusion reac-
tions, the produced evaporation residues are more neutron-deficient than those produced
in hot fusion reactions. Due to the relatively high ratio of proton number and neutron
number, these nuclei decay predominantly by alpha decay with rather short half-lives.
In 1973 this reaction type has been first successfully used in Dubna to produce fermium
in the cold fusion reaction 4018Ar+208
82Pb. In the next years several attempts have been
made to produce the superheavy elements 104, 105, 106, 107, 108, 109, 110, 111, and
112 in cold fusion reactions, using 5022Ti-, 54
24Cr-, 5826Fe-, 62
28Ni and 7030Zn-beams with 209
83Bi- or20882Pb-targets. The remarkable point with these combinations is the fact, that nearly all
these projectiles differ by one α-particle, hence all products of these reactions, produced
in 1n channel should have the same decay properties from element 105 on and result in
the long living isotope 24698Cf with a half-life of 35.4h and an α-energy of 6.75 MeV.
Because of the short half-lives of cold fusion products, it is necessary to use a pure
physical detection system for the unambiguous identification and confirmation of these
fusion evaporation products.
This approach of using cold fusion reactions in combination with a highly sensitive and
efficient physical separation and detection system has been used very successfully by
the SHIP-group at the GSI in Darmstadt. The main challenge at that point was to
deal with the dramatic decrease of cross sections with increasing proton number of the
fusion product. While 254No can be produced with a cross section of 2 µb using the cold
fusion reaction 48Ca + 208Pb, the cross section to produce 261Sg, which contains just
four protons more, in the reaction 54Cr + 208Pb decreases down to about 2 nb, which

8 Introduction
corresponds to 3 orders of magnitude! With a simple linear interpolation, it can be seen,
that the cross section to produce even heavier elements will be of the order of several
pb or even fb!
Due to the very high cross sections of transfer- and deeply inelastic reactions, which are
of the order of mb or several tens to hundreds of µb, compared with the aforementioned
evaporation residue cross sections and due to the successive decrease of half-lives with
increasing proton number, a very fast and efficient separation technique is required in
order to go further with the exploration of the heaviest elements.
One possible option to reach these goals is the use of separators, gas-filled or kinematic
separators. In the beginning of the seventies, the group of Sigurd Hofmann installed
the velocity separator SHIP (Separator for Heavy Ion reaction Products) at the GSI,
which was completed and first tested in 1975. The basic concept of SHIP is that of a
double Wien filter, named after the physicist Wilhelm Wien, separating the different
nuclei with static magnetic and electric dipole fields due to their different velocities.
1.1.2 History of the investigation of the doubly magic nucleus 270Hs
and perspectives for SHE synthesis
Superheavy elements with proton numbers Z&104 exist only due to nuclear shell effects,
which stabilize them against spontaneous fission (SF). Theoretical calculations predict
these shell stabilization effects to reach a maximum at the closures of the next spheri-
cal proton and neutron shells, which are anticipated in the region between Z=114 and
Z=126 and at N=184[2, 3, 4, 5]. These effects were long thought to give rise to a so-called
”island of stability” in the midst of a sea of nuclear instability, far away from any nuclei
found in nature. More recent calculations based on the macroscopic-microscopic model
as well as self-consistent mean-field calculations that also consider deformed nuclear
shapes extended this picture and predicted deformed shell closures at Z=108 and at
N=162 [6], creating a region of enhanced stability halfway between the heaviest nuclides
found on earth and the predicted island of stability.
In 2003 the new director of the Institut fur Radiochemie (TU Munchen) Andreas Turler
founded a new group for superheavy element research with Alexander Yakushev as group
leader and leading scientist. The first point of major interest was the exploration of neu-
tron rich Hs isotopes near the predicted neutron shell closure N=162 and to verify the
theoretical calculations, which predicted an enhanced stability of nuclei in the region
Z=108 and N=162. Hence, a precise and detailed investigation of the decay properties
Introduction 9
of 270Hs was necessary.
This was done by studying the decay properties of the nuclides 269,270,271Hs and their
daughters formed in complete nuclear fusion reactions using an improved chemical sep-
aration and detection system. In former experiments, it has been proven, that Hs chem-
istry is very pure and effective [7]. An overall efficiency of around 55% for the separation
and detection of 269Hs was reached, which is for hot fusion reactions much larger than
the values of any other separation technique, like that of kinematic separators.
In two experimental campaigns in 2004 and 2005 the excitation function of the complete
nuclear fusion reaction 248Cm(26Mg, xn)274−xHs and its EVR decay properties have been
investigated at 5 different beam energies [8]. In total 26 linked nuclear decay chains orig-
inating from Hs nuclei have been found. Based on 12 decay chains originating from269Hs, the decay properties of 269Hs and its daughters were updated and their assign-
ment reevaluated. All measured decay properties are summarized in table 1.2. In these
experiments, the decays of 270Hs and 271Hs were measured for the first time.
The Qα-values, deduced from the measured Eα-energies and their systematics in the
framework of all known Hs isotopes and neighboring elements, verified the deformed
shell closure at Z=108 and N=162.
The second major result of these experiments was the measurement of the excitation
functions for the 3-5n evaporation channels. It is not very common to do so in superheavy
element synthesis reactions dealing with cross sections of the order of picobarns.
1.2 Stability of SHE
The stability of a nucleus, or how tightly a nucleus is bound, depends on the binding
energy of its constituents, the protons and neutrons, bound inside of the nuclear potential
of the nucleus. The binding is caused by the short ranged attractive nuclear force between
the nucleons. Beside this, the positively charged protons repel each other due to the
Coulomb force, decreasing the binding energy. Due to this opposite effect, a certain
proton-to-neutron ratio is favored providing the largest binding energy for a certain
number of nucleons and hence the strongest bonding, making the nucleus stable against
β-decay. Most of the β-stable nuclei have binding energies around 7-8 MeV per nucleon
and an approximately constant density of 0.17 nucleons/fm3 [9]. Only very light and
very heavy nuclei differ significantly in their binding energies.
Besides β-decay, heavy nuclei decay also by α-particle emission or by spontaneous fission.
10 Introduction
The half-life and, hence, the dominant decay mode depends on the increase of binding
energy which is gained through the decay. In case of spontaneous fission, the half-life
depends on the height of the fission barrier. Especially for superheavy elements all
decay-modes are very important and partially dominant.
1.2.1 Liquid drop model
The liquid drop model (LDM) is a semi-classical model which describes the mass and
binding energy of a nucleus and is based on the fact, that nuclei have approximately
the same nuclear density and that the binding energy per nucleon is for most nuclei in
the energy range of 7 to 8 MeV. It was developed in the 1930s after the measurement
of a sufficient number of atomic masses. As the name implies this model is deduced by
the picture of a water drop, due to the aforementioned experimental observations on
which the model is based. The analogies between a nucleus and a water drop are the
well-defined surface, the incompressibility, and the attractive short-range force binding
the system.
Taking this model as a base, von Weizsacker [10] developed and later on Bethe and
Bacher [11] improved a semi-classical formula to calculate the nuclear binding energy
and hence the mass of a given nucleus. It is called the Bethe-Weizsacker-formula. The
mass of a nucleus is equal to the sum of the masses of all constituents, N neutrons and
Z protons reduced by the binding energy:
M(N,Z) = NMn + ZMp − EB (1.1)
EB denotes the binding energy and is described in the frame of the Bethe-Weizsacker-
formular as:
EB = av ·A− as ·A23 − ac ·
Z2
A13
− aa ·(A− 2 ·Z)2
A+ δ(A,Z) (1.2)
1. Volume term
This term is proportional to the volume of the nucleus and hence to its number
of nucleons. Due to the constant nuclear density, a maximum of the number of
binding partners of each nucleon exists, resulting in a saturation of the binding
energy per nucleon. Hence, the binding energy for the whole nucleus is proportional
to the number of constituents and proportional to A.
2. Surface term

Introduction 11
Not all nucleons are able to perform the maximal possible number of bondings to
other nucleons. Especially nucleons at the surface of a nucleus have less binding
partners, than they could have. The surface term, like all following terms, is a
correction term of the volume term.
3. Coulomb term
Due to the electrostatic repulsion of the protons inside of the nucleus the nucleus
itself is less bound. Since the electro-magnetic force has infinite range in contrast
to the nuclear force which has only a range of a few fm (the nuclear force decreases
to negligibly small values for ranges of more than 2 fm), the size of a nucleus is
limited. The Coulomb term takes this into account and considers the nucleus as a
sphere of uniform charge density.
4. Asymmetry term
The asymmetry term describes the fact, that a nucleus is most stable for a certain
proton to neutron ratio. This is caused by the Pauli principle, which says that
two fermions cannot occupy the same state. The implication is that one of these
fermions has to occupy a state with a higher energy. Hence, an almost equal ratio
of protons and neutrons is energetically preferred.
5. Pairing term
The pairing term includes the fact, that two protons or two neutrons in the same
state but with opposite spin are bound as a pair, providing more stability to the
whole nucleus. As a consequence, this term results in a more strongly bound
nucleus in the case of even numbers of protons and neutrons, compared with a
nucleus with odd-proton number and even neutron number and vice versa. But
this odd-even configuration is more strongly bound than a nucleus with odd proton
and neutron numbers. This is due to the aforementioned fact, that an even-even
nucleus has only paired nucleons, while an odd-even nucleus has one unpaired and
an odd-odd nucleus has two unpaired nucleons, decreasing the binding energy. One
implication of this systematics is the existence of only a few stable odd-odd nuclei
in nature.
The masses and binding energies of nuclei are well reproduced by the Bethe-Weizsacker-
formular, which is based on the LDM. But at certain proton and neutron numbers (2,
8, 20, 28, 50, 82, 126), the experimental binding energies are larger than the predictions
of the LDM and hence these nuclei are more strongly bound. These numbers are called
12 Introduction
magic numbers. Also, if we examine the proton and neutron separation energies, which
define the energy which is necessary to remove the least bound proton or neutron,
respectively, an increase can be measured at these magic numbers. These facts indicate
a kind of nuclear shell structure, analog to the atomic shell structure of the electrons.
1.2.2 Nuclear shell model
The LDM itself is a phenomenological model which describes the nucleus as a whole and
hence it is only able to describe the collective behavior of the nucleus. For characterizing
the single particle behavior of protons and neutrons, bound inside of the nucleus, as well
as collective properties near the magic numbers, a completely new model was devel-
oped. The magic numbers were first of all explained by Mayer [12,13] who performed
calculations on the energies of single particle spectra applying a square and a harmonic
oscillator well potential. The resulting energy levels from the calculations with the
harmonic-oscillator potential can be found in Figure 1.1 on the left side. Unfortunately,
these calculations failed for higher magic numbers. Hence, Mayer [14] and independently
Haxel, Jensen, and Suess [15] proposed that a strong spin-orbital interaction should be
added. The model was called nuclear shell model due to some analogies to the atomic
shell model. In this model, a non-central mean field potential is established by all nucle-
ons, in which all nucleons are arranged. Bound states and orbitals are formed which can
be occupied by a certain number of nucleons. Due to the Pauli principle the nucleons
are moving in these orbitals without collisions.
The mean potential can be approximated by a square well, an harmonic-oscillator well
potential, or an even more realistic Wood-Saxon potential including an angular moment
dependence (`2 dependent term) and a strong spin-orbit-coupling (~l ·~s dependent term).
These two terms split the energy levels, calculated by solving the Hamiltonian of the
mean potential, according to their angular momentum (~) and to their total angular
momentum (~ = ~l + ~s) as can be seen in Figure 1.1. This energy splitting increases
with increasing angular momentum. With these two extensions, an excitation spectrum
can be calculated, reproducing the experimentally observed shell closures, the magic
numbers. A shell is defined as an energy range in the state space with a high density
of states, followed on both, the high and low energy side by an energy range without
any states. If such a shell is completely filled with nucleons, the next added nucleon has
to be configured in a state in the next higher energetic shell. Due to the energy gap
in between these shells, the last added nucleon is less bound than the other nucleons,

Introduction 13
Figure 1.1: Energy levels according to the nuclear shell model.
reproducing the experimentally determined proton and neutron separation energies and
therefore the shell structure of the nucleus.
The nuclear spin is calculated by summing up all individual spins of the nucleons. Be-
cause of the pairing energy, causing protons and neutrons to get bound in pairs with
total spin equal to zero, due to the anti alignment of their spins, only unpaired nucleons
contribute to the total nuclear spin. Hence, filled shells have no influence on the nuclear
spin, the total angular momentum, and the parity of the nucleus. Nucleons outside of
closed shells are so called valence nucleons.
It is worth to note, that nuclei with closed shells are not the most strongly bound nuclei,
but compared with different nuclei around that nucleus on the nuclide chart, they are
more strongly bound and thus more stable. Due to this fact, the shell structure plays
an outstanding role in the stability of superheavy elements.
14 Introduction
The shell model itself is only valid for spherical nuclei, hence nuclei near closed
shells, due to the residual interaction of the nuclear force. Nuclei between closed shells
get more and more deformed due to this residual interaction, which takes place mostly
between the protons and the neutrons. To describe the single particle spectra of these
nuclei, Nilsson published in 1955 an approach to deal with nucleons in strongly deformed
nuclei. The deduced model is the so called Nilssons model. To take the deformation
into account, he used a modified harmonic oscillator potential. Hence, the single particle
orbital angular momentum and total angular momentum are no longer good quantum
numbers in the Nilsson model. Instead, the projection of the total angular momentum
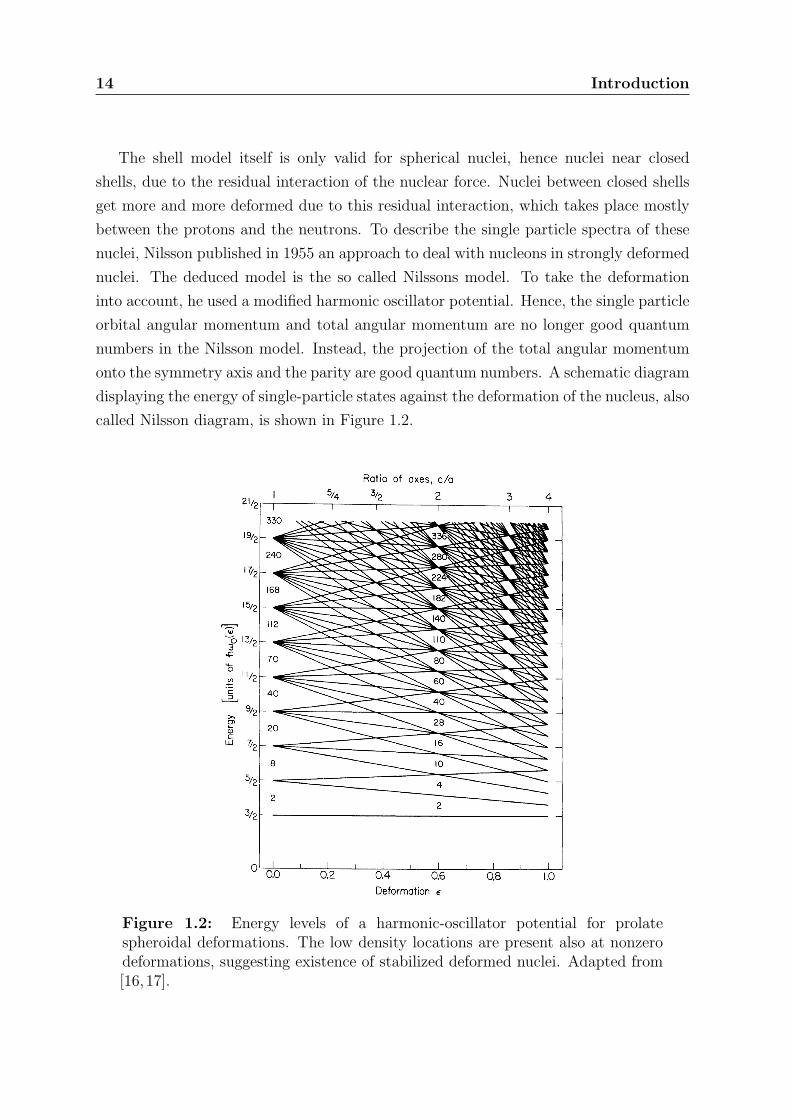
onto the symmetry axis and the parity are good quantum numbers. A schematic diagram
displaying the energy of single-particle states against the deformation of the nucleus, also
called Nilsson diagram, is shown in Figure 1.2.
Figure 1.2: Energy levels of a harmonic-oscillator potential for prolatespheroidal deformations. The low density locations are present also at nonzerodeformations, suggesting existence of stabilized deformed nuclei. Adapted from[16,17].

Introduction 15
As can be seen, the shell closures, regions with small level density, are not only visible
at zero-deformation and change with the deformation of the nucleus.
The Nilsson diagram of energy levels of the more realistic folded-Yukawa single-
particle potential for nuclei heavier than lead can be found in Figure 1.3. At zero-
deformation, the closed proton (Z=82) and neutron shell (N=126) of 208Pb can be found
in the lower energy part of that plot. The next closed spherical (zero-deformation) proton
and neutron shell closures can be found at Z=114 and N=184. Other shell closures are
located at nonzero deformation as for nuclei close to 270Hs where gaps are revealed
at Z=108 and N=162 implying enhanced stability of this deformed nucleus. Another
deformed neutron shell closure can be found at N=152. A detailed introduction on the
predictions for closed shells can be found in Section 1.4.
Figure 1.3: Proton and neutron folded-Yukawa single-particle level diagramfor the nucleus 272Ds plotted versus spheroidal and hexadecapole deformation.Gaps at Z = 108 and N = 162 suggest increased stability of deformed 270Hs.Adapted from [18].

16 Introduction
1.2.3 Strutinski method and the stability of SHE
While the LDM describes the collective properties of most nuclei quite well, it deviates
relatively strongly for nuclei near closed shells. Hence, it is important for extrapolating
global nuclear properties, like masses and binding energies, especially for superheavy
elements, to introduce a correction to the LDM, which represents the shell structure.
This method was introduced by Strutinski in 1967 [19,20]. His approach is called a
macroscopic-microscopic calculation. It divides the total energy of a nucleus in two
parts, one macroscopic and one microscopic term. While the former is deduced from the
LDM and represents the total energy of that nucleus in the semi-classical approach, the
latter includes shell effects as well as a pairing correction to that energy:
E = ELDM︸ ︷︷ ︸Macroscopic
+∑p,n
(δS + δP )︸ ︷︷ ︸Microscopic
(1.3)
Especially the shell correction energy is lowering the ground state energy and thus the
ground state mass at and near closed shells by up to several MeV. Hence, the deviations
of experimental and calculated masses disappear by introducing these corrections. These
effects are absolutely essential for the properties and the synthesis of SHE.
Calculating the barrier against spontaneous fission of a heavy nucleus with the LDM,
results in nuclei with proton numbers higher than Z=100 having a half-life against
spontaneous fission of less than one second. This happens due to the fact, that the fission
barrier Bf decreases rapidly with increasing fissility parameter Z2/A in the framework
of the LDM of fission of heavy nuclei [21]. Taking also the shell corrections into account
in the framework of the microscopic theory of the nucleus, closed proton and neutron
shells increase the binding energy in nuclei beyond the limits defined by the LDM.
Ignoring the influence of the moment of inertia of the nucleus, its fission barrier is
composed by the LDM fission barrier and the shell corrections. Fission barrier calcula-
tions [22] taking into account shell effects, predict also heavier than Z=102 systems to
be bound due to an increase of the fission barrier, which has been proven experimentally
during the last decades. Hence, the shell corrections term is the most dominant and
solely responsible for the stability of SHE and their decay properties. Figure 1.4 illus-
trates shell effects in masses of transuranium nuclei, which are the difference between
the experimental and within the LDM calculated mass values. The shell corrections are
negative and decrease with increasing atomic number Z, down to about -5 MeV for the
heaviest even-even nuclei (260Sg and 264Hs) included in that plot. In general, the shell

Introduction 17
corrections decrease the mass of a nucleus and hence enlarge the mass defect, and the
binding energy.
Figure 1.4: Shell effects in the masses of nuclei. Adopted from [22].
Examining the results for Cf, Fm, and No isotopes, the effect of the known deformed
shell closure at neutron number N=152 can clearly be seen. Similarly clear and large shell
effects on further properties of heaviest elements can be found in the α-decay energy-
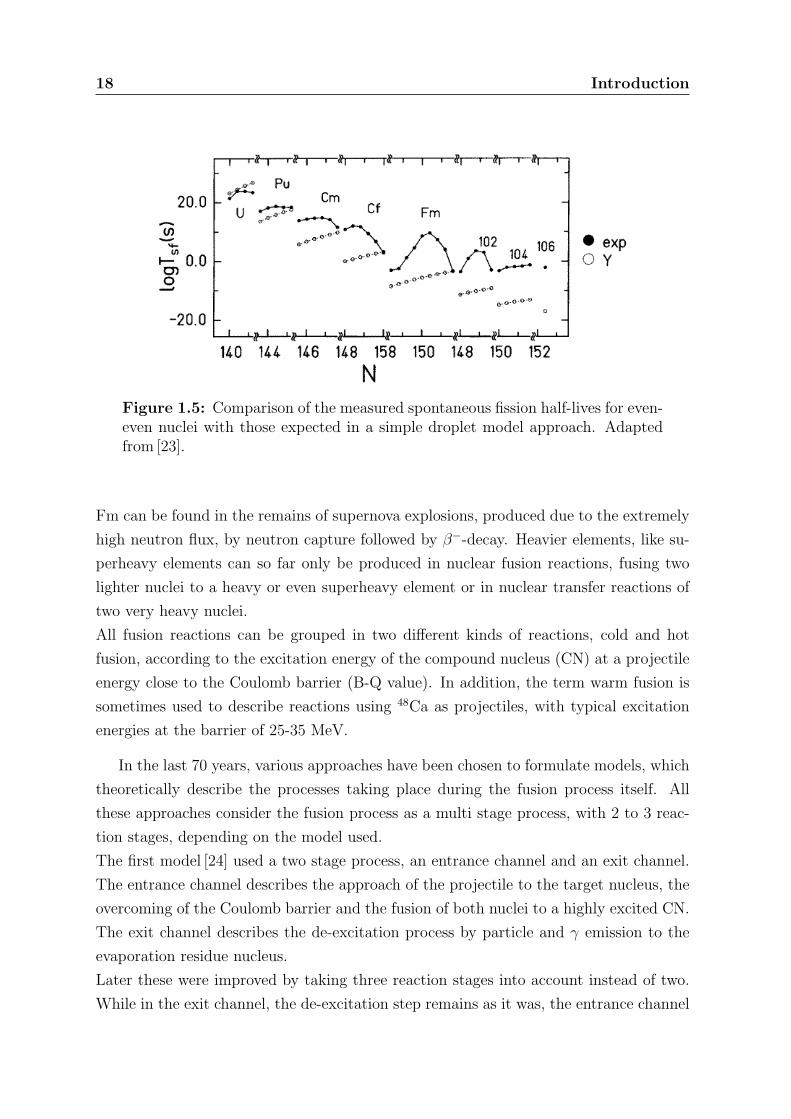
(Qα) as well as in the α-decay half-life (T1/2α) or in fission barrier- (Bf ) systematics.
Exceptionally large effects occur in spontaneous-fission half-lives (T1/2SF ), of up to 15
orders of magnitude. This can be understood very clearly by comparing the measured
spontaneous fission half-lives with those deduced from the LDM (Figure 1.5).
Therefore, SHE only exist due to nuclear shell effects enhancing the nuclear stability.
1.3 Synthesis of SHE
1.3.1 Introduction
As described in the Introduction, all elements heavier than plutonium have to be syn-
thesized and cannot be found in nature. In the universe, presumably elements up to
18 Introduction
Figure 1.5: Comparison of the measured spontaneous fission half-lives for even-even nuclei with those expected in a simple droplet model approach. Adaptedfrom [23].
Fm can be found in the remains of supernova explosions, produced due to the extremely
high neutron flux, by neutron capture followed by β−-decay. Heavier elements, like su-
perheavy elements can so far only be produced in nuclear fusion reactions, fusing two
lighter nuclei to a heavy or even superheavy element or in nuclear transfer reactions of
two very heavy nuclei.
All fusion reactions can be grouped in two different kinds of reactions, cold and hot
fusion, according to the excitation energy of the compound nucleus (CN) at a projectile
energy close to the Coulomb barrier (B-Q value). In addition, the term warm fusion is
sometimes used to describe reactions using 48Ca as projectiles, with typical excitation
energies at the barrier of 25-35 MeV.
In the last 70 years, various approaches have been chosen to formulate models, which
theoretically describe the processes taking place during the fusion process itself. All
these approaches consider the fusion process as a multi stage process, with 2 to 3 reac-
tion stages, depending on the model used.
The first model [24] used a two stage process, an entrance channel and an exit channel.
The entrance channel describes the approach of the projectile to the target nucleus, the
overcoming of the Coulomb barrier and the fusion of both nuclei to a highly excited CN.
The exit channel describes the de-excitation process by particle and γ emission to the
evaporation residue nucleus.
Later these were improved by taking three reaction stages into account instead of two.
While in the exit channel, the de-excitation step remains as it was, the entrance channel

Introduction 19
is divided in two separate steps, the approach of both nuclei on the one hand and their
fusion or reseparation on the other hand.
In this work I concentrate on the latter model, because of its increased precision. This
model is used for example by V. Zagrebaev who formulated a standard approach taking
this model as a basis [25,26].
1.3.2 Theory of the complete fusion of heavy nuclei
In his approach Zagrebaev uses three reaction stages to describe the production cross
section of a cold residual nucleus, which is formed by light particle, and γ-emission from
an excited CN, which has been produced before in the fusion reaction of two heavy nuclei
A1 and A2:
A1 + A2→C→B + n, p, α, γ (1.4)
The cross section at center of mass energies close to the Coulomb barrier in the entrance
channel is decomposed over partial waves:
σA1+A2→BEV R (E) =
π~2
2µE
∞∑`=0
(2`+ 1)T (E, `) ·PCN(E, `) ·PEV R(E∗, `) (1.5)
This approach consists of three different parts, each characterizing one stage of the
reaction:
1. T(E,`) denotes the probability, that the colliding nuclei overcome the potential
barrier in the entrance channel (Coulomb barrier) and reach the point of contact
Rcontact = R1 + R2, where R1 and R2 are the radii of the nuclei. This contact point
is as a rule by 2 or 3 fm smaller than the radius defining the Coulomb barrier.
2. PCN(E,`) terms the probability, that the nuclear system will develop from a contact
configuration of two touching nuclei into a spherical or nearly spherical form of
the compound mononucleus. This evolution process is always in competition with
the separation in two fragments without forming the CN at all and thus PCN < 1.
This reseparation process without having formed an CN is called quasi-fission, in
contrast to fusion-fission.
3. PEV R(E∗, `) or Wsurvival is the probability to produce the cold evaporation residue
20 Introduction
B in the process of de-excitation of the CN by emission of light particles (n,p,α)
and γ’s. The initial excitation energy is E∗=Ec.m.-Q with:
Q = M(C) · c2 −M(A1) · c2 −M(A2) · c2 (1.6)
M(C), M(A1) and M(A2) are the masses of the CN, A1 and A2.
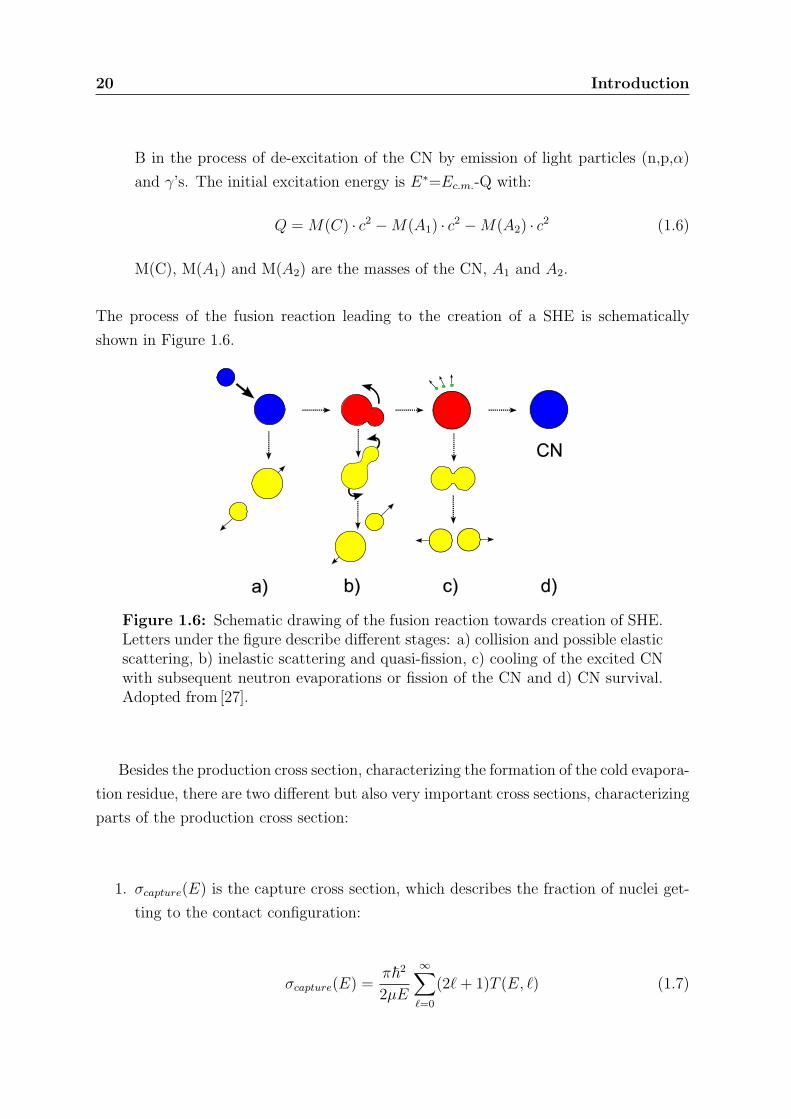
The process of the fusion reaction leading to the creation of a SHE is schematically
shown in Figure 1.6.
22
Figure 1.14. Schematic drawing of the fusion reaction towards creation of SHE. Letters under the figure describe different stages: a) collision and possible elastic scattering, b) inelastic scattering and quasi-fission, c) cooling of the excited CN with subsequent neutron evaporations or fission of the CN and d) CN survival.
In addition, the fission barrier itself is fragile, because it is solely built up from shell
effects, which are “smeared out” in the excited nucleus. For these reasons the fusion of
SHE is hindered twofold: (1) in the entrance channel by a high probability for re-
separation and (2) in the exit channel by a high probability for fission. In contrast, the
fusion of lighter elements proceeds unhindered, implying significantly higher
production cross sections.
1.6.2 Cold and Hot Fusion
The excitation energy (E*) of the CN is a critical parameter for its survival.
According to E* nuclear fusion reactions leading to the synthesis of SHE can be divided
into two groups: (i) “hot” fusion reactions at E* ~30 − 50 MeV (evaporation of 3–5
neutrons), (ii) “cold” fusion reactions with low E* ~10 − 20 MeV (evaporation of 1 or 2
neutrons). Examples for hot fusion reactions are reactions of light projectiles with
actinide targets. These result in larger fusion cross sections but reduced survival
probabilities due to the higher E* of the CN. Using hot fusion reactions the elements
with Z = 102−106 were discovered. In reactions with the doubly magic 48Ca projectile
and actinide targets, lower excitation energy of the CN can be reached, improving the
survival probability. These reactions are sometimes called “warm” fusion. The
production cross sections of reactions using 48Ca projectiles and actinide targets are
Figure 1.6: Schematic drawing of the fusion reaction towards creation of SHE.Letters under the figure describe different stages: a) collision and possible elasticscattering, b) inelastic scattering and quasi-fission, c) cooling of the excited CNwith subsequent neutron evaporations or fission of the CN and d) CN survival.Adopted from [27].
Besides the production cross section, characterizing the formation of the cold evapora-
tion residue, there are two different but also very important cross sections, characterizing
parts of the production cross section:
1. σcapture(E) is the capture cross section, which describes the fraction of nuclei get-
ting to the contact configuration:
σcapture(E) =π~2
2µE
∞∑`=0
(2`+ 1)T (E, `) (1.7)

Introduction 21
2. σfusion(E) is the fusion cross section, which describes the fraction of nuclei, getting
to the CN configuration:
σfusion(E) =π~2
2µE
∞∑`=0
(2`+ 1)T (E, `) ·PCN(E, `) (1.8)
Capture cross section
The barrier penatrability T(E,`) for the fusion of heavy ions depends on the height and
width of the Coulomb barrier. But also the strong channel coupling of relative motion
with internal degrees of freedom enhance the capture cross section significantly by sev-
eral orders of magnitude at subbarrier energies.
The height of the potential barrier can be calculated quite well using the Bass approx-
imation [28] for the interaction between two heavy spherical nuclei. Coupling with the
excitation of nuclear collective states and with nucleon transfer channels is the sec-
ond main factor which determines the capture cross section at near-barrier energies.
These collective states are surface vibrations and/or rotations of deformed nuclei and
can roughly be divided in two categories:
1. For the fusion of light nuclei, the capture cross section is quite good described by
taking into account only a few low-excited states using some coupled channel code.
2. Considering the fusion of heavy nuclei, the nuclei are regarded as rather ”soft”
nuclei, which means, that these have low lying vibrational excitations. Hence,
a realistic nucleus-nucleus interaction leads to very large dynamic deformations
and, thus, a large number of coupled channels have to be taken into account
complicating the microscopic calculation of T(E,`) significantly.
To take into account the main effect of decreasing the potential barrier height which cor-
responds to an increasing penetration probability at subbarrier energies due to dynamic
deformation of the nuclear surface, Zagrebaev[25] suggests the following nucleus-nucleus
potential energy for nuclei with quadrupol deformations:
V1,2(r, β1, β2, θ1, θ2) = VC(r, β1, β2, θ1, θ2) + Vprox(r, β1, β2, θ1, θ2)
+C1
2(β1 − β0
1)2 +C2
2(β2 − β0
2)2(1.9)
22 Introduction
where β1,2 are the dynamic quadrupol deformations, β01,2 are the static deformations,
θ1,2 are the orientation of the symmetry axis of statically deformed nuclei and C are
the stiffness parameter, calculated within the LDM. In the case of spherical nuclei β01 =
β02 = 0 and this potential yields the Coulomb barrier very close to the Bass barrier. In
[25] the number of variables is reduced by assuming, that:
1. the deformation energies of the two nuclei are proportional to their mass(C1β2
1
C2β22
= A1
A2
)2. only one deformation parameter can be used (β = β1 + β2)
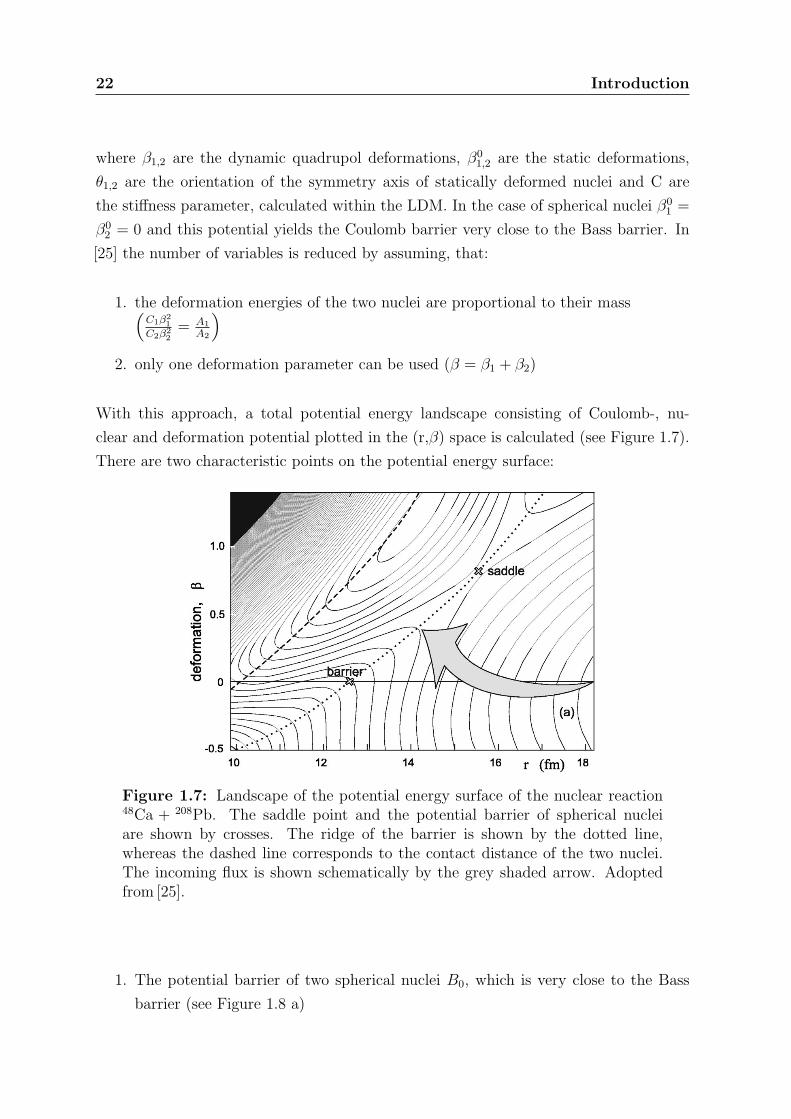
With this approach, a total potential energy landscape consisting of Coulomb-, nu-
clear and deformation potential plotted in the (r,β) space is calculated (see Figure 1.7).
There are two characteristic points on the potential energy surface:
N(D1 ,D2) is the normalization coefficient,D25(B02BS)/2. Experiments~see, e.g., Ref.@5#! and the theoreticalanalysis show that the value ofD1 is, as a rule, less than thevalue of D2 and in all the cases considered below it wastaken equal to 2 MeV.
Using this approach we calculated the capture cross sec-tions for the three reactions shown in Fig. 1~the solid lines!.An additional decrease in the48Ca1244Pu capture cross sec-tion at above barrier energies as compared with its geometri-cal limit could be explained by a much more shallow poten-tial pocket and, thus, by a much less value of the criticalangular momentum. For this reaction we usedLcr545,whereas for the16O1208Pb and 48Ca1208Pb reactions wedid not need to use any restrictions on the angular momen-tum in the entrance channel at near-barrier energies.
In spite of the rather good agreement between the calcu-lated and experimental capture cross sections, we should re-alize that some uncertainty nevertheless remains in choosingthe parameters (b,r 0 ,C1,2,Lcr) defining the multidimen-sional potential barrier and the capture cross section. In par-ticular, the stiffness parametersC1,2 calculated within theliquid drop model are not compatible in many cases with
experimental properties of nuclear quadrupole excitations.The role of the neutron exchange is also not clear. It meansthat Eq. ~3!, which is qualitatively understood and proved,could be used also as an empirical formula with the fittingparameters, initial choice of which could be done as de-scribed above. Thus, in the cases of fusion of very heavynuclei and especially in symmetric fusion reactions, in whichthe corresponding experimental data are not available, theaccuracy of our today’s predictions of the capture cross sec-tions in the sub-barrier energy region is not better than anorder of magnitude. At above-barrier energies this accuracyis much better, even if we do not know the value ofLcr ,because only low angular momenta~much lower thanLcr)finally contribute to the cross section of the ER formation~see below!.
III. THE STAGE OF COMPOUND NUCLEUS FORMATION
After overcoming the Coulomb barrier the nuclei come tothe point of contact@the dashed line in Fig. 2~a!# and thefurther evolution of the system strongly depends on themasses of the touching nuclei and on their deformation atthis moment. In the case of a strongly asymmetric combina-tion, the system is transformed into the compound nucleusconfiguration with a high probability. This occurs in the syn-thesis of heavy elements when the charge of one of the nu-clei is lower or of the order of 15, which corresponds to theso-called ‘‘hot fusion’’ when the compound nucleus excita-tion energy appears to be very high~several tens of MeV!and the probability of the compound nucleus survival in thecooling process is very low. On the other hand, in suchasymmetric combinations it is impossible to synthesize su-perheavy elements. The reason is that there are no suffi-ciently long-lived nuclei with aZ.98, of which a suitabletarget could be prepared. In the case of less asymmetricnuclear combinations, the system may evolve with a highprobability directly into the exit fission channel withoutforming a compound nucleus, which means that the so-calledprocess of ‘‘fast fission’’ or quasifission takes place@17#. Theprobability of such a process should be definitely even higherif the nuclei in touch initially have a prolate deformation.
Since at sub-barrier collision energies the nuclei practi-cally have zero kinetic energy at the moment of contact, afurther evolution of the nuclear system is mainly determinedby the character of its multidimensional potential energy.This, in its turn, is determined by collective degrees of free-dom playing the major role in the process of the evolution. Itis exactly the correct choice of these degrees of freedom anda further derivation of the potential energy and solving thecorresponding transport equations that pose the main prob-lem in the description of the process of the compoundnucleus formation in the competition with quasifission. Un-fortunately, this problem has not been solved so far, and forthe estimation of the probability of the compound nucleusformationPCN some rather simplified approaches are used.
In this connection, one may single out two mutually ex-clusive approaches to the description of the evolution of thenuclear system starting from the moment at which the twocolliding nuclei touch each other and up to the moment of
FIG. 2. Potential energy of48Ca1208Pb. The proximity poten-tial is used for the nuclear interaction (r 051.16 fm, b51.0 fm),and the standard stiffness parameters are used for the deformationenergy.~a! Landscape of the potential energy surface. The saddlepoint and the potential barrier of spherical nuclei (b50) are shownby crosses. The ridge of the barrier is shown by the dotted line,whereas the dashed line corresponds to the contact distance of thetwo nuclei. The incoming flux is shown schematically by the grey-shaded arrow.~b! Interaction potential of spherical nuclei and itsparabolic approximation~dashed line! in the vicinity of the barrier.~c! Potential energy at the ridge of the two-dimensional barrier, i.e.,along the dotted line passing through the saddle point@see Fig.2~a!#.
ZAGREBAEV, ARITOMO, ITKIS, OGANESSIAN, AND OHTA PHYSICAL REVIEW C65 014607
014607-4
Figure 1.7: Landscape of the potential energy surface of the nuclear reaction48Ca + 208Pb. The saddle point and the potential barrier of spherical nucleiare shown by crosses. The ridge of the barrier is shown by the dotted line,whereas the dashed line corresponds to the contact distance of the two nuclei.The incoming flux is shown schematically by the grey shaded arrow. Adoptedfrom [25].
1. The potential barrier of two spherical nuclei B0, which is very close to the Bass
barrier (see Figure 1.8 a)

Introduction 23
2. Saddle point BS, the lowest point of the multidimensional barrier, which is much
smaller than BBass (see Figure 1.8 b)
(a) (b)
Figure 1.8: (a) Interaction potential of spherical nuclei and its parabolic ap-proximation (dashed line) in the vicinity of the barrier. (b) Potential energyat the ridge of the two-dimensional barrier, i.e., along the dotted line passingthrough the saddle point. Adopted from [25].
With increasing masses of the interacting nuclei the difference (B0-BS) becomes
larger. The point of contact is of course much smaller than the barrier. To calculate
the penetration probability of this potential, the Hill-Wheeler formula is used in which
the barrier height is modified by a centrifugal term to describe the quantum penetration
probability of the one-dimensional barrier (see Figure 1.8 a). The radial dependence of
the barrier is approximated by a parabola. To take into account the multidimensional
character of the real barrier, Zagrebaev introduces a Barrier distribution function f(B)
to determine the total penetrability:
T (E, `) =
∫f(B) · 1
1 + exp(
2π~ωB(`)
[B + ~2
2µR2B(`)
`(`+ 1)− E])dB (1.10)
~ωB ... defined by the width of the parabolic barrier
RB ... position of the barrier
f(B) ... barrier distribution (normalization condition:∫f(B)dB = 1)
BM = (B0+BS)2
N(∆1,∆2)...normalization coefficient
∆2 = B0−BS2
= 2MeV
In general, ∆1 is less than ∆2 and can be considered as equal to 2 MeV. The formula
for T(E,`) is qualitatively understood and proved to be valid and hence, it can be used
as an empirical formula with fitted parameters.

24 Introduction
Compound Nucleus Formation
After coming over the Coulomb barrier the two nuclei reach the point of contact. The
further evolution of the system depends strongly on the masses of the touching nuclei
and on their deformation at that point.
In the case of a strongly asymmetric combination of projectile and target nucleus, the
system is transformed into the CN configuration with high probability. Especially for
fusion reactions dealing with light and medium nuclei, this probability is close to unity
(PCN ≈ 1).
This happens in the synthesis of heavy elements when the charge of one of the nuclei is
lower or of the order of 15. Due to large (B-Q)-values for these reactions, the excitation
energies of the formed CN are quite high, of the order of several tens of MeV. Hence,
the survival probability of the CN during the cooling process is very low.
In the case of more symmetric nuclear configurations, the system may evolve with a high
probability after nucleon transfer reactions took place directly into the fission exit chan-
nel without having formed a CN. This process is called ”fast fission” or ”quasifission”.
The evolution of the nuclear system is mainly determined by the character of the mul-
tidimensional potential energy, which is determined by collective degrees of freedom
playing the major role in this whole process, since at subbarrier collision energies the
nuclei practically have zero kinetic energy at the point of contact.
The main problem in describing the process of CN formation in competition with the
quasifission process is the correct choice of the aforementioned degrees of freedom, the
further derivation of the potential energy and the solution of the transport equation.
There are two basic approaches for describing the evolution of the nuclear system start-
ing from the moment at which the two colliding nuclei touch each other to either the
moment of formation of a spherical CN or the moment of reseparation in two fragments
(quasifission):
1. An approach assumes, that the two touching nuclei instantly and completely lose
their individualities and can be treated as one strongly deformed mononucleus
which develops in the multidimensional space of deformation either into a spherical
CN or into the fission channel. In practice, the number of used collective degrees
of freedom is restricted to only a few, defining the shape of the nuclear system but
neglecting the shell structure of the nuclei, which play an important role at low
excitation energies and especially at the initial moment of contact. More realistic
calculations have been performed using the Langevin equation and taking the shell
Introduction 25
effects in the three dimensional potential energy into account [29,30,31,32,33,34].
2. An opposite approach has been proposed by Antonenko et al. in 1993. In his
model, the two colliding nuclei which have passed the Coulomb barrier and have
reached the contact point remain after that in this position, keeping entirely their
shapes and individualities. The nucleon transfer only causes subsequent evolution
of the ”dinuclear system”.
In this approach, CN formation is defined as the complete transfer of all nucleons
from the light nucleus to the heavier one. This process competes with the nu-
cleon transfer from the heavy nucleus to the lighter one, resulting in a subsequent
separation of the two nuclei (quasifission). [35,36,37]
The real situation seems to be somewhere in between both approaches, because it is
very unlikely and improbable that during the evolution to an almost spherical nucleus
all the nucleons are strictly divided in two groups, nucleons belonging to the projectile
only moving in this volume and nucleons of the target only moving in that volume.
The probability of valence nucleon collectivization starts to increase immediately after
the contact of the nuclear surfaces took place and after overcoming the Coulomb barrier,
as shown in [38]. In a later stage of the evolution, when all the valence nucleons are
moving in the volume of both nuclei, the internal or core nucleons with lower energies
remain in the volume of their original nucleus.
At the final stage of the CN formation, when the number of shared nucleons is rather
large, the concept of the deformed mononucleus resulting from the dinuclear system
seems to be suitable.
In 2001 Zagrebaev proposed a new mechanism of the CN formation and the quasifission
process [26,38]. This model assumes, that a certain number of shared nucleons appear
when two nuclei get in contact. These nucleons move within the whole volume occupied
by the nuclear system and belong to both nuclei forming a neck between the nuclei.
Hence the number of such collectivized nucleons increases in contrast to the number of
nucleons belonging to each particular nucleus, which decreases.
The CN is formed at the point, when all nucleons are collectivized and arranged in the
potential of the CN. The inverse process of nucleon de-collectivization drives the nuclear
system to the fission channel [26,34]. It is interesting to note, that calculations using
this formalism have shown, that the quasifission process can also contribute to the yield
of symmetric fission fragments, which means, that the common approach of measuring
the fusion cross section by measuring the fragment mass distribution of the fissions may
have some uncertainties.

26 Introduction
Statistical decay of the excited nucleus
The survival probability of the excited CN C(E∗,J) in the process of its de-excitation by
emission of neutrons and γ-rays in competition with fission and emission of light charged
particles (C→B+x ·n+N · γ) can be calculated within the statistical model of atomic
nuclei [39]. The partial decay width of the emission of a particle a, a γ-quantum, and
for fission respectively can be expressed by the following equations:
ΓC→B+a(E∗, J) = g−1 ·
∫ E∗−Esepa
0
∑l,j
Tl,j(ea) ·I=J+j∑I=|J−j|
ρB(E∗ − Esepa − ea, I; βg.s.2 )dea
(1.11)
ΓLγ (E∗, J) = g−1 ·∫ E∗
0
I=J+j∑I=|J−j|
fL(eγ) · e2L+1γ ρC(E∗ − eγ, I)deγ (1.12)
ΓLfission(E∗, J) = g−1 · ~ωBT· (√
1 + x2 − x) ·∫ E∗
0
Tfission(e, J)ρC(E∗ − e, J, βsd2 )de
(1.13)
g = 2πρC(E∗, J) (1.14)
where ρA defines the state density of the nucleus A with the excitation energy E∗ and
Spin J, and Tl,j(ea) defines the penetration probability of the Coulomb and centrifugal
barrier by the light particle a from the nucleus C. Assuming that the electric dipole
radiation (L=1) dominated in high energy γ-emission one can use the strength function:
fE1 = 3.31 · 10−6(MeV−1)(A− Z) ·Z
A
eγΓ0
(E20 − e2
γ)2 + (eγΓ0)2
(1.15)
E0 =167, 23
A1/3√
1, 969 + 14, 074 ·A−1/3(1.16)
Γ0 = 5 MeV (for heavy nuclei) (1.17)
The equation for the fission width uses the Kramer correction which takes into account
the influence of the nuclear viscosity ν, which is typically of the order of [(1−30) · 1021s−1]
on the fission probability x.
The penetrability of the fission barrier (Tfission), depending on the height of the fission
barrier of the rotating nucleus (Bfission) which depends on the moment of inertia at
Introduction 27
ground state and saddle point can be described by the following equations:
Tfission(e, J) =1
1 + exp(− 2π~ωB [e−Bfission(E∗, J)])
(1.18)
Bfission(E∗, J) = B0(E∗, J)− (~2
2Jg.s.− ~2
2Js.d.)J(J + 1) (1.19)
Jg.s.,s.d. = k · 25MR2(1 +
βg.s.,s.d.2
3) (1.20)
with the ground state fission barrier (B0 = BLDM − δWe−γDE∗), which contains the
fission barrier deduced from the liquid drop model (BLDM) as well as a shell correction
energy for the nucleus in the ground state (δW ) and a damping parameter (γD), which
describes the decrease of the influence of shell effects on the energy level density with
an increase of the excitation energy.
The level density ρ can be expressed by:
ρ(E, J ; β2) = const ·KColl(β2)2J + 1
E2exp (2
√a · [E − Erot(J)]) (1.21)
where KColl defines the so called collective enhencement factor characterizing the level
density enhencement by collective excitations.
Rotating bands of deformed nuclei bring the main contribution to the collective enhance-
ment in the level density. For spherical nuclei the collective enhancement is smaller and
is caused by vibrational excitations. The borderline between deformed and almost spher-
ical nuclei is around |β2| ≈0.15. At this deformation, Krot changes very sharply from
around 150 to 1 so that Kvib is getting mayor influence on Kcoll. (Kvib ≈ 1− 10)
KColl(β2) =J⊥T
~2φ(β2) +Kvib[1− φ(β2)] (1.22)
φ(β2) =1
1 + exp [β02+β2
∆β2]
(β02 ≈ 0.15,∆β2 ≈ 0.04) (1.23)
T =
√Einta
(1.24)
The survival probability depends only on the ratio Γn/Γfission and hence on the ratio
ρB(E−Esepn , βg.s.2 )/ρB(E−Bfission, β
s.d.2 ). Therefore, the survival probability of deformed
nuclei is independent of the collective enhancement, due to the fact, that the effects of
both collective modes are canceling each other out.

28 Introduction
For spherical nuclei, the ratio Γn/Γfission is proportional to Kvib(βg.s.2 )/Krot(β
s.d.2 ) and
hence the survival probability can be significantly reduced by the collective enhancement
factor. In this case, the dependence of Kcoll on the deformation plays an important role.
The calculation of the total survival probability for the formation of a cold EVR after
the emission of x neutrons is usually performed within numerical calculations based on
the analysis of the multistep decay cascade. Zagrebaev [25] uses for example an explicit
analytic expression, which directly takes the Maxwell-Boltzmann energy distribution for
the emitted neutrons into account:
PEV R =
∫ E∗0−Esepn (1)
0
ΓnΓtot
(E∗0 , J0)Pn(E∗0 , e1)de1 · ... (1.25)
·∫ E∗x−1−E
sepn (x)
0
ΓnΓtot
(E∗x−1, ex) ·GNγ(E∗x, Jx → g.s.)dex (1.26)
Here, Esepn (k) denotes the binding energy of the k-th emitted neutron and ek denotes
the energy of the k-th emitted neutron. The probability of en is given by the probability
distribution Pn(E∗k , ek), while E∗k denotes the excitation energy of the EVR after the
emission of k neutrons, E∗k = E∗0 −∑k
i=1
[Esepn (i) + ei
].
Finally, GNγ denotes the probability, that the remaining excitation energy and angular
momentum will be emitted by the emission of N γ-quanta. Numerical calculations show,
that the average energy of the emitted γ-quanta is in the range of 0.1 to 1 MeV and that
their influence on the final cross section is weak, except for the 0n evaporation channel.
1.3.3 Predicted cross sections for the formation of 270Hs from dif-
ferent nuclear fusion reactions
As described above, nuclear fusion reactions can be divided in three subsections, cold,
warm and hot fusion, depending on the excitation energy of the EVR at near barrier
incident energies. Cold fusion reactions are based on closed spherical shell target nuclei
of lead and bismuth in combination with various projectile nuclei. In practice only
projectiles up to zinc are used due to the sharp drop of the EVR cross section, but also
even heavier projectiles have been used, so far without success [40].
While the excitation energy of EVR produced in cold fusion reactions is rather low and
hence the survival probability is higher compared with other fusion reaction types due
to fewer evaporated neutrons, the fusion probability is much lower. Especially with
Introduction 29
increasing charge of the synthesized superheavy elements, the latter factor becomes
dominant decreasing the yield of EVR dramatically.
There are two factors for that behavior. On the one hand, the EVRs produced in cold
fusion reactions are neutron deficient and far away from closed shells or sub shells and
hence neutron separation energies are rather high and fission barriers are rather low.
Hence the survival probability is reduced. On the other hand, and this is the mayor
reason, the fusion probability decreases sharply with increasing charge of the projectile.
As shown in [41], the fusion probability shows two major dependences, an energy and an
asymmetry dependence. The energy dependence means the difference of the ′internal′
excitation energy of CN (E∗int(`) = Ec.m. +Q−Erot(`)) and the excitation energy of the
CN at the center-of-mass energy equal to the Bass barrier (E∗B) and can be formulated
in the case of cold fusion as:
PCN(E∗, `) =P 0CN
1 + exp
[E∗B−E
∗int(`)
∆
] (1.27)
The E∗B − E∗int(`)-dependence corresponds approximately to the (B −Q) value.
The asymmetry dependence is included in P 0CN as:
P 0CN =
1
1 + exp
[Z1Z2−ζ
τ
] (1.28)
In this formula, ζ and τ are just fitted parameters. Although this formulas are only valid
for cold fusion reactions, the main conclusions and dependences are valid [42] also in the
case of warm and hot fusion reactions. The energy and asymmetry dependence still have
a mayor influence on the fusion probability and hence on the EVR cross section. One very
interesting and also very important question is which of those two dependences plays the
major role for the synthesis of superheavy elements. In order to study the systematics of
fusion probability without dealing with exit channel effects, like the survival probability,
different fusion reactions resulting in the same CN are investigated. These reactions
have on the one side different asymmetries and on the other side, due to their nuclear
structure slight or large differences in their (B-Q)-values.
In the case of the doubly magic nucleus 270Hs, different reactions, leading to the same
CN (274Hs) can be studied with the aim to investigate the influence of mass asymmetry
and (B-Q)-value on the CN formation in the entrance channel. These are 26Mg + 248Cm,30Si + 244Pu, 36S + 238U, and 48Ca + 226Ra. Bass barrier, Q-value, (B-Q)-values and

30 Introduction
Z1 ·Z2 (proportional to the reaction asymmetry) are displayed in Table 1.1. As can
Table 1.1: Bass barrier, Q-value, (B-Q)-values and Z1 ·Z2 for various reactionsleading to the CN 274Hs.
Reaction B [MeV] Q [MeV] (B-Q) [MeV] Z1 ·Z2
26Mg + 248Cm 126.9 -82.2 44.7 115230Si + 244Pu 144.0 -98.0 46.0 131636S + 238U 159.1 -116.7 42.4 1472
48Ca + 226Ra 187.0 -153.9 33.1 1760
be seen, these reactions differ in their asymmetry, from the most asymmetric reaction26Mg + 248Cm to the most symmetric reaction 48Ca+ 226Ra, as well as in their excitation
energy at the center-of-mass energy equal to the Bass barrier (B−Q). Here, the reaction48Ca+226Ra has the lowest and hence the most favorable value. The reaction 30Si+244Pu
has the highest and thus the most unfavorable value. The interesting question is, which
of both parameters are dominant and hence, which reaction provides the highest yield
compared with the others.
Recently, the formation of deformed doubly-magic 270Hs in the 4n evaporation chan-
nel in the complete fusion reactions 248Cm(26Mg, 4n), 244Pu(30Si, 4n), 238U(36S, 4n), and226Ra(48Ca, 4n) has been studied theoretically in more detail using a two-parameter
Smoluchowski equation[43]. Due to a lower reaction Q value, the reactions 238U(36S, 4n)270Hs
(σtheo = 24 pb) and 226Ra(48Ca, 4n)270Hs (σtheo = 30 pb) are predicted to have higher
cross sections compared to the reactions 248Cm(26Mg, 4n)270Hs (σtheo = 12 pb) and244Pu(30Si, 4n)270Hs (σtheo = 8 pb). The calculated excitation functions of these reac-
tions can be found in Figure 1.9.
A maximum cross section for the 226Ra(48Ca, 4n)270Hs reaction of about 30 pb was
also predicted in other calculations, using a different method [41], which has been shown
to reproduce experimental cross sections for various 48Ca-based fusion reactions with
actinide targets. The calculated excitation functions for the 2n - 5n evaporation channel
can be found in Figure 1.10.

Introduction 31
Figure 1.9: Evaporation residue cross sections (σER) for the 4n channel of thecomplete fusion reactions 26Mg+248Cm, 30Si+244Pu, 36S+238U and 48Ca+226Ra.Adopted from [43].
cro
ss
se
ctio
n/
pb
E / MeV*
100
10
125 30 35 40 45 50
Figure 1.10: Excitation functions for the 2n- to 5n-evaporation channels ofthe complete-fusion reaction 48Ca+226Ra. The Bass barrier BBass [28] is shownby an arrow. Adapted from [41].
32 Introduction
HIVAP
HIVAP (Heavy-Ion VAPorisation statistical-evaporation model) is a computer code for
calculating EVR cross sections from heavy ion induced fusion reactions [44]. It was
developed and improved by W. Reisdorf and M. Schadel. It has been shown during
the last two decades that HIVAP reproduces experimental measured EVR cross sections
up to element 106 within a factor of 2-3. HIVAP takes into account a dynamically
fluctuating barrier for the fusion probability and temperature dependent shell effects in
the level density for the fission probability.
HIVAP uses conventional statistical decay theory, assuming that the formation of
the compound nucleus by complete amalgamation of projectile and target nuclei is a
step completely independent of the subsequent deexcitation by nuclear fission and/or
emission of light particles and gamma rays. Fusion is assumed to occur whenever a
fusion barrier calculated from the global nucleus-nucleus potential of Bass [28] is passed.
Below the barrier, a WKB transmission calculation is performed.
Due to coupled channels effects the barrier is ”distributed” [45,46]. For the mostly
deformed actinide target nuclei, the experimentally known deformation by orientation
averaging have been taken into account and on top of this orientational barrier fluctua-
tion another independent ”vibrational-plus-transfer” contribution has been added. As a
phenomenological parameterisation of this barrier distribution, a Gaussian distribution
cut off at both ends after 5 standard deviations has been used. Such a phenomenolog-
ical approach [47] reproduces reasonably well experimental subbarrier fusion excitation
functions.
The sensitive parameters, which are involved in the second-deexcitation-step, are
primarily level density parameters, fission barriers, and masses. The masses are used to
deduce particle separation energies and shell corrections. Whenever possible, they were
taken from experiment. Otherwise the predictions of Liran and Zeldes [48] were used.
The code follows the evaporation chain through all the steps allowing for neutron, proton,
alpha, and gamma emission in addition to (multiple chance) fission. The transmission
through the fission barrier was calculated by the classical approximation.
To demonstrate the accuracy of HIVAP concerning the prediction of experimental
EVR cross sections, the excitation functions for 4n through 8n evaporation channels
from the 238U(12C, xn)250−xCf reaction are shown in Figure 1.11.
Very good agreement between the experiment and the calculation is achieved not

Introduction 33
52
103
102
.~ 101
Io~
o 10 -~
10-2
J i i ~ i I i i i i
/,n-246Cf 5n-2~SCf
~,~) . ~ 6n-2aCf j ~ ~ 7n-2~SCf
~'~" ~ ~ ~7- 8n-2 '2Cf
r v = , N /
exci ta t ion funct ions sh i f ted by:
10-2 + 10 MeV + 20 MeV + 30 MeV + 40 MeV I i I i I I I i I i I [ i I r I
60 70 80 90 100 110 120 130 140 150
Project i le energy (MeV)
Fig. 2. Excitation functions for the 238U(12C, xn)25~ reaction. Open symbols are from HIVAP calculations, full symbols are experi- mental data [-37]
100
10 C ._o (J
cn 1 (/)
o (..)
0.1
.~ . . 24eCm05N,/m)259103
~" ~ ' ~ 2~9 Bk(15 N,/,n)26010/+
~ 249Cf(75N,/m)Tsa10 5
(ISo,b.nl2e310 6
I I I I I I I I
70 75 80 8~ 90 95 100 105 110 ProjectiLe energy (MeV)
Fig. 4. Comparison of calculated (open symbols) and measured (full symbols) excitation functions for heavy element isotope production in hot fusion reactions
83
= 2
[ ] []
A A
o . . . . . . . . . . . . . . . . . . q~ . . . . . . . . . . . . . . . . . . . . . . . . . . . . . . . . . . . . . . . . . . . . . . .
0 I I I I F I I I
251 252 253 254 255 256 257 258
Mass number
Fig. 3. Ratio between experimental [38] and calculated cross sec- tions for No isotopes produced in reactions of t2C (open symbol) and 13C (full symbol) projectiles with targets of 244Cm (circle), 246Cm (triangle), and z48Cm (square)
isotopes, we have plotted the ratio between experimental and calculated cross sections at the maxima of the excita- tion functions. The maximum deviation, which is ob- served for 257No, corresponds to a factor of 2.5.
For relatively more neutron-rich isotopes with neu- tron number greater or equal N=152 the calculated cross sections are a factor of 2.5 lower than the experi- ment. No obvious trend towards increasingly large de- viations can be observed for the more neutron-rich isotopes.
Obviously the code HIVAP provides a very good de- scription of production cross sections for Cf and No isotopes. Its potential for the prediction of heavy element production in hot fusion reaction has been tested up to the 249Cf(180, 4n)263106 reaction; 263106 being the heaviest nuclide synthesized in a hot fusion reaction. To check the quality of our calculations we have chosen
those experimental data from the literature where 'exci- tation functions' have been measured for 4n evaporation residues; these are the reactions z48Cm(15N, 4n)259103 [39], 249Bk(tSN, 4n)26~ [40], 249Cf(15N, 4n)26~ [41], and 249Cf(180, 4n)26a106 [33, 34]. The following corrections have been made on the originally published data: for 260105 the cross sections from [-41] has been increased by 10% according to the existence of a 10% fission branch [37] in this isotope, and for 263106 the cross section from [33] has been increased by a factor of 1.5 taking into account that only spontaneous fission with a branching of 66% has been measured. As dis- cussed above, the branching has been determined from a comparison of the 0.6 nb s f cross section at 95 MeV [34] and a cross section of 0.3 nb measured for the c~- decay of this isotope at the same energy [33]. The set of experimental data which we have used has the advan- tage that the increasingly heavy elements are formed with targets and projectiles varying as little as possible from one compound nucleus to the next. No strong tar- get or projectile dependence is expected under these con- ditions, and, therefore, this should most clearly reveal any element dependence of the product Z, if it exists at all. From an inspection of Fig. 4, which shows the experimental cross sections together with the calculated ones, it is clear that up to element 106 the code HIVAP gives, within a factor of 2-3, an excellent agreement be- tween calculation and experiment. This gives confidence for predictions in yet unknown regions. On the other side, it is interesting to note here that almost all of the investigated experimental excitation functions exhibit a high energy tail which can by no means be reproduced in the calculations. One may take this as an evidence for non-equilibrium processes contributing to the ob- served cross section at energies above the optimum ener- gy of the respective evaporation channel. As we shall discuss later, these processes seem to play an increasingly important role for the production of elements beyond 106.
Figure 1.11: Excitation functions for the 238U(12C, xn)250−xCf reaction. Opensymbols are from HIVAP calculations, full symbols are experimental. Adaptedfrom [44].
only for the position of the maxima but also for absolute cross section values. The
largest discrepancies as observed for the 7n and 8n evaporation channel are still less
than a factor of three. This clearly demonstrates the validity of these calculations in the
range of compound nucleus excitation energies from 34 MeV (61 MeV projectile energy
in Figure 1.11) up to more than 80 MeV.
HIVAP calculations for the complete nuclear fusion reaction 238U(36S, xn)274−xHs
have been performed by Ch. E. Dullmann [49]. The results for the 3n-6n channel are
displayed in Figure 1.12.
HIVAP predicts the 3n channel to be the dominant channel with a maximum cross
section of about 10 pb at an excitation energy of about 30 MeV. The 4n and 5n channel
are predicted to have maximum cross sections of about 3 pb at 38 MeV and 48 MeV,
respectively. At 38 MeV, HIVAP also predicts a cross section of about 1 pb for the 3n
channel. The 6n channel should provide a maximum cross section of about 0.3 pb at
56 MeV. It is important to note, that predictions from HIVAP for the 4n channel are
about one order of magnitude lower that predictions made by Liu et al. [43].
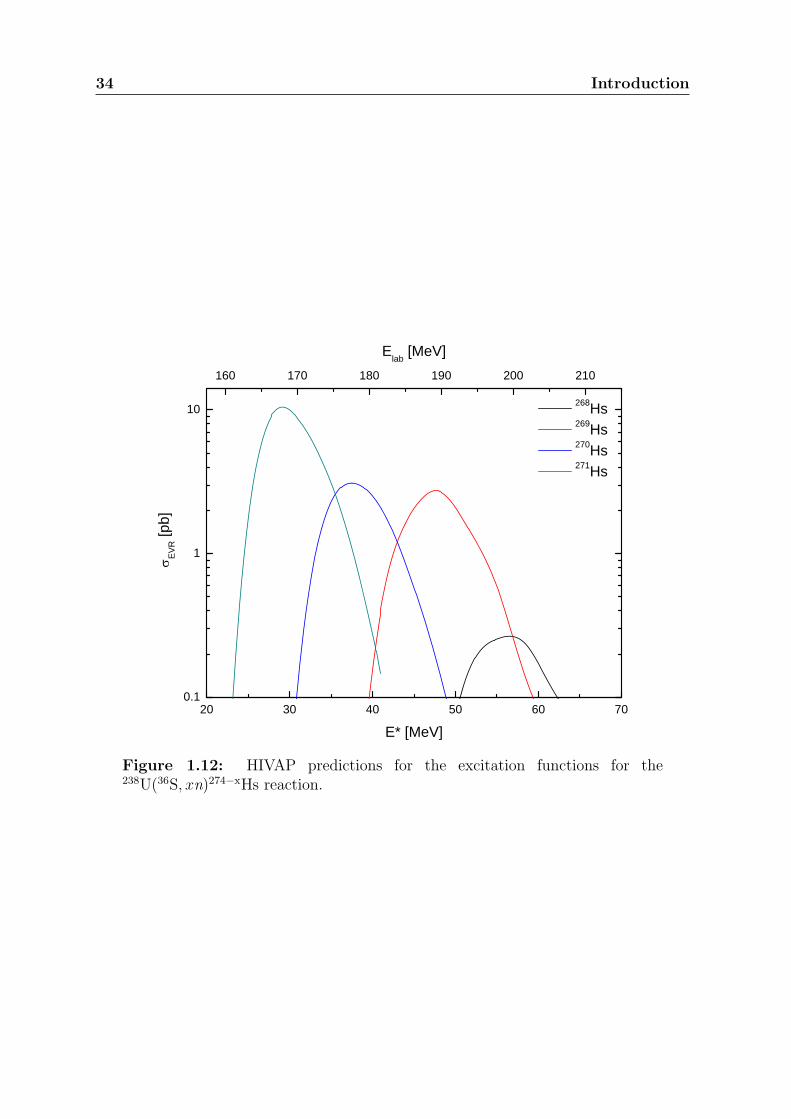
34 Introduction
20 30 40 50 60 700.1
1
10
160 170 180 190 200 210
σ EV
R [p
b]
E* [MeV]
268Hs 269Hs 270Hs 271Hs
Elab [MeV]
Figure 1.12: HIVAP predictions for the excitation functions for the238U(36S, xn)274−xHs reaction.

Introduction 35
1.3.4 Experimental challenges on the production of SHE
SHE are produced in heavy-ion induced complete nuclear fusion reactions, followed by
sequential evaporation of one or several neutrons. The projectile and target nucleus
form an excited CN, which is highly unstable and undergoes fission, unless it de-excites
rapidly by emission of neutrons and γ-rays. During each step of de-excitation by neutron
emission, a competition with fission takes place, which makes the survival probability
extremely sensitive on the fission barrier. Due to the repulsive Coulomb force between
target and projectile nucleus, the latter has to overcome the fusion barrier. Even if the
projectile energy is high enough to overcome this barrier, the impact parameter plays a
very important role, since the nuclei only get in touch at small impact parameters. If
those parameters are too large, the incident projectile is deflected. This corresponds to
elastic scattering, when the kinetic energy of the incident particles is conserved (large
impact parameters). At medium impact parameter inelastic scattering takes place, when
the kinetic energy of the incident particles is not conserved and the target nucleus gets
excited due to electromagnetic or nuclear forces. Hence, the probability of a capture of
the projectile by the target nucleus and a further CN formation followed by de-excitation
(successive neutron emission without fissioning) is strongly suppressed compared with
reaction channels, like transfer reactions. These reaction channels lead to a huge amount
of different nuclei with cross sections in the order of b. In addition, also elastically
scattered target nuclei recoil out of the target with high cross sections. Compared with
EVR cross sections for the production of 270Hs in complete nuclear fusion reactions,
which are of the order of pb, these are higher by a factor of one trillion! Hence, highly
efficient and selective separation methods have to be applied in order to reduce the
unwanted background of byproducts. Since the half-lives of SHE decrease with increasing
atomic number, the separation techniques have to be also very fast.
During the last decades, two basic separation techniques have proven their worth.
On the one hand, chemical methods have been used to separate selectively SHE from
transfer reaction products due to their chemical properties based on the atomic number.
Using chemical arguments, the discovery of a new element can be established. The
limiting factor of this technique is the half-life of the SHE which has to be at least half
a second for gas phase chemistry and several tens of seconds for liquid phase chemistry.
On the other hand, electromagnetic recoil separators have been developed, separating
the reaction products due to their ionic charge and momentum. The separation times
are determined here by the recoil velocity and the length of the separator, providing the
study of SHE with half-lives as short as few microseconds.

36 Introduction
1.4 Decay properties of SHE
In this section, I would like to refer to the common decay modes and properties of SHE.
Due to the large number of positively charged protons bound inside of the nucleus, SHE
can and will increase their binding energy by radioactive decay. These decays, especially
the α-decays are unique for every isotope (like a fingerprint) and hence the formation of
a SHE nucleus can be unambiguously established by measuring its characteristic decay-
pattern. This method is especially convincing when the observed decay chain leads into
the region of already well known nuclei.
1.4.1 Decay properties and stability of heaviest elements
As mentioned before, SHE only exist due to nuclear shell effects, enhancing the nuclear
stability. Hence, the half-lives and decay modes of these depend mainly on the strength
of those effects and therefore on shell closures in the SHE area. Due to this, one very
important and interesting point is the prediction of closed shells or sub shells beyond
the closed spherical proton and neutron shells at Z=82 and at N=126. Several possible
proton shell closures are predicted, at Z=114, 120, or 126, depending on the model
used [2, 3, 4, 5]. On the neutron side, most models agree, that the next closed shell is
expected at N=184 [3, 4]. Beside these predicted spherical shell closures, deformed shell
closures can be found. Improved calculations for shell closures including higher orders
of deformation, predicted a closed deformed proton and neutron shell at Z=108 and
N=162 [6, 23,50], with shell correction energies similar to those, resulting for spherical
shell closures. Measurements of Qα-values show, that nuclei around Z=108 and N=162
have lower Qα-values, which correspond to longer half-lives, indicating that these two
deformed shell closures really exist[51,52]. Around these closed shells, an area of nuclides
of relative stability and hence longer half-lives was predicted to form a so called island
of stability, which is surrounded by nuclei with reduced stability and hence shorter
half-lives. The systematics of spontaneous-fission half-lives reflects the systematics of
shell-correction energies in the SHE area, since these properties are directly connected.
As can be seen in Figure 1.13, a significant increase of (negative) shell-correction energy
(a) and hence a major increase of SF half-life (b) from 103 s for deformed and 1012 s for
spherical SHE was calculated.
The much stronger increase of SHE half-lives for spherical shell closures originates
from an increase of the fission barrier width, which becomes much wider than for de-
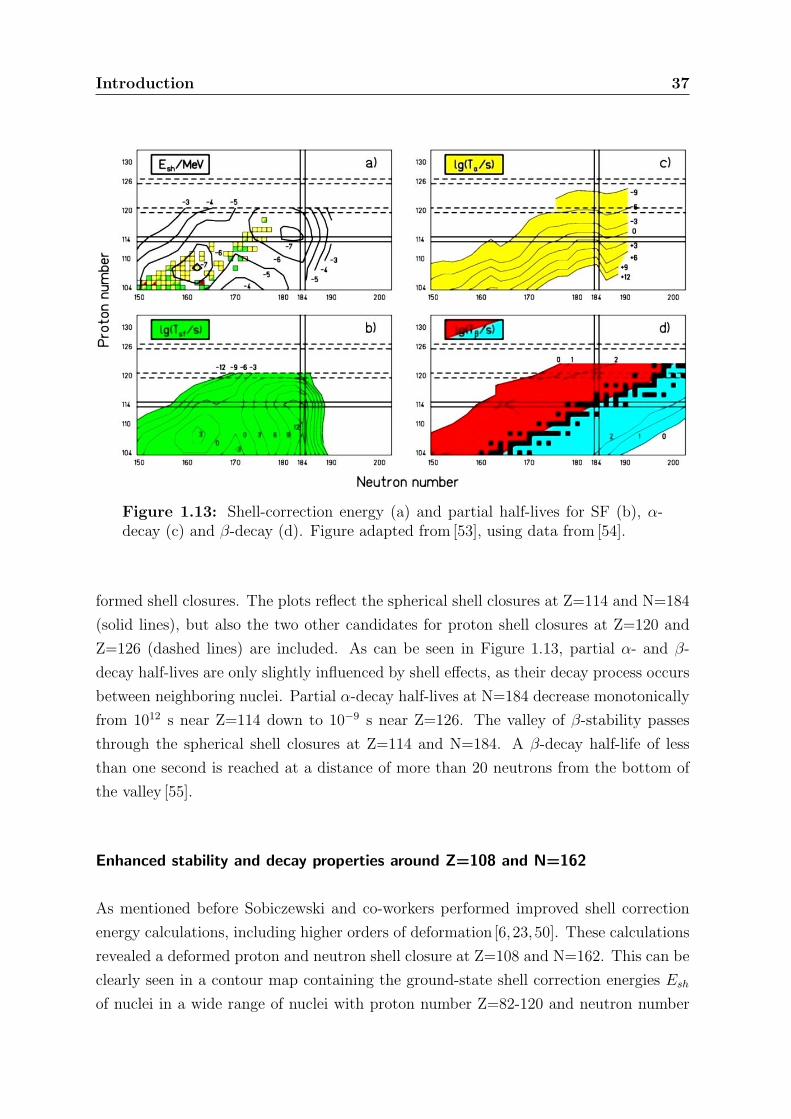
Introduction 37
Figure 1.13: Shell-correction energy (a) and partial half-lives for SF (b), α-decay (c) and β-decay (d). Figure adapted from [53], using data from [54].
formed shell closures. The plots reflect the spherical shell closures at Z=114 and N=184
(solid lines), but also the two other candidates for proton shell closures at Z=120 and
Z=126 (dashed lines) are included. As can be seen in Figure 1.13, partial α- and β-
decay half-lives are only slightly influenced by shell effects, as their decay process occurs
between neighboring nuclei. Partial α-decay half-lives at N=184 decrease monotonically
from 1012 s near Z=114 down to 10−9 s near Z=126. The valley of β-stability passes
through the spherical shell closures at Z=114 and N=184. A β-decay half-life of less
than one second is reached at a distance of more than 20 neutrons from the bottom of
the valley [55].
Enhanced stability and decay properties around Z=108 and N=162
As mentioned before Sobiczewski and co-workers performed improved shell correction
energy calculations, including higher orders of deformation [6, 23,50]. These calculations
revealed a deformed proton and neutron shell closure at Z=108 and N=162. This can be
clearly seen in a contour map containing the ground-state shell correction energies Esh
of nuclei in a wide range of nuclei with proton number Z=82-120 and neutron number

38 Introduction
N=126-190 (see Figure 1.14). The plot reveals three minima in this region. The first and
deepest (Esh = −14.3 MeV) is obtained for the doubly magic spherical nucleus 208Pb.
The second one (Esh = −7.2 MeV) is arranged at the nucleus 270Hs, which is predicted to
be a doubly magic deformed nucleus [6, 50]. The third minimum (Esh = −7.2 MeV) can
be found for the nucleus 298114, which is predicted to be the next heavier doubly magic
spherical nucleus to the last experimentally known doubly magic 208Pb. Beside these
minima, a rather wide plateau can be found around 252Fm, which can be considered as
a nucleus with closed deformed sub-shells [6, 50].
Figure 1.14: Contour map of ground-state shell correction energies Esh.Adopted from [27].
The stabilization effect is also reflected by α-decay energies (Qα) systematics near and
at closed shells, due to a relation between partial α-decay half-lives and Qα values. This
relation can be evaluated using the phenomenological Viola-Seaborg formula, which was
modified by Parkhomenko and Sobiczewski[56]. The partial α-decay half-life is estimated
as:
log10Tphα (Z,N) = aZ(Qα − Ei)1/2 + bZ + c, (1.29)
Here, Z denotes the proton number; a,b,c are parameters fitted to experimental data

Introduction 39
and Ei varies for different nuclei as follows:
Ei =
0 for even-even nuclei,
Ep for even-odd nuclei,
Ep + En for odd-odd nuclei,
(1.30)
a = 1.5372, b = −0.1607, c = −36.573
Ep = 0.113 MeV, En = 0.171 MeV (1.31)
Ep and En correspond to the average excitation energy of proton and neutron one-
quasiparticle states, which become occupied after α-particle emission. Using this formula
it is possible to derive values for Tα within a factor of four (within a factor of two for even-
even nuclei). The main conclusion of this formula is that the partial α-decay half-life is
antipropotional to the α-decay energy. In Figure 1.15 calculated Qα-values of even-even
nuclei are plotted and compared with experimentally measured values for nuclei close to270Hs.
Figure 1.15: Comparison of Qα values from theoretical calculations[57,58] andexperimental data [51,59,60,61] for even-even nuclei. Adopted from [51].
The closed Z=108 proton shell can be seen as a large gap between Hs and Ds isotopes.
Hence, going from Hs to Ds isotopes, Qα decreases corresponding to an increase in Tα,

40 Introduction
reflecting enhanced stability for Hs isotopes (Z=108). In addition, the shell closure
at N=162 also enhances stability of isotopes leading to a local minimum at N=162.
The dominat decay mode can be obtained by comparing the results for partial half-
lives as shown in Figure 1.16 for even-even nuclei. In general, the regions around the
shell closures of 270Hs and 298114 form a landscape of α-particle emitters surrounded by
spontaneously fissioning nuclei. From the decay scenario in Figure 1.16 follows, that the
most likely decay mode of 270Hs as well as 268Hs and 272Hs is α-decay. While 270Hs is
expected to have a half-life of the order of a few seconds, both other isotopes should
decay within a half-life shorter than one second as a result of stabilization effects of the
N=162 closed shell. The possible daughter nuclides 266Sg and 262Rf are expected
Figure 1.16: Decay scenario in the region of SHE for even-even nuclei. Datafrom [54].
to decay via SF, which is more probable than α-decay. For even-odd nuclei, similar
calculations can be done resulting in α-decay as dominate decay mode for 269Hs and271Hs as well as for their daughters 265Sg and 267Sg. For 261,263Rf partial half-lives for
α-decay and SF are comparable and hence there will be an almost equal α/SF branching.
1.4.2 Decay properties and production of isotopes near Z=108,
N=162
The estimates of Section 1.4.1 have been mostly confirmed in experiments aiming at the
investigation of the decay properties of Hs-isotopes in the last decade [7, 51, 52,62]. For269Hs, α-α-α-α or α-α-SF decay chains are known from previous experiments[7, 63,64,65].

Introduction 41
For decay of 268Hs and 270Hs, α-SF cascades have been observed [51,62], while 271Hs de-
cays via α-α-SF or α-SF chains [52]. The decay properties of these Hs isotopes near
N=162 are summarized in Table 1.2 and Figure 1.17.
Table 1.2: Decay Properties of 269−271Hs and daughter nuclei measured inprevious experiments. Data taken from [8,66,67,68,69].
Nuclide decay mode T1/2 Eα [MeV]
branching268Hs α ≤ 0.5 s 9.44269Hs α 9.7 s 8.95, 9.13270Hs α ∼ 23.0 s 8.88271Hs α ∼ 4 s 9.13, 9.30264Sg SF 68+37
−18 ms265aSg α 8.9+2.7
−1.9 s 8.80-8.90265bSg α 16.2+4.7
−3.5 s 8.70266Sg SF 359+248
−104 ms267Sg α/SF 84.3+58.1
−24.2 s 8.20
0.17/0.83261aRf α 68± 3 s 8.28261bRf α/SF 3± 1 s 8.51
0.09/0.91263Rf SF 8.3+39.8
−3.8 s
From Q-value interpolations of all known Hs isotopes, an α-particle-energy of about
9.44 MeV for the decay of 268Hs can be deduced. From results of a chemical search exper-
iment for this nuclide follows that its half life is most likely ≤0.5 s[69]. The decay proper-
ties of 268Hs have been investigated for the first time in 2009 using the velocity filter SHIP
at the GSI[62]. The complete nuclear fusion reaction 238U(34S, xn)272−xHs has been used
and one decay chain of 268Hs was measured. The production cross section was 0.54+1.3−0.45
pb. The decay properties of 269Hs, 270Hs, and 271Hs have been investigated in previous
Hs chemistry experiments using the complete fusion reaction 248Cm(26Mg, xn)274−xHs
[7,51,52]. In addition, the excitation functions of the 3-5n exit channels of this reaction
have been measured at five different beam energies [8] in two experimental campaigns,
using an improved chemical separation and detection system. In former experiments, it
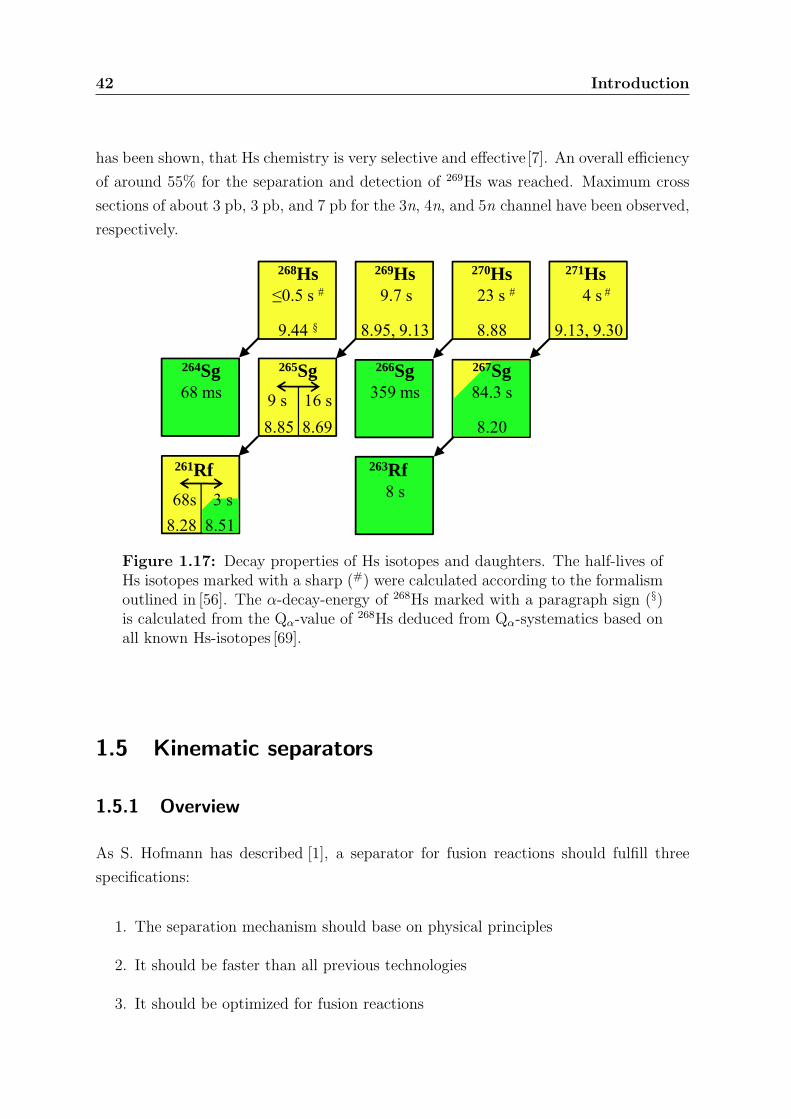
42 Introduction
has been shown, that Hs chemistry is very selective and effective[7]. An overall efficiency
of around 55% for the separation and detection of 269Hs was reached. Maximum cross
sections of about 3 pb, 3 pb, and 7 pb for the 3n, 4n, and 5n channel have been observed,
respectively.
268Hs≤0.5 s #
9.44 §
269Hs9.7 s
8.95, 9.13
270Hs23 s #
8.88
271Hs4 s #
9.13, 9.30
264Sg 68 ms
266Sg359 ms
265Sg9 s 16 s8.85 8.69
267Sg84.3 s
8.20
261Rf68s 3 s
8.28 8.51
263Rf8 s
Figure 1.17: Decay properties of Hs isotopes and daughters. The half-lives ofHs isotopes marked with a sharp (#) were calculated according to the formalismoutlined in [56]. The α-decay-energy of 268Hs marked with a paragraph sign (§)is calculated from the Qα-value of 268Hs deduced from Qα-systematics based onall known Hs-isotopes [69].
1.5 Kinematic separators
1.5.1 Overview
As S. Hofmann has described [1], a separator for fusion reactions should fulfill three
specifications:
1. The separation mechanism should base on physical principles
2. It should be faster than all previous technologies
3. It should be optimized for fusion reactions

Introduction 43
Under these conditions, three types of separators can be considered:
1. Gas-filled separators
Gas filled separators contain a light-weight gas, usually helium (like TASCA or
BGS), hydrogen (like TASCA or DGFRS) or mixtures of both, at low pressure,
usually 0.5 mbar to 1 mbar. A charge distribution around an average charge-
state of the fusion products, recoiling out of the target, is achieved by colliding
and interacting several times with the gas atoms. The separation of the fusion
products from beam particles and other products is obtained by the magnetic
field of a dipole magnet, deflecting the particles due to their mass, charge state
and velocity, which define their magnetic rigidity. Only particles with a defined
magnetic rigidity are guided through a dipole magnet.
2. Velocity separators
Velocity or kinematic separators are so called Wien filters, which consist of electric
and magnetic dipole fields, separating the particles leaving the target by their
velocity. While the deflection in the electric field is ∼ qm · v2 , in the magnetic field
it is ∼ qm · v . By combining both fields, only particles with a certain velocity can
pass the separator.
3. High frequency filters
For accelerators like the UNILAC at the GSI, which accelerate the projectiles
as bunches, another concept for separating fusion products can be applied. The
idea is to place a high frequency resonator behind the target working at the same
frequency as the accelerator but with an electric field transverse to the beam
direction. Because of technical difficulties, this concept has never been realized.
1.5.2 Theory and layout of gas-filled separators
Heavy ions, passing a gas at low pressure, are changing their charge state due to collisions
with the gas atoms [70]. Either they lose electrons and get into a higher charge state or
they capture electrons from the gas atoms or molecules and decrease their charge state.
If the path length of the ion in the gas is much larger than the mean free path between
these collisions, a charge distribution around an average charge state is established.
The trajectory of the heavy ions passing through the magnetic dipole field depends on
their properties, the average charge state, mass, and velocity, and on the magnetic field

44 Introduction
strength and is described by the following formula:
Bρ =mv
qe(1.32)
Using the Thomas-Fermi atomic model, the average charge state can be described as:
q =( vv0
)Z
13 (1.33)
By using this approximation, the magnetic rigidity of the ion is now only characterized
by its A and Z and independent of the velocity and of the initial charge distribution:
Bρ = 0.0227 · AZ
13
Tm (1.34)
This formula is only valid, if the time between two interactions is larger than the de-
excitation of an excited state of an ion. If this is not the case, the so-called density effect
takes place, which describes the fact, that an excited electron can be stripped from a
heavy ion more easily than an electron in the ground state [71]. This effect changes of
course the charge state distribution and the average charge state substantially and hence
also the magnetic rigidity.
Another property of gas-filled separators, which is connected with the rigidity, is the
dispersion in the focal-plane. The focal-plane can be considered as the focus of the sepa-
rator, where spatial distribution of the reaction products is minimal. The focal-plane is
the place where the detector or the RTC (Recoil Transfer Chamber)-window (in case of
a chemistry separator experiment) is installed. The dispersion defines the change of the
rigidity with a certain change in the position in the focal-plane ( ∆x∆Bρ/Bρ
). It describes
the range in magnetic rigidity, which is covered by the detection system. Its unit is cen-
timeter per percent change in magnetic rigidity ( cm%
). Since it is not so easy to calculate
the magnetic rigidity of the reaction products with small errors, a small dispersion is
preferred to get the fusion products in the detection system. This is the case for the
DGFRS and TASCA for example, so that these devices are very useful for superheavy
element synthesis experiments.
The separation inside of the gas-filled separator happens due to different magnetic rigidi-
ties of the fusion products, transfer products, scattered target atoms, and the beam, as
can be seen in equation 2.3. For the reaction 48Ca + 244Pu→ 288114 + 4n for example,
the ratio between the Bρ for fusion products, target atoms, and beam particles is 1.0
: 0.9 : 0.3. In this context, especially for asymmetric reactions like the latter, where
the fusion products and the target atoms have similar rigidities, a large dispersion is

Introduction 45
favored to obtain an optimal separation. Table 1.3 contains some gas-filled separators,
used in SHE experiments. An example for a separator with large dispersion is the BGS,
providing a good separation factor and hence lower background also for very asymmetric
reactions, like 22Ne + 238U→ 255No + 5n.
Table 1.3: Comparison of gas-filled recoil separators. Data adopted from[70,72].
Separator Configuration Solid angle Bending Max. Bρ Length Dispersion
[msr] angle [Tm] [m] [cm/%]
DGFRS DQhQv 10 23◦ 3.1 4.3 0.63
GARIS DQhQvD 22 45◦ 2.2 5.8 0.78
BGS QvDhD 45 70◦ 2.5 4.6 1.80
RITU QvDQhQv 10 25◦ 2.2 4.7 1.00
TASCA (HTM) DQhQv 13.3 30◦ 2.4 3.5 0.90
TASCA (SIM) DQvQh 4.3 30◦ 2.4 3.5 0.10
The reason for the larger dispersion and hence separation of the BGS compared for
example with the DGFRS is the design of the separator. While the DGFRS has a tra-
ditional DQhQv setup with a bending angle of 23◦ of the dipole, the BGS has a QvDD
design with a bending angle of 70◦.
The main part of a gas-filled separator is an arrangement of magnetic dipole and
quadrupole magnets around a gas-filled chamber (see Figure 1.18). While the dipole
magnet is responsible for the separation itself and should be installed as close as pos-
sible to the target to get maximum acceptance, the quadrupole magnets are used for
focusing the fusion products into the focal-plane afterwards. Due to the magnetic field
inside, a quadrupole magnet is only able to focus vertically or horizontally, depending
on the direction of the electric current inside. Hence, in most separators, they are used
in doublets, to obtain optimum focusing in both directions.
Some devices are using an extra quadrupole for horizontal focusing before the dipole
to increase the acceptance of the dipole, like GARIS II or RITU. In the latter case, an
increase of 30% has been observed for asymmetric reactions compared with the tradi-

46 Introduction
The dispersion for the system shown in Fig. 2
was calculated as 15 mm/%Bq at the focal plane.This is 50% higher than in RITU, but still not too
high to prevent collection of all reaction productswith a relatively broad Bq-distribution on the fo-cal-plane detector.
The total length of the new separator is about
4.8 m which is nearly the same as in RITU. Thus,
the multiple scattering in the filling gas is still
moderate.
The full energy beam-particle suppression in
RITU is 10�12–10�15. Due to larger bending angle
and the focusing gradient in the new dipole, the
suppression is expected to be better than in RITU.
The suppression factor for transfer products in
RITU is estimated to be 10�3. In the new separatorthis is estimated to be around 10�6.
5. Conclusions
A new separator is under design at the Depart-
ment of Physics in the University of Jyv€aaskyl€aa. It isintended to allow a more flexible operation of theexisting gas-filled separator RITU and to provide
a better separation performance for symmetric or
nearly symmetric reactions.
The general parameters of the new separator are
known, but details are still to be decided. These
include the pole–face rotations of the dipole
magnet and its gap size, and the lengths and gap
sizes of the two quadrupoles.The performance of the new separator is in
general expected to be better when compared with
RITU. The separation between beam particles and
reaction products is always more efficient in the
new separator due to the larger bending angle of
the dipole magnet. The transmission depends on
the reaction: RITU is more efficient for asym-
metric reactions, and for symmetric reactions theefficiency is about the same for the two separators.
Acknowledgements
This work has been supported by the Academy
of Finland under the Finnish Centre of Excellence
Program 2002–2005 (Project No. 44875, Nuclearand Condensed Matter Physics at JYFL) and by
the Finnish Academy of Science and Letters.
Useful discussions with G. M€uunzenberg are
gratefully acknowledged.
Reference
[1] M. Leino, J. €AAyst€oo, T. Enqvist, P. Heikkinen, A. Jokinen,
M. Nurmia, A. Ostrowski, W.H. Trzaska, J. Uusitalo, K.
Eskola, P. Armbruster, V. Ninov, Nucl. Instr. and Meth. B
99 (1995) 653.
Fig. 2. Schematic layout of the new separator consisting of a
horizontally focusing dipole magnet and a quadrupole doublet.
Particle trajectories are shown for three different Bq-valuesstarting from three target positions for three angles. The scale in
the vertical direction in both figures is 0.3 m. The horizontal
scales are 0.5 and 1.0 m in the upper and lower figures, re-
spectively.
140 T. Enqvist et al. / Nucl. Instr. and Meth. in Phys. Res. B 204 (2003) 138–140
Figure 1.18: Schematic layout of a gas-filled separator consisting of a horizon-tally focusing dipole magnet (left side) and a quadrupole doublet (right side).Particle trajectories are shown for three different Bρ-values starting from threetarget positions for three angles. Adopted from [73].
tional DQQ configuration [70].
Besides the magnet arrangement, the chosen gas and its pressure are key characteristics
of a separator. In principle, there are two kinds of gases which are useful for operation,
hydrogen, helium, and a mixture of them. While the separation of transfer products is
better with hydrogen, higher field strengths are required in this situation [74]. So most

Introduction 47
separators, especially those which cannot provide such high fields, use helium instead,
which needs lower field strength for the operation.
TASCA for example can be used with both gases, but with hydrogen only to a lower
maximum rigidity compared with helium. Only the DGFRS can be operated with pure
hydrogen for all reaction products due to its very high maximum magnetic rigidity of
3.1 Tm. A third key feature of gas-filled separators is the isolation of the filling gas from
the beam line. The traditional approach, which is used in the BGS or the DGFRS is
the installation of an entrance window in front of the target from the beam line. The
disadvantage of such a window is the additional energy loss of the projectiles, causing
a wider energy distribution of the fusion products and hence less efficiency of the sep-
arator. A new development in this field is the application of windowless operation by
differential pumping, which has been applied first at RITU and is used nowadays also
at GARIS and TASCA. This concept consists of several pumps divided by collimators,
making a window unnecessary.
1.6 Chemistry of SHE
1.6.1 Introduction of chemical properties of SHE
Chemical properties and the chemical behavior of all elements can be classified, sys-
tematized, and compared using the periodic table, discovered by Dmitri Mendeleev and
independently by Lothar Meyer in 1869. The position of elements is defined by their
electronic configuration and hence by their proton number. Many unknown elements
have been found due to a missing element in that table and precise predictions about
their chemical properties and the chemical behavior could be made according to their
predicted position in the periodic table.
During the last decades, the validity of the periodic table has been tested by syn-
thesizing heavier and heavier transuranium elements. Each new element fitted quiet
well in its respective group and its chemical behavior followed the trend of its lighter
homologues. This is not self-evident, due to the fact that the chemical properties of the
heaviest elements can vary from their lighter homologues, because the electronic con-
figuration in the ground state can differ for elements within one group. The electronic
structure of SHE is influenced by relativistic effects, which are caused by the extremely
48 Introduction
high, relativistic velocities of the inner and also outer electrons due to the very high
nuclear charge, creating an extremely strong electric field. The relativistic velocities
cause an increase in the electron mass as
m =m0√
1− (vc)2
(1.35)
where m0 is the electron rest mass, v is the electron velocity and c is the speed of light.
One consequence is a decrease of the effective Bohr radius for s orbitals.
aB =~2
mc2(1.36)
This contraction of the s and p1/2 orbitals due to relativistic effects results in a better
shielding of the central nuclear charge, so that the outer orbitals (d and f) are less af-
fected by the nuclear charge and hence become more expanded and destabilized.
Therefore, for heaviest elements some deviations from trends of lighter homologues
within one group can be expected, due to very strong relativistic effects on the va-
lence electron shells. Thus, theoretical studies, based on relativistic quantum theory
and quantum-chemical methods become extremely important for predictions of exper-
imentally studied properties of heaviest elements. In combination with extrapolations
from the periodic table, they are very valuable for designing experiments dealing with
only a few single atoms.
As mentioned before, superheavy nuclei become less bound with increasing nuclear
charge due to the repulsive electrostatic force of the protons. Hence, the production cross
section and production rates drop rapidly with increasing nuclear charge. For element
108, hassium, for example, at maximum only a few atoms can be produced during
one week of experiment under optimal conditions. Chemical experiments can only be
performed with superheavy isotopes with half-lives of at least half a second or larger. If
the half-life is of the order of seconds, there are some fast chemical techniques, which
can be used. One of these is based on the principle of gas chromatographic separations
utilizing differences in the volatility. Also differences in KD for SHE, actinides, and
lighter transactinide elements are important for clean separations. E.g. aqueous phase
chemistry by solvent extraction or ion exchange separations can be applied.
Superheavy elements from 104, Rf to 108, Hs as well as 112, Cn and their chemical
behavior have been studied using these techniques. An overall review of these techniques
and experiments can be found in the book ”The Chemistry of Superheavy Elements”
edited by M. Schadel [53].

Introduction 49
Due to low production rates and short half-lives, only some basic properties can
be measured, like the absorption enthalpy of an atom or a compound on various chro-
matographic surfaces, or the distribution coefficient or a charge of a complex on an ion
exchange resin. Fortunately these properties give an answer to the question, if a new
element behaves similarly to its lighter homologues in the chromatographic separation
process or not.
1.6.2 Hs chemistry
Due to its electronic configuration, element 108, hassium, is predicted and was demon-
strated for the first time in[7] to belong to group 8 of the periodic table. It is a homologue
of (Fe), Ru, and Os. Ru and Os are the only elements known, which are able to form a
state with an oxidation number 8+, with the exception of Xe, which is known to form
a highly unstable and explosive tetroxide (XeO4). If Hs follows the trend of its lighter
homologues, it should form a tetroxide (HsO4). If furthermore HsO4 behaves similarly
to RuO4 and OsO4, its high volatility can be used for an effective separation of this
element from many unwanted non-volatile reaction products.
This separation mechanism was indeed used in several experiments on highly effi-
cient chemical separations of Hs. In 1985, experiments aimed at searching SF decaying
isotopes of element 108, produced in the heavy-ion induced complete fusion reaction40Ar + 235U (CN=275Ds), were performed at FLNR, Dubna [75]. In another experiment
using the complete fusion reaction 22Ne+ 249Cf (CN=271Hs) at a lab energy of 123 MeV,
an α or SF decaying 267Hs produced via the 4n evaporation channel was searched for,
which was believed to have a half-life of the order of 1s [75, 76]. In previous test experi-
ments with Os, OsO4 was efficiently absorbed on silicon detectors covered by a Pb layer.
However, the main experiment was not sensitive enough to detect Hs events.
Another setup called Online Separation and Condensation AppaRatus (OSCAR) was
installed at the 88-inch cyclotron in Berkeley in the year 1987 [77,78]. OSCAR was used
for searching α-decaying 272Hs, which was expected to be the EC daughter product of272Mt. The efficiency for the separation and condensation of osmium was 36 %, measured
in test experiments. Also in this main experiment, no Hs events could be detected and
an upper limit for the production cross section of 1 nb was established.
The first successful experiment on Hs chemistry was performed at the GSI Darmstadt
in the framework of a large international collaboration in 2001 [7] using the complete

50 Introduction
nuclear fusion reaction 26Mg + 248Cm at a beam energy of Elab = 145 MeV. A schematic
drawing of the experimental setup is shown in Figure 1.19.
Nuclear reaction products recoiling from the target were thermalized in a gas volume of
Figure 1.19: Schematic drawing of the experimental setup used in Hs chemistryexperiments, which was carried out by Dullmann et al. [7].
the IVO device [79] and flushed with a dry helium + oxygen mixture, which was used as
a carrier gas. The reaction products passed a quartz column filled with a quartz wool
plug, which was heated up to 600 ◦C and which served as a filter for aerosol particles.
This plug provided at the same time a surface to complete the oxidation reaction of Hs to
hassium tetroxide (HsO4). These molecules were further transported by the carrier gas
jet through a PFA capillary to a detection system. Due to its high volatility, HsO4 can
only be adsorbed by physical adsorption (physisorbtion), in which the forces involved
are intermolecular forces (Van-der-Waals forces). These are of the same kind as those
responsible for the imperfection of real gases and the condensation of vapors, and they do
not involve a significant change in the electronic orbital patterns of the species involved
[80]. Hence, for the adsorption of HsO4 from the gas phase, thermo chromatography
with a negative temperature gradient was used. The chromatographic column, the
Cryo OnLine Detector (COLD), also served as detection system for the identification of
decaying Hs atoms. COLD consisted of 36 pairs of silicon PIN-photodiodes, mounted at
a distance of 1.5 mm, appropriate for the detection of α-particles and fission fragments.
Always three diodes were connected as one detection unit. A temperature gradient from
-20 ◦C to -170 ◦C was established along the detector array. A total of 7 decay chains
Introduction 51
detected in this experiment were assigned to the decay of 269Hs or tentatively to that
of 270Hs [7,63]. The attribution of decay chains to 270Hs was shown to be incorrect
in later experiments [8]. However, a very important result of this experiment was the
first chemical identification of hassium. From the observed deposition temperature of
Hs, which was found to be around -45 ◦C its adsorption enthalpy was derived to be
-∆Ha(HsO4)= 46± 2 kJ/mol and hence confirmed expected chemical properties of Hs
as homologue of Ru and Os [81,82].
The next experiment aimed at the investigation of the chemical properties of Hs was
a chemistry experiment conducted by A. von Zweidorf et al. at the GSI in 2002 [83]. In
this experiment the same complete fusion reaction (26Mg + 248Cm) and the same beam
energy of Elab = 145 MeV as in the previous experiment [7] was used. Furthermore,
the setup used for the chemical separation of Hs was also similar. The only differences
were the application of a moisturized carrier gas and the addition of small amounts of152Gd to the Cm target, to produce short-living Os isotopes, for online monitoring of
the experiment. Also, the new detection apparatus CALLISTO (Continuously working
Arrangement for cLusterLess transport of In-SiTu produced volatile Oxides) was used.
The volatile Os and Hs tetroxides were transported via the gas jet to the detection
system, where they were deposited on a surface covered with a thin layer of NaOH due
to a neutralization reaction taking place. In analogy to OsO4, which forms with aqueous
NaOH Na2[OsO4(OH)2], an osmate with an oxidation number 8+, HsO4 presumably was
deposited as Na2[HsO4(OH)2], a hassate with an oxidation number 8+ [83]. A detection
system consisting of 16 silicon PIN-photodiodes was facing a layer of NaOH, providing
the detection of α particles and SF fragments. Overall, six decay chains were assigned to
the decay of Hs isotopes. However, due to the 2π detection geometry and the resulting
low detection efficiency, mostly incomplete decay chains were measured. Furthermore,
the energy of the α-particles was partially degraded in the NaOH layer, resulting in a
energy resolution of 80-130 keV (FWHM). Hence, an unambiguous assignment of the
observed decay chains was not possible and an unambiguous confirmation of the decay
properties of 270Hs was impossible.
Starting from 2003, the new group for chemistry of SHE at the Institute of Radio-
chemistry (TU Munich) began with the investigation of Hs isotopes near the expected
N=162 shell closure, which was predicted by theoretical calculations [6, 23, 84]. There-
fore, precise nuclear data on the decay properties of 270Hs were especially important.
Hence, the main goal of two experimental campaigns in 2004 and 2005 at the GSI in the
framework of a large international collaboration was to investigate the decay properties

52 Introduction
of 269,270Hs and their daughters, nuclear reaction studies and the search for new iso-
topes in the region of interest using the aforementioned COMPACT system. Again, the
complete nuclear fusion reaction 248Cm(26Mg, xn)274−xHs was chosen and investigated
at 5 different beam energies. Altogether, 26 genetically linked decay chains originating
from Hs nuclei have been observed. Based on 12 decay chains originating from 269Hs,
the decay properties of this Hs isotope and its daughters were refined. Furthermore,
the decay properties of 270Hs, as well as 271Hs were measured for the first time [51,52].
The obtained decay properties for 270Hs and 266Sg contradict those measured in previous
experiments and an alternative explanation of the previously detected decay properties
was presented. Most likely the nuclide 270Hs and its daughter 266Sg were not measured
in former experiments and the decay chains attributed to these nuclides originated from
isomeric states from 269Hs and 265Sg, respectively [66]. Again, the chemical results of [7]
were confirmed.
1.7 Summary and purpose
SHE only exists due to nuclear shell effects enhancing the nuclear stability. In the
region of SHE, two centers of stabilization against spontaneous fission exist, around
the predicted spherical doubly magic nucleus 298114 and around the deformed doubly
magic nucleus 270Hs. Enhanced stability of the latter one has been confirmed in recent
experiments. From the measured Eα values of Hs isotopes near N=162 and deduced Qα
systematics, half-lives could be calculated of the order of several seconds for 269−271Hs.
As described above, the production cross section for the formation of SHE formed
in heavy-ion induced nuclear fusion reactions can be described in three stages. First
of all, the approaching phase of projectile and target nucleus and the penetration or
the overcoming of the Coulomb barrier by the projectile takes place, depending on the
beam energy. In the second stage, projectile and target nuclei get into contact with each
other and a nucleon flux gets established forming in the end a highly excited compound
nucleus (CN) or being interrupted and a reseparation of projectile-like and target-like
nucleus takes place. If the CN is formed, it is cooled down by neutron- and γ-emission
or it is lost by entering the fission channel in the third stage. To investigate the reaction
mechanism, it is necessary to fix as many reaction parameters as possible. Since the
capture (first stage) and the de-excitation (third stage) of the EVR production cross
section are well understood, these factors should be fixed in order to investigate the
Introduction 53
fusion probability, which is not satisfyingly understood. Hence the impact of this factor
and the parameters influencing it, like the reaction asymmetry or the reaction Q-value
should be examined in this work. In a recent publication, the influence of these two
parameters on the fusion probability for cold fusion reactions has been studied and
qualitatively as well as quantitatively evaluated [41].
The aim of this thesis is to study the Q-value influence on the production of SHE
and especially on the synthesis of 269−271Hs. To do so, there are four different reactions
leading to the same CN (274Hs∗):
1. 248Cm(26Mg, xn)274−xHs
2. 244Pu(30Si, xn)274−xHs
3. 238U(36S, xn)274−xHs
4. 226Ra(48Ca, xn)274−xHs
These differ in their (B-Q)-value and hence in their Q-value as well as in their reaction
asymmetry.
Recently, the formation of deformed doubly-magic 270Hs in the 4n evaporation channel
in the complete fusion reactions 248Cm(26Mg, 4n)270Hs, 244Pu(30Si, 4n)270Hs, 238U(36S,
4n)270Hs, and 226Ra(48Ca, 4n)270Hs has been studied theoretically in more detail using
a two-parameter Smoluchowski equation [43]. Simple entrance channel arguments make
CN formation appear favorable for systems with larger mass asymmetry [85]. However,
due to a lower reaction Q value, the reactions 238U(36S, 4n)270Hs (σtheo = 24 pb) and226Ra(48Ca, 4n)270Hs (σtheo = 30 pb) are predicted to have higher cross sections compared
to the reactions 248Cm(26Mg, 4n)270Hs (σtheo = 12 pb) and 244Pu(30Si, 4n)270Hs (σtheo =
8 pb) [43]. A maximum cross section for the 226Ra(48Ca, 4n)270Hs reaction of about 30
pb was also predicted in other calculations, using a different method, [41] which has been
shown to reproduce experimental cross sections for various 48Ca-based fusion reactions
with actinide targets.
The main aim of this work was to investigate the most promising reactions 238U(36S,
xn)274−xHs and 226Ra(48Ca, xn)274−xHs and to compare them with the already measured
reaction 248Cm(26Mg, xn)274−xHs to verify or falsify the theoretical reaction studies, men-
tioned above. Furthermore, the main parameters, which are the aforementioned asym-
metry and the (B-Q)-value, affecting the fusion probability of the EVR cross section
most, should be examined and evaluated.

54 Introduction
As shown by Dullmann et al. [7], a chemical separation of Hs is very efficient. Hence,
chemical separation and detection systems can be applied to produce these isotopes,
especially 270Hs, very efficiently in complete nuclear fusion reactions. This technique
was applied in the reaction 238U(36S, 4n)270Hs, which was investigated in a two week
experiment performed at the GSI in 2008 using the chemical separation and detection
system COMPACT. The reaction 226Ra(48Ca, 4n)270Hs was examined in two experimen-
tal campaigns in 2008 at the Dubna Gas-filled Recoil Separator (DGFRS) at FLNR in
Dubna by the DGFRS-group in collaboration with the Institut fur Radiochemie (TU
Munchen).

Introduction 55

56

Chapter 2
Experimental setup
2.1 Overview
Nuclear fusion reactions at the end of stability in the transactinide region are character-
ized by very low fusion-evaporation cross sections in the order of pb or even fb compared
with other nuclear reactions like nuclear transfer reactions. These reactions deal with
cross sections in the order of µb or even mb resulting in a very high yield of background
in superheavy element experiments. Due to this huge amount of unwanted reaction
products, efficient online or offline separation methods, depending on the half-lives of
the fusion products, have to be applied in order to detect the produced superheavy
evaporation residues.
In the last five decades several approaches have been used to make the separation
more efficient. One technique is to filter the produced nuclei according to their velocity
by a Wien filter, which has been realized for example with the ”SHIP” separator at the
GSI or the Vassilissa separator at the FLNR in Dubna. These separators use electric
and magnetic fields to let only nuclei with a certain velocity pass to the focal-plane.
Another approach is the gas-filled separator, which is realized for example with the
Berkeley Gas-filled Separator (BGS)[86], the Dubna Gas-filled Recoil Separator (DGFRS)
at the FLNR in Dubna [87] or TASCA [72] installed at the GSI. These devices consists
of a dipole magnet and in most cases followed by a set of two quadropole magnets for
focusing, which all are filled with a light gas with low pressure. The reaction products
are deflected inside of the dipole magnet according to their A/q ratio in the energy
region we are using in our experiments.
57
58 Experimental setup
Electromagnetic separators are not element specific and hence suited for all SHE, as
long as their half-life is longer than the time-of-flight inside of the separator, which is in
the order of µs. This is the case for all known SHE (Z<119). A detailed introduction
of kinematic separators for superheavy element experiments can be found in Section 1.5
and especially the DGFRS is presented in Section 2.3.
A completely different approach is the separation due to the chemical behavior of
the fusion products. This technique has been applied for a separation of new elements
in transuranium synthesis experiments produced in neutron capture reactions and has
been used during the last decades in experiments on the chemistry of SHE. Being abso-
lutely element specific is a unique key feature and the main advantage of chemistry as
separation technique. In principle, chemistry can be applied for any superheavy element,
if the isotopes under study are long-lived enough for a selected chemistry approach. But
along with the isolation and identification of SHE nuclides, chemical studies provide
additional information about chemical properties of new chemical elements.
In our case, we applied a gas phase thermo chromatography method, utilizing the
chemical behavior of hassium of forming a very volatile tetroxide, to separate it from
most all other reaction products with a very high efficiency. The experimental setup is
based on the same concept as described in [7, 63]. This chemical method can be used in
the case of hassium, because its half-life of about 10 seconds is much longer than the time
needed for chemical reaction, separation and transport, which is altogether about two
seconds. Hence it is possible to separate hassium fast and effectively by chemical means
from target like elements or those produced in nuclear transfer reactions. A more detailed
discussion and description of SHE gas phase thermo chromatography experiments for
hassium can be found in Section 2.2
2.2 Chemistry experiments
2.2.1 Overview
The position of an element in the periodic table and, hence, its chemical properties,
are defined by the atomic number of an element. Thus, they are dependent on the
number of electrons and electronic structure caused by the nuclear charge, the proton
number. Therefore, different atoms can be separated by chemical processes due to
differences of their valence electron structure depending on the proton number. In the
Experimental setup 59
history of the synthesis of transuranium elements, the separation from target atoms or
unwanted byproducts was performed using chemical methods. These methods can be
very selective for one selected element and are able to separate the wanted SHEs from
unwanted reaction products.
The number of α-active transactinide isotopes with half-lives suitable for chemical
studies is quite high. However, the spectrometric detectors for measuring α-particles or
fission fragments are sensitive to the high neutron flux nearby the target. In addition,
they do not withstand elevated temperatures and active chemical reagents. Hence,
the reaction products must be transported several meters away from the beam stop.
Thus, a thermalization of the reaction products in the gas volume of a recoil chamber
combined with a following transport with a gas jet through a capillary directly to a gas
chromatographic system is necessary [88].
All chemical experiments with transactinides can be separated in two groups, exper-
iments in the gas phase and experiments in the liquid phase. An enhanced separation
efficiency and selectivity from unwanted byproducts can be achieved in liquid phase ex-
periments. The main disadvantages of this technique are a longer separation time and
a lower detection efficiency.
Gas phase separation procedures are fast, efficient and can be performed continuously,
resulting in a high overall yield. Finally, nearly weightless samples can be prepared on
thin foils or directly on the detector surface, which provides α- and SF-spectroscopy of
the separated products with a good energy resolution and in a high, nearly 4π detection
geometry.
Despite the fact that only few inorganic compounds of the transition elements exist,
that are appreciably volatile below temperatures of about 1000 ◦C, which is a experi-
mentally manageable temperature, gas-phase chemical separations played and still play
an important role in chemical investigations of transactinide elements. A very detailed
introduction to this field can be found in [27,88].
Gas phase chemistry experiments are based on the principle of gas-solid chromatog-
raphy. A separation of volatile species occurs due to the repeated interaction of a volatile
compound or atom, transported by a gas jet through the chromatographic column on
the one side and the column surface as the stationary phase on the other side. For exper-
iments investigating the chemical properties of transactinide compounds, two different
types of chromatographic separation have been developed. Thermo chromatography
(TC) and isothermal chromatography (IC). Using TC [89], which has been applied in

60 Experimental setup
this work, a carrier gas is flowing through a chromatographic column, to which a neg-
ative temperature gradient has been applied. Species, that are volatile at the starting
point (temperature at the entrance of the column) are transported downstream of the
column by the carrier gas flow. The decreasing temperature in the column results in an
exponentially increasing time the species spend in the adsorbed state. Different species
form distinct deposition peaks at a temperature Ta corresponding to the maximum of
the peak, depending on their adsorption enthalpy ∆Ha on the column surface and are
thus separated from each other.
The experimental setup used for the reaction 36S + 238U, based on TC, is similar to
that described in [7, 63]. A schematic drawing of this experimental setup is displayed in
Figure 2.1.
Figure 2.1: Schematic drawing of the experimental setup: (1) heavy ion beam,(2) heated recoil chamber with target, (3) beam stop, (4) oven, (5) quartz fil-ter, (6) PTFA capillary for gas transport to detector, (7) COMPACT detectionsystem with 2× 32 PIPS detectors, (8) liquid nitrogen cooling, (9) gas mixtureand flow control, (10) membrane pump, (11) NYADTM dew point measurementdevice, (12) gas inlet into the recoil chamber. Adapted from [8].
A beam of 36S-ions was impinged on a rotating 238U target. Nuclear fusion products,
that recoiled out of the target were thermalized in a He/O2 gas mixture inside of the
heated recoil chamber (RC). Recoiling products were partially oxidized already in the
partial oxygen atmosphere inside of the RC. A gas flow flushed the RC and transported
volatile species to a quartz wool plug arranged inside an oven. This plug served as
a filter for aerosol particles and provided a surface to finalize the oxidation reaction.
Hence, all non-volatile species were effectively separated from volatile species like HsO4,
OsO4, Rn, and At, which passed through the filter and were transported through a
PTFE (PolyTetraFlouroEthylene) capillary to the detection system COMPACT (Cryo
On-line Multidetector for Physics and Chemistry of Transactinides). COMPACT is a

Experimental setup 61
system which provides the separation and detection of at room temperature volatile
species by measuring their nuclear decay properties. The separation inside the detector
is based on the principle of TC [90]. The carrier gas was circulated in a loop. Flow and
pressure of the gas were automated and controlled remotely. The moisture of the gas
was continuously measured by a NYADTM dew point measuring device. To keep the
moisture as low as possible to avoid water condensation inside of COMPACT, the gas
mixture was dried in drying cartridges as well as in a moisture trap. A more detailed
discussion of COMPACT can be found in Section 2.2.4.
2.2.2 Preparation of 36SO2
36S (natural abundance 0.01 %) is a very expensive material. About 2 g of 36S was
provided by the GSI in elemental form. It was oxidized to 36SO2 gas and condensed
inside of several flasks in a laboratory of the Institut fur Radiochemie (TU Munchen) in
Garching, Germany. This oxidation was necessary, since 36S is a very expensive material
and had to be utilized in a safe and efficient way by the ion source.
The sulfur material (a powder in elementary form with 80% enrichment) was melted
in a quartz glass boat at a temperature of about 160 ◦C and afterwards placed inside
of a glass ”T” part with KF flanges. Through the top flange a glow filament was
implemented, and the other flanges were used as gas inlet and outlet. Three flasks made
from stainless steel were connected in series with surrounding cooling mantles made
from copper tubes. The flasks were covered inside with PTFE and each of them had two
valves at both sides. The whole vacuum tight system was first pumped down to 10−3
mbar and then flushed with helium. The flasks were cooled down to -140 ◦C by liquid
nitrogen vapor flowing through the copper cooling tubes. Afterwards the helium flow
was switched to an oxygen gas flow of ≈50 ml/min. The oxygen gas was purified from
water content by molecular sieves. The glow filament was used to ignite a self supporting
combustion of the sulfur material. The complete oxidation was finished after 10 min (see
Figure 2.2). At the exit from the third flask, the outgoing gas was guided through a
glass flask filled with a NaOH solution. This was used as a trap for SO2. No sulfur
has been found inside the trap. The content of condensed 36SO2 has been measured
in all three flasks after the oxidation process has been completed. More than 80% of
produced 36SO2 have been found in the first flask, while 16% have been condensed in
the second flask and 2.3% in the last one, respectively. The total conversion yield was
99%. Afterwards the flasks were heated up to equilibrate the gas pressure. Then each
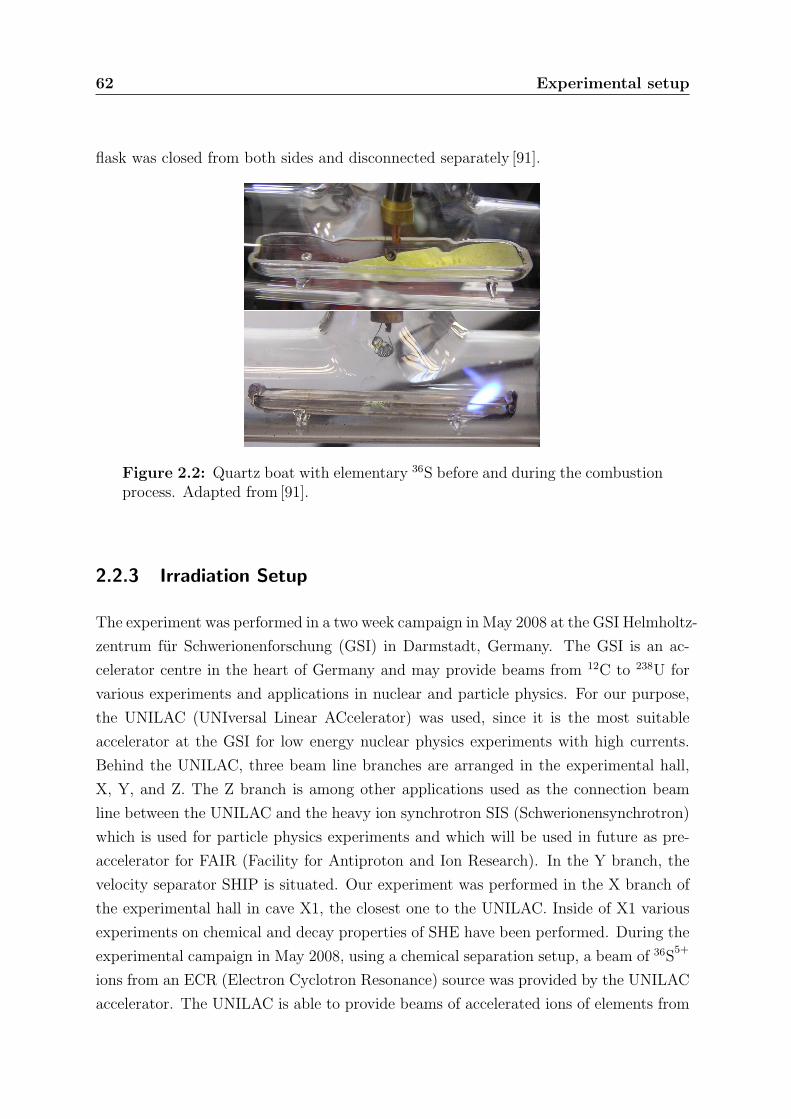
62 Experimental setup
flask was closed from both sides and disconnected separately [91].
gramme for a 30Si beam tests were performed at the ECRinjector test setup (EIS) using natural SiO to produce a28Si5+ beam by evaporation from the oven. As the useof ZnO has become a standard procedure for producing Znion beams SiO appeared to be the only choice, because thevapor pressure of elementary Si and SiO2 are by far to low.After the successful test a beam of 30Si6+ could be pro-vided from the ECRIS to the accelerator. Highly enriched30SiO has been used to provide a beam of high stability andintensity for nearly 4 weeks.
PREPARATION OF SAMPLE MATERIALS
Some of the required enriched materials can be procuredin suitable form while others have to be transformed priorto be used with the ECRIS. Metallic 48Ca is obtainedas 48CaCO3 and is transformed into metallic 48Ca bychemical reduction [5].
A 32S5+–beam has been produced from natural SO2
gas at GSI several years ago while at GANIL enriched(63 %) 36SF6 has been used for ion beam production [6].At GSI SF6 was not chosen as sample material because ofthe high number of F–atoms in the molecule and becauseof the high chemical reactivity of F. Following the goodexperiences with CO2 gas and with SO2 gas for producingC ion beams and S ion beams, respectively, SO2 was alsochosen for the rare isotopes.
As the isotope material could only be obtained aselementary material it was necessary to do a conversionto SO2 gas. A special procedure could be developed toconvert at first 2500 mg of highly enriched elementary 34Sand then to convert 1950 mg of highly enriched elementary36S, respectively.
Figure 4: Quartz boat with elementary 36S before and dur-ing the combustion process
The sulfur material (powder in elementary form, ≈ 80%enrichment) was melted in a boat of quartz glass at a tem-perature of 160 ◦C and then placed inside a glass ”T” partwith KF flanges DN 25 as vacuum recipient. Through thetop flange a sparking plug was introduced, and the otherflanges were used as gas inlet and outlet. Three flasks madefrom stainless steel were connected in series with coolingmantles made from copper tubes. The flasks were coveredinside with PTFE; each of them had two valves at bothsides. The whole vacuum–tight system was first pumped to10−3 mbar and then flushed with helium. The flasks werecooled down to – 140◦C by liquid nitrogen vapor flowingthrough the copper cooling tubes. Then helium flow wasswitched to oxygen gas flow of ≈ 50 ml/min. The oxygengas was purified from water content by molecular sieves.The sparking plug was used to ignite a self supporting com-bustion of the sulfur material. The complete oxidation wasfinished after ≈ 10 min (see Fig. 4). At the exit from thethird flask, the outgoing gas was bubbled through a SO2
trap - a glass flask filled with NaOH solution. No sul-fur has been found in the trap. The content of condensed36SO2 has been measured in all three flasks after the oxida-tion process. More than 80% of produced 36SO2 have beenfound in the first flask, while 16% have been condensed inthe second flask and 2–3% in the last one, respectively. Thetotal conversion yield was ≈ 99%. Afterwards the flaskswere heated up to equilibrate the gas pressure. Then eachflask was closed from both sides and disconnected sepa-rately.
Figure 5: Charge state spectrum of 36S + O; 100 eµA fullscale
A test run with 34SO2 showed that the sample material iswell suited for ECRIS operation. The long time stability ofabout ±3% with only a few deviations was demonstratedin a continuous run of 8 days. 36SO2 was then used for anaccelerator beam time delivering 36S5+ under same condi-tions. As Fig. 5 shows 60 eµA of 36S5+ could be obtained,which is the required charge state for acceleration. Theaverage material consumption could be determined to be420 µg of 36S per hour.
MOPO-14 Proceedings of ECRIS08, Chicago, IL USA
ECRIS Plasma Physics and Techniques
100
Figure 2.2: Quartz boat with elementary 36S before and during the combustionprocess. Adapted from [91].
2.2.3 Irradiation Setup
The experiment was performed in a two week campaign in May 2008 at the GSI Helmholtz-
zentrum fur Schwerionenforschung (GSI) in Darmstadt, Germany. The GSI is an ac-
celerator centre in the heart of Germany and may provide beams from 12C to 238U for
various experiments and applications in nuclear and particle physics. For our purpose,
the UNILAC (UNIversal Linear ACcelerator) was used, since it is the most suitable
accelerator at the GSI for low energy nuclear physics experiments with high currents.
Behind the UNILAC, three beam line branches are arranged in the experimental hall,
X, Y, and Z. The Z branch is among other applications used as the connection beam
line between the UNILAC and the heavy ion synchrotron SIS (Schwerionensynchrotron)
which is used for particle physics experiments and which will be used in future as pre-
accelerator for FAIR (Facility for Antiproton and Ion Research). In the Y branch, the
velocity separator SHIP is situated. Our experiment was performed in the X branch of
the experimental hall in cave X1, the closest one to the UNILAC. Inside of X1 various
experiments on chemical and decay properties of SHE have been performed. During the
experimental campaign in May 2008, using a chemical separation setup, a beam of 36S5+
ions from an ECR (Electron Cyclotron Resonance) source was provided by the UNILAC
accelerator. The UNILAC is able to provide beams of accelerated ions of elements from

Experimental setup 63
carbon to uranium with energies up to 20 MeV/u. The beam is pulsed with a 25 % duty
cycle and a pulse length of about 5 ms.
The ECR source was chosen, because of its very low consumption compared with
other types of sources. Inside of the ECR the 36SO2 was converted to a plasma state
and the 36S5+
ions were guided out of the source and injected into the UNILAC. With
its high frequency resonators and the Alvarez structures, 36S was accelerated up to Elab
= 256.4 MeV (corresponding to 7.13 MeV/u [92]), which was used during the whole
experiment, and impinged on a rotating 238U target. Typical beam intensities were 350
particle nA (2.2 · 1012s−1). The beam intensity was measured with a transformator in
front of the target and with a beam stop at the back wall of the RC. By exchanging
the RC by a faraday cup (under vacuum) followed by an irradiation of the target, the
measured transformator currents could be calibrated for a precise measurement of the
beam integral. A picture of the mounted faraday cup can be found in Figure 2.3. These
faraday cup measurements were performed several times during the experiment.
Figure 2.3: Picture of the faraday cup mounted periodically for exact beamcurrent measurements.
In combination with two sets of targets with different thicknesses, the complete nu-
clear fusion reaction 36S+ 238U was investigated at two beam energies inside of the
targets. In the first target set, the beam energy was Elab = (179.5± 4.5) MeV, cor-
responding to an excitation energy of E* = (39± 4) MeV. According to HIVAP [44]
calculations, this value is close to the maximum of the 4n channel (see Figure 1.12).
Also, the predicted maximum of the calculated 4n excitation function from [43] is very
close to that energy (see Figure 1.9). Inside of the second target the beam energy was
Elab = (193.5± 3.5) MeV, which corresponds to an excitation energy of E* = (51± 3)

64 Experimental setup
MeV. This value is close to the maximum of the 5n channel (see Figure 1.12). Both
target sets are composed of an about 20.2 µm Be vacuum window and a 6 mm He/O2
gas volume, followed by the Be backing.
The target material of the first target set (TR1) was deposited on a 12.6 µm Be
backing (corresponding to 2.33 mg/cm2 Be) and consisted of three arc-shaped 238U3O8
targets of 1.8 mg/cm2, 1.5 mg/cm2, and 1.6 mg/cm2. These targets were produced by
molecular plating. A picture presenting the target before and after the irradiation can
be found in Figure 2.4.
Figure 2.4: Photography of the first ARTESIA target wheel with 238U3O8
targets used in the TUM experiment on Hs chemistry. Photo courtesy of C. E.Dullmann.
This target wheel had been irradiated with 4.2 · 1018 48Ca ions prior to our experiment
[93]. One of the segments contained 20 µg/cm2 of natNd for the simultaneous production
of α-decaying Os isotopes, a chemical homologue of Hs, for online monitoring of the
chemical yield.
The target material of the second target set (TN22) was deposited on a 8.2 µm thick
Be backing and consisted of three targets comprising 1.0 mg/cm2 of metallic 238U each,
which has been deposited by sputtering. Pictures of the target before and after the
irradiation can be found in Figure 2.5.
Due to the oxygen-containing atmosphere, the targets are expected to start oxidizing

Experimental setup 65
Figure 2.5: Photography of the 2nd ARTESIA target wheel with metallic 238Utargets used in the TUM experiment on Hs chemistry. It is shown before (left)and after (right) the irradiation with 36S ions. Photo courtesy of C. E. Dullmann.
during the very first moments of beam irradiation.
Due to the energy loss of the beam in the vacuum window and the target backing a
power of 23 W (first target set) respectively 20 W (second target set) was induced by
the beam at typical beam intensities during the bombardment. An effective cooling was
necessary to prevent damage to the target and the windows due to overheating. Indeed,
the target and window resistance against heat and radiation damages is the limiting
factor for not increasing the beam intensities even further. In our experiment a rotating
target and vacuum window wheel, ARTESIA, was used. Such a technically challenging
irradiation setup was constructed and put into operation by M. Schadel et al. [94].
Both target wheels were rotating with 2000 rpm, in synchronization with the beam
pulse. The main advantage of such rotating targets is the more effective cooling com-
pared with a stationary target. This is caused due to the spreading of the beam over a
larger target area in the case of the rotating target. The detailed composition of each
target and segment can be found in Table 2.1.
Both targets were measured after the experiment by α- and γ-measurements as well as
by radiography to determine the 238U thickness. These measurements where performed
at the Institut fur Kernchemie of the university of Mainz by Jorg Runke and Dr. Klaus
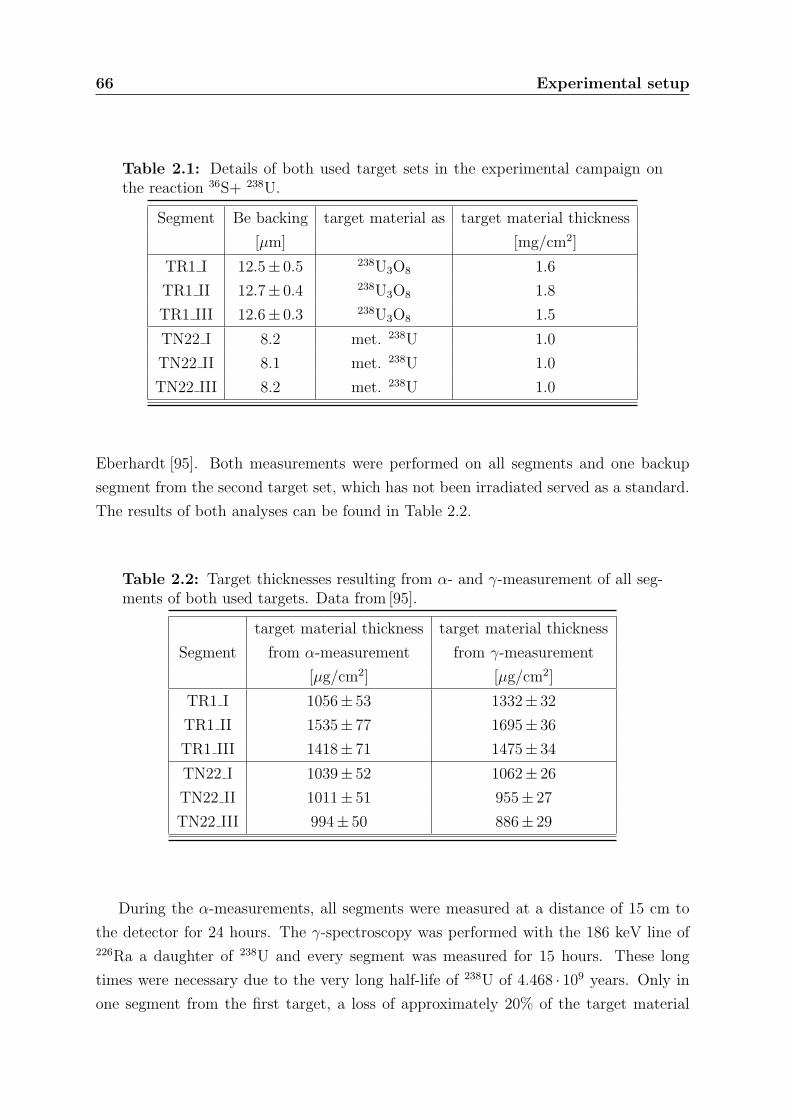
66 Experimental setup
Table 2.1: Details of both used target sets in the experimental campaign onthe reaction 36S+ 238U.
Segment Be backing target material as target material thickness
[µm] [mg/cm2]
TR1 I 12.5± 0.5 238U3O8 1.6
TR1 II 12.7± 0.4 238U3O8 1.8
TR1 III 12.6± 0.3 238U3O8 1.5
TN22 I 8.2 met. 238U 1.0
TN22 II 8.1 met. 238U 1.0
TN22 III 8.2 met. 238U 1.0
Eberhardt [95]. Both measurements were performed on all segments and one backup
segment from the second target set, which has not been irradiated served as a standard.
The results of both analyses can be found in Table 2.2.
Table 2.2: Target thicknesses resulting from α- and γ-measurement of all seg-ments of both used targets. Data from [95].
target material thickness target material thickness
Segment from α-measurement from γ-measurement
[µg/cm2] [µg/cm2]
TR1 I 1056± 53 1332± 32
TR1 II 1535± 77 1695± 36
TR1 III 1418± 71 1475± 34
TN22 I 1039± 52 1062± 26
TN22 II 1011± 51 955± 27
TN22 III 994± 50 886± 29
During the α-measurements, all segments were measured at a distance of 15 cm to
the detector for 24 hours. The γ-spectroscopy was performed with the 186 keV line of226Ra a daughter of 238U and every segment was measured for 15 hours. These long
times were necessary due to the very long half-life of 238U of 4.468 · 109 years. Only in
one segment from the first target, a loss of approximately 20% of the target material
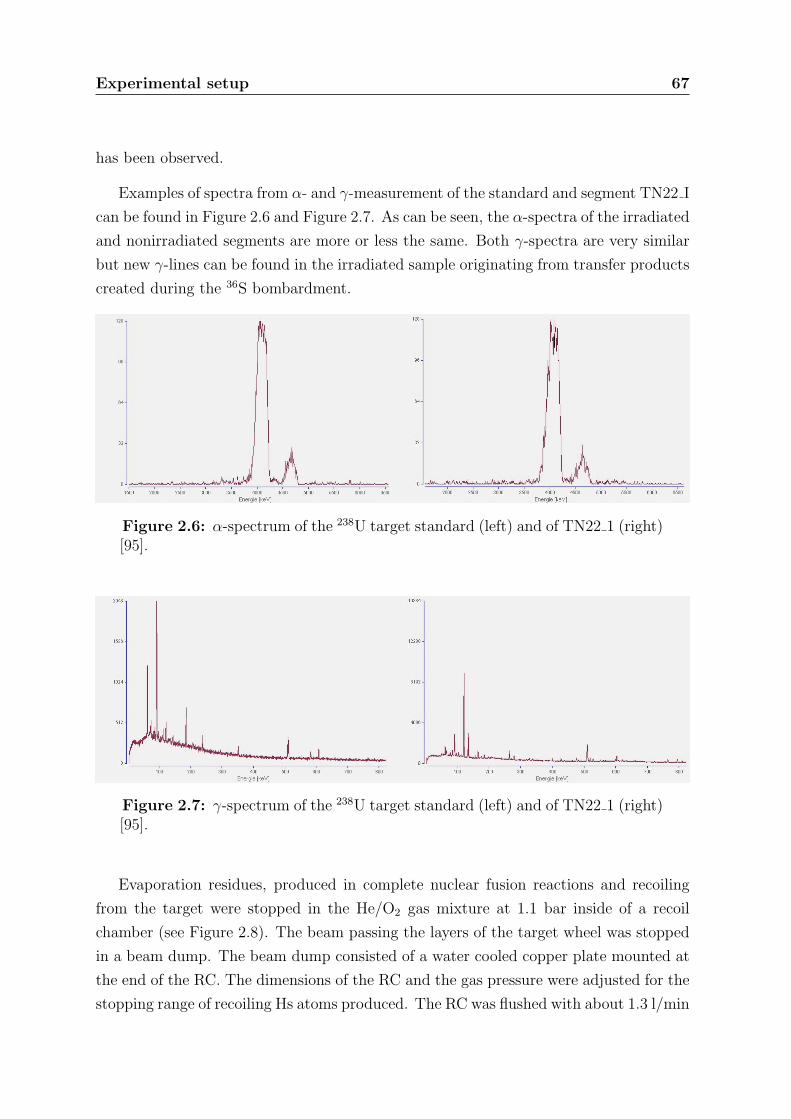
Experimental setup 67
has been observed.
Examples of spectra from α- and γ-measurement of the standard and segment TN22 I
can be found in Figure 2.6 and Figure 2.7. As can be seen, the α-spectra of the irradiated
and nonirradiated segments are more or less the same. Both γ-spectra are very similar
but new γ-lines can be found in the irradiated sample originating from transfer products
created during the 36S bombardment.
Figure 2.6: α-spectrum of the 238U target standard (left) and of TN22 1 (right)[95].
Figure 2.7: γ-spectrum of the 238U target standard (left) and of TN22 1 (right)[95].
Evaporation residues, produced in complete nuclear fusion reactions and recoiling
from the target were stopped in the He/O2 gas mixture at 1.1 bar inside of a recoil
chamber (see Figure 2.8). The beam passing the layers of the target wheel was stopped
in a beam dump. The beam dump consisted of a water cooled copper plate mounted at
the end of the RC. The dimensions of the RC and the gas pressure were adjusted for the
stopping range of recoiling Hs atoms produced. The RC was flushed with about 1.3 l/min

68 Experimental setup
He/O2 gas mixture. The oxidation reaction of Hs to HsO4 was expedited by heating
the RC via an external oven up to 350 ◦C. Volatile products or compounds of products,
like HsO4, OsO4, Rn, or At, were transported by the gas jet to the quartz wool filter,
which was heated by two external ovens to about 550 ◦C. At this filter, the oxidation
process was completed and non-volatile products were caught. The retention time for
volatile species was negligible in comparison with the transport time to the detector. The
separation factor for separation of volatile species from nonvolatile species was > 106 [8].
Figure 2.8: Schematic cross section drawing of the recoil chamber. The ovenattached to the gas outlet contains the quartz wool filter. Adapted from [27].
Because of the high radiation dose close to the target during an irradiation, the
detection setup had to be shielded. This was achieved by placing it behind a two meter
thick concrete wall. The length of the transport line from the RC to the detections
system was up to eight meters, corresponding to transport times of about two seconds.
2.2.4 COMPACT
The detection system COMPACT (Cryo Online Multidetector for Physics And Chem-
istry of Transactinides) was constructed particularly for chemical experiments with Hs,
as well as with elements 112 and 114. Its commissioning was accomplished in the frame
of [8]. COMPACT was constructed as a cryo thermatography detector [79,90] for the
separation and detection of volatile species or volatile compounds of α-decaying super-

Experimental setup 69
heavy elements. COMPACT , like CTS (Cryo Thermo chromatographic Separator) and
COLD (Cryo On-Line Detector) is designed on the one hand as a TC column [96] for
separation of volatile species according to their volatility and on the other hand as a
detector with 4π detection geometry for the efficient detection of adsorbed molecules
and atoms. Along the channel (column), formed by a series of planar silicon diodes, a
longitudinal negative temperature gradient is established. CTS, the first TC detector,
was constructed by U. Kirbach et al. [90] at the Lawrence Berkeley National Laboratory.
In the first Hs experiment [7] the improved COLD [79] was used, which had a geometri-
cal efficiency for detecting α-particles emitted by a species adsorbed inside the detector
array of 77%. In that experiment the principle of thermo chromatographic separation
and detection has been proven by observing the nuclide 269Hs and its decay daughters
after chemical isolation.
COMPACT is a more improved TC separation and detection device, with a aforemen-
tioned geometrical efficiency of about 4π. Silicon diodes for the detection of α-particles
and SF fragments are glued on the inner side of the thermo chromatographic channel
to reach a maximal possible geometrical efficiency. A carrier gas is flowing through the
TC chromatography column. Volatile elements or compounds are transported through
the column downstream by the carrier gas flow. Due to the decreasing temperature in
the column, the time the species spend in the adsorbed state increases exponentially.
Different species are separated from each other by forming distinct deposition peaks,
depending on their adsorption enthalpy (∆H0a) on the column surface.
During this experimental campaign, two similar COMPACT detectors have been
used. Due to water adsorption inside of COMPACT the formed ice layer negatively
affected the energy resolution of the silicon detectors. Therefore, a heating and drying
procedure has to be applied. To provide a continuous measurement during the experi-
ment, two COMPACT units were operated alternately. The TC column consisted of two
arrays of 32 passivated Implanted Planar Silicon (PIPS) detectors, which were facing
each other at a distance of 0.5 mm, embedded in a two-part InvarTM enclosure. The two
panels were joined together and sealed with 1 mm In-wire, forming a vacuum tight gas
channel. The gas carrying volatile species flowed through the 0.5 mm wide gap formed
between the panels. Schematic drawings of the arrangement of the PIPS detectors in
the Invar panelTM are shown in Figure 2.9, Figure 2.10, and Figure 2.11.
Electrical feedthrough contacts were welded into the Invar panels and sealed with
epoxy. The PIPS diodes were designed and manufactured at the Institute of Electron
Technology, Warsaw. The diodes used in this experiment were an enhanced version of

70 Experimental setup
Figure 2.9: A drawing of a bottom detector panel with gas inlet/outlet. Pictureadopted from [27].
9,7 9,79,9 9,9
0,
25
0.2
5
0.1 0.
1
0.1
Figure 2.10: New detector chip 10 x 40 mm2 with 4 single photodiodes. Pictureadopted from [27].
those used in former Hs chemistry experiments[8] characterized by an increased detection
efficiency. A photograph of one Invar panel with glued-in PIPS detectors can be found
in Figure 2.12.
They were 300 µm thick epitaxial silicon PIN diodes with a 120 µm thick active
layer, sensitive for α-particles and fission fragments. The active area of a PIPS diode

Experimental setup 71
Al or Au
Al(Au/Sb)
10 mm
300 µm
n+
p+
p+
p+
�
SiO2
Figure 2.11: Schematic drawing of a PIN photodiode made at ITE Warsaw.Picture adopted from [27].
Figure 2.12: Photograph of one Invar panel with glued-in PIPS detectors.Picture adopted from [27].
was 9.7× 9.8 mm2. Four diodes were suited on one Si chip at a distance of 0.1 mm to
minimize the inactive surface. The surface of the diodes can be covered with a thin layer
of various materials depending on the chemical properties of the element or compound
to be investigated. The nearly 4π detection geometry yielded a very high detection
efficiency, necessary for the investigation of SHE. The probability for detecting an α-
particle emitted from a species deposited anywhere in the detector channel, including
non-active surface of diodes and channel sides, was 86% and the probability for detecting

72 Experimental setup
at least one fission fragment of such a species was 94%. The analysis of the detection
efficiency is presented in Chapter 3. The detectors were calibrated off-line with 219Rn
and its α-decaying products emanating from an 227Ac source. The energy resolution was
better than 50 keV (FWHM) under experimental conditions.
The negative temperature gradient from +20 to -125 ◦C, applied along the TC col-
umn was achieved by cooling the exit end of the column with liquid nitrogen. The
temperature along the detector channel was measured by four thermoelements, the first
thermoelement was glued near the first PIPS diode, the second near the 11th, the third
near the 21st and the fourth thermoelement near the 32nd PIPS diode. A typical tem-
perature measurement with a fitted gradient can be found in Figure 2.13.
0 5 10 15 20 25 30 35-140
-120
-100
-80
-60
-40
-20
0
20
-140
-120
-100
-80
-60
-40
-20
0
20
Det
. Tem
pera
ture
[°C
]
Det.Length [cm]
Figure 2.13: Measured COMPACT temperatures (black boxes) and fitted tem-perature gradient (red line).
The gradient is not linear, due to the limited thermal conductivity of INVARTM,
hence it is steeper in the low temperature range. A dew point of about -70 ◦C was
achieved under experimental conditions, minimizing water adsorption on the inner de-
tector surface. This was done by drying the gas in a condensation cold-trap and by
chemical means using a drying cartridge filled with SicapentTM. A thin ice layer was
formed during the experiment on surfaces with temperatures below the dew point. The
ice layer was negatively affecting the energy resolution in the cold part of the detector
channel mainly for detector pairs 26 to 32, which are kept at temperatures of -70 ◦C
to -125 ◦C. Because HsO4 molecules were adsorbed at higher temperature, formation of

Experimental setup 73
ice did not degrade the detector resolution for Hs decays. Once a day the gas loop was
switched from the used one to the newly dried and conditioned detector. The former
detector was heated up to room temperature, pumped down on one side by a vacuum
pump while flushed from the other side with helium gas to remove the ice or water layer
from the detector channel and to prepare it for the next detector switching.
The signals from the PIPS diodes were processed with 64-channel spectrometric
electronics, built at the Joint Institute for Nuclear Research, Dubna. The electronics
existed twice to make the switching of the detectors once per day as fast and easy as
possible. A schematic diagram of the COMPACT electronics is presented in Figure
2.14. 64 PIPS diodes were connected to four 16-channel preamplifiers through coaxial
cables. The diodes were operated at EBias = -10 V, the average dark current through
one single diode was ∼ 10 nA if the detector was cooled. Signals from the preamplifiers
were provided over coaxial cables to four 16-channel amplifiers with two amplification
ranges (× 1 and × 10). Then they were multiplexed in 8 16-channel multiplexors. The
analog signal and digital information about the detector number from the multiplexor
were processed in a ADC module. The ADC module consists of 8 12-bit ADCs, a 1 µs
clock and a communication module based on the ALTERATMchip. The ADC device
was read out by the data acquisition computer via a PCI interface card containing a
FIFO buffer. The readout time was 5 µs, hence a signal counting rate with a frequency
of up to 200 kHz could be processed. Data were transferred via a computer network
and stored at a data analysis computer, placed in the control room. The data analysis
software allowed on-line visualization of the data and an on-line correlation search. The
COMPACT electronics was constructed to be reliable and easily transportable. The
power supply for the electronics, all amplifiers, and ADCs were designed as 19” rack
modules. Hence, it was possible to place the whole electronics together with the power
supply and test modules in a 12 U 19” rack.
2.2.5 Gas system
The main tasks of the gas system is to fast and efficiently transport the created volatile
species to COMPACT. These volatile species are flushed out of the RC, transported
through the PTFE capillary via the heated quartz wool plug, where the separation
from non-volatile compounds takes place, to the detection system. There, the volatile
species can be adsorbed and their decay can be measured. The gas system was installed
as a gas loop to reduce gas humidity. This was necessary, because the detector was
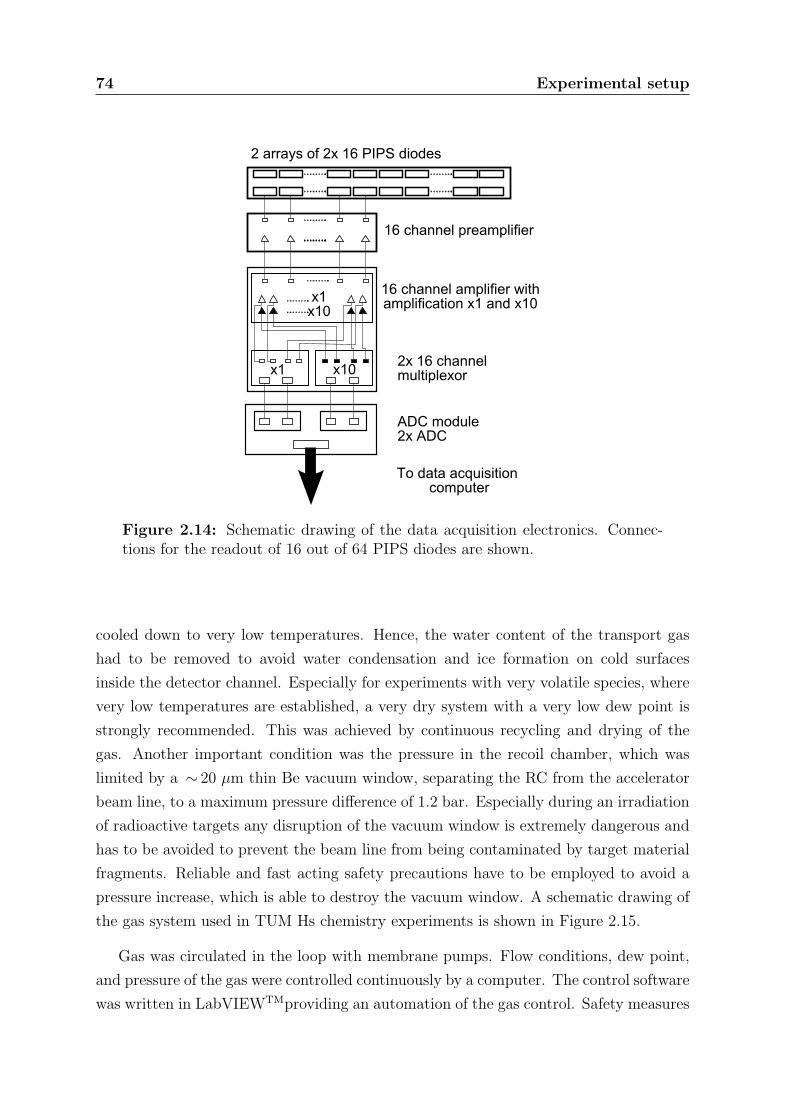
74 Experimental setup
Figure 2.14: Schematic drawing of the data acquisition electronics. Connec-tions for the readout of 16 out of 64 PIPS diodes are shown.
cooled down to very low temperatures. Hence, the water content of the transport gas
had to be removed to avoid water condensation and ice formation on cold surfaces
inside the detector channel. Especially for experiments with very volatile species, where
very low temperatures are established, a very dry system with a very low dew point is
strongly recommended. This was achieved by continuous recycling and drying of the
gas. Another important condition was the pressure in the recoil chamber, which was
limited by a ∼ 20 µm thin Be vacuum window, separating the RC from the accelerator
beam line, to a maximum pressure difference of 1.2 bar. Especially during an irradiation
of radioactive targets any disruption of the vacuum window is extremely dangerous and
has to be avoided to prevent the beam line from being contaminated by target material
fragments. Reliable and fast acting safety precautions have to be employed to avoid a
pressure increase, which is able to destroy the vacuum window. A schematic drawing of
the gas system used in TUM Hs chemistry experiments is shown in Figure 2.15.
Gas was circulated in the loop with membrane pumps. Flow conditions, dew point,
and pressure of the gas were controlled continuously by a computer. The control software
was written in LabVIEWTMproviding an automation of the gas control. Safety measures

Experimental setup 75
Gas-system Exp. S + U Mai 200836 238
DETECTOR 1
DETECTOR 2
Figure 2.15: Schematic drawing of the improved gas system, as used in the 36S+ 238U experiment.
were assured by two independent systems. The first safety system, shown in Figure 2.15
as a box (”GSI safety valves”), was a system of hardware operated valves, which imme-
diately ventilated the recoil chamber to air in case of an overpressure or underpressure
in the recoil chamber to prevent any damage of the target and vacuum window. The
second safety system was operated by the LabVIEWTMcontrol server, which prohibited
all flows in the gas system and switched the system to the by-pass mode in case of
any unexpected behavior of the gas system. This was necessary to prevent any water
contamination propagating in the gas system, which would have caused a longer drying
period of the gas system.
The moisture of the gas was determined by a NYADTMdevice through measuring the
dew point temperature. For drying of the gas, different techniques can be used, chemical
and/or physical drying procedures. Chemical methods are e.g. the use of tubes filled
with fresh activated silica-gel, alkali metals, or their hydrides or phosporus-pentoxid
which all interact very strongly with water. Silica-gel is also able to trap water vapors,

76 Experimental setup
if it is cooled down. The most used physical method is the cooling trap, in which the
gas is flushed through a column which is cooled down by liquid nitrogen to about -
90 ◦C condensing water until the dew point has reached the trap temperature. In this
experiment, a cold trap filled with molecular sieves and a trap filled with SicapentTMwas
used. A dew point of -70 ◦C was achieved under experimental conditions, which proved
to be sufficient to keep the part of the detector surface clean, where HsO4 adsorbed.
Another main task of the gas system is to establish a high gas flow through the
system, which corresponds to a low transport time being very relevant for the total
efficiency of the setup. The flow is created by membrane pumps establishing a flow of
up to 1.8 l/min. At typical gas flow rates a transport time of about 2 s was achieved in
this experiment. A picture of the gas system, the electronics, and both detector boxes
can be found in Figure 2.16.
Figure 2.16: Photograph of the experimental setup: 2 COMPACT detectorswith related electronics, and the gas control system.
Due to small leaks in the vacuum windows and of the RC and in the cooled detector
panel, new gas had to be supplied from gas tanks from time to time. Unfortunately,
another leak at the SwagelokTMconnector linking the exit of the detector with the gas sys-
tem was found. This leak was caused by thermal contraction of the PTFE capillary which
was larger than the thermal contraction of the stainless steel SwagelokTMconnector. A
leak rate of 100 ml/min was measured, corresponding to 5% of the total flow through the
system. However, this leak was not affecting the measurement, because it was located at
the exit outside of the detector. The gas pressure in the system, gas flow rates, as well
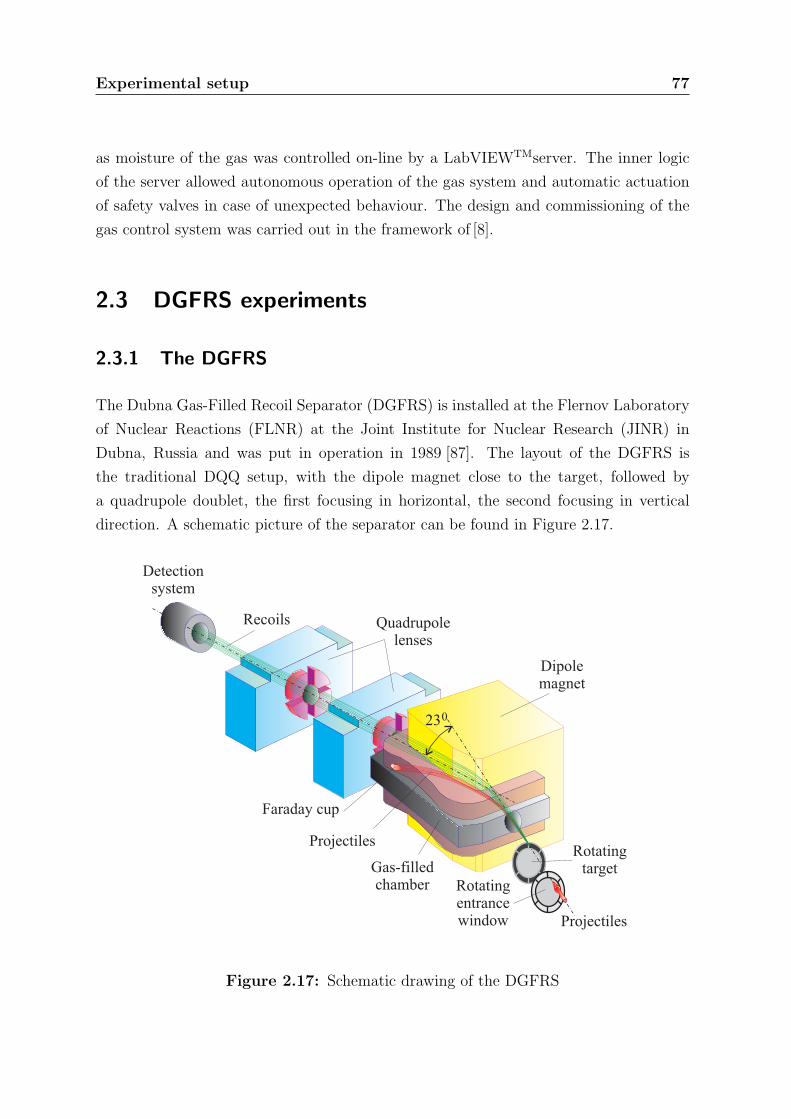
Experimental setup 77
as moisture of the gas was controlled on-line by a LabVIEWTMserver. The inner logic
of the server allowed autonomous operation of the gas system and automatic actuation
of safety valves in case of unexpected behaviour. The design and commissioning of the
gas control system was carried out in the framework of [8].
2.3 DGFRS experiments
2.3.1 The DGFRS
The Dubna Gas-Filled Recoil Separator (DGFRS) is installed at the Flernov Laboratory
of Nuclear Reactions (FLNR) at the Joint Institute for Nuclear Research (JINR) in
Dubna, Russia and was put in operation in 1989 [87]. The layout of the DGFRS is
the traditional DQQ setup, with the dipole magnet close to the target, followed by
a quadrupole doublet, the first focusing in horizontal, the second focusing in vertical
direction. A schematic picture of the separator can be found in Figure 2.17.
Rotatingentrancewindow
RotatingtargetGas-filled
chamber
Detectionsystem
230
Projectiles
Projectiles
Recoils
Dipolemagnet
Quadrupolelenses
Faraday cup
Figure 2.17: Schematic drawing of the DGFRS
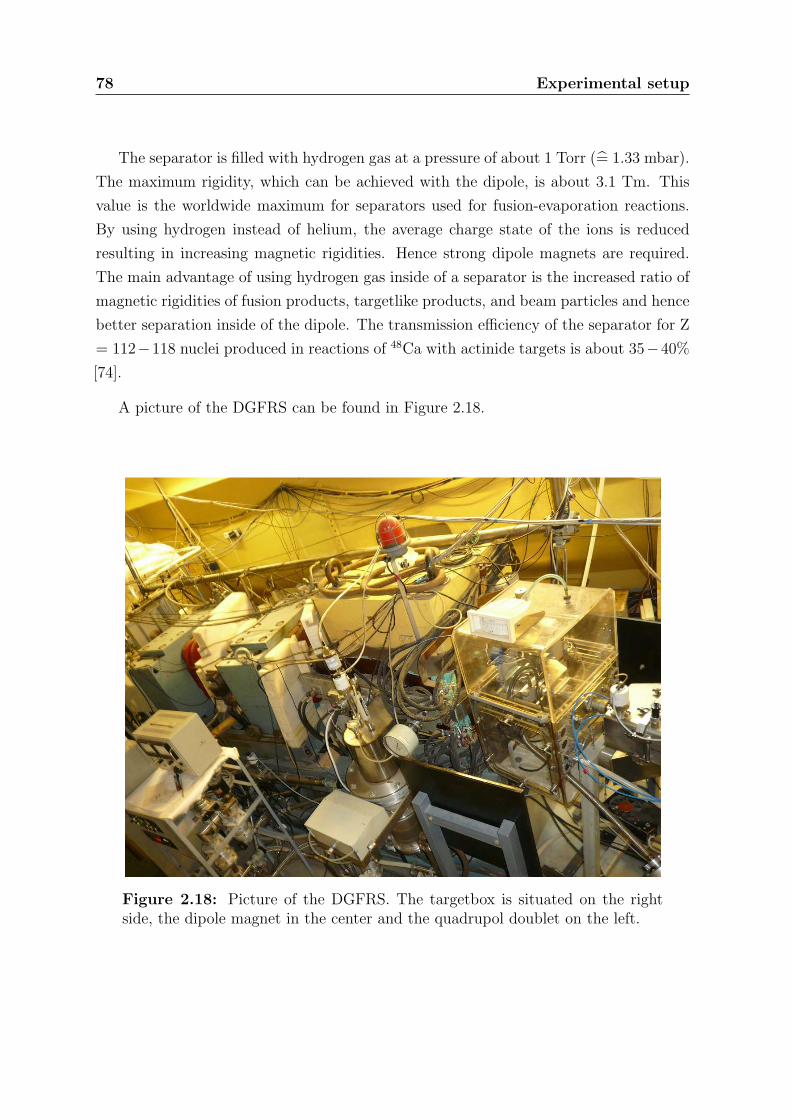
78 Experimental setup
The separator is filled with hydrogen gas at a pressure of about 1 Torr (= 1.33 mbar).
The maximum rigidity, which can be achieved with the dipole, is about 3.1 Tm. This
value is the worldwide maximum for separators used for fusion-evaporation reactions.
By using hydrogen instead of helium, the average charge state of the ions is reduced
resulting in increasing magnetic rigidities. Hence strong dipole magnets are required.
The main advantage of using hydrogen gas inside of a separator is the increased ratio of
magnetic rigidities of fusion products, targetlike products, and beam particles and hence
better separation inside of the dipole. The transmission efficiency of the separator for Z
= 112−118 nuclei produced in reactions of 48Ca with actinide targets is about 35−40%
[74].
A picture of the DGFRS can be found in Figure 2.18.
Figure 2.18: Picture of the DGFRS. The targetbox is situated on the rightside, the dipole magnet in the center and the quadrupol doublet on the left.
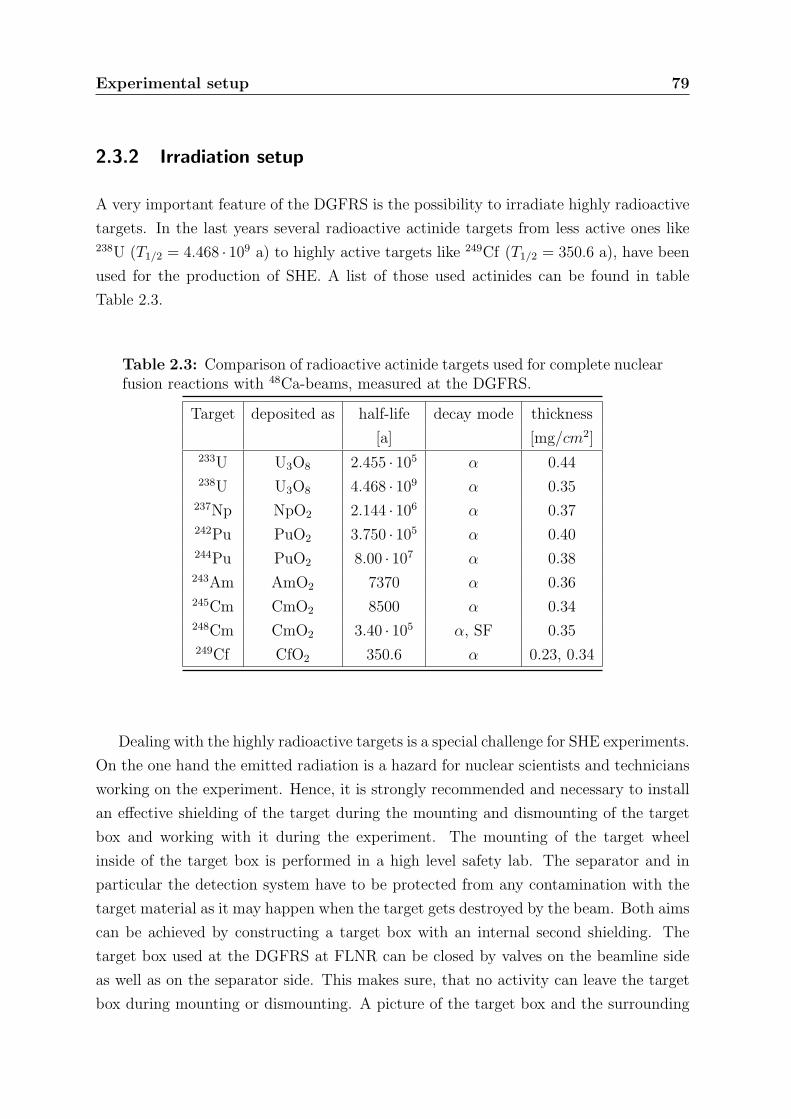
Experimental setup 79
2.3.2 Irradiation setup
A very important feature of the DGFRS is the possibility to irradiate highly radioactive
targets. In the last years several radioactive actinide targets from less active ones like238U (T1/2 = 4.468 · 109 a) to highly active targets like 249Cf (T1/2 = 350.6 a), have been
used for the production of SHE. A list of those used actinides can be found in table
Table 2.3.
Table 2.3: Comparison of radioactive actinide targets used for complete nuclearfusion reactions with 48Ca-beams, measured at the DGFRS.
Target deposited as half-life decay mode thickness
[a] [mg/cm2]233U U3O8 2.455 · 105 α 0.44238U U3O8 4.468 · 109 α 0.35
237Np NpO2 2.144 · 106 α 0.37242Pu PuO2 3.750 · 105 α 0.40244Pu PuO2 8.00 · 107 α 0.38243Am AmO2 7370 α 0.36245Cm CmO2 8500 α 0.34248Cm CmO2 3.40 · 105 α, SF 0.35249Cf CfO2 350.6 α 0.23, 0.34
Dealing with the highly radioactive targets is a special challenge for SHE experiments.
On the one hand the emitted radiation is a hazard for nuclear scientists and technicians
working on the experiment. Hence, it is strongly recommended and necessary to install
an effective shielding of the target during the mounting and dismounting of the target
box and working with it during the experiment. The mounting of the target wheel
inside of the target box is performed in a high level safety lab. The separator and in
particular the detection system have to be protected from any contamination with the
target material as it may happen when the target gets destroyed by the beam. Both aims
can be achieved by constructing a target box with an internal second shielding. The
target box used at the DGFRS at FLNR can be closed by valves on the beamline side
as well as on the separator side. This makes sure, that no activity can leave the target
box during mounting or dismounting. A picture of the target box and the surrounding

80 Experimental setup
Plexiglas box can be found in Figure 2.19.
Figure 2.19: Picture of the target box with the surrounding Plexi-glas box.
Due to the target box and valve tightness, materials and thicknesses, almost no
radiation can escape the array. To prevent the separator and dectection system from
fragments of a destroyed target, the target wheel itself is arranged in a second inner box.
This box has a cylindrical shape and two holes, one on the beam line side and one on the
separator side. The ions of the beam pass the front hole, before impinging on the target

Experimental setup 81
wheel. Reaction products being created inside of the target, leave the target in beam
direction and pass the rear hole. Afterwards they reach the separator and get deflected
by the dipole magnet. If the target gets destroyed, i.e. by very high beam intensity, the
target material gets scattered and only very little passes the small hole, while the bulk
of it is retained by the walls of the inner box.
Another problem, which may happen dealing with radioactive targets is the emana-
tion of radioactive gases as decay products of the target material. This was the case
during the two experimental campaigns in 2008, when two 226Ra-targets were irradiated
by 48Ca ions. The target material was deposited on a 1.5-µm Ti foil of the 36-cm2
rotating target wheel. The thickness during the first campaign was 0.23 mg/cm2 and
0.36 mg/cm2 during the second campaign. The integrity of the target layer was tested
regularly by measuring the 226Ra α-particle counting rate. 226Ra decays by α-decay with
a half-life of 1600 years to 222Rn. 222Rn is a noble gas with a half-life of only 3.825 days.
The decay products are also short lived. When the 226Ra-target is irradiated during
an experiment, it gets heated due to energy loss of the beam ions. Hence 222Rn-nuclei
diffuse rapidly to the surface and leave the target and may contaminate the separator,
detection system, and technical equipment. Due to this reason, in most accelerator
facilities in the world, handling 226Ra is prohibited. Indeed, performing experiments
with 226Ra is very challenging due to the 222Rn problem. Nevertheless, the scientists in
Dubna created a very effective but simple solution. A vacuum pump was connected to
the inner target box removing all evaporated 222Rn. Between the inner target box and
the pump, two cylinders filled with charcoal were mounted, absorbing 222Rn due to the
large surface. During the experiment the success of this method was tested by measur-
ing the activity at the surface of the two charcoal filled tubes. In the first part of the
experiment, only the first tube was active, while almost no radiation was emitted by the
second tube. Later on a rise in activity could be measured for the second tube. The two
tubes can be considered as a chromatography column which are slowing down the 222Rn
atoms due to van-der-Waals interaction with the large charcoal surface. Because of the
relatively short half-life of 222Rn of about four days, nearly all gas atoms have decayed
inside of the tubes. As a second protection method, a Plexiglas box was mounted around
the target box and kept under low pressure. In total, neither the detection system or
the separator nor the experimental hall were contaminated during both experimental
campaigns, which lasted several months.
The beam particles, 48Ca ions in our case, were produced by the ECR source, ex-
tracted, injected to and accelerated by the U400 cyclotron of the FLNR, JINR. Typical

82 Experimental setup
beam intensities at the target were 0.7-1.1 pµA. Three different beam energies have been
used, Elab = 228.5 MeV, 233.5 MeV, and 240.5 MeV. The beam energy was measured by
applying a time-of-flight system with a systematic uncertainty of 1 MeV. After passing
through a rotating 1.5-µm Ti foil, serving as a vacuum window between the gas-filled
separator and the vacuum of the beam line, the beam was impinging on the 36-cm2
rotating target. Behind the target box, the magnets are installed in the aforementioned
order. Behind the second quadrupole, a Mylar window of about 1 µm thickness is in-
stalled, to separate the hydrogen of the DGFRS from the detection system box, which is
filled with pentane with a pressure of about 1.5 Torr. In the detector box, the detection
system is installed.
2.3.3 Detection system
The detection system itself consists of two units, the time-of-flight (TOF) system and the
focal-plane detector and is installed inside of the pentane filled detector chamber, follow-
ing the DGFRS from beam direction. A schematic drawing can be found in Figure 2.20
Recoils
Position-sensitivedetectors
Time-of-flightsystem
Side detectors
Start
Stop
“veto” detectors
Figure 2.20: Schematic drawing of the DGFRS detection system consistingof the time-of-flight (TOF) system and the focal-plane detector, as used in the48Ca + 226Ra experiment.
The TOF system consists of two arrays of multiwire proportional chambers, each
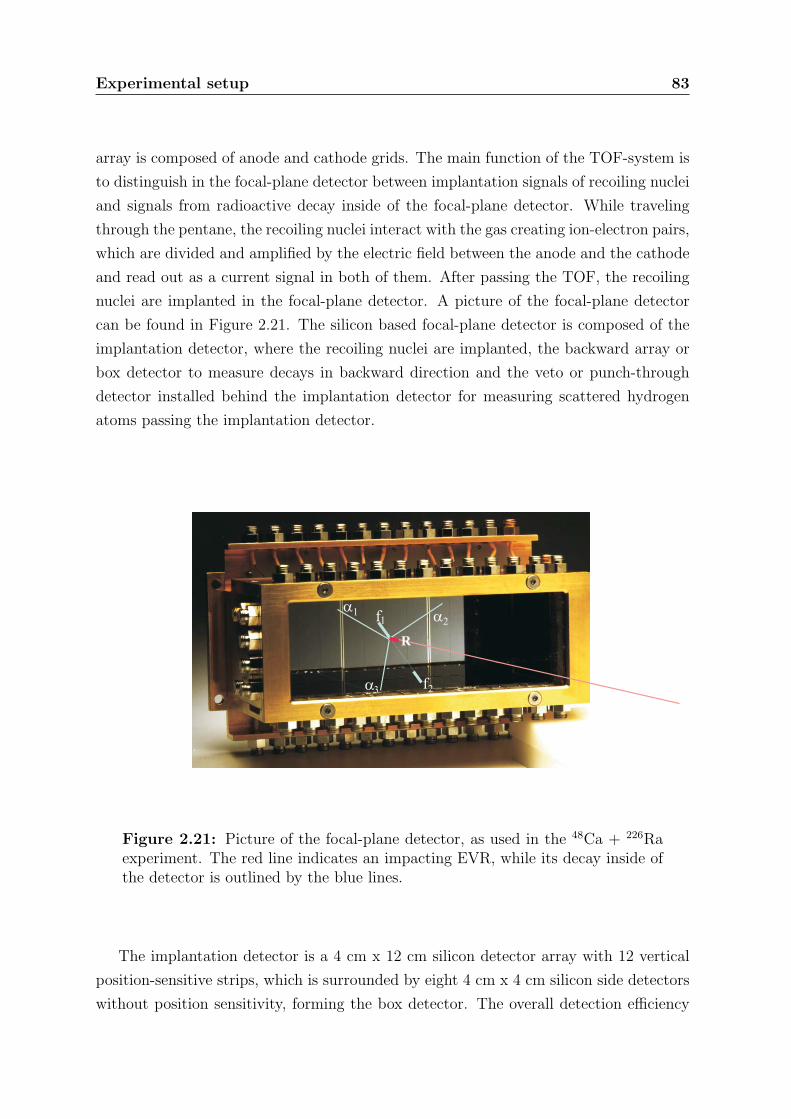
Experimental setup 83
array is composed of anode and cathode grids. The main function of the TOF-system is
to distinguish in the focal-plane detector between implantation signals of recoiling nuclei
and signals from radioactive decay inside of the focal-plane detector. While traveling
through the pentane, the recoiling nuclei interact with the gas creating ion-electron pairs,
which are divided and amplified by the electric field between the anode and the cathode
and read out as a current signal in both of them. After passing the TOF, the recoiling
nuclei are implanted in the focal-plane detector. A picture of the focal-plane detector
can be found in Figure 2.21. The silicon based focal-plane detector is composed of the
implantation detector, where the recoiling nuclei are implanted, the backward array or
box detector to measure decays in backward direction and the veto or punch-through
detector installed behind the implantation detector for measuring scattered hydrogen
atoms passing the implantation detector.
a1
a2
a3
f1
f2
R
Figure 2.21: Picture of the focal-plane detector, as used in the 48Ca + 226Raexperiment. The red line indicates an impacting EVR, while its decay inside ofthe detector is outlined by the blue lines.
The implantation detector is a 4 cm x 12 cm silicon detector array with 12 vertical
position-sensitive strips, which is surrounded by eight 4 cm x 4 cm silicon side detectors
without position sensitivity, forming the box detector. The overall detection efficiency

84 Experimental setup
for alpha particles, emitted from decays of implanted nuclei is about 87 %.
The detection system is usually calibrated using well known reactions, creating well
known products, for example, 48Ca + natYb→Th + xn and 48Ca + 206Pb→ 252No + 2n.
The thorium isotopes were used for the calibration of the α range. These isotopes (es-
pecially 217Th with Eα = 9.25 MeV) are quite useful to perform alpha calibration for
superheavy element synthesis experiments. Due to the very short half-lives, the pre-
dominant alpha decay occurs with a high energy similar to the alpha energies from the
decay of superheavy elements.
The resulting energy resolution of the detection system for α particles is 50-110 keV
(FWHM) for decays in the implantation detector, depending on the strip number, and
130-310 keV for α particles escaping the implantantion detector in backward direction
and being measured in the box detector.
The decay of 252No, which has a large fission branch, was used to calibrate the high en-
ergy branch of the detectors with SF fragments. The measured fragment energies were
not corrected for the pulse-height defect of the detectors or for energy loss of escaping
fission fragments in the detector chamber entrance window, dead layers of the detectors,
and the pentane gas filling of the detector chamber. The mean sum energy loss of fission
fragments of 252No registered in the implantation detector and side detectors compared
to the total kinetic energy (TKE) was about 20-25 MeV.
The position resolution also measured at FWHM of correlated EVRs with emitted α
particles or fission fragments were 1.1-1.9 mm and 0.6-1.6 mm, respectively. For α parti-
cles, detected by both the implantation detector and side detector, the EVR-α position
resolution depends on the energy deposited in the implantation detector and had a mean
value of 2.0-3.5 mm and 3.4-5.8 mm for energies larger and lower than 3 MeV, respec-
tively.
Chapter 3
Analysis of the experimental data
The current chapter presents the experimental data analysis performed on the data
obtained in the experiments dealing with the nuclear reactions 36S + 238U (Section 3.2)
and 48Ca + 226Ra (Section 3.1). The calculation of the overall efficiency of COMPACT,
which describes the experimental sensitivity is displayed in Section 3.3. The expected
decay pattern is a cascade of subsequent decays and hence time correlations between
detected events can be used to identify Hs decay chains in the α- and SF background,
which is introduced and presented in Section 3.4.
3.1 Analysis of experimental data from the DGFRS ex-
periments
3.1.1 Experiments on the reaction 48Ca + 226Ra
The experiments on the complete nuclear fusion reaction 48Ca+ 226Ra were prepared,
conducted, operated, and analyzed by the DGFRS group of the FLNR, JINR, Dubna,
Russia. Our group was invited to both experimental campaigns, in summer 2008 and
winter 2008/2009 and, hence, we could work on the experiments in a collaboration of
the FLNR and the Institut fur Radiochemie of the Technical University of Munich. As
mentioned the experiment itself as well as the analysis of the experimental data[97] have
been performed by the DGFRS group and I was explicit allowed to use all the material
in this thesis.
85
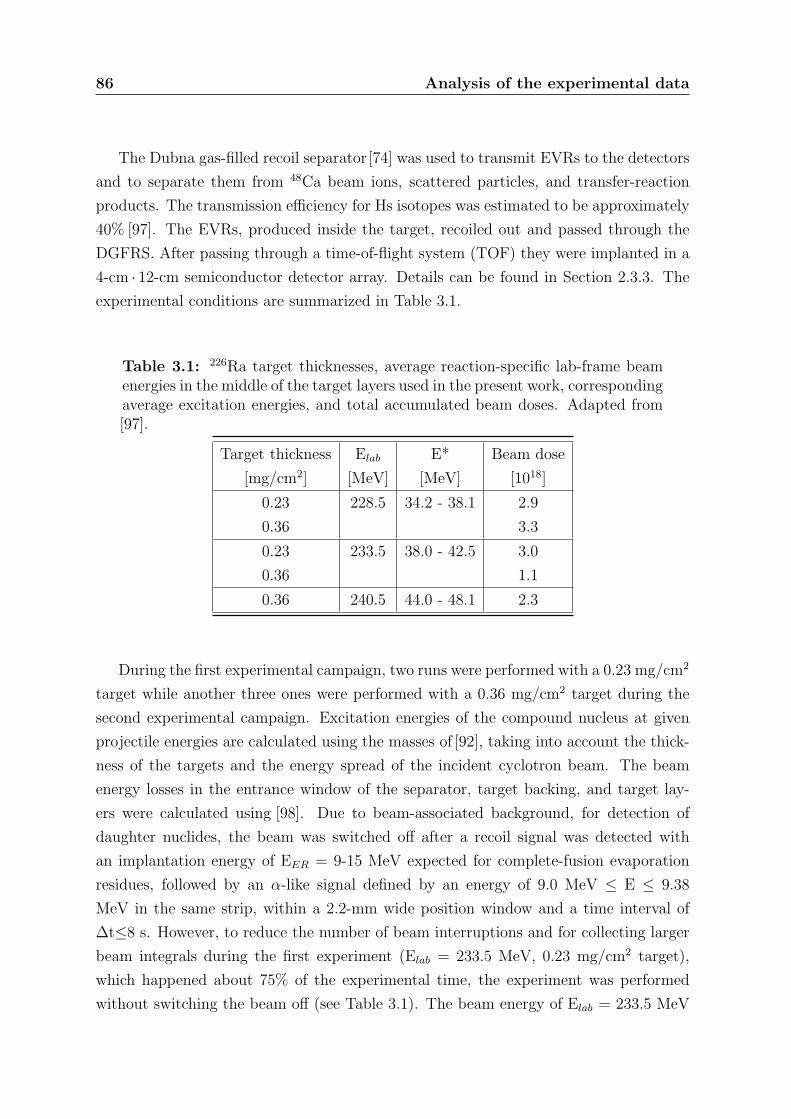
86 Analysis of the experimental data
The Dubna gas-filled recoil separator[74] was used to transmit EVRs to the detectors
and to separate them from 48Ca beam ions, scattered particles, and transfer-reaction
products. The transmission efficiency for Hs isotopes was estimated to be approximately
40% [97]. The EVRs, produced inside the target, recoiled out and passed through the
DGFRS. After passing through a time-of-flight system (TOF) they were implanted in a
4-cm · 12-cm semiconductor detector array. Details can be found in Section 2.3.3. The
experimental conditions are summarized in Table 3.1.
Table 3.1: 226Ra target thicknesses, average reaction-specific lab-frame beamenergies in the middle of the target layers used in the present work, correspondingaverage excitation energies, and total accumulated beam doses. Adapted from[97].
Target thickness Elab E* Beam dose
[mg/cm2] [MeV] [MeV] [1018]
0.23 228.5 34.2 - 38.1 2.9
0.36 3.3
0.23 233.5 38.0 - 42.5 3.0
0.36 1.1
0.36 240.5 44.0 - 48.1 2.3
During the first experimental campaign, two runs were performed with a 0.23 mg/cm2
target while another three ones were performed with a 0.36 mg/cm2 target during the
second experimental campaign. Excitation energies of the compound nucleus at given
projectile energies are calculated using the masses of [92], taking into account the thick-
ness of the targets and the energy spread of the incident cyclotron beam. The beam
energy losses in the entrance window of the separator, target backing, and target lay-
ers were calculated using [98]. Due to beam-associated background, for detection of
daughter nuclides, the beam was switched off after a recoil signal was detected with
an implantation energy of EER = 9-15 MeV expected for complete-fusion evaporation
residues, followed by an α-like signal defined by an energy of 9.0 MeV ≤ E ≤ 9.38
MeV in the same strip, within a 2.2-mm wide position window and a time interval of
∆t≤8 s. However, to reduce the number of beam interruptions and for collecting larger
beam integrals during the first experiment (Elab = 233.5 MeV, 0.23 mg/cm2 target),
which happened about 75% of the experimental time, the experiment was performed
without switching the beam off (see Table 3.1). The beam energy of Elab = 233.5 MeV

Analysis of the experimental data 87
corresponds to the expected maximum for the 4n-evaporation channel producing 270Hs.270Hs decays via α-particle emission, followed by short-lived spontaneously fissioning266Sg (T1/2=0.36 s [52]) and could be convincingly registered during beam-on intervals
due to the low counting rate of SF-like events and a very short correlation time. Other
parts of the experiment, investigating the 3n and 5n evaporation channel at Elab = 233.5
MeV (3n and 5n), as well as both experiments at Elab = 228.5 MeV (3n) were performed
with 3-min beam-off intervals. In the experiment at Elab = 240.5 MeV beam energy,
examining the 4n and 5n evaporation channel, a beam-off time interval of 1 min was
used. If an α-particle with E = 8.5-9.1 MeV was registered in any position of the same
strip within the interval, the beam-off interval was automatically extended to 3 minutes.
Experiments were carried out at three beam energies (see Table 3.1). The highest
projectile energy of Elab = 240.5 MeV is close (3 MeV less) to the expected maximum
of the 5n evaporation channel, obtained from calculations [41], as shown in Figure 4.6.
A still higher production cross section for the 4n channel, compared to the 5n channel
can be expected at this energy, according to the calculations (see Figure 4.6). The mean
projectile energy of Elab = 233.5 MeV corresponds to the maximum of the 4n-evaporation
channel cross section. At this energy one can expect minor production of 271Hs in the
3n-evaporation channel according to the calculations. At the lowest projectile energy
of Elab = 228.5 MeV corresponding to an excitation energy of E* = 36 MeV, about the
same yields of 271Hs and 270Hs can be expected. At this energy the yield of 271Hs should
be the same as at an energy of Elab = 233.5 MeV corresponding to an excitation energy
of E* = 40 MeV, whereas the yield of 270Hs should be three times lower at the lower
energy (see Figure 4.6).
3.2 Analysis of experimental data from the TUM Hs
chemistry experiment
3.2.1 Experiment on the reaction 36S + 238U
Hs nuclei were produced in the 3–5n channel of the reaction 238U(36S, xn)274−xHs. In
an experimental campaign in 2008, one beam energy was used in combination with two
different sets of 238U targets. Due to differences in the target thickness, two different
beam energies in the target were obtained in the middle of the target Elab = 179.5 MeV
and Elab = 193.5 MeV, corresponding to excitation energies, E* = (39± 4) MeV and

88 Analysis of the experimental data
(51± 3) MeV, respectively. HIVAP predicted the maximum cross sections for the 4n
and 5n evaporation channel, at these excitation energies. A summary of experimental
conditions for both beam energies is given in Table 3.2. Due to the effective chemical
separation, only α-lines originating from volatile species 172−174Os, 211At, and 219,220Rn
and their daughters were identified.
Background α-decay events in the area of interest at α-particle energies of 8.0–
10.0 MeV were attributed mainly to 212Po originating from the in-flight decay of 220Rn.
A typical sum spectrum of all α-particles detected during the first part of the 36S + 238U
experimental campaign of all 32 detector pairs is presented in Figure 3.1.
4 5 6 7 8 9 10 110
2000
4000
6000
8000
10000
12000
14000
16000
18000
20000
22000
24000
212Po
coun
ts
E [MeV]
211 A
t
219 R
n
211 B
i
215 P
o
8 9 100
5
10
15
20
25
30
35
40
Figure 3.1: Alpha sum spectrum of all 32 detector pairs accumulated during thefirst part of the 36S + 238U experimental campaign (93 hours). 211Bi originatesmostly from off-line α-line calibrations. Only α-lines originating from 211Atand 219,220Rn and their daughters were identified in the spectrum. The area ofinterest is shown in the enlarged cutout. Background α-decay events in the areaof interest were attributed mainly to 212Po originating from the in-flight decayof 220Rn.

Analysis of the experimental data 89
Taking the decay properties of 269Hs[51,52,63,65,79,83,99], and heavier 270Hs[51,52],
and 271Hs [51,52] as a base, a decay chain was defined as an α-decay occurring in the
energy range from 8.0 – 9.5 MeV followed within 300 s in the same or a neighboring
detector pair either by an α-decay in the same energy window or by a SF. This search
procedure was repeated within the chain with identical conditions until no further α-
decay or SF was found. Due to the α- and SF background, pseudo-correlated sequences
can be formed with non-zero probability. Based on measured counting rates the number
of expected random correlated chains was calculated. The number of expected α-SF and
α-α-SF pseudo-correlated chains caused by background are presented in Table 3.2 along
with the number of detected correlations.
Table 3.2: Summary of experimental conditions in the 36S + 238U experi-ments. Elab denotes the beam energy in laboratory frame, E∗ is the excitationenergy, IBeam is the accumulated beam integral, Tirr is the irradiation time inhours, Nα and NSF are the numbers of measured α- (8.0 < E < 9.5 MeV)and SF (15 < E < 400 MeV) decays. nb(α-SF) and nb(α-α-SF) stand for thenumber of expected random α-SF and α-α-SF correlations caused by α- andSF-background. Columns N2, N3, and N4 list the number of observed two-,three-, and four-member correlations (α-SF, α-α-SF, and α-α-α-α). The searchfor correlations was performed in subsequent 300 s time windows, according tothe decay properties reported in [8].
Elab E∗ IBeam Tirr Nα NSF nb(α-SF) nb(α-α-SF) N2 N3 N4
[MeV] [MeV] [particles] [h] (300 s) (2× 300 s)
179.5 39 5.74 · 1017 93 351 6 1.6 · 10−2 4.6 · 10−3 0 0 0
193.5 51 1.03 · 1018 149 732 13 4.6 · 10−2 1.7 · 10−3 1 0 0
From the comparison it is clear, that the one single detected α-SF correlation cannot
be of random origin, due to a very low random probability. The analysis of the search
method and evaluation of expected random correlations is presented in Section 3.4. The
number of expected random events (nb) in Table 3.2 can be considered as an absolute
upper limit, because very wide α-energy and time windows were taken, due to the decay
properties of the different expected hassium isotopes and their daughter nuclides (see
Table 4.4).

90 Analysis of the experimental data
3.3 Overall efficiency
The overall efficiency denotes the probability, to detect the decay of an evaporation
residue inside the detection unit, produced inside of the target. This probability consists
of the chemical reaction- and gas jet yield, the in flight decay probability, and the
detection efficiency.
3.3.1 Transport efficiency
The transport efficiency defines the probability, that a evaporation residue produced
inside and recoiling out of the target is being transported to the detection system. This
probability consists of:
Chemical reaction- and gas jet yield - This describes the probability, that the pro-
duced Hs nuclei form a volatile tetroxide and are being transported to the detector
by the gas jet.
In flight decay probability - Probability, that the species does not decay during the
transport to the detector.
The chemical reaction and gas jet efficiency was estimated in previous test experi-
ments in the framework of [8]. α-decaying, short lived Os isotopes were produced under
the same experimental conditions as in the Hs chemistry experiments. The Os yield
was maximized by changing the temperature in the recoil chamber, the temperature of
the quartz filter, the He to O2 mixing ratio and the gas flow rate. These determined
optimum experimental conditions were used in the Hs chemistry experiments to achieve
maximum yield. From the calculated production cross section of the nuclear reaction
and from the Os yield, the chemical reaction and gas jet efficiency was estimated to be
about 80%.
The survival probability, which is clearly dependent on the half-life of the investigated
Hs isotopes, can easily be calculated from the known transport time in the gas flow. The
transport time was measured in the aforementioned test experiments with short-lived
Os isotopes. In the experiments on the reaction 36S + 238U, searching for Hs isotopes
with expected half-lives of at least around 10 seconds [8], a transport time of two to

Analysis of the experimental data 91
three seconds was estimated, resulting in survival probabilities of at least 81% and 87%,
respectively.
The transport efficiency can be calculated by multiplying the chemical reaction and
gas jet efficiency by the survival probability. In the case of this experiment, transport
efficiencies of 64% to 70% were reached for 10 s Hs nuclei.
3.3.2 Detection efficiency of COMPACT
COMPACT, consists of two detector arrays of 32 PIN diodes each, facing each other
resulting in a close to 4π geometry. This arrangement yields a high efficiency for the
detection of α-decays and SF of species deposited on the active surface of the PIN diodes.
Nevertheless, also inactive surfaces in the detector panel are available for adsorption of
species, like the metal sides of the detector channel or the vacuum feedthroughs. Hence,
a precise calculation of the detection efficiency is necessary to estimate the probability
of an α-particle escaping a decay chain. The following assumptions were made for the
calculation of the detection efficiency:
1. The deposition probability is the same on all types of surfaces.
2. An α-particle emitted from a decaying nucleus can be emitted by any angle with
the same probability.
3. The two fragments emitted by a spontaneously fissioning nucleus are flying in
opposite directions under 180◦.
4. If an α-particle emitted from a decaying nucleus hits the active surface of a PIN
diode, it is detected.
5. To exclude signals from α-particles that enter the detector under very shallow
angles, only signals from neighboring detectors are accepted for the detection of
genetically linked decay chains.
Deposition efficiency
Detailed dimensions of the detector channel and of a single PIN diode are shown in
Figure 3.2. The deposition of a species is only possible on the surfaces inside the detector
channel. These can be divided as follows:
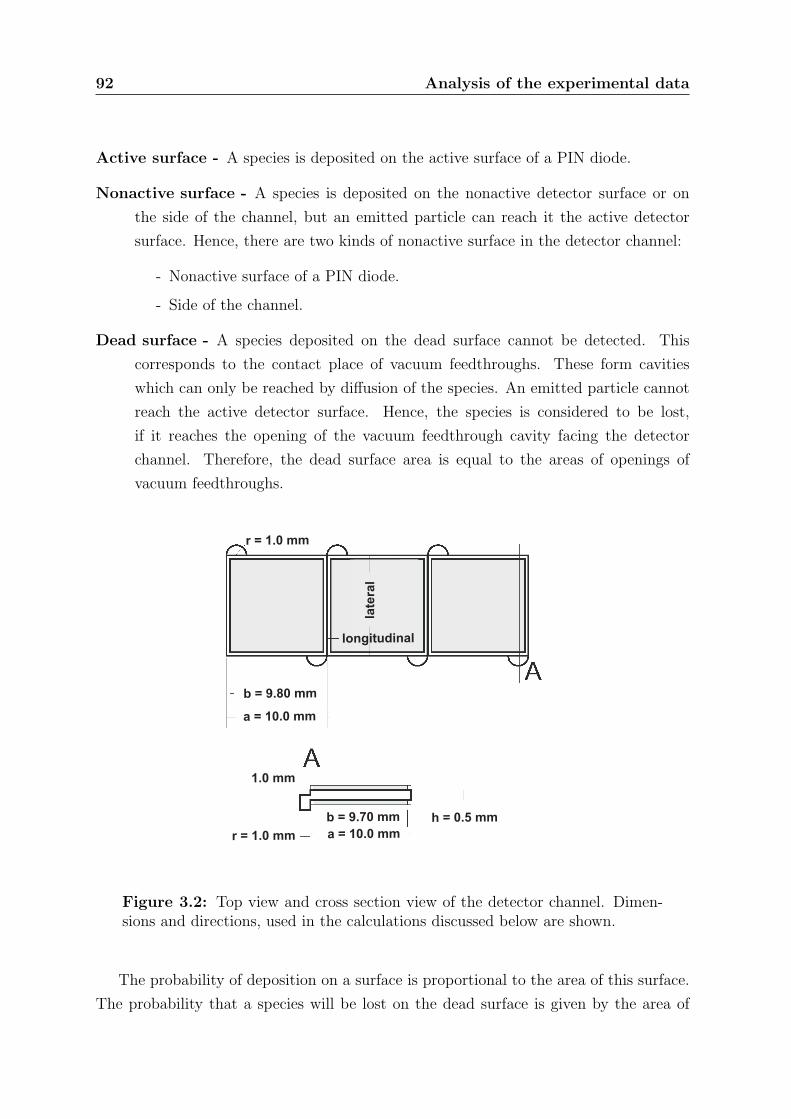
92 Analysis of the experimental data
Active surface - A species is deposited on the active surface of a PIN diode.
Nonactive surface - A species is deposited on the nonactive detector surface or on
the side of the channel, but an emitted particle can reach it the active detector
surface. Hence, there are two kinds of nonactive surface in the detector channel:
- Nonactive surface of a PIN diode.
- Side of the channel.
Dead surface - A species deposited on the dead surface cannot be detected. This
corresponds to the contact place of vacuum feedthroughs. These form cavities
which can only be reached by diffusion of the species. An emitted particle cannot
reach the active detector surface. Hence, the species is considered to be lost,
if it reaches the opening of the vacuum feedthrough cavity facing the detector
channel. Therefore, the dead surface area is equal to the areas of openings of
vacuum feedthroughs.
late
ral
longitudinal
b = 9.80 mm
a = 10.0 mm
r = 1.0 mm
a = 10.0 mm
b = 9.70 mm h = 0.5 mm
r = 1.0 mm
1.0 mm
Figure 3.2: Top view and cross section view of the detector channel. Dimen-sions and directions, used in the calculations discussed below are shown.
The probability of deposition on a surface is proportional to the area of this surface.
The probability that a species will be lost on the dead surface is given by the area of

Analysis of the experimental data 93
the opening of the cavity of a vacuum feedthrough. Relative areas of all surfaces inside
the detector channel per one PIN diode are presented in Table 3.3.
Table 3.3: Relative areas of different surfaces inside the detector channel perone PIN diode and the probability of deposition on these surfaces.
Activesurface
Nonactive surface Deadsurface
Detector Side
Area of surface in mm2 95.55 4.46 4.35 0.65
Deposition probability 91.00 % 4.24 % 4.14 % 0.62 %
Geometrical detection efficiency
The geometrical detection efficiency defines the probability, that a particle emitted by
a radioactive decay of a mother nucleus will hit the active detector surface. Due to
the geometry of the detector, it depends on the type of surface on which the nucleus is
deposited.
Active surface:
If an α-particle is emited by a species towards the active surface, on which it is de-
posited, this particle is detected. For particles emitted in the opposite hemisphere, the
probability is calculated as a normalized integral over all possible positions and emit-
tance angles. Integration in the 3 dimensional space is decomposed into two orthogonal
directions - longitudinal and lateral, as shown in Figure 3.2.
Longitudinal direction - In longitudinal direction, particles can be detected in the
detector directly opposite of the detector on which the species was deposited as
well as in the neighboring detectors.
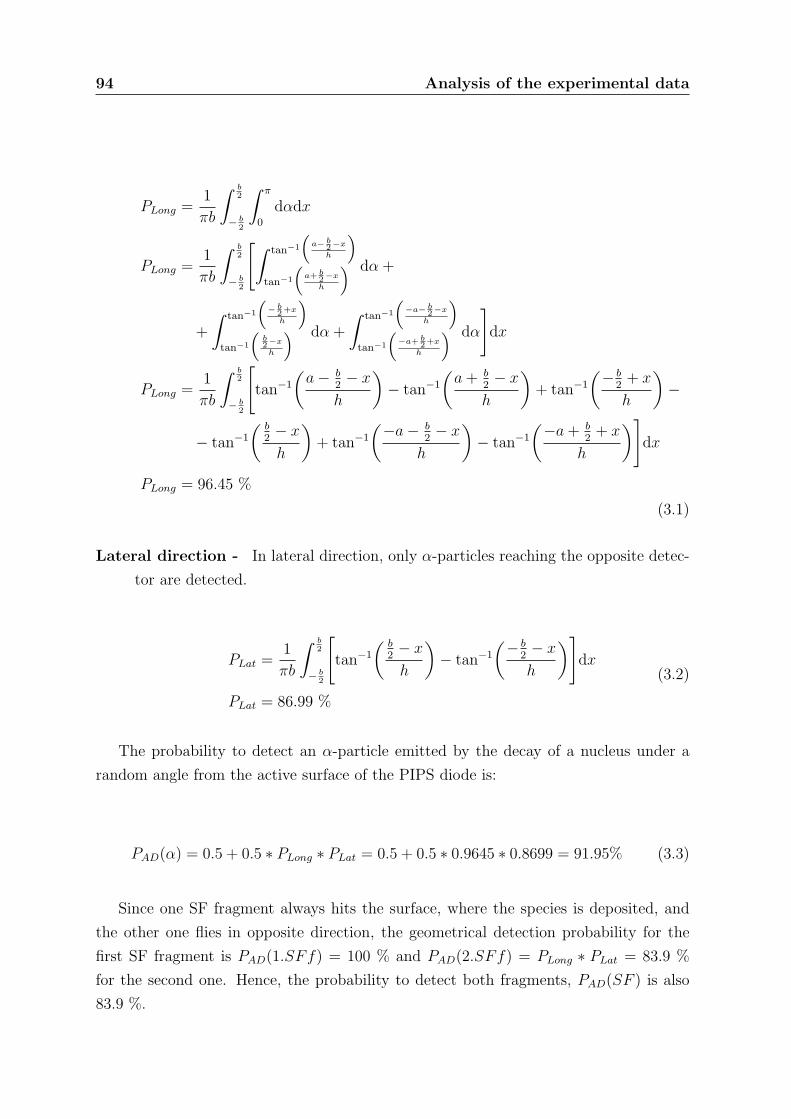
94 Analysis of the experimental data
PLong =1
πb
∫ b2
− b2
∫ π
0
dαdx
PLong =1
πb
∫ b2
− b2
[∫ tan−1
(a− b2−x
h
)tan−1
(a+ b
2−xh
) dα +
+
∫ tan−1
(− b2+x
h
)tan−1
(b2−xh
) dα +
∫ tan−1
(−a− b2−x
h
)tan−1
(−a+ b
2+x
h
) dα
]dx
PLong =1
πb
∫ b2
− b2
[tan−1
(a− b
2− x
h
)− tan−1
(a+ b
2− x
h
)+ tan−1
(− b2
+ x
h
)−
− tan−1
( b2− xh
)+ tan−1
(−a− b2− x
h
)− tan−1
(−a+ b2
+ x
h
)]dx
PLong = 96.45 %
(3.1)
Lateral direction - In lateral direction, only α-particles reaching the opposite detec-
tor are detected.
PLat =1
πb
∫ b2
− b2
[tan−1
( b2− xh
)− tan−1
(− b2− xh
)]dx
PLat = 86.99 %
(3.2)
The probability to detect an α-particle emitted by the decay of a nucleus under a
random angle from the active surface of the PIPS diode is:
PAD(α) = 0.5 + 0.5 ∗ PLong ∗ PLat = 0.5 + 0.5 ∗ 0.9645 ∗ 0.8699 = 91.95% (3.3)
Since one SF fragment always hits the surface, where the species is deposited, and
the other one flies in opposite direction, the geometrical detection probability for the
first SF fragment is PAD(1.SFf) = 100 % and PAD(2.SFf) = PLong ∗ PLat = 83.9 %
for the second one. Hence, the probability to detect both fragments, PAD(SF ) is also
83.9 %.
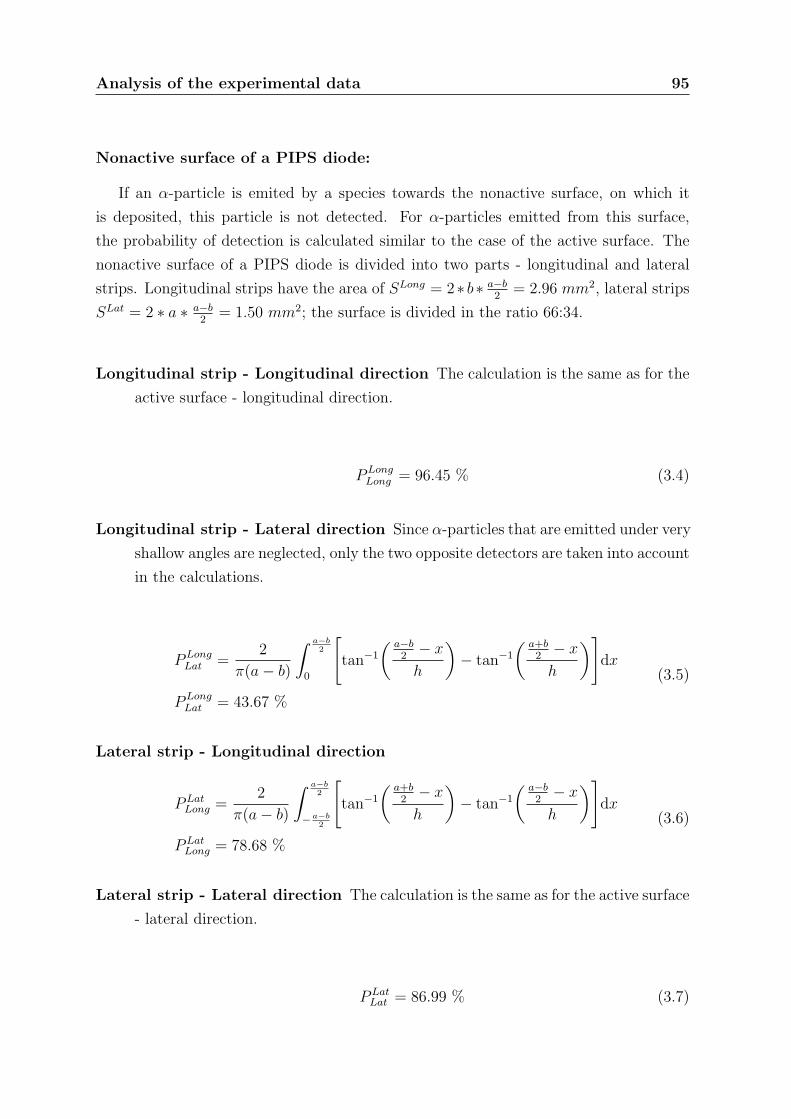
Analysis of the experimental data 95
Nonactive surface of a PIPS diode:
If an α-particle is emited by a species towards the nonactive surface, on which it
is deposited, this particle is not detected. For α-particles emitted from this surface,
the probability of detection is calculated similar to the case of the active surface. The
nonactive surface of a PIPS diode is divided into two parts - longitudinal and lateral
strips. Longitudinal strips have the area of SLong = 2∗ b∗ a−b2
= 2.96 mm2, lateral strips
SLat = 2 ∗ a ∗ a−b2
= 1.50 mm2; the surface is divided in the ratio 66:34.
Longitudinal strip - Longitudinal direction The calculation is the same as for the
active surface - longitudinal direction.
PLongLong = 96.45 % (3.4)
Longitudinal strip - Lateral direction Since α-particles that are emitted under very
shallow angles are neglected, only the two opposite detectors are taken into account
in the calculations.
PLongLat =
2
π(a− b)
∫ a−b2
0
[tan−1
( a−b2− xh
)− tan−1
( a+b2− xh
)]dx
PLongLat = 43.67 %
(3.5)
Lateral strip - Longitudinal direction
PLatLong =
2
π(a− b)
∫ a−b2
−a−b2
[tan−1
( a+b2− xh
)− tan−1
( a−b2− xh
)]dx
PLatLong = 78.68 %
(3.6)
Lateral strip - Lateral direction The calculation is the same as for the active surface
- lateral direction.
PLatLat = 86.99 % (3.7)

96 Analysis of the experimental data
Hence, the final geometrical probabilities for species deposited on the nonactive sur-
face of a PIPS diode are:
PNAD(α) = 0.5 ∗ (0.64 ∗ PLongLong ∗ P
LongLat + 0.34 ∗ PLong
Lat ∗ PLatLat ) = 19.68 %
PNAD(1.SFf) = 0 %
PNAD(2.SFf) = (0.64 ∗ PLongLong ∗ P
LongLat + 0.34 ∗ PLong
Lat ∗ PLatLat ) = 50.39 %
(3.8)
Nonactive surface - side of channel:
Longitudinal direction - The calculation is similar as for the active surface, only the
integration limits are changed to −a2, a
2.
PLong = 97.8 % (3.9)
Lateral direction - An emitted α-particle from the decay of a nucleus can be detected
in either one of the two bordering PIPS diodes.
PLat =2
πh
∫ h2
−h2
[tan−1
(b+ a−b
2h2− x
)− tan−1
(a−b
2h2− x
)]dx
PLat = 56.01 %
(3.10)
Therefore, the final geometrical detection probabilities for the species deposited on
the side of the channel are:
PNAS(α) = 0.5 ∗ PLong ∗ PLat = 27.38 %
PNAS(1.SFf) = 0 %
PNAS(2.SFf) = 54.77 %
(3.11)
Dead surface:
If an α-particle is emitted by a decaying nucleus adsorbed on a dead surface, the

Analysis of the experimental data 97
probability to detect that α-particle (hit of an active surface of a PIPS diode) is assumed
to be equal to zero.
Summary of geometrical detection probability:
The calculated geometrical probabilities for α-particles and SF fragments from a
decaying mother nucleus being adsorbed on different surfaces before are summarized in
the Table 3.4.
Table 3.4: Geometrical probabilities of different surfaces
Active surface Nonactive surface Dead surface
Detector Side
P (α) 91.95 % 19.68 % 27.38 % 0 %
P (1×SFf) 100 % 50.39 % 54.77 % 0 %
P (2×SFf) 83.9 % 0 % 0 % 0 %
Detection efficiency
The detection efficiency is calculated from deposition probabilities (Table 3.3) and geo-
metrical probabilities (Table 3.4). The probability to detect an α-particle, emitted from
a species deposited somewhere in the detector channel, is about 84%. The probabil-
ity to detect both fragments of a spontaneous fission decay is about 76%, to detect at
least one fragment is about 94%. The detection probabilities for an α-α-SF decay chain
are presented in Table 3.5. The abbreviation SFf stands for one fission fragment. The
detection probabilities for an α-SF decay chain are presented in Table 3.6.
From the values in Tables 3.5 and 3.6 can be concluded, that the probability to
identify an α-α-SF decay chain as a complete one ( α-α-2× SFf or α-α-1× SFf is about
77% and to detect it as an at least two member correlation is about 92%. An α-SF chain
will be identified in about 85% of all cases as complete.

98 Analysis of the experimental data
Table 3.5: Detection probabilities for an α-α-SF decay chain.
Active surface Nonactive surface Dead surface Whole detector
Detector Side
α− α− 2×SFf 70.94 % 0 % 0 % 0 % 64.56 %
α− α− 1×SFf 13.61 % 1.95 % 4.11 % 0 % 12.64 %
α− α 0 % 1.92 % 3.39 % 0 % 0.22 %
α− 2×SFf 12.42 % 0 % 0 % 0 % 11.30 %
α− 1×SFf 2.38 % 15.93 % 21.78 % 0 % 3.74 %
α 0 % 15.68 % 17.99 % 0 % 1.41 %
2×SFf 0.54 % 0 % 0 % 0 % 0.49 %
1×SFf 0.10 % 32.51 % 28.88 % 0 % 2.67 %
nothing 0 % 32.00 % 23.85 % 100 % 2.96 %
Table 3.6: Detection probabilities for an α-SF decay chain.
Active surface Nonactive surface Dead surface Whole detector
Detector Side
α− 2×SFf 77.15 % 0 % 0 % 0 % 70.20 %
α− 1×SFf 14.80 % 9.92 % 15.00 % 0 % 14.51 %
α 0 % 9.76 % 12.38 % 0 % 0.93 %
2×SFf 6.75 % 0 % 0 % 0 % 6.15 %
1×SFf 1.30 % 40.47 % 39.77 % 0 % 4.54 %
nothing 0 % 39.95 % 32.85 % 100 % 3.67 %
Overall efficiency
The overall efficiency is calculated from the transport efficiency and the detection ef-
ficiency in COMPACT based on the decay properties reported from [8]. The overall
efficiency for detection of 269Hs (T1/2∼ 10 s) in the 36S + 238U experiments is 54%, for
detection of 270Hs (T1/2∼ 23 s) 60%, and for detection of 271Hs (T1/2∼ 4 s) 44% in case
of an α-decay of 267Sg and 48% in case of an SF-decay of 267Sg. These overall efficiencies
are significantly higher than those of kinematic separators for this type of reaction, which
typically are ∼ 20 − 30% and allow to measure products from a nuclear reaction with

Analysis of the experimental data 99
a production cross section on the level of a few picobarns. Especially for asymmetric
nuclear fusion reactions, like 36S + 238U or 26Mg + 248Cm, chemistry experiments have
a much higher efficiency than experiments with kinematic separators due to momentum
systematics.
3.4 Time correlation search
Time differences between detected events can be used for the correlation search of the
characteristic decay chain patterns in α and SF background, because a cascade of subse-
quent decays is the expected decay pattern of Hs nuclei. The background is considered
to be stochastic and hence it can be treated mathematically by the use of a Poisson
distribution. However, the possibility, that a correlated decay sequence is formed by
random background of uncorrelated events has to be carefully considered.
The number of expected pseudo-correlated background events can be calculated by
correlation search methods and parameters. Two correlation search methods can be
found in the literature:
Subsequent time windows - After a start signal (detection of a first potential mem-
ber of a decay chain), a time window is opened, large enough to include any fol-
lowing decay of the daughter nucleus. If in this time window a correlated event is
observed, a next window is opened, starting immediately after the most recently
found event, to search for another correlated event. The procedure is subsequently
repeated, until no further event is detected. This method is described in [100].
Single time window - After a start signal (detection of a first potential member of a
decay chain), a time window of defined length is opened and only correlated events
within this window are searched for. This procedure was used in [79].
The two methods are compared in terms of the number of expected random cor-
relations and search efficiency for a real decay chain in [8]. In the following, only the
subsequent time windows method is used for estimating the number of pseudo correlated
chains for the two parts of the experimental campaign conducted in the year 2008. In
the irradiation, one correlated α-SF chain was observed, attributed to the decay of a270Hs nucleus. Experimental parameters are summarized in Table 3.7 (first part of the
experiment) and Table 3.8 (second part of the experiment).

100 Analysis of the experimental data
Table 3.7: Set of parameters from data obtained from an irradiation with anexcitation energy of E∗ = 39± 4 MeV
Parameter Value Description
Texp 93 h Total time of irradiation
NTotalα 351 Number of detected α-particles
NSF 6 Number of detected SF events
NCD 6 Number of PIPS diodes for pos. corr.
ND 64 Total number of PIPS diodes
tc 300 s Correlation time window
Table 3.8: Set of parameters from data obtained from an irradiation with anexcitation energy of E∗ = 51± 3 MeV
Parameter Value Description
Texp 148.62 h Total time of irradiation
NTotalα 771 Number of detected α-particles
NSF 13 Number of detected SF events
NCD 6 Number of PIPS diodes for pos. corr.
ND 64 Total number of PIPS diodes
tc 300 s Correlation time window
The COMPACT detector consists of two arrays of 32 PIPS diodes. Events are
searched not only based on time correlation, but also on position correlation. Only
events detected in the same or neighboring two detector pairs are considered to be
position correlated. Hence, the average number of α-particles, which are in position
correlation to a detected SF decay is reduced to:
Nα =NCD
ND
×NTotalα (3.12)
Mean count rates of α-decays and SF-events, are defined as:

Analysis of the experimental data 101
λα =Nα
Texp, and λSF =
NSF
Texp(3.13)
3.4.1 Correlation search in subsequent time windows
For calculation of the number of expected random correlations, when the correlation is
searched in subsequent time windows, several methods can be employed.
Method proposed in [100]:
This method is described in detail in reference[100]. The number of expected random
correlations nb for K different event groups is:
nb = Texp
K∏i=1
λi( K∑i=1
λi
)K−1
K−1∏j=1
(1− e−
∑Ki=1 λi∆tj,j+1
)(3.14)
where λi is the mean counting rate for event group i and ∆t is the time interval
between successive events. In our experiment, for an α-SF correlation K = 2 (α and
SF).
nb = TexpλSF ·λαλSF + λα
[1− e−tc(λSF+λα)
](3.15)
For an α-α-SF correlation (K = 3), where the α-particles have free order, the follow-
ing formula was proposed:
nb = TexpλSF ·λ2
α
(λSF + λα)2
[1− e−tc(λSF+2 ·λα)
]2
(3.16)
Finally, for an α-α-α-α correlation (K = 4) follows:
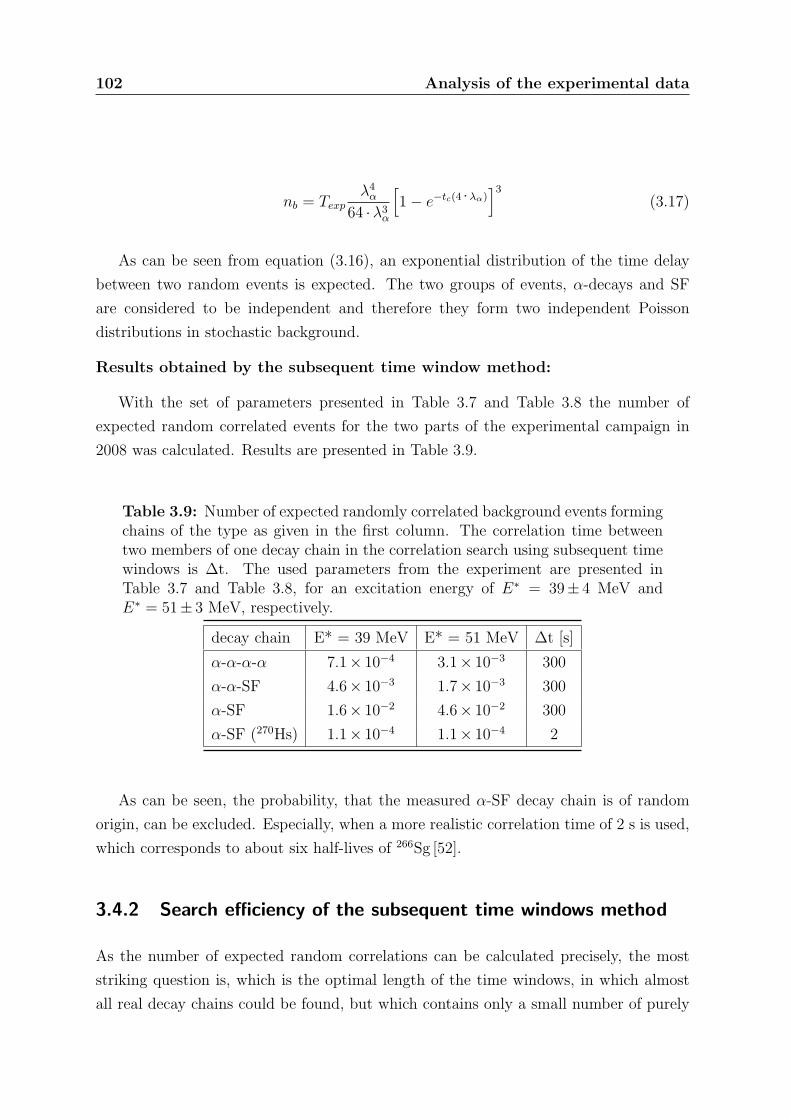
102 Analysis of the experimental data
nb = Texpλ4α
64 ·λ3α
[1− e−tc(4 ·λα)
]3
(3.17)
As can be seen from equation (3.16), an exponential distribution of the time delay
between two random events is expected. The two groups of events, α-decays and SF
are considered to be independent and therefore they form two independent Poisson
distributions in stochastic background.
Results obtained by the subsequent time window method:
With the set of parameters presented in Table 3.7 and Table 3.8 the number of
expected random correlated events for the two parts of the experimental campaign in
2008 was calculated. Results are presented in Table 3.9.
Table 3.9: Number of expected randomly correlated background events formingchains of the type as given in the first column. The correlation time betweentwo members of one decay chain in the correlation search using subsequent timewindows is ∆t. The used parameters from the experiment are presented inTable 3.7 and Table 3.8, for an excitation energy of E∗ = 39± 4 MeV andE∗ = 51± 3 MeV, respectively.
decay chain E* = 39 MeV E* = 51 MeV ∆t [s]
α-α-α-α 7.1× 10⁻⁴ 3.1× 10⁻³ 300
α-α-SF 4.6× 10⁻³ 1.7× 10⁻³ 300
α-SF 1.6× 10⁻² 4.6× 10⁻² 300
α-SF (270Hs) 1.1× 10⁻⁴ 1.1× 10⁻⁴ 2
As can be seen, the probability, that the measured α-SF decay chain is of random
origin, can be excluded. Especially, when a more realistic correlation time of 2 s is used,
which corresponds to about six half-lives of 266Sg [52].
3.4.2 Search efficiency of the subsequent time windows method
As the number of expected random correlations can be calculated precisely, the most
striking question is, which is the optimal length of the time windows, in which almost
all real decay chains could be found, but which contains only a small number of purely

Analysis of the experimental data 103
randomly correlated events formed by background. In the experiment, the real data form
decay sequences, so that the time delay between the decay of chain members follows an
exponential decay distribution. In the case of known half-lives of the members of a
decay chain the probability to observe the decay chain in subsequent time windows can
be calculated as:
Psubseq =K∏i=1
(1− e
−∆ti,i+1ln(2)
(T1/2)i
)(3.18)
where K is the number of chain members after the initial decay, ∆ti,i+1 is the time
window for the search of member i and (T1/2)i is the half-life of member i. The first α-
decay is used as the starting signal for the correlation search in the experiment, because
no information on the time of formation of a Hs atom is available. Resulting efficiencies
for the search of decay chains in our experiments using 300 s time windows (as used
in the actual data analysis) are shown in Table 3.10. A crucial point of the correlation
search is the choice of a suitable time window. The choice of a 300 s time window
for correlation search in the recent experiment is based on the observation from former
experiments [8] about the decay properties of 267Sg and 261aRf, which have half-lives
that are relatively long in comparison to other decay products of 269−271Hs, resulting in
only 92% and 93% search efficiency for the 271Hs and 269Hs decay chains, respectively.
Clearly, a different time window length would be optimal for searches of different types
of decay chains, but a single time window length (300 s) was used in our experiment for
simplicity. Also a different choice of window lengths for decay members with different
half-lives, that further decreases the chance of false identification of correlated decay
chains of random origin, was not applied.
3.4.3 Conclusion on correlation search method
As shown in[8], the subsequent time window method is a powerful and useful tool to find
correlated decay pattern in the data. The time window length is a critical parameter
and has to be chosen carefully, to make an optimal trade-off between search efficiency
and number of expected random correlations. With the calculation of search efficiencies,
an optimal time window for every experiment can be found easily. In TUM experiments
on Hs chemistry the method of search in subsequent windows with a fixed time window
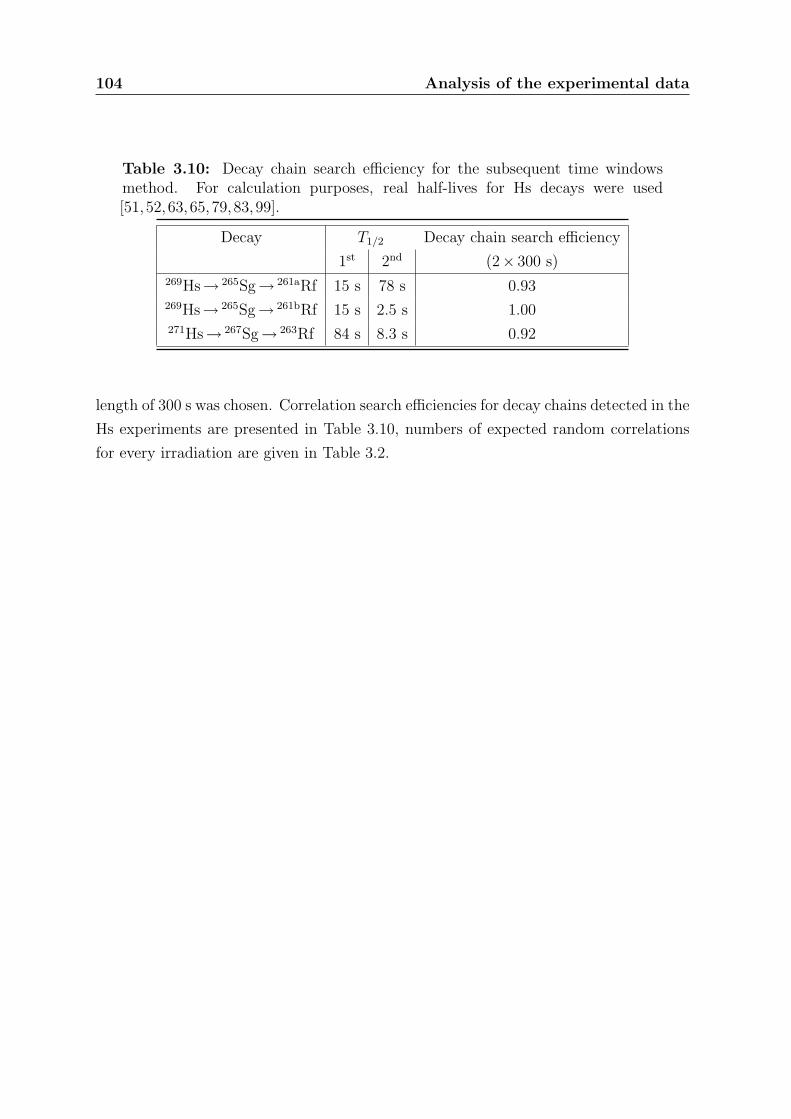
104 Analysis of the experimental data
Table 3.10: Decay chain search efficiency for the subsequent time windowsmethod. For calculation purposes, real half-lives for Hs decays were used[51,52,63,65,79,83,99].
Decay T1/2 Decay chain search efficiency
1st 2nd (2× 300 s)269Hs→ 265Sg→ 261aRf 15 s 78 s 0.93269Hs→ 265Sg→ 261bRf 15 s 2.5 s 1.00271Hs→ 267Sg→ 263Rf 84 s 8.3 s 0.92
length of 300 s was chosen. Correlation search efficiencies for decay chains detected in the
Hs experiments are presented in Table 3.10, numbers of expected random correlations
for every irradiation are given in Table 3.2.

Chapter 4
Results and discussion
In this section, all experiments and their results are presented. The experiments treated
in this thesis are, on the one hand, the TUM Hs chemistry experiment dealing with the
reaction 36S+ 238U and on the other hand the DGFRS experiment about the reaction48Ca+ 226Ra performed by the FLNR in collaboration with the institute of radiochem-
istry of the TUM. The results on the TUM Hs chemistry experiment is presented in
Section 4.1. The results on the DGFRS experiment is presented in Section 4.2. A
detailed discussion of the excitation functions obtained from nuclear fusion reactions
containing the experiments performed in the framework of this thesis and the experi-
ments performed in the framework of [8] can be found in Section 4.3. Finally new decay
properties of Hs isotopes obtained from these experiments are presented in Section 4.4.
4.1 TUM chemistry experiments
During the irradiation of the first target, the first excitation energy of E* = (39± 4)
MeV (Elab = (179.5± 4.5) MeV) was investigated. The duration of the irradiation was
5 days with a typical beam intensity of 300 pnA and an integral of 5.74 · 1017 36S ions
was collected. This corresponds to an one event cross section limit of about 1.4 pb.
During the irradiation of the second target, the second excitation energy of E* =
(51± 3) MeV (Elab = (193.5± 3.5) MeV) was measured. This irradiation took 7 days
with a typical beam intensity of 350 pnA. An beam integral of 1.03 · 1018 36S ions was
achieved corresponding to an one event cross section limit of 0.78 pb.
105
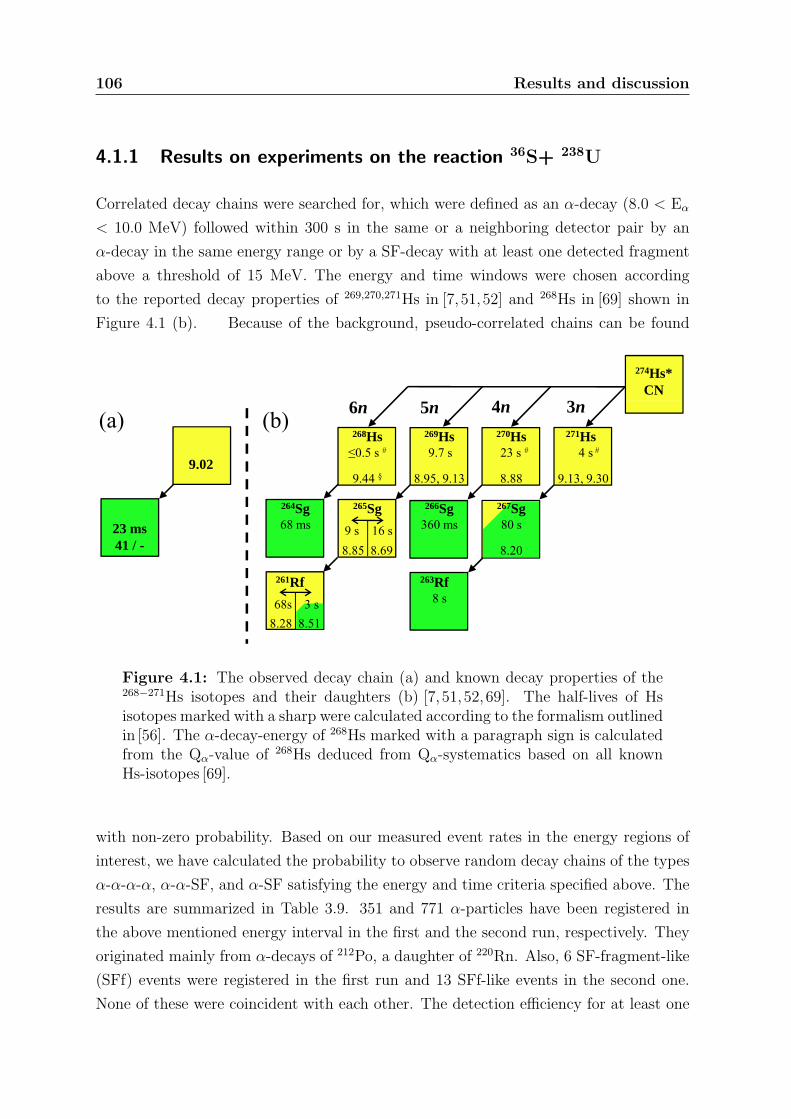
106 Results and discussion
4.1.1 Results on experiments on the reaction 36S+ 238U
Correlated decay chains were searched for, which were defined as an α-decay (8.0 < Eα
< 10.0 MeV) followed within 300 s in the same or a neighboring detector pair by an
α-decay in the same energy range or by a SF-decay with at least one detected fragment
above a threshold of 15 MeV. The energy and time windows were chosen according
to the reported decay properties of 269,270,271Hs in [7, 51,52] and 268Hs in [69] shown in
Figure 4.1 (b). Because of the background, pseudo-correlated chains can be found
274Hs*CN
4 3268Hs≤0.5 s #
9.44 §
269Hs9.7 s
8.95, 9.13
270Hs23 s #
8.889.02
4n5n6n(a) (b)271Hs
4 s #
9.13, 9.30
3n
264Sg 68 ms
266Sg360 ms
265Sg9 s 16 s8.85 8.69
23 ms41 / -
267Sg80 s
8.20
261Rf68s 3 s
8.28 8.51
263Rf8 s
Figure 4.1: The observed decay chain (a) and known decay properties of the268−271Hs isotopes and their daughters (b) [7, 51, 52,69]. The half-lives of Hsisotopes marked with a sharp were calculated according to the formalism outlinedin [56]. The α-decay-energy of 268Hs marked with a paragraph sign is calculatedfrom the Qα-value of 268Hs deduced from Qα-systematics based on all knownHs-isotopes [69].
with non-zero probability. Based on our measured event rates in the energy regions of
interest, we have calculated the probability to observe random decay chains of the types
α-α-α-α, α-α-SF, and α-SF satisfying the energy and time criteria specified above. The
results are summarized in Table 3.9. 351 and 771 α-particles have been registered in
the above mentioned energy interval in the first and the second run, respectively. They
originated mainly from α-decays of 212Po, a daughter of 220Rn. Also, 6 SF-fragment-like
(SFf) events were registered in the first run and 13 SFf-like events in the second one.
None of these were coincident with each other. The detection efficiency for at least one
Results and discussion 107
fragment is 94%, for both fragments, it is 76%.
Hence, the probability to register always only one fragment out of 6 or 13 SFf events
was determined to be extremely low (5 · 10−5 and 5 · 10−10, respectively). Thus, the
SFf-like background originated mostly from background radiation induced by cosmic
radiation or possibly electronic noise and not from real fission events. The data analysis
revealed only one correlated decay chain at the higher excitation energy E*=51 MeV.
A 9.02+0.05−0.10 MeV α-particle was observed in the bottom detector #24 and was followed
after 23 ms by one 41 MeV fission fragment measured in the top detector #24, as
illustrated in Figure 4.1 (a). The temperature of that detector was around -60 ◦C, which
situates in the temperature range, where hassium atoms have been deposited in former
experiments [7, 51,52]. Furthermore, no contaminations from non-volatile actinides and
minor transactinides have been observed. Also the α-decay-energy of about 9 MeV
points to a decay of Hassium. Measured events could also origin from a coincidental α-
decay of 212Po (Eα = 8.784 MeV) and β− decay resulting in a pile-up in the energy range
of the measured α-event. However, due to the very low number of expected randomly
correlated 270Hs events (3.1× 10⁻⁴ see Table 3.9), this chain is clearly attributed to a real
decay of 270Hs. The energy and energy resolution of detector pair #24 bottom where the
relevant α-particle was observed was calibrated offline with 219Rn-215Po decay chains,
measured in the same detector pair, occurring in a time window around this event.
At E* = (51± 3) MeV, 270Hs, 269Hs, and 268Hs formed in the 4n, 5n, and 6n exit
channels, respectively, are expected to be produced with significant cross sections. The
observation of other exit channels at this excitation energy is highly unlikely. The
SF following 23 ms after the α-emission may be attributed to the decay of 264Sg, as
it is well compatible with the reported half-life of 264Sg of T1/2 = 68+37−18 ms [67,68].
This assignment implies a preceding α-decay of 268Hs, produced in the 6n evaporation
channel. From Q-value interpolations of all known Hs isotopes, an α-decay-energy of
about 9.44 MeV can be deduced [69]. Because of the significant deviation between this
value and the measured α-particle-energy of 9.02+0.05−0.10 MeV, 268Hs can quite certainly be
excluded as the correct assignment. From results of a chemical search experiment for
this nuclide follows that its half-life is most likely ≤ 0.5 s [69], which is short compared
to the transport time of the experimental set-up (2 s). This significantly reduces the
overall efficiency for such short-lived species. Hence, assignment to 268Hs would imply
the cross section for the 6n evaporation channel to be much higher than that for the 5n
evaporation channel, in contrast to expectations based on hot fusion excitation function
systematics. The measured α-decay could thus be attributed to the decay of 269Hs or
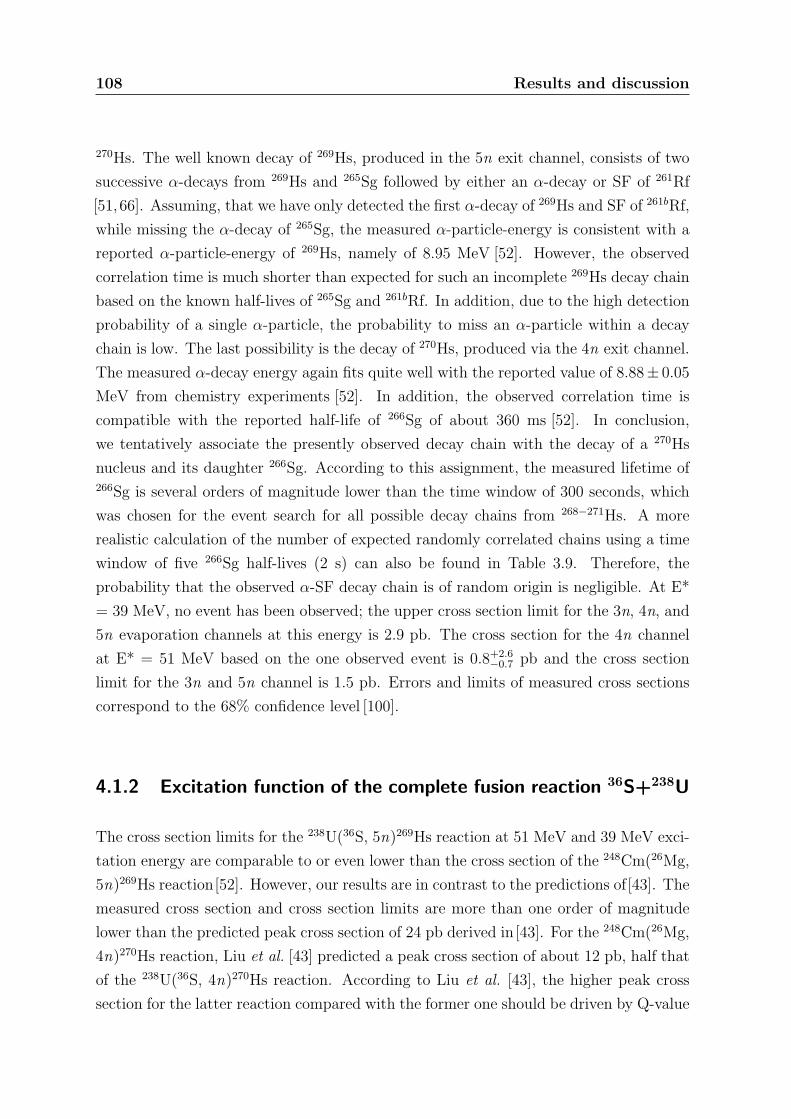
108 Results and discussion
270Hs. The well known decay of 269Hs, produced in the 5n exit channel, consists of two
successive α-decays from 269Hs and 265Sg followed by either an α-decay or SF of 261Rf
[51,66]. Assuming, that we have only detected the first α-decay of 269Hs and SF of 261bRf,
while missing the α-decay of 265Sg, the measured α-particle-energy is consistent with a
reported α-particle-energy of 269Hs, namely of 8.95 MeV [52]. However, the observed
correlation time is much shorter than expected for such an incomplete 269Hs decay chain
based on the known half-lives of 265Sg and 261bRf. In addition, due to the high detection
probability of a single α-particle, the probability to miss an α-particle within a decay
chain is low. The last possibility is the decay of 270Hs, produced via the 4n exit channel.
The measured α-decay energy again fits quite well with the reported value of 8.88± 0.05
MeV from chemistry experiments [52]. In addition, the observed correlation time is
compatible with the reported half-life of 266Sg of about 360 ms [52]. In conclusion,
we tentatively associate the presently observed decay chain with the decay of a 270Hs
nucleus and its daughter 266Sg. According to this assignment, the measured lifetime of266Sg is several orders of magnitude lower than the time window of 300 seconds, which
was chosen for the event search for all possible decay chains from 268−271Hs. A more
realistic calculation of the number of expected randomly correlated chains using a time
window of five 266Sg half-lives (2 s) can also be found in Table 3.9. Therefore, the
probability that the observed α-SF decay chain is of random origin is negligible. At E*
= 39 MeV, no event has been observed; the upper cross section limit for the 3n, 4n, and
5n evaporation channels at this energy is 2.9 pb. The cross section for the 4n channel
at E* = 51 MeV based on the one observed event is 0.8+2.6−0.7 pb and the cross section
limit for the 3n and 5n channel is 1.5 pb. Errors and limits of measured cross sections
correspond to the 68% confidence level [100].
4.1.2 Excitation function of the complete fusion reaction 36S+238U
The cross section limits for the 238U(36S, 5n)269Hs reaction at 51 MeV and 39 MeV exci-
tation energy are comparable to or even lower than the cross section of the 248Cm(26Mg,
5n)269Hs reaction[52]. However, our results are in contrast to the predictions of[43]. The
measured cross section and cross section limits are more than one order of magnitude
lower than the predicted peak cross section of 24 pb derived in[43]. For the 248Cm(26Mg,
4n)270Hs reaction, Liu et al. [43] predicted a peak cross section of about 12 pb, half that
of the 238U(36S, 4n)270Hs reaction. According to Liu et al. [43], the higher peak cross
section for the latter reaction compared with the former one should be driven by Q-value
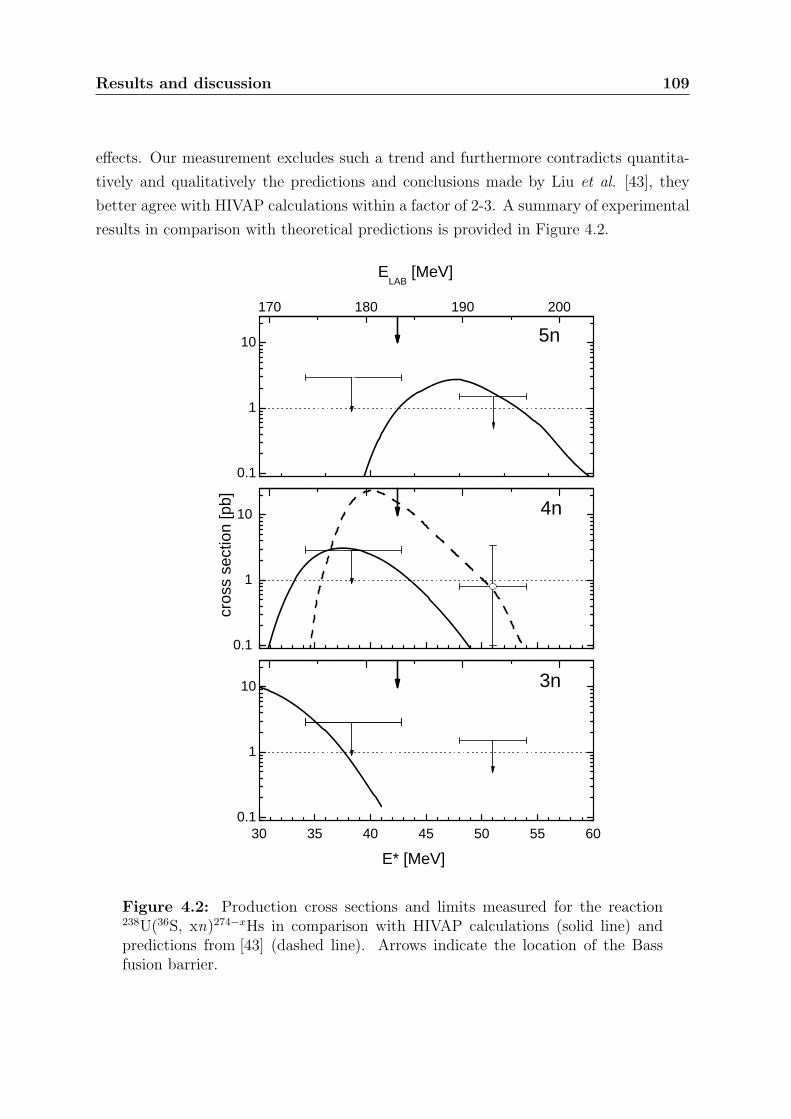
Results and discussion 109
effects. Our measurement excludes such a trend and furthermore contradicts quantita-
tively and qualitatively the predictions and conclusions made by Liu et al. [43], they
better agree with HIVAP calculations within a factor of 2-3. A summary of experimental
results in comparison with theoretical predictions is provided in Figure 4.2.
30 35 40 45 50 55 600.1
1
10
170 180 190 200
cros
s se
ctio
n [p
b]
3n
0.1
1
10
ELAB
[MeV]
E* [MeV]
4n
0.1
1
10
5n
Figure 4.2: Production cross sections and limits measured for the reaction238U(36S, xn)274−xHs in comparison with HIVAP calculations (solid line) andpredictions from [43] (dashed line). Arrows indicate the location of the Bassfusion barrier.
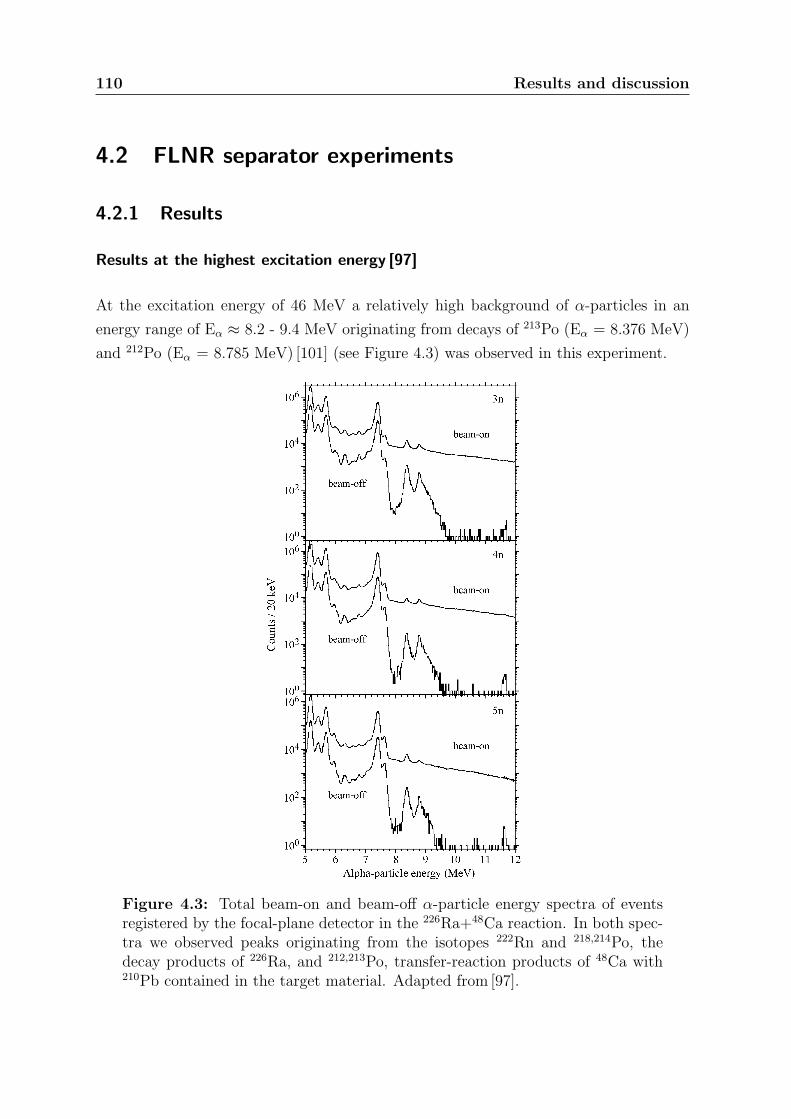
110 Results and discussion
4.2 FLNR separator experiments
4.2.1 Results
Results at the highest excitation energy [97]
At the excitation energy of 46 MeV a relatively high background of α-particles in an
energy range of Eα ≈ 8.2 - 9.4 MeV originating from decays of 213Po (Eα = 8.376 MeV)
and 212Po (Eα = 8.785 MeV) [101] (see Figure 4.3) was observed in this experiment.
FIG. 1. Total beam-on and beam-off α-particle energy spectra of events registered by the focal-plane detector in the 226Ra+48Ca reaction. In both spectra we observe the peaks originating fromisotopes 222Rn and 218,214Po, the decay products of 226Ra, and 212,213Po, the transfer-reaction productsof 48Ca with 210Pb contained in the target material.
Figure 4.3: Total beam-on and beam-off α-particle energy spectra of eventsregistered by the focal-plane detector in the 226Ra+48Ca reaction. In both spec-tra we observed peaks originating from the isotopes 222Rn and 218,214Po, thedecay products of 226Ra, and 212,213Po, transfer-reaction products of 48Ca with210Pb contained in the target material. Adapted from [97].
Results and discussion 111
These isotopes were detected also in previous 48Ca experiments dealing with 238U-249Cf target nuclei, but with lower rates (see e.g., [102]). 210Pb is created as a decay
product by successive α-decays of 226Ra. Therefore, the isotopes 212,213Bi can be pro-
duced in the +p+n- and +p+2n-transfer reactions on 210Pb, as the target impurity. The
expected α-particle-energy interval for the decay of 265Sg [66], the daughter-product of
the 226Ra(48Ca,n)269Hs reaction is Eα = 8.5 - 9.0 MeV. The average counting rate of
α-particles within this energy interval was 5 · 10−3 per minute within a 3-mm position
window of each strip during the beam-off intervals. However, because of the relatively
long half-life of 269Hs (T1/2 = 9.7 s [64, 103]), a relatively long time interval between
EVR-like and α-like events for switching the beam off had to be used, resulting overall
in a long beam-off period and hence a lower collected beam integral. Thus, over the
whole experiment, about five random beam-off α-particles within the energy interval
could follow random ER-α correlations in the same position within one minute. Six
such ER-α-αoff events were found in the data which is in good agreement with the
number of expected random correlated events. No further α-particles with Eα = 8.0 -
8.7 MeV in the same strip and position within the 3-min beam-off interval have been
found.
The shorter decay branch of 269Hs [66] that should be ended by spontaneous fission
of 261Rf was used to estimates the upper limit of the production cross section for the226Ra(48Ca,5n)269Hs reaction. The α-decay of the isotope 269Hs leads to spontaneous
fission of 261Rf in 80% of all cases [63,66], with an energy release of more than 100 MeV
in most fissions. Also in SHE experiments of 48Ca-induced complete fusion reactions
with 238U-249Cf targets [104] the released energies during the SF exceeded 135 MeV in
81 of 84 cases observed. Furthermore, symmetric SF with a high energy release could be
expected, because the products of the 226Ra+48Ca reaction are located near the neutron
shell closure at N = 162. 20 high-energy events with E > 135 MeV have been registered,
but only one of them was detected by both the focal-plane and the box detectors. Only
a few of them should originate from SF, due to the 40%-detection efficiency of both SF
fragments. Most of these high-energy events can be explained by scattered projectiles
that were not registered by the TOF system. A lighter and faster particle compared
with the EVR, passing the TOF, is losing less energy and creating less ionization and
hence the TOF signal is much lower, sometimes less than the threshold.
In this experiment decay chains of the type EVR-α-SF (EEV R = 7.5 - 16.5 MeV, Eα
= 8.8 - 9.45 MeV, ∆tEV R−α ≤ 60 s, ESF > 135 MeV, ∆tα−SF ≤ 150 s) were searched
for to find decay chains of 269Hs. Such chains were not found which results in an upper
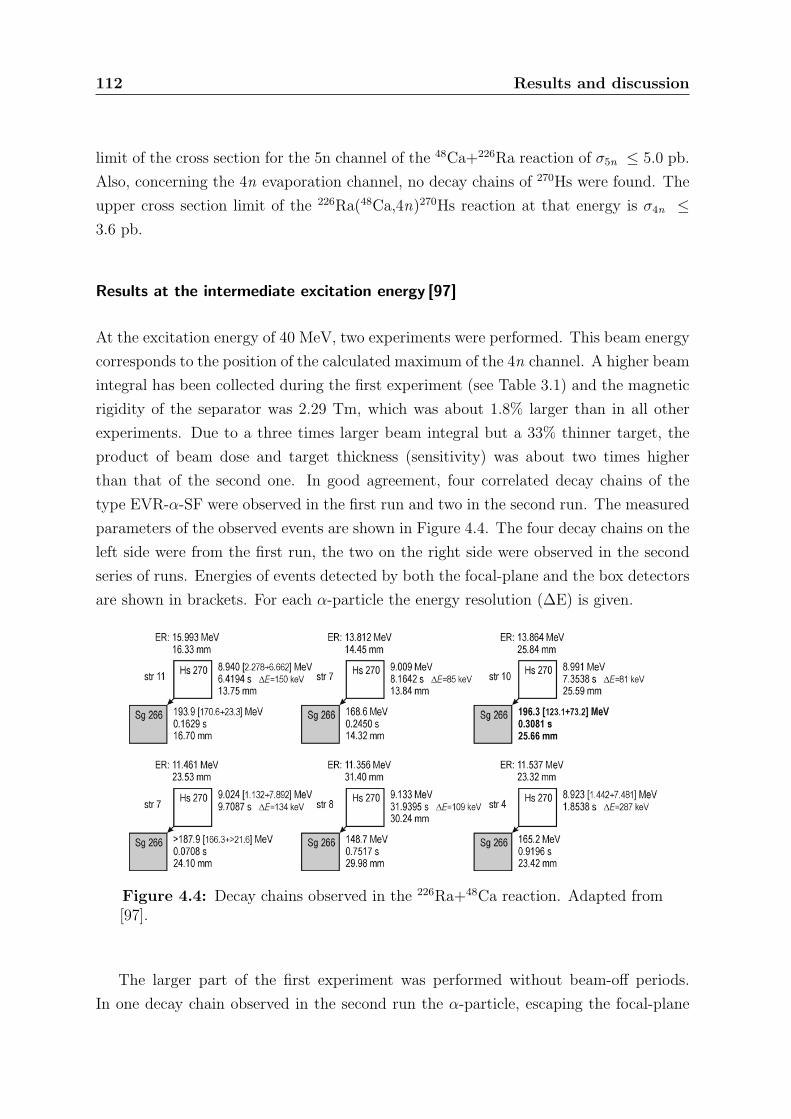
112 Results and discussion
limit of the cross section for the 5n channel of the 48Ca+226Ra reaction of σ5n ≤ 5.0 pb.
Also, concerning the 4n evaporation channel, no decay chains of 270Hs were found. The
upper cross section limit of the 226Ra(48Ca,4n)270Hs reaction at that energy is σ4n ≤3.6 pb.
Results at the intermediate excitation energy [97]
At the excitation energy of 40 MeV, two experiments were performed. This beam energy
corresponds to the position of the calculated maximum of the 4n channel. A higher beam
integral has been collected during the first experiment (see Table 3.1) and the magnetic
rigidity of the separator was 2.29 Tm, which was about 1.8% larger than in all other
experiments. Due to a three times larger beam integral but a 33% thinner target, the
product of beam dose and target thickness (sensitivity) was about two times higher
than that of the second one. In good agreement, four correlated decay chains of the
type EVR-α-SF were observed in the first run and two in the second run. The measured
parameters of the observed events are shown in Figure 4.4. The four decay chains on the
left side were from the first run, the two on the right side were observed in the second
series of runs. Energies of events detected by both the focal-plane and the box detectors
are shown in brackets. For each α-particle the energy resolution (∆E) is given.
FIG. 2. Decay chains observed in the 226Ra+48Ca reaction. Figure 4.4: Decay chains observed in the 226Ra+48Ca reaction. Adapted from
[97].
The larger part of the first experiment was performed without beam-off periods.
In one decay chain observed in the second run the α-particle, escaping the focal-plane
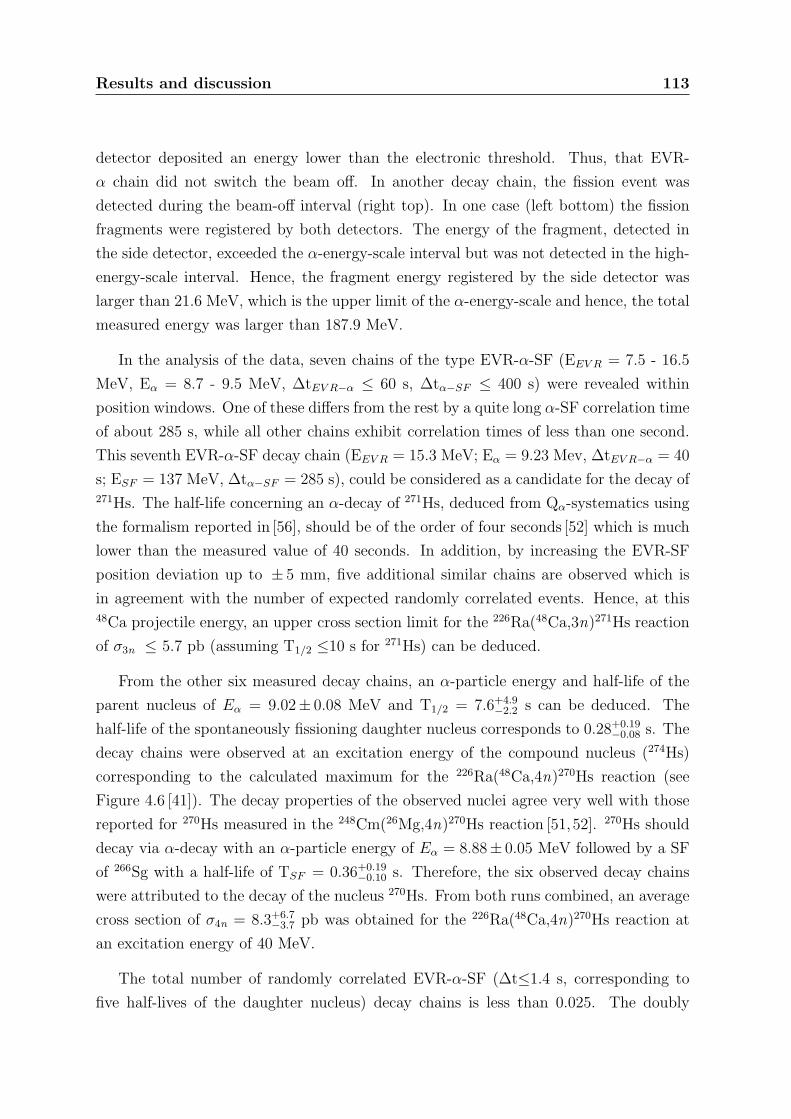
Results and discussion 113
detector deposited an energy lower than the electronic threshold. Thus, that EVR-
α chain did not switch the beam off. In another decay chain, the fission event was
detected during the beam-off interval (right top). In one case (left bottom) the fission
fragments were registered by both detectors. The energy of the fragment, detected in
the side detector, exceeded the α-energy-scale interval but was not detected in the high-
energy-scale interval. Hence, the fragment energy registered by the side detector was
larger than 21.6 MeV, which is the upper limit of the α-energy-scale and hence, the total
measured energy was larger than 187.9 MeV.
In the analysis of the data, seven chains of the type EVR-α-SF (EEV R = 7.5 - 16.5
MeV, Eα = 8.7 - 9.5 MeV, ∆tEV R−α ≤ 60 s, ∆tα−SF ≤ 400 s) were revealed within
position windows. One of these differs from the rest by a quite long α-SF correlation time
of about 285 s, while all other chains exhibit correlation times of less than one second.
This seventh EVR-α-SF decay chain (EEV R = 15.3 MeV; Eα = 9.23 Mev, ∆tEV R−α = 40
s; ESF = 137 MeV, ∆tα−SF = 285 s), could be considered as a candidate for the decay of271Hs. The half-life concerning an α-decay of 271Hs, deduced from Qα-systematics using
the formalism reported in [56], should be of the order of four seconds [52] which is much
lower than the measured value of 40 seconds. In addition, by increasing the EVR-SF
position deviation up to ± 5 mm, five additional similar chains are observed which is
in agreement with the number of expected randomly correlated events. Hence, at this48Ca projectile energy, an upper cross section limit for the 226Ra(48Ca,3n)271Hs reaction
of σ3n ≤ 5.7 pb (assuming T1/2 ≤10 s for 271Hs) can be deduced.
From the other six measured decay chains, an α-particle energy and half-life of the
parent nucleus of Eα = 9.02± 0.08 MeV and T1/2 = 7.6+4.9−2.2 s can be deduced. The
half-life of the spontaneously fissioning daughter nucleus corresponds to 0.28+0.19−0.08 s. The
decay chains were observed at an excitation energy of the compound nucleus (274Hs)
corresponding to the calculated maximum for the 226Ra(48Ca,4n)270Hs reaction (see
Figure 4.6 [41]). The decay properties of the observed nuclei agree very well with those
reported for 270Hs measured in the 248Cm(26Mg,4n)270Hs reaction [51,52]. 270Hs should
decay via α-decay with an α-particle energy of Eα = 8.88± 0.05 MeV followed by a SF
of 266Sg with a half-life of TSF = 0.36+0.19−0.10 s. Therefore, the six observed decay chains
were attributed to the decay of the nucleus 270Hs. From both runs combined, an average
cross section of σ4n = 8.3+6.7−3.7 pb was obtained for the 226Ra(48Ca,4n)270Hs reaction at
an excitation energy of 40 MeV.
The total number of randomly correlated EVR-α-SF (∆t≤1.4 s, corresponding to
five half-lives of the daughter nucleus) decay chains is less than 0.025. The doubly
114 Results and discussion
logarithmic distribution (number of events vs. time interval) for all EVR-like events
followed by α-decays shown in Figure 4.4 and registered within two EVR-α or EVR-
SF position resolutions is presented in Figure 4.5. For all measured six decay chains,
54 EVR-like events were found within a 4000-s time window, indicating that the total
number of random EVR-like events detected during five half-lives of the parent nucleus
is about 0.4. In the experiments also EVR-SF chains were found. There are two possible
explanations for such chains, an escaping α-particle of the decay of 270Hs or a SF decay
branch for 270Hs.
FIG. 3. Time intervals between α particles shown in Fig. 2 and all the preceding ER-like eventsobserved within two ER-α or ER-SF position resolutions (±2.35 standard deviations). Timeintervals for the nearest ER events assigned to implantation of 270Hs in detectors in Fig. 2 are shownby arrows. Dash line shows distribution dN/d(lg10 t) for T1/2=7.6 s. Dash-dot line shows linear fit forrandom ER-like events.
Figure 4.5: Time intervals between α-particles shown in Figure 4.4 and all thepreceding ER-like events observed within two ER-α or ER-SF position resolu-tions (± 2.35 standard deviations). Time intervals for the nearest ER eventsassigned to implantation of 270Hs in detectors in Figure 4.4 are shown by arrows.The dashed line shows the distribution of dN/d(lg10 t) for T1/2=7.6 s. Thedash-dotted line shows a linear fit for random ER-like events. Adapted from[97].
Concerning the first possibility, α-particles escaping from the focal-plane detector and
entering into the box detector were registered by the focal-plane detector with an effi-
ciency of 67% as determined for 217Th produced in the calibration reaction natYb+48Ca.
Hence, in addition to the six observed decay chains of 270Hs about three more decays
could be detected without registration of the escaping α-particle in the focal-plane de-
tector as EVR-SF chain. These α-particles can be detected in the side detector only.
Due to the relatively long half-life of 270Hs and the huge number of random α-like events
in the energy range of α-particles emitted in the decay of 270Hs, it is not possible to
distinguish between the background and these real 270Hs α-particles during beam-on
periods.
Results and discussion 115
A second explanation for the appearance of EVR-SF chains could be spontaneous
fission of the even-even isotope 270Hs. A SF half-life of 1.8 h is predicted in [54]. For
Rf isotopes, these calculations are in good agreement with experimental TSF values.
For 256Rf for example, the calculated value of TSF = 9.1 ms is in very good agreement
with the experimental value of TSF = 6.70± 0.09 ms. The calculated half-lives for Sg
and Hs isotopes with N = 156-162 are similar but become gradually longer than those
for Rf isotopes. The experimental values for Sg isotopes with N = 152-158 are lower
than those for Rf isotopes. Also the TSF value for 264Hs, is lower by a factor of 20
than its lighter isotone 262Sg. Hence, due to SF half-lives, systematically decreasing
with increasing proton number, it cannot be excluded that the TSF value for 270Hs will
be comparable with its partial α-decay half-life. In addition to six SF events shown in
Figure 4.4, 40 additional high-energy events with E > 135 MeV were found in the data.
Four of them were detected in the focal-plane as well as by the box detectors. From
a 40%-detection efficiency of both SF fragments one can expect that about a quarter
of these 40 events originates from SF. Hence, randomly correlated EVR-SF chains can
be created by these SF-like events in combination with random recoils. Nevertheless,
from an analysis concerning the time intervals between EVR-like and SF-like events
according to [105] including all events attributed to the decay of 270Hs, the existence of
a SF activity of 4 - 12 events with a half-life of 3.5+4.3−1.8 s can be assumed. The origin of
this activity can be assigned most likely to 252No which is producted from 48Ca induced
fusion reactions with 206Pb impurities contained in the target. Due to the age of the
target material, the FLNR has received the radium (226Ra) more than 50 years ago,
it had to be purified before a preparation of the target took place. This was done by
the coprecipitation with iron hydroxide and ion-exchange chromatography to separate
admixtures of different elements. Unfortunately, the separation from lead did not exceed
a factor of 10. About 1% of 226Ra atoms decayed to 206Pb. The consequence is a quite
high yield of byproducts from nuclear reactions with 206Pb, especially products from the
complete nuclear fusion reaction 48Ca+206Pb.
Results at the lowest excitation energy [97]
Finally, one experiment was performed at an excitation energy of 36 MeV. As mentioned
before, due to a lead contamination of the target material, created by the radioactive
decay of 226Ra, up to 1% of the target material consisted of 206Pb. The cross section
of the 2n evaporation channel of the reaction 206Pb(48Ca,2n)252No at E* = 36 MeV
is about 30 nb [106], which is quite high compared with the expected cross sections of
116 Results and discussion
the reaction 48Ca+226Ra, which should be of the order of some pb. However, the higher
magnetic rigidity in the present experiment (Bρ = 2.335 Tm) compared with the optimal
value for the 206Pb+48Ca reaction (Bρ = 2.12 Tm), is reducing the collection efficiency
for 252No by a factor of 4 to 5. Hence, one could expect more than five SF decays of252No in the data. In agreement with these estimations 5 - 15 SF events with a half-life
of 4.2+4.0−2.1 s [105] were found in the data.
53 high energy events with E > 135 MeV have been observed in this experiment,
16 of them were detected by the focal-plane detector, as well as by the box detectors.
Hence, due to the efficiency, about 40 events could originate from SF. The total yield
of SF events increases with decreasing projectile energy. Hence, these events could be
assigned to SF of lower-Z nuclei produced in reactions of 48Ca with target impurities
like the aforementioned 206Pb.
Similar to the experiments at an excitation energy of E* = 40 MeV, correlated chains
of the type EVR-α-SF (EEV R = 7.5 - 16.5 MeV; Eα = 8.7 - 9.5 MeV, ∆tEV R−α ≤ 60 s;
∆tα−SF ≤ 400 s) within position windows were searched for to identify decaying 271Hs.
Four correlated events were found with decay properties similar to those measured for
the decay of 271Hs [52]. By increasing the position deviation of EVR-SF correlations
up to ± 5 mm an increase in the number of similar chains can be observed. Hence,
all these chains cannot be statistically separated from randomly correlated events and
have to be discarded. At the same time, no chains with fission events registered during
beam-off periods have been observed and hence, only an upper cross section limit can be
given for the 226Ra(48Ca,3n)271Hs reaction. Due to the unknown half-life of 271Hs, the
upper limit differs according to the chosen half-lives of 271Hs. An EVR-α time interval
of 8 s for beam off periods has been applied in the experiment, which corresponds to
two half-lives of 271Hs estimated in [52]. For T1/2(271Hs) = 4 s the upper cross section
limit is σ3n ≤ 4.2 pb. If the half-life of 271Hs is lower than T1/2(269Hs), similar to the
neighboring Ds isotopes with N = 161 and 163 (T1/2(271Ds) = 1.63 ms [101], T1/2(273Ds)
= 0.17 ms[64,103]), a half-life of T1/2(271Hs) = 1 s would result in an upper cross section
limit of σ3n ≤ 3.2 pb. If the half-life of 271Hs would be larger than that for 269Hs like
ten seconds or more the upper cross section limit increases to σ3n ≤ 6.9 pb.
Also at this measured excitation energy, no EVR-α-SF decay chains of 270Hs have
been observed. An upper cross section limit of the 226Ra(48Ca,4n)270Hs reaction of σ4n ≤1.6 pb can be deduced.
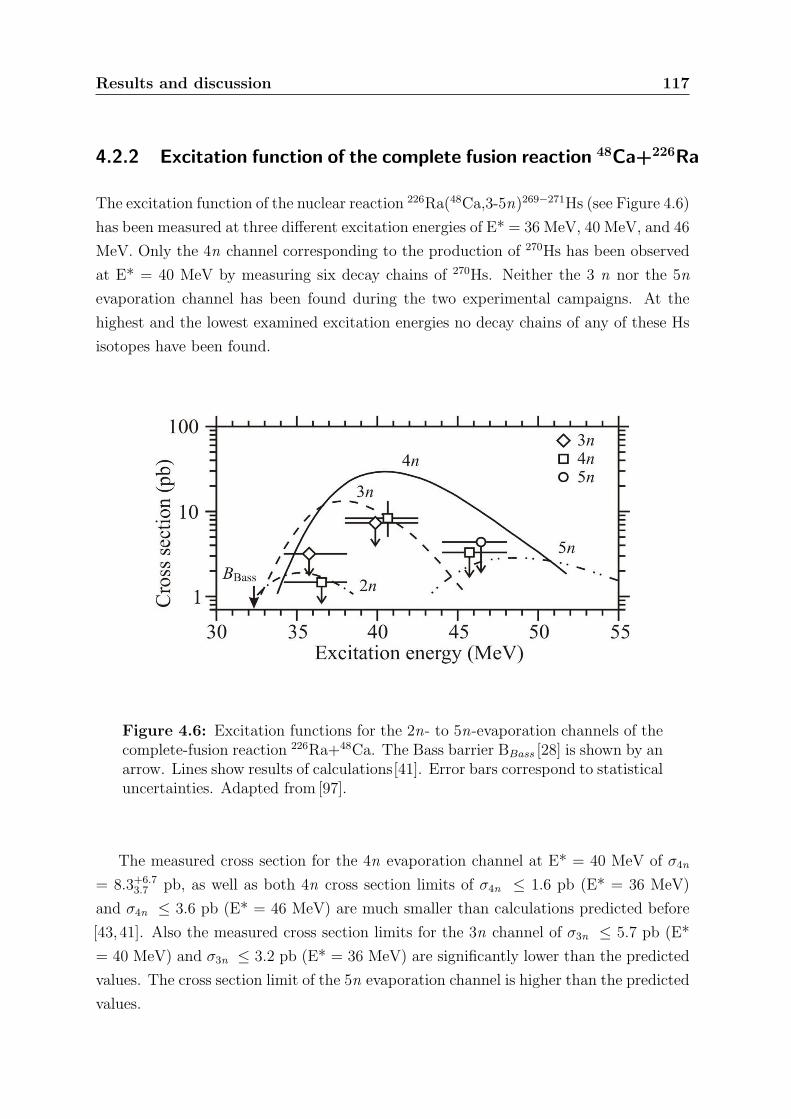
Results and discussion 117
4.2.2 Excitation function of the complete fusion reaction 48Ca+226Ra
The excitation function of the nuclear reaction 226Ra(48Ca,3-5n)269−271Hs (see Figure 4.6)
has been measured at three different excitation energies of E* = 36 MeV, 40 MeV, and 46
MeV. Only the 4n channel corresponding to the production of 270Hs has been observed
at E* = 40 MeV by measuring six decay chains of 270Hs. Neither the 3 n nor the 5n
evaporation channel has been found during the two experimental campaigns. At the
highest and the lowest examined excitation energies no decay chains of any of these Hs
isotopes have been found.
Figure 4.6: Excitation functions for the 2n- to 5n-evaporation channels of thecomplete-fusion reaction 226Ra+48Ca. The Bass barrier BBass [28] is shown by anarrow. Lines show results of calculations[41]. Error bars correspond to statisticaluncertainties. Adapted from [97].
The measured cross section for the 4n evaporation channel at E* = 40 MeV of σ4n
= 8.3+6.73.7 pb, as well as both 4n cross section limits of σ4n ≤ 1.6 pb (E* = 36 MeV)
and σ4n ≤ 3.6 pb (E* = 46 MeV) are much smaller than calculations predicted before
[43,41]. Also the measured cross section limits for the 3n channel of σ3n ≤ 5.7 pb (E*
= 40 MeV) and σ3n ≤ 3.2 pb (E* = 36 MeV) are significantly lower than the predicted
values. The cross section limit of the 5n evaporation channel is higher than the predicted
values.

118 Results and discussion
4.3 Discussion of the measured excitation functions
As described in Section 1.3.2, the cross section for evaporation residue production in
nuclear fusion reactions can be described as the sum over all partial waves of the prod-
uct of the penetrability of the multidimensional Coulomb barrier, the probability of
compound nucleus formation and the survival probability during the de-excitation of
the compound nucleus via successive neutron evaporation. While the first two terms
of the product reflect the formation process (entrance channel), the third term depends
on the properties of the CN and members of the evaporation cascade. As all fusion
reactions, 36S + 238U, 48Ca+226Ra, and 26Mg + 248Cm result in the same CN (274Hs),
the exit channel is nearly identical for all these reactions at the same excitation energy
(neglecting small differences in angular momentum of the compound nucleus after its
formation) and could not explain possible differences in the cross sections. Hence, they
must be due to the entrance channel. Since the incident energy of the projectile is above
the fusion barrier, the production cross section only depends on the compound nucleus
formation probability (PCN). As described in Section 1.3, this mainly depends on the
reaction asymmetry and the Q-value. Bass barrier, (B −Q)-values and reaction asym-
metry (Z1 ·Z2) for all aforementioned reactions leading to the CN 274Hs are displayed in
Table 4.1.
Table 4.1: Bass barrier, Q-value, (B − Q)-values, Z1 ·Z2 and measured maxi-mum cross section for various reactions leading to the CN 274Hs
Reaction B Q (B-Q) Z1 ·Z2 σ4n max σ5n max
[MeV] [MeV] [MeV] [pb] [pb]26Mg + 248Cm 126.9 -82.2 44.7 1152 2.8 6.9
(E*=40 MeV) (E*=49 MeV)30Si + 244Pu 144.0 -98.0 46.0 1316 - -36S + 238U 159.1 -116.7 42.4 1472 0.8 < 2.9
(E*=51 MeV) (E*=51 MeV)48Ca + 226Ra 187.0 -153.9 33.1 1760 8.3 < 5.0
(E*=40 MeV) (E*=46 MeV)
The aim of this work was to find an answer to the question which of the two param-
eters dominating PCN has the largest impact on the production of SHE and in which
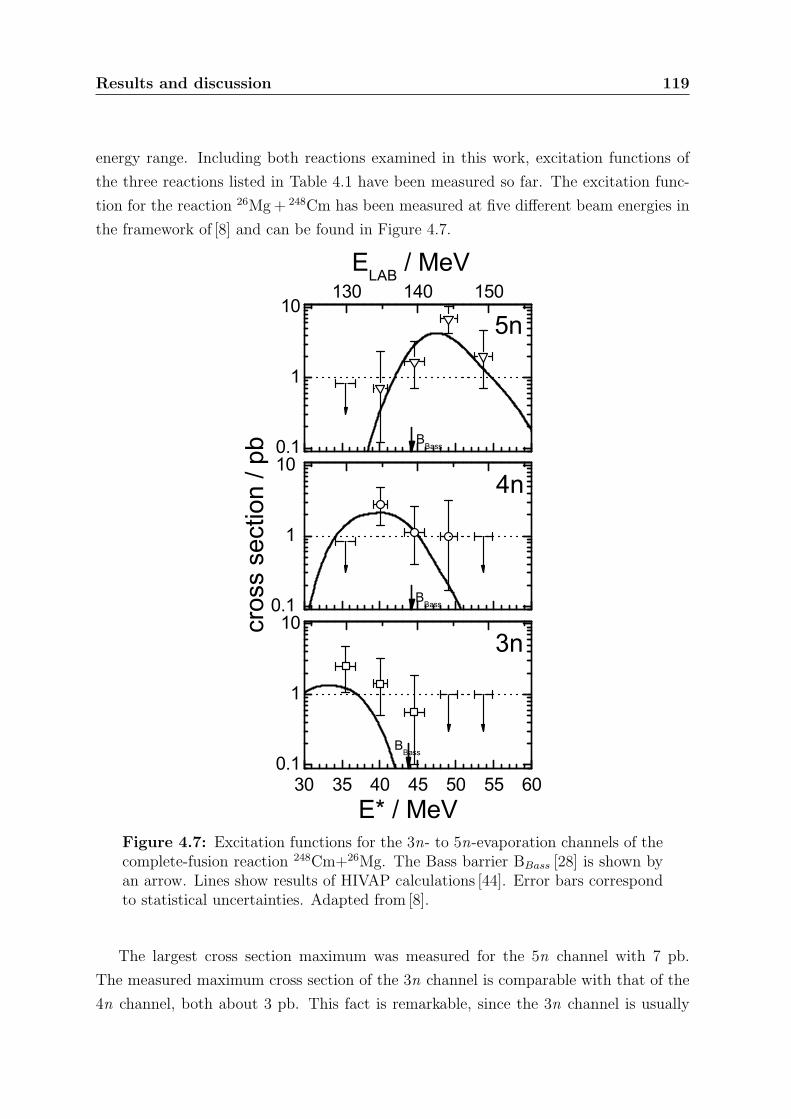
Results and discussion 119
energy range. Including both reactions examined in this work, excitation functions of
the three reactions listed in Table 4.1 have been measured so far. The excitation func-
tion for the reaction 26Mg + 248Cm has been measured at five different beam energies in
the framework of [8] and can be found in Figure 4.7.
30 35 40 45 50 55 600.1
1
10
130 140 150
cros
s se
ctio
n / p
b
3n
BBass
0.1
1
10
ELAB / MeV
BBass
E* / MeV
4n0.1
1
10
BBass
5n
Figure 4.7: Excitation functions for the 3n- to 5n-evaporation channels of thecomplete-fusion reaction 248Cm+26Mg. The Bass barrier BBass [28] is shown byan arrow. Lines show results of HIVAP calculations [44]. Error bars correspondto statistical uncertainties. Adapted from [8].
The largest cross section maximum was measured for the 5n channel with 7 pb.
The measured maximum cross section of the 3n channel is comparable with that of the
4n channel, both about 3 pb. This fact is remarkable, since the 3n channel is usually

120 Results and discussion
significantly suppressed in hot fusion reactions. Surprisingly, the maximum of the 3n
channel situates about 8 MeV below the Bass barrier (EBass = 44.7 MeV). This effect of
large production cross sections for incident energies below the barrier is caused by large
sub-barrier fusion enhancement, which has not only been observed in the reaction 26Mg
+ 248Cm[52] but also in recent experiments concerning orientation and coupled channels
effects on the production of superheavy elements in fusion reactions with 238U targets
[68,107,108]. Several theoretical calculations predicted such a significant enhancement
of sub-barrier fusion cross sections [25,109,110]. The subbarrier fusion enhancement is
caused by nuclear deformations of projectile and target nuclei and results in two different
modes of fusion, polar and equatorial configurations for strongly deformed fusioning
nuclei. As shown in [107], near polar orientations of the target nucleus concerning the
projectile do not contribute to fusion, they mainly lead to quasi-fission and hence to
a suppression. On the other side sub-barrier fusion enhancement is caused by coupled
channel effects of collective excitations of projectile and target nucleus.
Due to the measured sub-barrier enhancement for fusion reactions dealing with 16O
and 30Si projectiles and 238U targets, such effects could be also expected for the reaction36S+238U. This was not observed in our experiment. During the experimental campaign
on the reaction 36S+238U, one 270Hs event at E* = 51 MeV has been observed, above the
Coulomb barrier, where the difference in the CN formation probability, which depends
mainly on the asymmetry of the projectile - target combination, is expected to be the
dominant factor. The measured cross section and cross section limits in combination with
HIVAP calculations can be found in Figure 4.2. The cross section of the 4n evaporation
channel for this event is about 0.8 pb. The one event cross section limits (68% confidence
interval) for the 3n, 4n, and 5n evaporation channels at E* = 39 MeV are 2.9 pb, while
the cross section limits of the 3n and 5n channel at E* = 51 MeV are 1.5 pb. These
are comparable (4n) or even lower (5n) than the cross sections of the 26Mg+248Cm
reaction at a similar excitation energy. For the reaction 48Ca + 226Ra, no sub-barrier
enhancement was expected, due to nearly spherical projectile and target nucleus. This
is also confirmed by the experiments. At E* = 36 MeV, neither a 3n channel nor a
4n channel event has been measured resulting in upper limits for the EVR production
cross section of σ3n ≤ 1.6 pb and σ4n ≤ 3.2 pb. At E* = 40 MeV, the 4n evaporation
channel is dominant (see Figure 4.6) with a very high cross section of σ4n = 8.3+6.7−3.7
pb, which is about a factor of three times higher than the cross section for the same
channel and energy for the reaction 26Mg + 248Cm and even higher than for the reaction36S + 238U. The latter exhibits the lowest cross section of all three reactions at E* = 40
MeV. According to Table 4.1, that energy is situated below but near the barrier for the

Results and discussion 121
reactions 26Mg + 248Cm (∆E = E*-(B-Q) = -4.7 MeV) and 36S + 238U (∆E = E*-(B-Q)
= -2.4 MeV). Due to its large Q-value, the reaction 48Ca + 226Ra situates above the
barrier (∆E = E*-(B-Q) = +6.9 MeV) providing the largest cross section. Hence at
lower energies near the barrier, the (B-Q)-value and therefore the Q-value becomes the
dominant parameter for the production cross section.
At higher excitation energies, this picture has completely changed. At E* ≈ 50
MeV, the reaction 26Mg + 248Cm has the highest production cross section of all three
reactions with a maximum of about σ5n = 7 pb. In both reactions, 36S + 238U as well
as 48Ca + 226Ra, only upper cross section limits could be established σ5n ≤ 1.5 pb and
σ5n ≤ 5.0 pb, respectively. Again, it seems that the reaction 36S + 238U exhibits the
lowest cross section of all three reactions, but since we have only estimated upper limits
for the production cross sections for both reactions, this conclusion cannot be made in
this case. The dominant conclusion for this energy is, that at higher excitation energies,
the compound nucleus formation probability and hence the production cross section is
mainly driven by the reaction asymmetry, because of the large measured cross section
for the most asymmetric reaction 26Mg + 248Cm.
Both these main conclusions for hot fusion reactions on the dependence of the com-
pound nucleus formation probability are qualitatively in good agreement with measure-
ments and theoretical predictions for cold fusion reactions[41]. Zagrebaev[41] reports, as
described in Section 1.3.3, that the compound nucleus formation probability has on the
one hand a strong energy dependence, which is proportional to the position of the bar-
rier and therefore to the (B-Q)-value and, on the other hand, is strongly dependent on
the reaction asymmetry (Z1 ·Z2 in [41]). Qualitatively, this relation is also valid for hot
fusion reaction [42], which is reproduced by the comparison of all three fusion reactions.
In general, if the position of the fusion barrier is neglected, the maximum production
cross section for the evaporation of an additional neutron decreases by one order of
magnitude. This is caused by the competition between neutron evaporation and fission
of the excited nucleus for any further evaporated neutron, as long as the excitation
energy is higher than the fission barrier. The survival probability of the EVR during
each single neutron evaporation is determined by the ratio of the decay width for neutron
evaporation (Γn) and the total decay width (Γtot), which is mainly influenced by the
decay width for SF (Γf ) [26]:
Psur(AZX→ A−1
ZX + n)∼ ΓnΓtot∼ Γn
Γf(4.1)
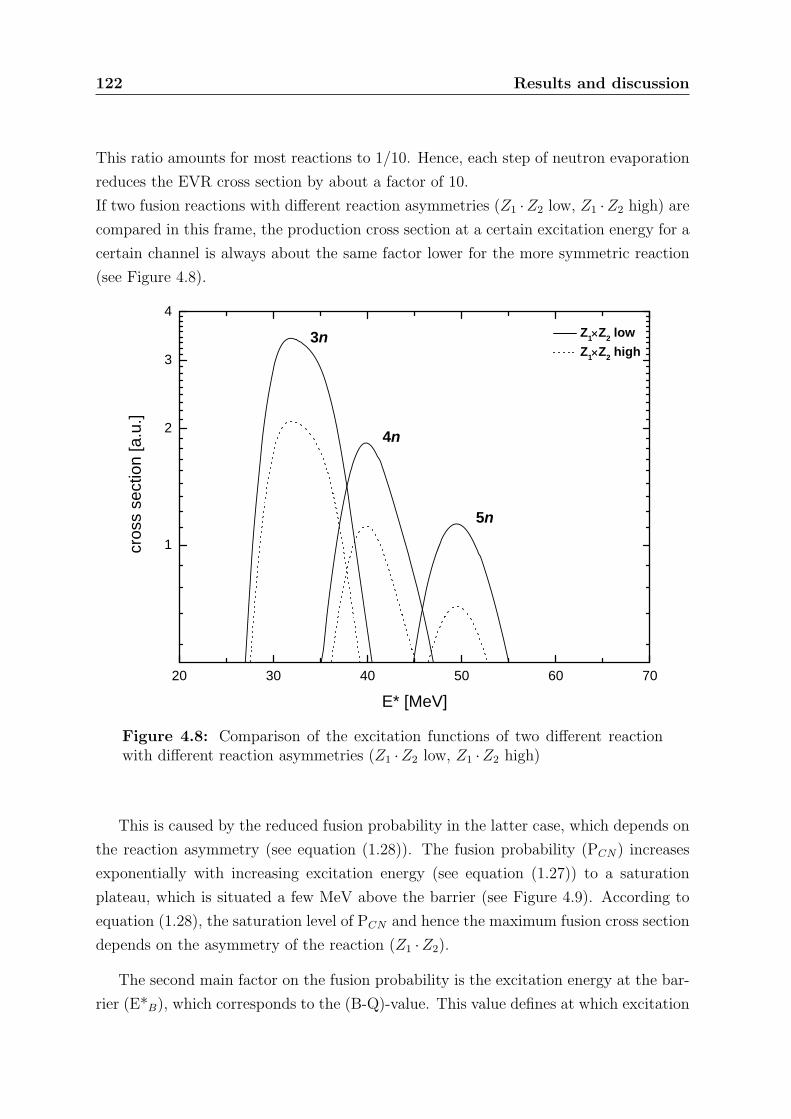
122 Results and discussion
This ratio amounts for most reactions to 1/10. Hence, each step of neutron evaporation
reduces the EVR cross section by about a factor of 10.
If two fusion reactions with different reaction asymmetries (Z1 ·Z2 low, Z1 ·Z2 high) are
compared in this frame, the production cross section at a certain excitation energy for a
certain channel is always about the same factor lower for the more symmetric reaction
(see Figure 4.8).
20 30 40 50 60 70
1
2
3
4
5n
4n
3n Z1×Z2 low Z1×Z2 high
cros
s se
ctio
n [a
.u.]
E* [MeV]
Figure 4.8: Comparison of the excitation functions of two different reactionwith different reaction asymmetries (Z1 ·Z2 low, Z1 ·Z2 high)
This is caused by the reduced fusion probability in the latter case, which depends on
the reaction asymmetry (see equation (1.28)). The fusion probability (PCN) increases
exponentially with increasing excitation energy (see equation (1.27)) to a saturation
plateau, which is situated a few MeV above the barrier (see Figure 4.9). According to
equation (1.28), the saturation level of PCN and hence the maximum fusion cross section
depends on the asymmetry of the reaction (Z1 ·Z2).
The second main factor on the fusion probability is the excitation energy at the bar-
rier (E*B), which corresponds to the (B-Q)-value. This value defines at which excitation
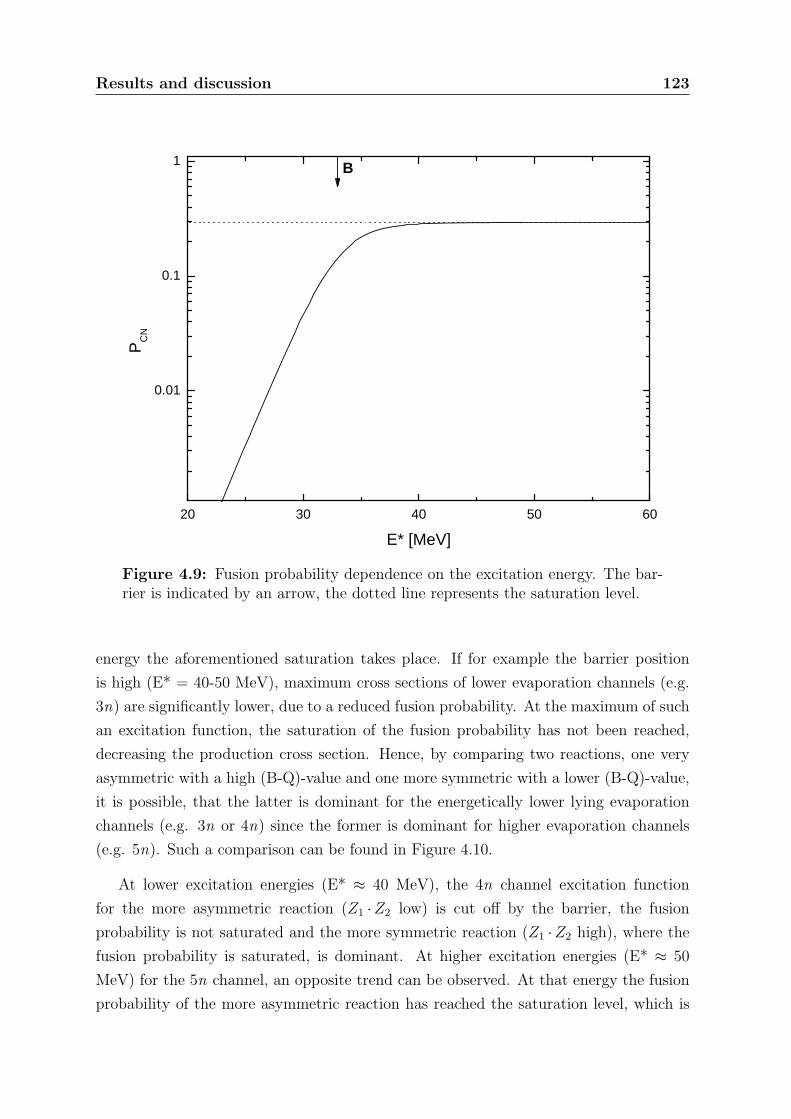
Results and discussion 123
20 30 40 50 60
0.01
0.1
1
P
CN
E* [MeV]
B
Figure 4.9: Fusion probability dependence on the excitation energy. The bar-rier is indicated by an arrow, the dotted line represents the saturation level.
energy the aforementioned saturation takes place. If for example the barrier position
is high (E* = 40-50 MeV), maximum cross sections of lower evaporation channels (e.g.
3n) are significantly lower, due to a reduced fusion probability. At the maximum of such
an excitation function, the saturation of the fusion probability has not been reached,
decreasing the production cross section. Hence, by comparing two reactions, one very
asymmetric with a high (B-Q)-value and one more symmetric with a lower (B-Q)-value,
it is possible, that the latter is dominant for the energetically lower lying evaporation
channels (e.g. 3n or 4n) since the former is dominant for higher evaporation channels
(e.g. 5n). Such a comparison can be found in Figure 4.10.
At lower excitation energies (E* ≈ 40 MeV), the 4n channel excitation function
for the more asymmetric reaction (Z1 ·Z2 low) is cut off by the barrier, the fusion
probability is not saturated and the more symmetric reaction (Z1 ·Z2 high), where the
fusion probability is saturated, is dominant. At higher excitation energies (E* ≈ 50
MeV) for the 5n channel, an opposite trend can be observed. At that energy the fusion
probability of the more asymmetric reaction has reached the saturation level, which is
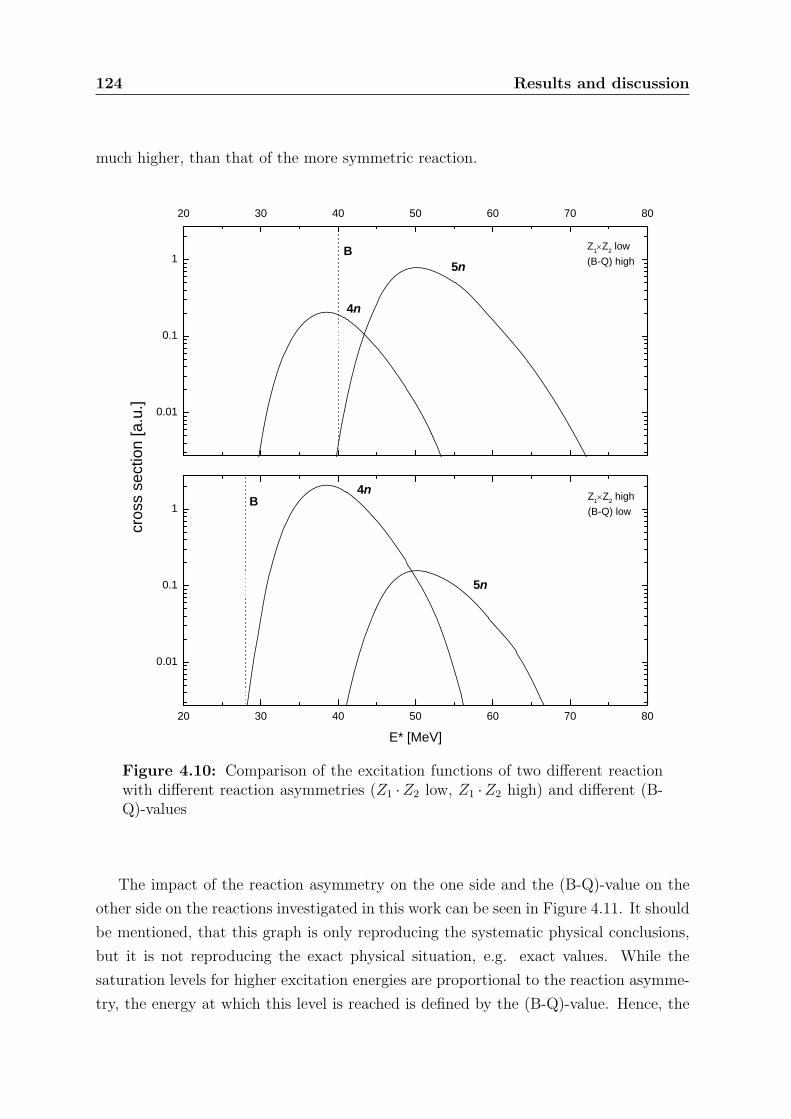
124 Results and discussion
much higher, than that of the more symmetric reaction.
20 30 40 50 60 70 80
0.01
0.1
1
cros
s se
ctio
n [a
.u.]
E* [MeV]
0.01
0.1
1
20 30 40 50 60 70 80
Z1×Z2 high(B-Q) low
B
5n
4n
4n
5n
B
Z1×Z2 low(B-Q) high
Figure 4.10: Comparison of the excitation functions of two different reactionwith different reaction asymmetries (Z1 ·Z2 low, Z1 ·Z2 high) and different (B-Q)-values
The impact of the reaction asymmetry on the one side and the (B-Q)-value on the
other side on the reactions investigated in this work can be seen in Figure 4.11. It should
be mentioned, that this graph is only reproducing the systematic physical conclusions,
but it is not reproducing the exact physical situation, e.g. exact values. While the
saturation levels for higher excitation energies are proportional to the reaction asymme-
try, the energy at which this level is reached is defined by the (B-Q)-value. Hence, the

Results and discussion 125
fusion probability near the excitation energy of E* = 40 MeV is largest for the reaction48Ca + 226Ra, it is in the area of saturation. This is not the case for the other two
reactions 26Mg + 248Cm and 36S + 238U, whose fusion probabilities are still increasing
and much lower at E* = 40 MeV. Hence the production cross section of the 4n channel
is largest for the reaction 48Ca + 226Ra, which is confirmed by the experiments.
20 30 40 50 60
0.01
0.1
1
26Mg + 248Cm 36S + 238U 48Ca + 226Ra
PC
N
E* [MeV]
Figure 4.11: Systematic comparison of the fusion probability of all three dif-ferent reaction with different reaction asymmetries and different (B-Q)-values.Arrows indicate the particular (B-Q)-values.
Near the excitation energy of E* = 50 MeV, this picture has changed and also the
reactions 26Mg + 248Cm and 36S + 238U have reached the saturation level. Hence, the
fusion probability is now only depending on the reaction asymmetry. Therefore, the
reaction 26Mg + 248Cm provides now the largest production cross section, while that for
the reaction 48Ca+226Ra should be lowest. The yield for 36S+238U should be in between
both reactions. This correlation is also in agreement with the experiments.
In summary, for an excitation energy near the maximum of the 4n channel, the (B-
Q)-dependence becomes the dominant effect concerning the production cross section.
126 Results and discussion
Due to a very low (B-Q)-value of only 33.1 MeV, the reaction 48Ca + 226Ra provides
the highest cross section for the 4n channel, since at that energy (E* ≈ 40 MeV) the
energy of the system is about 6.9 MeV above the barrier resulting in a saturation of
the fusion probability. By increasing the energy to a value near the maximum of the
5n evaporation channel, the reaction asymmetry is mainly influencing the production
cross section, since the fusion probability is saturated for all reactions. Hence, the most
asymmetric reaction 26Mg + 248Cm provides highest cross section in this energy range.
Another result of the analysis is the conclusion about the impact of small deviations
of both parameters. Compared with the reaction 26Mg + 248Cm, 36S+ 238U has a slightly
better (B-Q)-value, but a much worse asymmetry as can be seen from Table 4.1. In
contrast to calculations from Liu et al. [43] the impact of the reaction asymmetry is
much stronger, than small differences in (B-Q)-values. While Liu et al. [43] predicted36S + 238U to have cross sections of the order of the reaction 48Ca + 226Ra, with a two
times higher maximum production cross section than the reaction 26Mg + 248Cm, this is
not confirmed by our measurements. The reaction 26Mg+248Cm has at least the same or
even larger cross section for any channel compared to the reaction 36S + 238U. Also sub-
barrier fusion enhancement does not take place in the reaction 36S+238U resulting in the
lowest measured cross section for all measured channels for this reaction. 48Ca + 226Ra
on the other hand has the worst asymmetry of all examined reactions. But due to the
very low (B-Q)-value, which is more than 10 MeV lower than for the other two reactions,
this reaction offers highest cross section in the medium energy range.
A third factor influencing the production cross section is the deformation of projectile
and target, which are very important for energies below the barrier. In the case of
strongly deformed nuclei, large sub-barrier fusion enhancement has been observed in
recent experiments. This effect is responsible for the large 3n channel cross sections of
the reaction 26Mg + 248Cm. For the two other reactions, with spherical projectiles, such
effects have not been observed.
4.4 New results on decay properties of hassium isotopes
near N=162 and their daughters
The investigation of the decay properties of the Hs isotopes 269−271Hs and their daughter
nuclei was conducted in the framework of [8]. The decay properties of 269Hs and its

Results and discussion 127
daughters 265Sg and 261Rf were remeasured and reassigned, while the decay properties
of 270Hs and its daughter 266Sg as well as 271Hs and daughters 267Sg and 263Rf were
measured and assigned for the first time. A summary of these decay properties obtained
in former experiments can be found in Table 4.4. In the framework of the current thesis,
seven additional decay chains of 270Hs have been measured. One chain in the experiment
on the reaction 36S+238U (see Figure 4.1) and six in the two experiments on the reaction48Ca + 226Ra (see Figure 4.4). In addition, in the latter experiment, the half-life of 270Hs
has been measured for the first time.
Table 4.2: Decay properties derived from the decay chains detected in for-mer TUM experiments on Hs chemistry in comparison with previously knownexperimental decay properties. Adapted from [8].
Nuclide Data from previous exp. Data from TUM Hs chem. exp.
Dec. mode,branchinga
T1/2 Eα [MeV] Dec. mode,branchinga
T1/2 Eα [MeV]
269Hs α 9.7 s 9.23 α 9.13± 0.05
9.18 8.95± 0.05270Hs α ∼ 3.6 s 9.16 α ∼ 23.0 sb 8.88± 0.05271Hs α 9.30± 0.04
9.13± 0.05265Sg α 8 s 8.69-8.94 α 15.3+7.1
−3.7 s 8.69± 0.04266Sg α 18.8 s 8.52-8.77 SF 359+248
−104 ms267Sg α/SF:
0.17/0.8384.3+58.1
−24.2 s 8.20± 0.03
261bRf α/SF:0.60/0.40
5 s 8.52 α/SF:0.09/0.91
2.5+1.1−0.6 s 8.51± 0.03
261aRf α 78 s 8.28 α 22+106−10 sc 8.29± 0.03
263Rf SF 11 m SF 8.3+39.8−3.8 s
aBranching is not shown, if only one decay mode was observed.bHalf-life calculated from the measured Eα values using [56]cDerived from 1 event, in agreement with known T1/2 = 78 s [111,112].
From all six measured 270Hs decays, using the formalism described in [100], a half-life
for 270Hs of T1/2 = 7.6+5.3−2.2 s is derived. Former chemical experiments were not able
to measure the half-life, it could only be calculated according to the formula presented

128 Results and discussion
in [56]. All measured chains consisted of an α-decay of 270Hs followed by a SF of the
daughter nuclide 266Sg. For the α-decay of 270Hs an α-particle energy of Eα = 8.88± 0.05
was determined in [8]. In our chemistry experiment we measured for the one single event
of 270Hs an α-particle energy of Eα = 9.02+0.50−0.1 MeV which is slightly higher, but in good
agreement with the results reported from the 26Mg + 248Cm experiment. The results
from the experiments on the reaction 48Ca + 226Ra, where an α-particle energy of Eα =
9.00± 0.14 MeV has been measured, fit quite perfectly with the results obtained from the36S+238U reaction and also agree with the 26Mg+248Cm experiment. Taking all 13 270Hs
decays from all three reactions into account, an α-particle-energy of Eα = 8.95± 0.10
MeV can be deduced. In all experiments the daughter nucleus 266Sg decays via SF. The
half-life of that isotope obtained from the 36S+238U measurement of T1/2(266Sg) = 23 ms
is relatively short compared with the value of T1/2(266Sg) = 359+248−104 ms reported from
[8]. The half-life observed in experiments on the reaction 48Ca + 226Ra of T1/2(266Sg) =
284+196−83 ms (error corresponding to a 1σ interval see [100]) agrees very well within error
limits with the results from [8]. Using the formalism described in [100], the results from
all three experiments can be combined and a half-life for 266Sg of T1/2 = 298+115−65 ms is
obtained.
The results on the decay properties of 270Hs from both experiments examined in this
thesis confirm the properties reported in [8]. A summary can be found in Table 4.3.
The Hs isotopes 269Hs and 271Hs have not been observed in the framework of this thesis.
Hence, there are no new results on their decay properties.
Table 4.3: Updated decay properties of 270Hs and its daughter 266Sg
Nuclide decay mode T1/2 Eα [MeV]
270Hs α 7.6+5.3−2.2 s 8.95± 0.10
266Sg SF 298+115−65 ms
Chapter 5
Conclusions and outlook
The aim of the research performed in the framework of this thesis was to study the
influence of the reaction Q-value on the yield of SHE producted in complete nuclear
fusion reactions. This was accomplished by studying three fusion reactions leading to274Hs as compound nucleus. The 4n evaporation channel is leading to the doubly magic
nucleus 270Hs. Since for one of the three reactions the excitation function has been
measured in the framework of [8], excitation functions of both reactions 48Ca + 226Ra
as well as 36S + 238U were investigated in this thesis and compared with theoretical
predictions from [43]. These reactions have been measured at two and three different
excitation energies, respectively. While the reaction 36S + 238U was investigated using
our well established chemical separation and detection system COMPACT, the reaction48Ca + 226Ra was measured in a separator experiment at the DGFRS in collaboration
with the FLNR, Dubna, Russia. In total seven decay chains of 270Hs have been measured,
one in the experimental campaign on the first reaction and six in the two experimental
campaigns on the second reaction. In the DGFRS experiment, the half-live of 270Hs
could be measured for the first time and was derived to be T1/2 = 7.6+5.3−2.2 s [97]. Other
known decay properties of 270Hs and its daughter 266Sg [51] were confirmed.
In agreement with predictions from [43], the reaction 48Ca + 226Ra offers a large
maximum 4n evaporation cross section of more than 8 pb. The reaction 26Mg + 248Cm
provides a lower value of about 3 pb and an upper cross section limit of <3 pb was
estimated for the reaction 36S + 238U, in contrast to predictions. For the 5n channel this
picture changed, the reaction 26Mg + 248Cm has the largest cross section with about 7
pb, while only cross section limits could be estimated for both other reactions.
129

130 Conclusions and outlook
These experimental results are in a good agreement with explanations presented in
Section 4.3 concerning the (B-Q)- and asymmetry influence on the production cross
sections. In general at energies close to the maximum of the 5n channel, for all (B-
Q)-values and barrier positions, the fusion probability (PCN) has reached its maximum
value (see e.g.Figure 4.11) since it is saturated, independent of the excitation energy
and only depends on the asymmetry of the reaction. It is very important to note that
PCN and hence the production cross section for the 5n channel is independent of the
(B-Q)-value, since the excitation energy is about several MeV above the barrier (see
equation (1.27)). This was confirmed by the measurements. The most asymmetric
reaction 26Mg + 248Cm provides much larger cross sections than the more symmetric
reactions 36S + 238U and 48Ca + 226Ra. The very low (B-Q)-value of the latter reaction
is not affecting the production cross section at all in this energy range.
In contrast to the 5n channel, for energies close to the maximum of the 4n channel,
the barrier position, or (B-Q)-value (Q-value effect) has a deep impact on the fusion
probability and hence on the production cross section. Hence, the (B-Q)-value changes
the σ4n
σ5nratio. For ”hot” fusion reactions the 4n channel is cut-off due to large (B-Q)-
values and PCN resides in the region of strongly increasing values and far away from
its maximum value. For ”warm” fusion reactions (48Ca-based), the (B-Q)-value is low
and the fusion probability has already reached its maximum value (saturation). This
correlation is well reproducted by our measurements, since the reaction 48Ca + 226Ra
offers the largest measured production cross section compared with both other reactions,
whose cross sections are significantly lower.
As our studies revealed, if the barrier is situated below the maximum of the 4n
channel of E* ≈ 40 MeV and hence the (B-Q)-value is low, strong Q-value effects occur.
This effect affects the 4n channel to become the dominant channel and to provide a
much larger production cross section than that of ”hot” fusion reactions, because these
are cut-off by the barrier. This cut is caused by the fusion probability which has not
reached its maximum value.
If the barrier is situated at higher excitation energies (B > E*(4n)), which is the case
for ”hot” fusion reactions, the Q-value effect is minor, the 4n channel is suppressed and
only the asymmetry plays an important role and has a deep impact on the production
cross section.
The results about the mechanism of fusion reactions and the impact of the (B-Q)-
value and asymmetry on the production cross section, especially for the 5n channel need

Conclusions and outlook 131
more statistics for a more detailed understanding.
In general, a reaction providing a low (B-Q)-value as well as large reaction asymmetry
will provide largest cross sections, especially for the 4n channel. If the fusion probability
of such a reaction is already saturated for the 4n channel, the production cross section
will of course be much larger than that of the 5n channel, since one neutron less has to
be evaporated to cool down the nucleus.
The conclusions of this thesis are extremely important, especially for the first syn-
thesis of new elements (e.g. element 119 and 120). For synthesis up to element 118,
doubly magic 48Ca could be used as projectile with various actinide targets, providing
relatively large production cross sections for SHE due to strong Q-value effects. 249Bk
and 249Cf are the heaviest target materials which can be used in SHE synthesis experi-
ments. Heavier targets made from Es or Fm isotopes can not be produced in sufficient
quantities in breeding reactors. Hence, new projectile-target combinations have to be
chosen to discover the next elements of the periodic table. This is very important, since
the production cross sections decrease very strongly with increasing proton number of
the CN and are expected to be of the order of some hundreds of fb or less, depending on
the reaction. Such one event cross section limits can only be reached experimentally in
experiments that last many months to more than one year. Hence, the optimal reaction
with the largest expected cross section has to be chosen to have a chance to discover
a new element. The most promising reactions with relevant reaction parameters are
shown in Table 5.1 and Table 5.2.
Table 5.1: Comparison of fusion reactions leading to element 119
Beam Target CN Zp ·Zt (B-Q) [MeV] fissility45Sc 249Cf 294119 2058 41.7 0.90450Ti 249Bk 299119 2134 32.4 0.91151V 248Cm 299119 2208 36.8 0.91354Cr 243Am 297119 2280 31.5 0.92355Mn 244Pu 299119 2350 37.7 0.92258Fe 237Np 295119 2418 29.9 0.93459Co 238U 297119 2484 36.7 0.933
Since the result of this thesis reveals the deep impact of the (B-Q)-value as well as
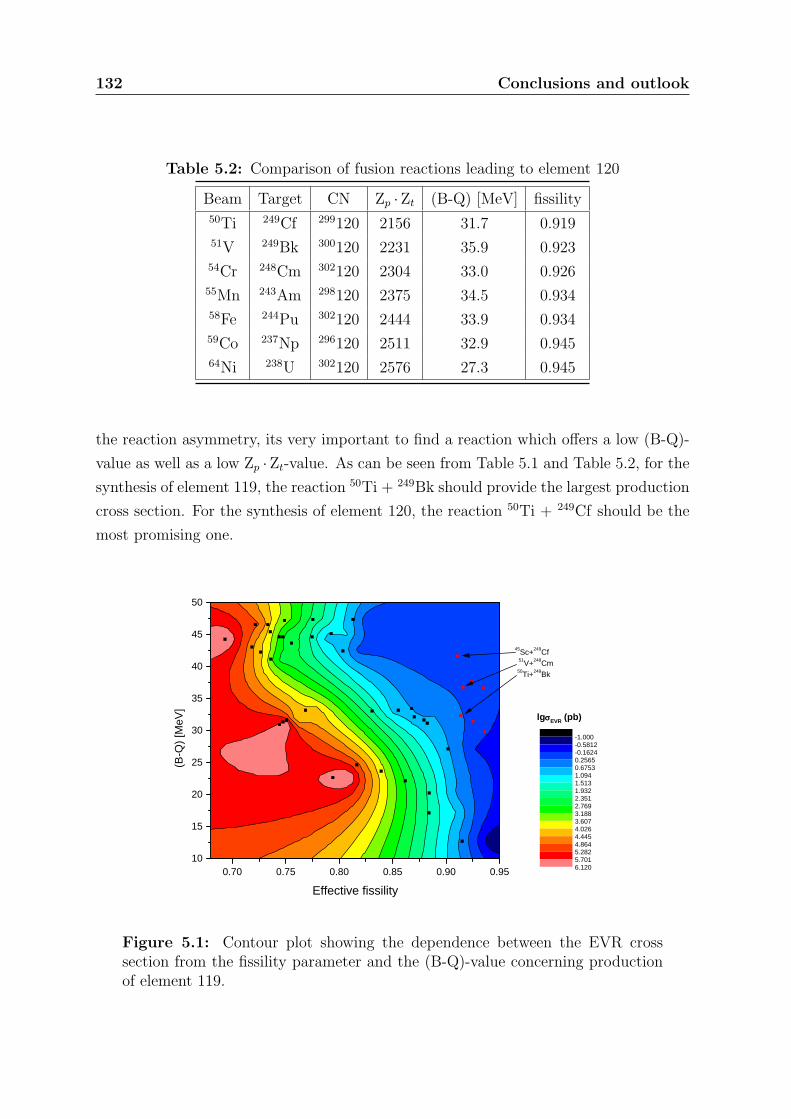
132 Conclusions and outlook
Table 5.2: Comparison of fusion reactions leading to element 120
Beam Target CN Zp ·Zt (B-Q) [MeV] fissility50Ti 249Cf 299120 2156 31.7 0.91951V 249Bk 300120 2231 35.9 0.92354Cr 248Cm 302120 2304 33.0 0.92655Mn 243Am 298120 2375 34.5 0.93458Fe 244Pu 302120 2444 33.9 0.93459Co 237Np 296120 2511 32.9 0.94564Ni 238U 302120 2576 27.3 0.945
the reaction asymmetry, its very important to find a reaction which offers a low (B-Q)-
value as well as a low Zp ·Zt-value. As can be seen from Table 5.1 and Table 5.2, for the
synthesis of element 119, the reaction 50Ti + 249Bk should provide the largest production
cross section. For the synthesis of element 120, the reaction 50Ti + 249Cf should be the
most promising one.
0.70 0.75 0.80 0.85 0.90 0.9510
15
20
25
30
35
40
45
50
lgσEVR (pb)
Effective fissility
(B-Q
) [M
eV]
-1.000-0.5812-0.16240.25650.67531.0941.5131.9322.3512.7693.1883.6074.0264.4454.8645.2825.7016.120
45Sc+249Cf 51V+248Cm 50Ti+249Bk
Figure 5.1: Contour plot showing the dependence between the EVR crosssection from the fissility parameter and the (B-Q)-value concerning productionof element 119.

Conclusions and outlook 133
To estimate the production cross section of a certain fusion reaction, a contour plot
can be generated (Figure 5.1 and Figure 5.2), presenting experimental cross section
values in dependence of the fissility (proportional to the asymmetry) and the (B-Q)-
value for heavy nuclides (Z > 100) produced in complete fusion reactions. The calculated
values of (B-Q) and the fissility for some reactions leading to element 119 and 120 are
also shown and indicated by arrows. As can be seen, the ”warm fusion” of heavy
actinide targets with neutron-rich heavy ions are the most promising reactions towards
the synthesis of heaviest elements.
0.70 0.75 0.80 0.85 0.90 0.9510
15
20
25
30
35
40
45
50
lgσEVR (pb)
Effective fissility
(B-Q
) [M
eV]
-1.000-0.5812-0.16240.25650.67531.0941.5131.9322.3512.7693.1883.6074.0264.4454.8645.2825.7016.120
51V+249Bk 54Cr+248Cm
50Ti+249Cf
Figure 5.2: Contour plot showing the dependence between the EVR crosssection from the fissility parameter and the (B-Q)-value concerning productionof element 120.
As can also be seen from both plots the reactions 50Ti + 249Bk and 50Ti + 249Cf
should provide largest production cross sections for the synthesis for element 119 and
120, respectively.

134
Bibliography
[1] Sigurd Hofmann. On Beyond Uranium - Journey to the end of the Periodic Table,
volume 2 of Science Spectra Book Series. Taylor and Francis, London and New
York, 2002. ISBN 0-415-28495-3.
[2] S. Cwiok, J. Dobaczewski, P. H. Heenen, P. Magierski, and W. Nazarewicz. Shell
structure of the superheavy elements. Nuclear Physics A, 611(2-3):211–246, De-
cember 1996.
[3] W. D. Myers and W. J. Swiatecki. Nuclear properties according to the thomas-
fermi model. Nuclear Physics A, 601(2):141–167, May 1996.
[4] A. Sobiczewski. Structure of heaviest nuclei. Acta Physica Polonica B, 29(9):2191,
1998.
[5] K. Rutz, M. Bender, T. Burvenich, T. Schilling, P.-G. Reinhard, J. A. Maruhn,
and W. Greiner. Superheavy nuclei in self-consistent nuclear calculations. Phys.
Rev. C, 56(1):238–, July 1997.
[6] Zygmunt Patyk and Adam Sobiczewski. Ground-state properties of the heaviest
nuclei analyzed in a multidimensional deformation space. Nuclear Physics A,
533(1):132–152, October 1991.
[7] Ch. E. Dullmann, W. Bruchle, R. Dressler, K. Eberhardt, B. Eichler, R. Eich-
ler, H. W. Gaggeler, T. N. Ginter, F. Glaus, K. E. Gregorich, D. C. Hoffman,
E. Jager, D. T. Jost, U. W. Kirbach, D. M. Lee, H. Nitsche, J. B. Patin, V. Per-
shina, D. Piguet, Z. Qin, M. Schadel, B. Schausten, E. Schimpf, H.-J. Schott,
S. Soverna, R. Sudowe, P. Thorle, S. N. Timokhin, N. Trautmann, A. Turler,
A. Vahle, G. Wirth, A. B. Yakushev, and P. M. Zielinski. Chemical investigation
of hassium (element 108). Nature, 418(6900):859–862, August 2002.
135
136 Bibliography
[8] Jan Dvorak. Decay properties of nuclei close to Z = 108 and N = 162. PhD
thesis, Technische Universitat Munchen, 2006.
[9] Glenn T. Seaborg and Walter D. Loveland. The Elements Beyond Uranium. Wiley,
New York, 1990.
[10] C. F. von Weizsacker. Zur Theorie der Kernmassen. Z. Phys. A, 96(7):431 – 458,
07 1935.
[11] H. A. Bethe and R. F. Bacher. Nuclear Physics A. Stationary States of Nuclei.
Reviews of Modern Physics, 8:82–229, April 1936.
[12] M. G. Mayer. Nuclear Configurations in the Spin-Orbit Coupling Model. I. Em-
pirical Evidence. Physical Review, 78:16–21, April 1950.
[13] M. G. Mayer. Nuclear Configurations in the Spin-Orbit Coupling Model. II. The-
oretical Considerations. Physical Review, 78:22–23, April 1950.
[14] M. G. Mayer. On Closed Shells in Nuclei. II. Physical Review, 75:1969–1970, June
1949.
[15] O. Haxel, J. H. Jensen, and H. E. Suess. On the ”Magic Numbers” in Nuclear
Structure. Physical Review, 75:1766–1766, June 1949.
[16] J. R. Nix. Calculation of fission barriers for heavy and superheavy nuclei. Annual
Review of Nuclear Science, 22(1):65–120, 1972.
[17] P. Moller and J. R. Nix. In Third International Atomic Energy Symposium on
Physics and Chemistry of Fission, volume 1, page 103. Rochester, New York,
IAEA, Vienna, 1973. Paper SM-174/202.
[18] P. Moller, J.R. Nix, P. Armbruster, S. Hofmann, and G. Munzenberg. Single-
particle enhancement of heavy-element production. Zeitschrift fur Physik A
Hadrons and Nuclei, 359(3):251–255, November 1997.
[19] V. M. Strutinsky. Shell effects in nuclear masses and deformation energies. Nuclear
Physics A, 95(952):420–442, April 1967.
[20] V. M. Strutinsky. ”shells” in deformed nuclei. Nuclear Physics A, 122(1):1–33,
December 1968.
[21] Niels Bohr and John Archibald Wheeler. The mechanism of nuclear fission. Phys.
Rev., 56(5):426–, September 1939.
Bibliography 137
[22] Zygmunt Patyk, Adam Sobiczewski, Peter Armbruster, and Karl-Heinz Schmidt.
Shell effects in the properties of the heaviest nuclei. Nuclear Physics A, 491(2):267–
280, January 1989.
[23] Zygmunt Patyk, Janusz Skalski, Adam Sobiczewski, and Stefanl Cwiok. Potential
energy and spontaneous-fission half-lives for heavy and superheavy nuclei. Nuclear
Physics A, 502:591–600, October 1989.
[24] P. Armbruster. On the production of superheavy elements. Annual Review of
Nuclear and Particle Science, 50(1):411–479, 2000.
[25] V. I. Zagrebaev, Y. Aritomo, M. G. Itkis, Yu. Ts. Oganessian, and M. Ohta.
Synthesis of superheavy nuclei: How accurately can we describe it and calculate
the cross sections? Physical Review C (Nuclear Physics), 65(1):014607–, December
2001.
[26] V. I. Zagrebaev. Synthesis of superheavy nuclei: Nucleon collectivization as a
mechanism for compound nucleus formation. Physical Review C (Nuclear Physics),
64(3):034606–, August 2001.
[27] A. B. Yakushev. Chemical charaterization of element 108, hassium and synthesis
of new hassium isotopes. Habilitation Thesis in the Field of Radiochemistry at
the Department of Chemistry of the Technical University of Munich, 2009.
[28] R. Bass. Fusion of heavy nuclei in a classical model. Nuclear Physics A, 231(1):45–
63, October 1974.
[29] W J Swiatecki. The dynamics of nuclear coalescence or reseparation. Physica
Scripta, 24(1B):113–122, 1981.
[30] S. Bjørnholm and W. J. Swiatecki. Dynamical aspects of nucleus-nucleus collisions.
Nuclear Physics A, 391(2):471 – 504, 1982.
[31] J. P. Blocki, H. Feldmeier, and W. J. Swiatecki. Dynamical hindrance
to compound-nucleus formation in heavy-ion reactions. Nuclear Physics A,
459(1):145–172, October 1986.
[32] C. E. Aguiar, V. C. Barbosa, and R. Donangelo. Thermal fluctuations in heavy-ion
fusion reactions : (ii). multidimensional models. Nuclear Physics A, 517(1):205 –
220, 1990.
138 Bibliography
[33] Y. Arimoto, T. Wada, M. Ohta, and Y. Abe. In Yu. Ts. Oganessian and V. I.
Zagrebaev, editors, Proceedings on Fusion Dynamics at the Extremes, Dubna 2000,
page 123. World Science, Singapore, 2001.
[34] Y. Arimoto. In International Conference on Nuclear Physics at Border Lines,
page 8, Lipari (Messina), Italy, 2001.
[35] N. V. Antonenko, E. A. Cherepanov, A. K. Nasirov, V. P. Permjakov, and V. V.
Volkov. Competition between complete fusion and quasi-fission in reactions be-
tween massive nuclei. the fusion barrier. Physics Letters B, 319(4):425 – 430,
1993.
[36] G. G. Adamian, N. V. Antonenko, W. Scheid, and V. V. Volkov. Treatment of
competition between complete fusion and quasifission in collisions of heavy nuclei.
Nuclear Physics A, 627(2):361 – 378, 1997.
[37] E. A. Cherepanov. In Yu. Ts. Oganessian and V. I. Zagrebaev, editors, Proceed-
ings on Fusion Dynamics at the Extremes, Dubna 2000, page 186. World Science,
Singapore, 2001.
[38] V. I. Zagrebaev. In Yu. Ts. Oganessian and V. I. Zagrebaev, editors, Proceed-
ings on Fusion Dynamics at the Extremes, Dubna 2000, page 215. World Science,
Singapore, 2001.
[39] A. V. Ignatyk. Statistical Properties of Excited Atomic Nuclei. Energoatomazidat,
Moscow, 1983.
[40] K.E. Gregorich, T.N. Ginter, W. Loveland, D. Peterson, J.B. Patin, C.M. Folden,
D.C. Hoffman, D.M. Lee, H. Nitsche, J.P. Omtvedt, L.A. Omtvedt, L. Stavsetra,
R. Sudowe, P.A. Wilk, P.M. Zielinski, and K. Aleklett. Cross-section limits for the208Pb(86Kr, n)293118 reaction. The European Physical Journal A - Hadrons and
Nuclei, 18(4):633–638, December 2003.
[41] Valery Zagrebaev and Walter Greiner. Synthesis of superheavy nuclei: A search
for new production reactions. Physical Review C (Nuclear Physics), 78(3):034610,
2008.
[42] V. I. Zagrebaev. private communication.
[43] Z. H. Liu and Jing-Dong Bao. Q-value effects on the production of superheavy
nuclei. Physical Review C (Nuclear Physics), 74(5):057602, 2006.

Bibliography 139
[44] W. Reisdorf and M. Schadel. How well do we understand the synthesis of heavy
elements by heavy-ion induced fusion? Zeitschrift fur Physik A Hadrons and
Nuclei, 343(1):47–57, March 1992.
[45] H. Esbensen. Fusion and zero-point motions. Nuclear Physics A, 352(1):147–156,
January 1981.
[46] C. H. Dasso, S. Landowne, and A. Winther. Channel-coupling effects in heavy-ion
fusion reactions. Nuclear Physics A, 405(2):381–396, August 1983.
[47] W. Reisdorf, F. P. Heßberger, K. D. Hildenbrand, S. Hofmann, G. Munzenberg,
K. H. Schmidt, J. H. R. Schneider, W. F. W. Schneider, K. Summerer, G. Wirth,
J. V. Kratz, and K. Schlitt. Fusion near the threshold: A comparative study of the
systems 40Ar + 112,116,122Sn and 40Ar + 144,148,154Sm. Nuclear Physics A, 438(1):212
– 252, 1985.
[48] S. Liran and N. Zeldes. A semiempirical shell-model formula. Atomic Data and
Nuclear Data Tables, 17(5-6):431 – 441, 1976.
[49] Ch. E. Dullmann. private communication.
[50] Z. Patyk and A. Sobiczewski. Main deformed shells of heavy nuclei studied in a
multidimensional deformation space. Physics Letters B, 256(3-4):307–310, March
1991.
[51] J. Dvorak, W. Bruchle, M. Chelnokov, R. Dressler, Ch. E. Dullmann, K. Eber-
hardt, V. Gorshkov, E. Jager, R. Krucken, A. Kuznetsov, Y. Nagame, F. Nebel,
Z. Novackova, Z. Qin, M. Schadel, B. Schausten, E. Schimpf, A. Semchenkov,
P. Thorle, A. Turler, M. Wegrzecki, B. Wierczinski, A. Yakushev, and A. Yeremin.
Doubly magic nucleus 270108Hs162. Physical Review Letters, 97(24):242501, 2006.
[52] J. Dvorak, W. Bruchle, M. Chelnokov, Ch. E. Dullmann, Z. Dvorakova, K. Eber-
hardt, E. Jager, R. Krucken, A. Kuznetsov, Y. Nagame, F. Nebel, K. Nishio,
R. Perego, Z. Qin, M. Schadel, B. Schausten, E. Schimpf, R. Schuber, A. Sem-
chenkov, P. Thorle, A. Turler, M. Wegrzecki, B. Wierczinski, A. Yakushev, and
A. Yeremin. Observation of the 3n evaporation channel in the complete hot-fusion
reaction 26Mg + 248Cm leading to the new superheavy nuclide 271Hs. Phys. Rev.
Lett., 100(13):132503–4, April 2008.
[53] M. Schadel. The chemistry of the Superheavy Elements. Kluwer Academic Pub-
lishers Dordrecht/Boston/London, 2003.
140 Bibliography
[54] R. Smolanczuk, J. Skalski, and A. Sobiczewski. Spontaneous-fission half-lives of
deformed superheavy nuclei. Phys. Rev. C, 52(4):1871–, October 1995.
[55] P. Moller, J. R. Nix, W. D. Myers, and W. J. Swiatecki. Nuclear ground-state
masses and deformations. Atomic Data and Nuclear Data Tables, 59(2):185–381,
March 1995.
[56] A. Parkhomenko and A. Sobiczewski. Phenomenological formula for α-decay half-
lives of heaviest nuclei. Acta Physica Polonica B, 36:3095, 2005.
[57] I. Muntian, Z. Patyk, and A. Sobiczewski. Calculated masses of heaviest nuclei.
Physics of Atomic Nuclei, 66(6):1015, 2003.
[58] A. Sobiczewski. private communication.
[59] R. B. Firestone and V. S. Shirley. Table of Isotopes, 2 Volume Set. Table of
Isotopes, 2 Volume Set, by Richard B. Firestone, Virginia S. Shirley (Editor),
pp. 3168. ISBN 0-471-33056-6. Wiley-VCH , December 1998., December 1998.
[60] S. Hofmann, F.P. Heßberger, D. Ackermann, S. Antalic, P. Cagarda, S. Cwiok,
B. Kindler, J. Kojouharova, B. Lommel, R. Mann, G. Munzenberg, A.G. Popeko,
S. Saro, H.J. Schott, and A.V. Yeremin. The new isotope 270110 and its decay
products 266Hs and 262Sg. European Physical Journal A, 1:5, 2001.
[61] F.P. Heßberger, S. Hofmann, V. Ninov, P. Armbruster, H. Folger, G. Munzenberg,
H.J. Schott, A.G. Popeko, A.V. Yeremin, A.N. Andreyev, and S. Saro. Sponta-
neous fission and alpha-decay properties of neutron deficient isotopes 257−253104
and 258106. Zeitschrift fur Physik A Hadrons and Nuclei, 359(4):415–425, Decem-
ber 1997.
[62] K. Nishio, S. Hofmann, F.P. Heßberger, D. Ackermann, S. Antalic, Y. Aritomo,
V.F. Comas, Ch.E. Dullmann, A. Gorshkov, R. Graeger, K. Hagino, S. Heinz,
J.A. Heredia, K. Hirose, H. Ikezoe, J. Khuyagbaatar, B. Kindler, I. Kojouharov,
B. Lommel, R. Mann, S. Mitsuoka, Y. Nagame, I. Nishinaka, T. Ohtsuki, A.G.
Popeko, S. Saro, M. Schadel, A. Turler, Y. Watanabe, A. Yakushev, and A.V.
Yeremin. Study of nuclear orientation in the reaction 34S + 238U and decay prop-
erties of the new isotope 268Hs. Physical Review C (to be published), 2010.
[63] A. Turler, Ch.E. Dullmann, H.W. Gaggeler, U.W. Kirbach, A.B. Yakushev,
M. Schadel, W. Brauchle, R. Dressler, K. Eberhardt, B. Eichler, R. Eichler, T.N.

Bibliography 141
Ginter, F. Glaus, K.E. Gregorich, D.C. Hoffman, E. Jager, D.T. Jost, D.M. Lee,
H. Nitsche, J.B. Patin, V. Pershina, D. Piguet, Z. Qin, B. Schausten, E. Schimpf,
H.-J. Schott, S. Soverna, R. Sudowe, P. Thorle, S.N. Timokhin, N. Trautmann,
A. Vahle, G. Wirth, and P.M. Zielinski. On the decay properties of 269Hs and
indications for the new nuclide 270Hs. The European Physical Journal A - Hadrons
and Nuclei, 17(4):505–508, August 2003.
[64] S. Hofmann, F.P. Heßberger, D. Ackermann, G. Munzenberg, S. Antalic, P. Ca-
garda, B. Kindler, J. Kojouharova, M. Leino, B. Lommel, R. Mann, A.G. Popeko,
S. Reshitko, S. aro, J. Uusitalo, and A.V. Yeremin. New results on elements 111
and 112. The European Physical Journal A - Hadrons and Nuclei, 14(2):147–157,
June 2002.
[65] K. Morita, K. Morimoto, D. Kaji, T. Akiyama, S. Goto, H. Haba, E. Ideguchi,
H. Koura, H. Kudo, T. Ohnishi, A. Ozawa, T. Suda, K. Sueki, H. Xu, T. Ya-
maguchi, A. Yoneda, A. Yoshida, and Y.-L. Zhao. Experiments on synthesis of
isotope 277112 by 208Pb + 70Zn reaction. RIKEN Accel. Prog. Rep., 38:69, 2005.
[66] Ch. E. Dullmann and A. Turler. 248Cm(22Ne, xn)270−xSg reaction and the
decay properties of 265Sg reexamined. Physical Review C (Nuclear Physics),
77(6):064320, 2008.
[67] K. E. Gregorich, J. M. Gates, Ch. E. Dullmann, R. Sudowe, S. L. Nelson, M. A.
Garcia, I. Dragojevic, C. M. Folden III, S. H. Neumann, D. C. Hoffman, and
H. Nitsche. New isotope 264Sg and decay properties of 262−264Sg. Physical Review
C (Nuclear Physics), 74(4):044611, 2006.
[68] K. Nishio, S. Hofmann, F. Heßberger, D. Ackermann, S. Antalic, V. Comas,
Z. Gan, S. Heinz, J. Heredia, H. Ikezoe, J. Khuyagbaatar, B. Kindler, I. Ko-
jouharov, P. Kuusiniemi, B. Lommel, R. Mann, M. Mazzocco, S. Mitsuoka,
Y. Nagame, T. Ohtsuki, A. Popeko, S. Saro, H. Schott, B. Sulignano, A. Svirikhin,
K. Tsukada, K. Tsuruta, and A. Yeremin. Measurement of evaporation residue
cross-sections of the reaction 30Si + 238U at subbarrier energies. The European
Physical Journal A - Hadrons and Nuclei, 29(3):281–287, September 2006.
[69] J. Dvorak, W. Bruchle, Ch. E. Dullmann, Z. Dvorakova, K. Eberhardt, R. Eichler,
E. Jager, Y. Nagame, Z. Qin, M. Schadel, B. Schausten, E. Schimpf, R. Schuber,
A. Semchenkov, P. Thorle, A. Turler, M. Wegrzecki, and A. Yakushev. Cross

142 Bibliography
section limits for the 248Cm(25Mg, 4n − 5n)268,269Hs reactions. Phys. Rev. C,
79(3):037602, Mar 2009.
[70] M. Leino. Gas-filled separators - an overview. Nuclear Instruments and Methods in
Physics Research Section B: Beam Interactions with Materials and Atoms, 204:129
– 137, 2003. 14th International Conference on Electromagnetic Isotope Separators
and Techniques Related to their Applications.
[71] H.-D. Betz. Charge states and charge-changing cross sections of fast heavy ions
penetrating through gaseous and solid media. Rev. Mod. Phys., 44(3):465–539, Jul
1972.
[72] A. Semchenkov, W. Bruchle, E. Jager, E. Schimpf, M. Schadel, C. Muhle, F. Klos,
A. Turler, A. Yakushev, A. Belov, T. Belyakova, M. Kaparkova, V. Kukhtin,
E. Lamzin, and S. Sytchevsky. The transactinide separator and chemistry appa-
ratus (tasca) at gsi - optimization of ion-optical structures and magnet designs.
Nuclear Instruments and Methods in Physics Research Section B: Beam Interac-
tions with Materials and Atoms, 266(19-20):4153 – 4161, 2008. Proceedings of
the XVth International Conference on Electromagnetic Isotope Separators and
Techniques Related to their Applications.
[73] T. Enqvist, P. Heikkinen, H. Kettunen, P. Kuusiniemi, M. Leino, A. P. Leppnen,
C. Scholey, and J. Uusitalo. The design of a new gas-filled separator at jyfl. Nuclear
Instruments and Methods in Physics Research Section B: Beam Interactions with
Materials and Atoms, 204:138 – 140, 2003. 14th International Conference on
Electromagnetic Isotope Separators and Techniques Related to their Applications.
[74] K. Subotic, Yu. Ts. Oganessian, V. K. Utyonkov, Yu. V. Lobanov, F. Sh. Ab-
dullin, A. N. Polyakov, Yu. S. Tsyganov, and O. V. Ivanov. Evaporation residue
collection efficiencies and position spectra of the dubna gas-filled recoil separator.
Nuclear Instruments and Methods in Physics Research Section A: Accelerators,
Spectrometers, Detectors and Associated Equipment, 481(1-3):71–80, April 2002.
[75] B.L. Zhuikov, H. Kruz, and I. Zvara. Possibilities of chemical identification of
short-lived element 108 isotopes. In Abstract School-Seminar on Heavy Ion Physics
1985, Report P7-86-322, page 26, JINR, Dubna, 1986.
[76] V.I. Chepigin, B.L. Zhuikov, G.M. Ter-Akopian, and I. Zvara. Search of alpha-
active isotopes of element 108 in the reaction 249Cf+22Ne with fast chemical isola-

Bibliography 143
tion. In Abstract School-Seminar on Heavy Ion Physics 1985, Report P7-86-322,
page 15. JINR, Dubna, 1986. in Russian.
[77] R. J. Dougan, K. J. Moody, E. K. Hulet, and G. R. Bethune. OSCAR: An appa-
ratus for on-line gas phase separations. Lawrence Livermore National Laboratory,
FY87 Annual Report ULAR 10062/87, 1987. pp. 417.
[78] E.K. Hulet, K.J. Moody, R.W. Lougheed, J. F. Wild, R. J. Dougan, and G. R.
Bethune. Search for 272109 in a new region of stability. Lawrence Livermore
National Laboratory, FY87 Annual Report ULAR 10062/87, 1987. pp. 49.
[79] C. E. Dullmann, B. Eichler, R. Eichler, H. W. Gaggeler, D. T. Jost, D. Piguet,
and A. Turler. IVO, a device for In situ Volatilization and On-line detection of
products from heavy ion reactions. Nuclear Instruments and Methods in Physics
Research A, 479:631–639, March 2002.
[80] L. K. Koopal. Manual of symbols and terminology for physicochemical quantities
and units. Appendix II, Part I. International Edition. 2001.
[81] Ch. E. Dullmann, B. Eichler, R. Eichler, H. W. Gaggeler, and A. Turler. On the
stability and volatility of group 8 tetroxides MO4 (M = ruthenium, osmium, and
hassium (Z = 108)). J. Phys. Chem. B, 106:6679–6684, 2002.
[82] V. Pershina, T. Bastug, B. Fricke, and S. Varga. The electronic structure and
properties of group 8 oxides mo4, where m=ru, os, and element 108, hs. J. Chem.
Phys., 115(2):792–799, July 2001.
[83] Andre von Zweidorf, W. Bruchle, S. Burger, H. Hummrich, Jens Volker Kratz,
B. Kuczewski, G. Langrock, U. Rieth, M. Schadel, N. Trautmann, K. Tsukada,
and N. Wiehl. Evidence for the formation of sodium hassate(viii). Radiochimica
Acta, 92:855–861, 2004.
[84] Michael Bender, Paul-Henri Heenen, and P. G. Reinhard. Self-consistent mean-
field models for nuclear structure. Rev. Mod. Phys., 75:121–180, 2003.
[85] M.G. Itkis, A.A. Bogachev, I.M. Itkis, J. Kliman, G.N. Knyazheva, N.A. Kon-
dratiev, E.M. Kozulin, L. Krupa, Yu.Ts. Oganessian, I.V. Pokrovsky, E.V.
Prokhorova, and A.Ya. Rusanov. The processes of fusion-fission and quasi-fission
of superheavy nuclei. Nuclear Physics A, 787(1-4):150 – 159, 2007. Proceedings of
the Ninth International Conference on Nucleus-Nucleus Collisions - (NN2006).
144 Bibliography
[86] V. Ninov, K. E. Gregorich, and C. A. McGrath. Proceedings of the enam98. In
Exotic Nuclei and Atomic Masses, page 704, Bellaire, Michigan, 1998. AIP Conf.
Proc. 455.
[87] Yu.A. Lazarev, Yu.V. Lobanov, A.N. Mezentsev, Yu.Ts. Oganessian, V.G. Sub-
botin, V.K. Utyonkov, F.Sh. Abdullin, V.V. Bechterev, S. Iliev, I.V. Kolesov,
A.N. Polyakov, I.M. Sedykh, I.V. Shirokovsky, A.M. Sukhov, Yu.S. Tsyganov, and
V.E. Zhuchko. In Proceedings of the International School-Seminar on Heavy Ion
Physics, Dubna, Russia, volume 2, page 497, JINR, Dubna, 1993,.
[88] I. J. Zvara. The Inorganic Radiochemistry of Heavy Elements: Methods for Study-
ing Gaseous Compounds. Springer-Verlag, 2007.
[89] I. Zvara. Thermochromatographic method of separation of chemical elements in
nuclear and radiochemistry. Isotopenpraxis, 26:251–258, 1990.
[90] U. W. Kirbach, C. M. Folden, III, T. N. Ginter, K. E. Gregorich, D. M. Lee,
V. Ninov, J. P. Omtvedt, J. B. Patin, N. K. Seward, D. A. Strellis, R. Sudowe,
A. Turler, P. A. Wilk, P. M. Zielinski, D. C. Hoffman, and H. Nitsche. The
Cryo-Thermochromatographic Separator (CTS): A new rapid separation and α-
detection system for on-line chemical studies of highly volatile osmium and hassium
(Z=108) tetroxides. Nuclear Instruments and Methods in Physics Research A,
484:587–594, May 2002.
[91] K. Tinschert, R. Lang, J.Mader, J. Robach, P. Spadtke, and A.Yakushev. Ion
beam production from rare isotopes with gsi ecr ion sources. In Proceedings of
ECRIS08, Chicago, IL USA, 2008.
[92] G. Audi, A. H. Wapstra, and C. Thibault. The Ame2003 atomic mass evaluation
(II). Tables, graphs and references. Nuclear Physics A, 729:337–676, December
2003.
[93] R. Eichler, W. Bruchle, R. Buda, S. Burger, R. Dressler, Ch. E. Dullmann,
J. Dvorak, K. Eberhardt, B. Eichler, C. M. Folden III, H. W. Gaggeler, K. E.
Gregorich, F. Haenssler, D. C. Hoffman, H. Hummrich, E. Jager, J. V. Kratz,
B. Kuczewski, D. Liebe, D. Nayak, H. Nitsche, D. Piguet, Z. Qin, U. Rieth,
M. Schadel, B. Schausten, E. Schimpf, A. Semchenkov, S. Soverna, R. Sudowe,
N. Trautmann, P. Thorle, A. Turler, B. Wierczinski, N. Wiehl, P. A. Wilk,
G. Wirth, A. B. Yakushev, and A. von Zweidorf. Attempts to chemically in-
vestigate element 112. Radiochimica Acta, 94(4):181–191, 2006.

Bibliography 145
[94] M. Schadel. Chemie superschwerer elemente. Angewandte Chemie, 118:378, 2006.
[95] J. Runke and K. Eberhardt. private communication.
[96] I. Zvara. Simulation of Thermochromatographic Processes by the Monte Carlo
Method. Radiochimica Acta, 38:95–101, 1985.
[97] Yu.Ts.Oganessian. private communication.
[98] James F. Ziegler. Srim-2003. Nuclear Instruments and Methods in Physics Re-
search Section B: Beam Interactions with Materials and Atoms, 219-220:1027 –
1036, 2004. Proceedings of the Sixteenth International Conference on Ion Beam
Analysis.
[99] S. Hofmann. Status and prospects of synthesizing superheavy elements. The
European Physical Journal A - Hadrons and Nuclei, 15(1):195–200, September
2002.
[100] K. H. Schmidt, C. C. Sahm, K. Pielenz, and H. G. Clerc. Some remarks on the
error analysis in the case of poor statistics. Zeitschrift fur Physik A Hadrons and
Nuclei, 316(1):19–26, February 1984.
[101] Experimental Unevaluated Nuclear Data List (XUNDL). Evaluated Nuclear Struc-
ture Data File (ENSDF). http://www.nndc.bnl.gov/ensdf.
[102] Yu. Ts. Oganessian, V. K. Utyonkov, Yu. V. Lobanov, F. Sh. Abdullin, A. N.
Polyakov, R. N. Sagaidak, I. V. Shirokovsky, Yu. S. Tsyganov, A. A. Voinov,
G. G. Gulbekian, S. L. Bogomolov, B. N. Gikal, A. N. Mezentsev, S. Iliev, V. G.
Subbotin, A. M. Sukhov, K. Subotic, V. I. Zagrebaev, G. K. Vostokin, M. G.
Itkis, K. J. Moody, J. B. Patin, D. A. Shaughnessy, M. A. Stoyer, N. J. Stoyer,
P. A. Wilk, J. M. Kenneally, J. H. Landrum, J. F. Wild, and R. W. Lougheed.
Synthesis of the isotopes of elements 118 and 116 in the 249Cf and 245Cm + 48Ca
fusion reactions. Physical Review C (Nuclear Physics), 74(4):044602, 2006.
[103] K. Morita, K. Morimoto, D. Kaji, T. Akiyama, S. Goto, H. Haba, E. Ideguchi,
K. Katori, H. Koura, H. Kudo, T. Ohnishi, A. Ozawa, T. Suda, K. Sueki,
F. Tokanai, K. Yamaguchi, K. Yoneda, and A. Yoshida. Experiment on Synthesis
of an Isotope 277112 by 208Pb+70Zn Reaction. Journal of the Physical Society of
Japan, 76(4):043201, April 2007.
146 Bibliography
[104] Yuri Oganessian. Heaviest nuclei from 48Ca-induced reactions. Journal of Physics
G: Nuclear and Particle Physics, 34(4):R165–R242, 2007.
[105] V. B. Zlokazov. Nuclear Instruments and Methods in Physics Research, 151:303,
1978.
[106] Yu. Ts. Oganessian, V. K. Utyonkov, Yu. V. Lobanov, F. Sh. Abdullin, A. N.
Polyakov, I. V. Shirokovsky, Yu. S. Tsyganov, A. N. Mezentsev, S. Iliev, V. G.
Subbotin, A. M. Sukhov, K. Subotic, O. V. Ivanov, A. N. Voinov, V. I. Zagrebaev,
K. J. Moody, J. F. Wild, N. J. Stoyer, M. A. Stoyer, and R. W. Lougheed. Mea-
surements of cross sections for the fusion-evaporation reactions 204,206,207,208Pb+48Ca and 207Pb+ 34S: Decay properties of the even-even nuclides 238Cf and 250No.
Phys. Rev. C, 64(5):054606–, October 2001.
[107] K. Nishio, H. Ikezoe, Y. Nagame, M. Asai, K. Tsukada, S. Mitsuoka, K. Tsuruta,
K. Satou, C. J. Lin, and T. Ohsawa. Evidence of complete fusion in the sub-barrier16O+238U reaction. Phys. Rev. Lett., 93(16):162701–, October 2004.
[108] K. Nishio, H. Ikezoe, S. Mitsuoka, I. Nishinaka, Y. Nagame, Y. Watanabe, T. Oht-
suki, K. Hirose, and S. Hofmann. Effects of nuclear orientation on the mass dis-
tribution of fission fragments in the reaction of 36S + 238U. Physical Review C
(Nuclear Physics), 77(6):064607, 2008.
[109] S. P. Tretyakova, A. A. Ogloblin, R. N. Sagaidak, S. V. Khlebnikov, and W. Trza-
ska. Study of nucleus-nucleus potential by combined measurement of deep sub-
barrier fusion and cluster decay. Nuclear Physics A, 734(Supplement 1):E33–E36,
April 2004.
[110] V. Yu. Denisov and S. Hofmann. Formation of superheavy elements in cold fusion
reactions. Physical Review C (Nuclear Physics), 61(3):034606–, February 2000.
[111] B. Kadkhodayan, A. Turler, K. E. Gregorich, P. A. Baisden, K. R. Czerwinski,
B. Eichler, H. W. Gaggeler, T. M. Hamilton, D. T. Jost, C. D. Kacher, A. Ko-
vacs, S. A. Kreek, M. R. Lane, M. F. Mohar, M. P. Neu, N. J. Stoyer, E. R.
Sylwester, D. M. Lee, M. J. Nurmia, G. T. Seaborg, and D. C. Hoffman. On-line
gas chromatographic studies of chlorides of rutherfordium and homologs Zr and
Hf. Radiochimica Acta, 72:169, 1996.

Bibliography 147
[112] Albert Ghiorso, Matti Nurmia, Kari Eskola, James Harris, and Pirkko Eskola.
New element hahnium, atomic number 105. Phys. Rev. Lett., 24(26):1498–, June
1970.

148

List of Figures
1.1 Nuclear shell model scheme . . . . . . . . . . . . . . . . . . . . . . . . . 13
1.2 Nilsson model scheme . . . . . . . . . . . . . . . . . . . . . . . . . . . . . 14
1.3 Nilsson scheme close to 270Hs . . . . . . . . . . . . . . . . . . . . . . . . 15
1.4 Experimental shell effects . . . . . . . . . . . . . . . . . . . . . . . . . . 17
1.5 SF half-lives . . . . . . . . . . . . . . . . . . . . . . . . . . . . . . . . . . 18
1.6 Schematic drawing of the fusion reaction towards creation of SHE . . . . 20
1.7 Potential energy surface of a fusion reaction . . . . . . . . . . . . . . . . 22
1.8 Interaction potential of spherical nuclei . . . . . . . . . . . . . . . . . . . 23
1.9 Theoretical EVR cross sections for various reactions . . . . . . . . . . . . 31
1.10 Theoretical excitation functions for DGFRS experiment . . . . . . . . . . 31
1.11 Comparisson between HIVAP and experimental results . . . . . . . . . . 33
1.12 HIVAP prediction . . . . . . . . . . . . . . . . . . . . . . . . . . . . . . . 34
1.13 Shell-correction energy and half-lives of SHE . . . . . . . . . . . . . . . . 37
1.14 Ground-state shell corrections of SHE . . . . . . . . . . . . . . . . . . . . 38
1.15 Comparison of α decay energies . . . . . . . . . . . . . . . . . . . . . . . 39
1.16 Decay scenario of SHE . . . . . . . . . . . . . . . . . . . . . . . . . . . . 40
1.17 Decay properties of Hs isotopes and daughters . . . . . . . . . . . . . . . 42
1.18 Schematic layout of a gas-filled separator . . . . . . . . . . . . . . . . . . 46
149
150 List of Figures
1.19 Experimental setup of Hs chemistry experiments . . . . . . . . . . . . . . 50
2.1 Experimental setup . . . . . . . . . . . . . . . . . . . . . . . . . . . . . . 60
2.2 Quartz boat with elementary sulfur . . . . . . . . . . . . . . . . . . . . . 62
2.3 Picture of mounted the faraday cup . . . . . . . . . . . . . . . . . . . . . 63
2.4 Artesia target wheel with first target . . . . . . . . . . . . . . . . . . . . 64
2.5 Artesia target wheel with second target . . . . . . . . . . . . . . . . . . . 65
2.6 α measurement of standard and target segment . . . . . . . . . . . . . . 67
2.7 γ measurement of standard and target segment . . . . . . . . . . . . . . 67
2.8 Recoil chamber . . . . . . . . . . . . . . . . . . . . . . . . . . . . . . . . 68
2.9 Bottom detector panel . . . . . . . . . . . . . . . . . . . . . . . . . . . . 70
2.10 New detector chip . . . . . . . . . . . . . . . . . . . . . . . . . . . . . . . 70
2.11 Technical drawing of COMPACT . . . . . . . . . . . . . . . . . . . . . . 71
2.12 Photograph of COMPACT . . . . . . . . . . . . . . . . . . . . . . . . . . 71
2.13 COMPACT temperatures . . . . . . . . . . . . . . . . . . . . . . . . . . 72
2.14 Data acquisition electronics . . . . . . . . . . . . . . . . . . . . . . . . . 74
2.15 Gas system . . . . . . . . . . . . . . . . . . . . . . . . . . . . . . . . . . 75
2.16 Photograph of the experimental setup . . . . . . . . . . . . . . . . . . . . 76
2.17 Schematic drawing of the DGFRS . . . . . . . . . . . . . . . . . . . . . . 77
2.18 Picture of the DGFRS . . . . . . . . . . . . . . . . . . . . . . . . . . . . 78
2.19 Target Box . . . . . . . . . . . . . . . . . . . . . . . . . . . . . . . . . . 80
2.20 DGFRS detection system . . . . . . . . . . . . . . . . . . . . . . . . . . . 82
2.21 Picture of the focal-plane detectors . . . . . . . . . . . . . . . . . . . . . 83
3.1 Alpha sum spectrum . . . . . . . . . . . . . . . . . . . . . . . . . . . . . 88
3.2 Detector channel . . . . . . . . . . . . . . . . . . . . . . . . . . . . . . . 92
List of Figures 151
4.1 Observed decay chain in Hs chemistry experiment . . . . . . . . . . . . . 106
4.2 Production cross sections and limits measured in HS chemistry experiment109
4.3 Total beam-on and beam-off α-particle energy spectra . . . . . . . . . . . 110
4.4 Observed decay chains . . . . . . . . . . . . . . . . . . . . . . . . . . . . 112
4.5 Time intervals between α-particles . . . . . . . . . . . . . . . . . . . . . 114
4.6 Excitation functions of DGFRS experiment . . . . . . . . . . . . . . . . . 117
4.7 Excitation functions of previous Hs chemistry experiment . . . . . . . . . 119
4.8 Excitation functions with different asymmetry . . . . . . . . . . . . . . . 122
4.9 Fusion probability dependence on the excitation energy . . . . . . . . . . 123
4.10 Excitation functions of two asymmetries and (B-Q)-values . . . . . . . . 124
4.11 Fusion probability of all three different reactions . . . . . . . . . . . . . . 125
5.1 Contour plot E119 . . . . . . . . . . . . . . . . . . . . . . . . . . . . . . 132
5.2 Contour plot E120 . . . . . . . . . . . . . . . . . . . . . . . . . . . . . . 133

152
List of Tables
1.1 Comparison of four fusion reactions . . . . . . . . . . . . . . . . . . . . . 30
1.2 Decay properties of Hs isotopes near Z=108, N=162 and daughters . . . 41
1.3 List of gas-filled recoil separators . . . . . . . . . . . . . . . . . . . . . . 45
2.1 Details of both target sets . . . . . . . . . . . . . . . . . . . . . . . . . . 66
2.2 Target thicknesses results . . . . . . . . . . . . . . . . . . . . . . . . . . . 66
2.3 List of targets used in previous DGFRS experiments . . . . . . . . . . . 79
3.1 Experimental conditions of DGFRS experiment . . . . . . . . . . . . . . 86
3.2 Experimental conditions in Hs chemistry experiment . . . . . . . . . . . 89
3.3 Relative areas of the detector channel . . . . . . . . . . . . . . . . . . . . 93
3.4 Geometrical probabilities of different surfaces . . . . . . . . . . . . . . . 97
3.5 Detection probabilities for an α-α-SF decay chain. . . . . . . . . . . . . . 98
3.6 Detection probabilities for an α-SF decay chain. . . . . . . . . . . . . . . 98
3.7 Parameter set at E* = 39 MeV . . . . . . . . . . . . . . . . . . . . . . . 100
3.8 Parameter set at E* = 51 MeV . . . . . . . . . . . . . . . . . . . . . . . 100
3.9 Number of expected randomly correlated events . . . . . . . . . . . . . . 102
3.10 Decay chain search efficiency for the subsequent time windows method . 104
4.1 Reaction comparison . . . . . . . . . . . . . . . . . . . . . . . . . . . . . 118
153

154 List of Tables
4.2 Previous decay properties of Hs isotopes near Z=108, N=162 . . . . . . . 127
4.3 Updated decay properties of Hs isotope Z=108, N=162 . . . . . . . . . . 128
5.1 Comparison of fusion reactions leading to element 119 . . . . . . . . . . . 131
5.2 Comparison of fusion reactions leading to element 120 . . . . . . . . . . . 132