pyrocumulonimbus lightning and fire ignition on black...
TRANSCRIPT

Accepted manuscript July 2017 - Journal of Geophysical Research: Atmospheres
1
Pyrocumulonimbus lightning and fire ignition on Black Saturday in southeast 1
Australia 2
3
A. J. Dowdy1, M. D. Fromm2, and N. McCarthy3 4
1Bureau of Meteorology, Docklands, VIC, 3007, Australia 5
2Naval Research Laboratory, Washington, D.C., 20375, USA 6
3University of Queensland, Brisbane, QLD, 4072, Australia 7
Corresponding author: Andrew Dowdy ([email protected]) 8
Key Points: 9
• Electrified pyrocumulonimbus are investigated for Black Saturday, demonstrating 10
extensive deep convection and lightning activity 11
• Relationships between lightning activity and fire behavior are documented, with 12
implications for remote-sensing guidance and nowcasting 13
• First examination of fire ignition from pyrogenic lightning, indicating extreme distances 14
for the risk of new ignitions 15

Accepted manuscript July 2017 - Journal of Geophysical Research: Atmospheres
2
Abstract 16
A number of devastating wildfires occurred in southeast Australia on 7 February 2009, 17
colloquially known as Black Saturday. Atmospheric responses to this extreme fire event are 18
investigated here with a focus on convective processes associated with fire activity (i.e., 19
pyroconvection). We examine six different fire complexes on Black Saturday, finding three 20
clearly distinct pyrocumulonimbus storms, the largest of which reached heights of 15 km on that 21
day and generated hundreds of lightning strokes. The first lightning stroke was recorded near the 22
largest fire complex five hours after fire ignition. One of the pyrocumulonimbus storms was 23
initiated close to midnight due to mesoscale influences, consistent with extreme fire behavior 24
observed at that time for that particular fire. As another example of fire-atmosphere interactions, 25
a fire that started late on Black Saturday is examined in relation to ignition caused by pyrogenic 26
lightning, with implications for understanding the maximum rate of spread of a wildfire. Results 27
are discussed in relation to another pyrocumulonimbus event associated with the 2003 Canberra 28
fires. Our findings are intended to provide a greater understanding of pyroconvection and fire-29
atmosphere feedback processes, as well as help enhance wildfire response capabilities. We also 30
demonstrate the potential for using lightning, radar and satellite remote-sensing in combination 31
with thermodynamic analyses as well as synoptic and mesoscale dynamics to provide enhanced 32
real-time guidance for dangerous fire conditions associated with pyroconvection, as well as for 33
the risk of new fire ignitions from pyrogenic lightning. 34
1. Introduction 35
The fire regime of southern Australia is notable for the extremely dangerous conditions 36
that can sometimes occur during the austral summer [Luke and McArthur, 1978; Russell-Smith et 37
al., 2007; Bradstock, 2010; Sullivan et al., 2012; Murphy et al., 2013]. Extreme fire-weather 38
conditions on Black Saturday (7 February 2009) near Melbourne in southeast Australia led to the 39
occurrence of wildfires that killed 173 persons, destroyed over 2,000 homes, burnt more than 40
450,000 ha and resulted in losses of over four billion Australian dollars [VBRC, 2010]. 41
This event involved the combined influence of a number of extreme weather features. No 42
precipitation was recorded in the four weeks leading up to Black Saturday at the Melbourne 43
Airport observing station, with a strong anticyclone dominating southeastern Australia’s weather 44
in the week prior to Black Saturday leading to a deep airmass of very hot air over this region 45
[BoM, 2009]. On Black Saturday, there was an approaching cold front southwest of this region 46
associated with a low pressure system further to the south as well as a high pressure system to 47
the east (Fig. 1). This set of synoptic features typifies many of the historical extreme fire events 48
in this region [Reeder and Smith, 1987; Mills, 2005a; Fiddes et al., 2015; Reeder et al., 2015]. 49
The approaching cold front resulted in strong northwesterly winds that transported extremely hot 50
and dry air to the region near Melbourne from further inland, with the maximum temperature in 51
Melbourne reaching 46.4°C – the highest recorded from 154 years of record [BoM, 2009]. The 52
resultant extreme wind, heat, low humidity and fuel moisture [Sullivan and Matthews, 2013] on 53
Black Saturday combined to produce fire danger ratings reported to be as extreme as any in the 54
historical record for southeast Australia [BoM, 2009]. Furthermore, a wind change associated 55
with a surface trough ahead of the cold front (Fig. 1) passed over the fire region during the late 56
afternoon [BoM, 2009], leading to extremely dangerous fire behavior in terms of observed 57
intensity, rate of spread and spotting (i.e., the development of new fires, known as spot-fires, 58
ignited by burning debris transported by the fire plume) [Cruz et al., 2012]. 59
Accepted manuscript July 2017 - Journal of Geophysical Research: Atmospheres
3
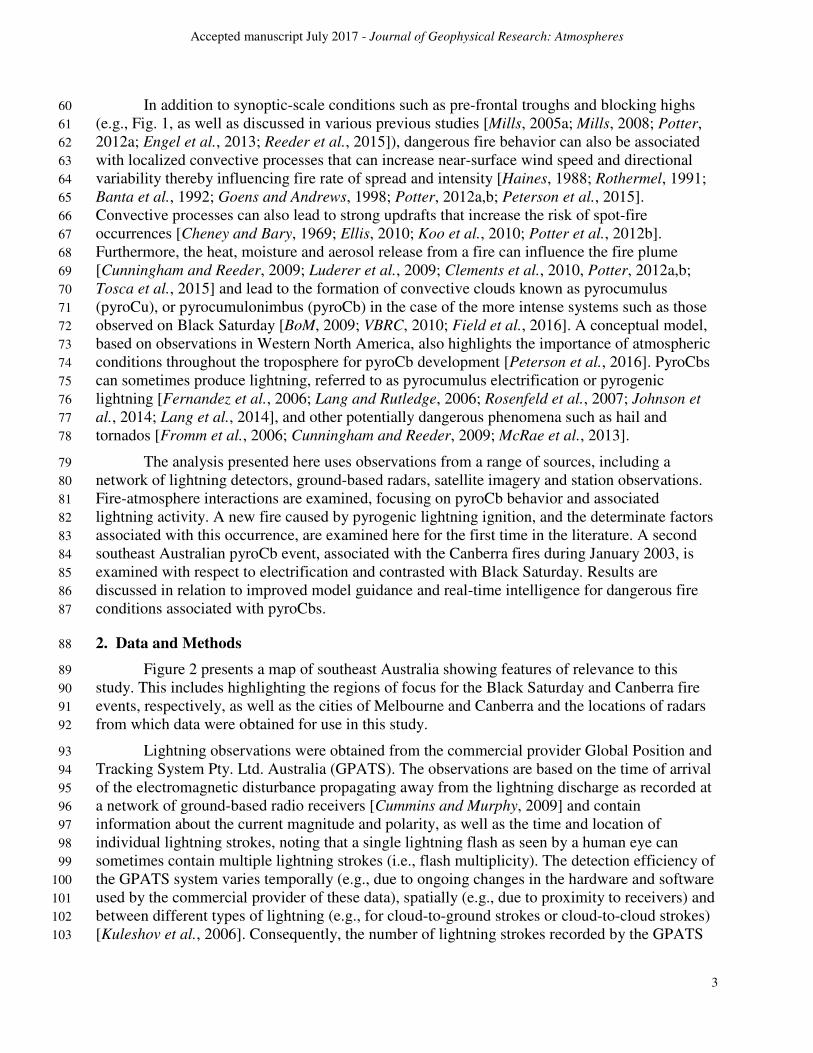
In addition to synoptic-scale conditions such as pre-frontal troughs and blocking highs 60
(e.g., Fig. 1, as well as discussed in various previous studies [Mills, 2005a; Mills, 2008; Potter, 61
2012a; Engel et al., 2013; Reeder et al., 2015]), dangerous fire behavior can also be associated 62
with localized convective processes that can increase near-surface wind speed and directional 63
variability thereby influencing fire rate of spread and intensity [Haines, 1988; Rothermel, 1991; 64
Banta et al., 1992; Goens and Andrews, 1998; Potter, 2012a,b; Peterson et al., 2015]. 65
Convective processes can also lead to strong updrafts that increase the risk of spot-fire 66
occurrences [Cheney and Bary, 1969; Ellis, 2010; Koo et al., 2010; Potter et al., 2012b]. 67
Furthermore, the heat, moisture and aerosol release from a fire can influence the fire plume 68
[Cunningham and Reeder, 2009; Luderer et al., 2009; Clements et al., 2010, Potter, 2012a,b; 69
Tosca et al., 2015] and lead to the formation of convective clouds known as pyrocumulus 70
(pyroCu), or pyrocumulonimbus (pyroCb) in the case of the more intense systems such as those 71
observed on Black Saturday [BoM, 2009; VBRC, 2010; Field et al., 2016]. A conceptual model, 72
based on observations in Western North America, also highlights the importance of atmospheric 73
conditions throughout the troposphere for pyroCb development [Peterson et al., 2016]. PyroCbs 74
can sometimes produce lightning, referred to as pyrocumulus electrification or pyrogenic 75
lightning [Fernandez et al., 2006; Lang and Rutledge, 2006; Rosenfeld et al., 2007; Johnson et 76
al., 2014; Lang et al., 2014], and other potentially dangerous phenomena such as hail and 77
tornados [Fromm et al., 2006; Cunningham and Reeder, 2009; McRae et al., 2013]. 78
The analysis presented here uses observations from a range of sources, including a 79
network of lightning detectors, ground-based radars, satellite imagery and station observations. 80
Fire-atmosphere interactions are examined, focusing on pyroCb behavior and associated 81
lightning activity. A new fire caused by pyrogenic lightning ignition, and the determinate factors 82
associated with this occurrence, are examined here for the first time in the literature. A second 83
southeast Australian pyroCb event, associated with the Canberra fires during January 2003, is 84
examined with respect to electrification and contrasted with Black Saturday. Results are 85
discussed in relation to improved model guidance and real-time intelligence for dangerous fire 86
conditions associated with pyroCbs. 87
2. Data and Methods 88
Figure 2 presents a map of southeast Australia showing features of relevance to this 89
study. This includes highlighting the regions of focus for the Black Saturday and Canberra fire 90
events, respectively, as well as the cities of Melbourne and Canberra and the locations of radars 91
from which data were obtained for use in this study. 92
Lightning observations were obtained from the commercial provider Global Position and 93
Tracking System Pty. Ltd. Australia (GPATS). The observations are based on the time of arrival 94
of the electromagnetic disturbance propagating away from the lightning discharge as recorded at 95
a network of ground-based radio receivers [Cummins and Murphy, 2009] and contain 96
information about the current magnitude and polarity, as well as the time and location of 97
individual lightning strokes, noting that a single lightning flash as seen by a human eye can 98
sometimes contain multiple lightning strokes (i.e., flash multiplicity). The detection efficiency of 99
the GPATS system varies temporally (e.g., due to ongoing changes in the hardware and software 100
used by the commercial provider of these data), spatially (e.g., due to proximity to receivers) and 101
between different types of lightning (e.g., for cloud-to-ground strokes or cloud-to-cloud strokes) 102
[Kuleshov et al., 2006]. Consequently, the number of lightning strokes recorded by the GPATS 103

Accepted manuscript July 2017 - Journal of Geophysical Research: Atmospheres
4
system is used throughout this study as a lower bound measure of the total lightning strokes that 104
occurred (i.e., the sum of the number of cloud-to-ground and cloud-to-cloud lightning strokes). 105
Data from three weather radars are used here to examine the Black Saturday fire event, 106
located at Laverton (37.9°S, 144.8°E) in the city of Melbourne, Yarrawonga (36.0°S, 146.0°E) 107
about 250 km northeast of Melbourne and Bairnsdale (37.8°S, 147.6°E) about 250 km east of 108
Melbourne. These data are examined here for times starting from 1800 LT, noting that the 109
Laverton radar was inoperable prior to 1806 LT due to the extreme heat. A fourth weather radar 110
is used to examine the Canberra fires, located at Captains Flat (35.6° S, 149.5° E) about 50 km 111
southeast of Canberra in southeast Australia, with the Canberra pyrocumulonimbus event on 18 112
January 2003 selected here for comparison with Black Saturday due to the severe thunderstorm 113
characteristics that were observed in association with that event [Fromm et al., 2006, 2012; Mills 114
and McCaw, 2010; McRae et al., 2013, 2015]. Reflectivity data are used to derive echo-top 115
altitudes, based on a 5 dBZ threshold, with prior radar analyses of pyroCbs [Fromm et al., 2006, 116
2012; Rosenfeld et al., 2007] showing how echo-top data are informative for examining both the 117
internal structure and the convective injection height of pyroCb events. The radar echoes come 118
not only from cloud hydrometeors, but also from debris lofted by the fires [Jones, 1950; Lindley 119
et al., 2010; Baum et al., 2015]. 120
Active fire observations are obtained from the Moderate Resolution Imaging 121
Spectroradiometer (MODIS) on the Terra and Aqua satellites [Giglio et al., 2009]. There were 122
three satellite overpasses for the fire region on the afternoon and evening of Black Saturday, 123
occurring for Aqua during the hour of 1500 Local Time (LT: 11 hours ahead of UTC, including 124
1 hour daylight saving) and for Terra during the hour of 2300 LT on 7 February 2009, as well as 125
for Aqua during the hour of 0200 LT on 8 February 2009. 126
A gridded analysis of precipitation observations is used from the Australian Water 127
Availability Project (AWAP) [Jones et al., 2009], available on a 0.05° grid in both latitude and 128
longitude, based on daily accumulated precipitation totals for the 24-hour period to 0900 LT 129
each day. This grid is also used for the aggregation and analysis of the other datasets considered 130
throughout this study (i.e., the lightning, radar and active fire observations), as these other 131
datasets are available at finer spatial and temporal resolutions than the AWAP data. 132
3. Results 133
3.1. Black Saturday observations 134
Figure 3 shows maps of fire, lightning and precipitation observations on Black Saturday, 135
with the domain of these maps as highlighted in Fig. 2. Six notable fire events on that day are 136
listed, with the largest being the Kinglake complex. These fire events were all ignited on Black 137
Saturday, with the exception of the Bunyip fire which had been ignited a few days previously but 138
grew rapidly on Black Saturday due to the extreme fire weather conditions on that day (for 139
details, see [VBRC, 2010]). The Kinglake complex comprises a merging of the Kilmore East fire 140
and the Murrindindi fire which started on Black Saturday at around 1146 LT and 1445 LT, 141
respectively, with the Kilmore East fire being the most significant of the fires on Black Saturday 142
(resulting in 70% of the fatalities on that day and burning about 100,000 ha during the first 12 143
hours after ignition) [VBRC, 2010; Cruz et al., 2012]. The strongest lightning activity occurred 144
southeast (i.e., downwind) of the Kinglake fire complex, with some other lightning activity in the 145
broader region away from the fire events. Relatively little precipitation occurred in this region on 146

Accepted manuscript July 2017 - Journal of Geophysical Research: Atmospheres
5
Black Saturday, with only a small region of up to 4 mm precipitation occurring southeast of the 147
Kinglake complex. 148
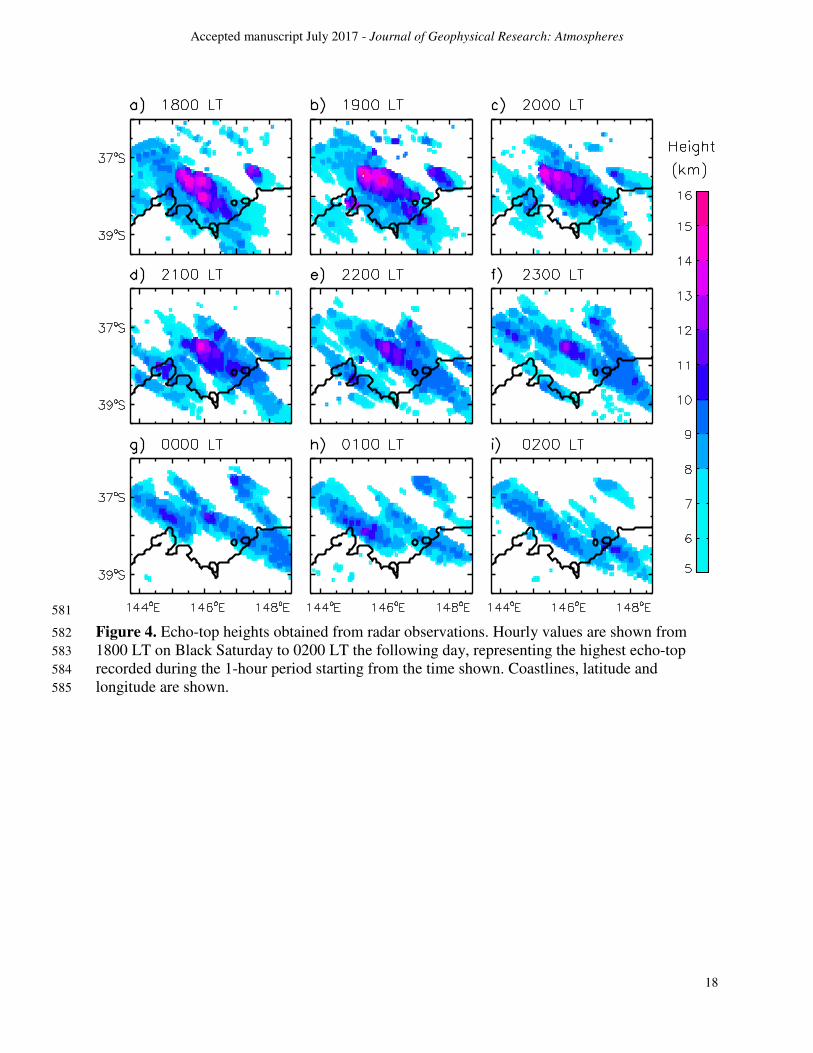
Figure 4 shows radar echo-top heights at hourly intervals, for heights above 5 km, with 149
the values representing the highest value recorded during that hour. The echo-tops have 150
maximum heights of 15 km during the hour of 1900 LT over the Kinglake fire complex and 151
extending towards the southeast. This was during the period of most extreme fire behavior, with 152
Cruz et al. [2012] reporting that the area affected by fire during the hour of 1800 LT 153
(approximately 63,000 ha) was more than double the entire area burned by the fires prior to this 154
time. Cruz et al. [2012] also report that the burn dynamics during the hour of 1900 LT were 155
similar to those during the hour of 1800 LT, with somewhat weaker fire propagation from 2000 156
LT onwards. In addition to the Kinglake fire plume, a number of other plumes are evident from 157
the radar observations. For example, the Dargo fire plume has echo-top heights of about 12 km 158
during the hour of 1800 LT (Fig. 4a, around 37.0°S and 147.5°E) and somewhat lower values in 159
subsequent hours. The Beechworth fire plume is also clearly apparent, reaching heights of 10 km 160
during the hours near midnight LT (Fig. 4e,f,g, around 36.5°S and 147.0°E). 161
3.2. Temporal evolution of the lightning activity 162
Figure 5 shows the temporal evolution of the observed lightning activity as well as active 163
fire observations. The first lightning stroke was recorded at 1650 LT in the region where the 164
pyroCb occurred for the Kinglake fire complex, with lightning activity during the hour of 1700 165
LT also occurring only in that region, indicating the influence of the fire activity on initiating the 166
lightning activity. 167
The majority of lightning activity during the hour of 1800 LT (Fig. 45d) is clustered 168
around the Kinglake fire complex, as well as some lightning strokes to the northwest mapping 169
out a line similar to the location of the wind change at this time associated with the synoptic-170
scale pre-frontal trough passing over the region at this time (see Cruz et al. [2012] and Fig. 1). 171
As the wind change progressed across this region it produced rising air masses above its leading 172
edge [Engel et al., 2013], which plausibly provided the trigger for initiating deep convection (as 173
indicated by the lightning activity) in locations away from the fire activity. During the following 174
two hours (1900 LT and 2000 LT), lightning activity is only sustained in the region around the 175
Kinglake pyroCb (a roughly elliptical region with a major axis of about 100 km in length), with 176
no lightning observed in surrounding regions, indicating the ongoing interaction between the 177
Kinglake fire complex and the atmospheric processes throughout this time period. 178
The first fire ignition of the Kinglake complex occurred shortly before 1200 LT [Cruz et 179
al., 2012], five hours prior to the first lightning observed in this region on Black Saturday. Such 180
a short time interval from fire ignition to lightning generation offers broad implications for 181
understanding fire behavior exacerbation rates, given that previous studies have shown that rapid 182
and deep convection may be associated with dangerous variations in fire behavior (e.g., Potter et 183
al. [2012b]). To put this time interval for Black Saturday into a more general context, a study of 184
multiple pyroCb events in North America [Peterson et al., 2016] reported that "generally 185
speaking, pyroCb can occur at any point in a fire's lifetime, occasionally as early as the first 48 186
hours." 187
In addition to the Kinglake complex, the other fire event with lightning activity strongly 188
clustered around it is the Beechworth fire. This fire was ignited at about 1800 LT on Black 189
Accepted manuscript July 2017 - Journal of Geophysical Research: Atmospheres
6
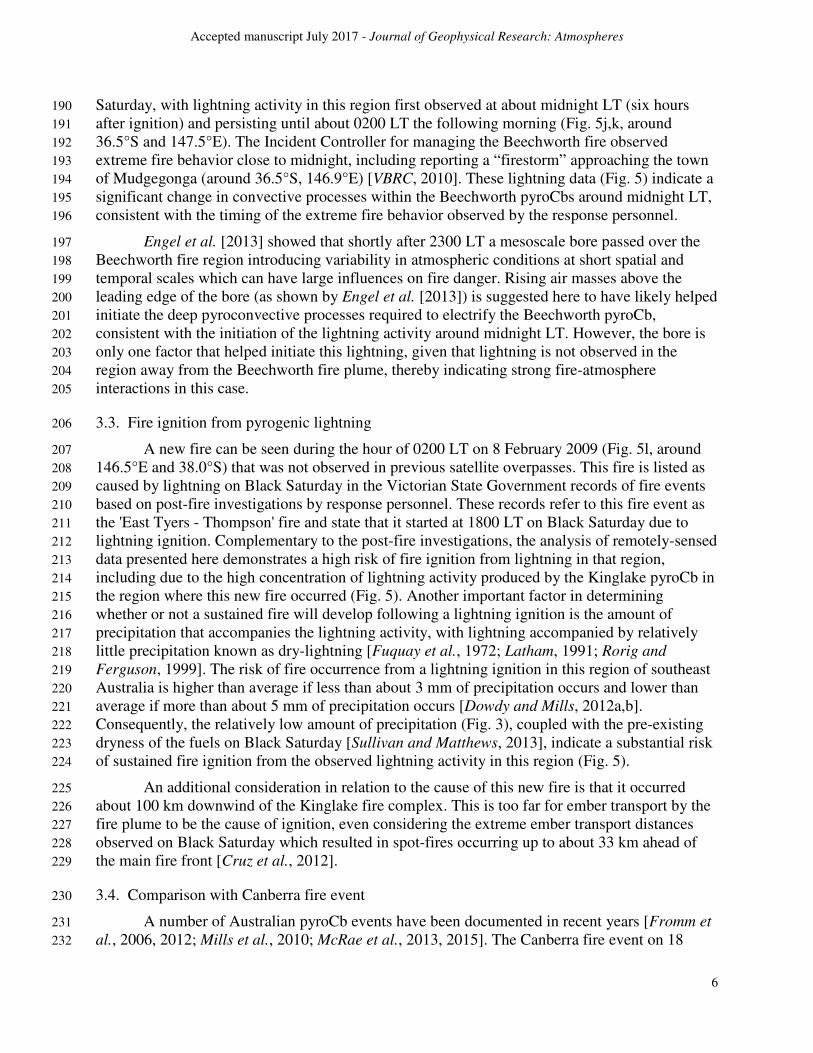
Saturday, with lightning activity in this region first observed at about midnight LT (six hours 190
after ignition) and persisting until about 0200 LT the following morning (Fig. 5j,k, around 191
36.5°S and 147.5°E). The Incident Controller for managing the Beechworth fire observed 192
extreme fire behavior close to midnight, including reporting a “firestorm” approaching the town 193
of Mudgegonga (around 36.5°S, 146.9°E) [VBRC, 2010]. These lightning data (Fig. 5) indicate a 194
significant change in convective processes within the Beechworth pyroCbs around midnight LT, 195
consistent with the timing of the extreme fire behavior observed by the response personnel. 196
Engel et al. [2013] showed that shortly after 2300 LT a mesoscale bore passed over the 197
Beechworth fire region introducing variability in atmospheric conditions at short spatial and 198
temporal scales which can have large influences on fire danger. Rising air masses above the 199
leading edge of the bore (as shown by Engel et al. [2013]) is suggested here to have likely helped 200
initiate the deep pyroconvective processes required to electrify the Beechworth pyroCb, 201
consistent with the initiation of the lightning activity around midnight LT. However, the bore is 202
only one factor that helped initiate this lightning, given that lightning is not observed in the 203
region away from the Beechworth fire plume, thereby indicating strong fire-atmosphere 204
interactions in this case. 205
3.3. Fire ignition from pyrogenic lightning 206
A new fire can be seen during the hour of 0200 LT on 8 February 2009 (Fig. 5l, around 207
146.5°E and 38.0°S) that was not observed in previous satellite overpasses. This fire is listed as 208
caused by lightning on Black Saturday in the Victorian State Government records of fire events 209
based on post-fire investigations by response personnel. These records refer to this fire event as 210
the 'East Tyers - Thompson' fire and state that it started at 1800 LT on Black Saturday due to 211
lightning ignition. Complementary to the post-fire investigations, the analysis of remotely-sensed 212
data presented here demonstrates a high risk of fire ignition from lightning in that region, 213
including due to the high concentration of lightning activity produced by the Kinglake pyroCb in 214
the region where this new fire occurred (Fig. 5). Another important factor in determining 215
whether or not a sustained fire will develop following a lightning ignition is the amount of 216
precipitation that accompanies the lightning activity, with lightning accompanied by relatively 217
little precipitation known as dry-lightning [Fuquay et al., 1972; Latham, 1991; Rorig and 218
Ferguson, 1999]. The risk of fire occurrence from a lightning ignition in this region of southeast 219
Australia is higher than average if less than about 3 mm of precipitation occurs and lower than 220
average if more than about 5 mm of precipitation occurs [Dowdy and Mills, 2012a,b]. 221
Consequently, the relatively low amount of precipitation (Fig. 3), coupled with the pre-existing 222
dryness of the fuels on Black Saturday [Sullivan and Matthews, 2013], indicate a substantial risk 223
of sustained fire ignition from the observed lightning activity in this region (Fig. 5). 224
An additional consideration in relation to the cause of this new fire is that it occurred 225
about 100 km downwind of the Kinglake fire complex. This is too far for ember transport by the 226
fire plume to be the cause of ignition, even considering the extreme ember transport distances 227
observed on Black Saturday which resulted in spot-fires occurring up to about 33 km ahead of 228
the main fire front [Cruz et al., 2012]. 229
3.4. Comparison with Canberra fire event 230
A number of Australian pyroCb events have been documented in recent years [Fromm et 231
al., 2006, 2012; Mills et al., 2010; McRae et al., 2013, 2015]. The Canberra fire event on 18 232

Accepted manuscript July 2017 - Journal of Geophysical Research: Atmospheres
7
January 2003 is particularly notable in that it resulted in pyroCbs that injected smoke into the 233
stratosphere and perturbed stratospheric aerosol loading for at least two months [Fromm et al., 234
2006]. Figure 6 shows the broad-scale meteorology on that day, including a large high in the 235
Tasman Sea to the east of the continent as well as a mid-latitude trough over southeast Australia 236
with a cold front further to the south of that region. Lightning activity associated with this event 237
has not previously been examined in the literature. However, hail activity and a tornado (a non-238
super-cell type of tornado) associated with this pyroCb have been documented [Fromm et al., 239
2006; Cunningham and Reeder, 2009; McRae et al., 2013], noting that tornado or hail 240
observations provide a means of defining severe thunderstorm occurrence (e.g., based on 241
Australian Bureau of Meteorology operational practices). Given these severe thunderstorm 242
characteristics of the Canberra event, it is selected here for examination in comparison with 243
Black Saturday. 244
Figure 7 presents observations similar to those shown in Figures 3 and 4, but for the 245
region around Canberra on 18 January 2003. These include satellite observations of active fires, 246
precipitation data and lightning observations, as well as echo-top heights (from the Captains Flat 247
radar about 50 km southeast of Canberra). 248
Lightning activity was not observed in the region near the fire activity, with only four 249
lightning strokes recorded over 100 km northeast of Canberra (Fig. 7b), noting that this lightning 250
activity was not downwind of the fires and occurred too far away to be associated with the fire 251
activity. Additionally, no thunder was recorded as being heard on this day by the Canberra office 252
of the Bureau of Meteorology in their thunderstorm observation records. 253
Although no lightning was observed in association with the Canberra pyroCb event, it 254
could be possible that lightning activity occurred but was not detected. For example, a case 255
occurred in the USA where the National Lightning Detection Network (NLDN) observed no 256
lightning activity associated with a pyroCb, even though cloud-to-cloud (intra-cloud) lightning 257
was observed by locally deployed lightning sensors [Lang et al., 2014]. However, even 258
considering the possibility that lightning did occur for the Canberra event but was not detected 259
by the GPATS network (e.g., relatively weak intra-cloud lightning), there is a clear difference 260
between Black Saturday and the Canberra event in terms of the characteristics of the lightning 261
activity. This is potentially associated with the Canberra event having extremely dry conditions 262
in some parts of the troposphere as compared to Black Saturday [Cunningham and Reeder, 2009; 263
McCaw et al., 2009] including the occurrence of a mid-tropospheric dry band for the Canberra 264
event that led to abrupt surface drying resulting from vertical mixing [Mills 2005b, 2008]. 265
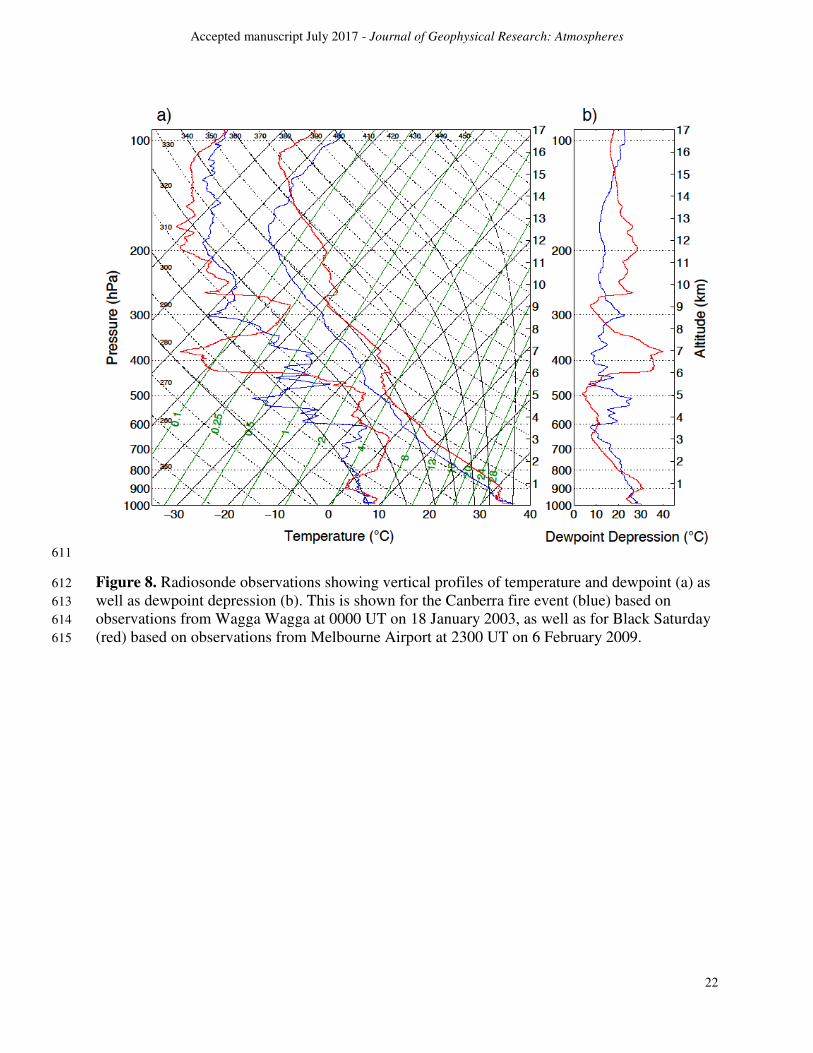
The relative dryness of the mid-troposphere for the Canberra event as compared to Black 266
Saturday is indicated by radiosonde observations during the middle of the day from Wagga 267
Wagga (35.11° S, 147.36° E: about 180 km west of Canberra) for the Canberra fire event and 268
from Melbourne Airport for Black Saturday (Fig. 8). For example, the dewpoint temperature 269
from 800 hPa to 700 hPa ranges from about -2°C to -7°C at Wagga Wagga as compared to 270
values from about 0°C to 3°C at Melbourne Airport. The thermodynamic environmental 271
conditions for the two cases show some broad similarities to each other, including an 'inverted v' 272
profile characterized by decreasing dewpoint depression with increasing height above the 273
surface, consistent with the conceptual model of Peterson et al. [2016] of a dry and deep mixed 274
layer with ambient mid-level moisture as typical factors associated with intense pyroCb 275
development. The lifted condensation level (LCL) is 640 hPa for Wagga Wagga and 620 hPa for 276
Melbourne Airport. Above the LCL at around 500-600 hPa, the dewpoint depression is larger for 277

Accepted manuscript July 2017 - Journal of Geophysical Research: Atmospheres
8
Wagga Wagga (ranging from about 15°C to 25°C) than for Melbourne Airport (ranging from 278
about 5°C to 10°C), while noting that at around 400 hPa the dewpoint depression is higher for 279
Melbourne Airport than Wagga Wagga. Drier conditions for the Canberra event as compared to 280
Black Saturday are also indicated by the precipitation observations presented here, with no 281
precipitation recorded in the region near the Canberra fires (Fig. 7b), compared with 1-4 mm 282
precipitation in the region where the Kinglake pyroCb occurred (Fig. 3c). 283
Although both of these fire events had deep convection reaching the stratosphere, as well 284
as the ‘inverted v’ type of atmospheric profile (Fig. 8), the lightning data have illuminated a 285
dichotomy between these two extreme pyroconvection events. We have suggested here that drier 286
conditions in the lower and middle troposphere for the Canberra event as compared with Black 287
Saturday could have potentially been an unfavorable factor for the generation of lightning 288
activity, while acknowledging that there are a range of uncertainties associated with these 289
processes (e.g., associated with the relative amount of entrainment and detrainment at different 290
tropospheric levels that the surface parcel from the fire will experience as it is lifted). It is also 291
noted that the atmospheric profiles shown in Fig. 8 represent particular locations and times that 292
are not exactly coincident with the actual pyroCb development in each case. Consequently, care 293
is taken here to avoid making generalized conclusions based on these results from only two days 294
(i.e., for Black Saturday and the Canberra event). To further examine this apparent conundrum 295
that the lightning observations have highlighted, examinations of other similar cases throughout 296
the world are intended for greater understanding of the processes leading to electrified 297
pyroconvection. 298
4. Discussion 299
The analysis presented here provides evidence that extensive pyroCb activity occurred on 300
Black Saturday, including a number of distinct electrified pyroCb clusters, the largest of which 301
reached heights of around 15 km on that day. As noted by Bannister [2009, 2014], fire agencies 302
were very concerned about the potential for pyroCb formation on Black Saturday, even though 303
forecast models did not indicate a high risk of thunderstorm development, as normal model 304
thunderstorm guidance does not represent the heat and moisture release from the fire. 305
Consequently, pyroCb-specific model guidance (e.g., as could be developed based on coupled 306
fire-atmosphere modelling [Clark et al., 1997; Cunningham and Reeder, 2009; Potter 2012b]) 307
and real-time intelligence (e.g., based on improved remote sensing capabilities) would greatly 308
add to the forecaster service to fire agencies. The analysis presented here indicates considerable 309
potential to use a range of remotely-sensed data in fire management applications, including 310
combining lightning observations with ground-based radar and satellite observations for 311
improved pyroCb monitoring and modelling (e.g., nowcasting). Additionally, the Himawari-8 312
and Himawari-9 satellites recently launched by Japan provide imagery at 10-minute intervals 313
over a longitudinal region surrounding Japan that includes Australia [Kurino, 2012], representing 314
a considerable advance in remote sensing capabilities in this region. 315
Previous studies demonstrate significant changes in fire behavior in response to synoptic 316
conditions on Black Saturday including in response to the pre-frontal trough and associated 317
change in wind direction [BoM, 2009; VBRC, 2010; Cruz et al., 2012; Engel et al. 2013]. The 318
results presented here build on these findings in showing that there was a significant atmospheric 319
response to this change in fire behavior, including the occurrence of pyrogenic lightning activity 320
tightly clustered around the fire plume of the Kinglake complex. Additionally, the new fire 321

Accepted manuscript July 2017 - Journal of Geophysical Research: Atmospheres
9
ignited by this pyrogenic lightning, examined in Section 3.3, further highlights the feedback 322
loops of influence between the atmosphere and fire behavior on Black Saturday associated with 323
these pyroconvective processes. In addition to indicating this strong coupling on Black Saturday 324
between the atmosphere and the fire activity, the lightning observations also suggest 325
considerable differences in pyroCb characteristics between Black Saturday and the Canberra fire 326
event. Differences between pyroCb events, such as for the Black Saturday and Canberra cases, 327
indicate considerable potential for improved understanding of pyroconvection based on 328
combining different data sets as presented here (including in relation to lightning, radar, 329
precipitation and satellite observations). 330
Complementary to previous studies focusing on the role of combustion-released moisture 331
and heat in driving pyroconvection [Cunningham and Reeder, 2009; Luderer et al., 2009; 332
Clements et al., 2010, Potter, 2012a,b; Tosca et al., 2015], the results for Black Saturday 333
demonstrate that synoptic-scale dynamics are also important to consider, including in relation to 334
the initiation of deep pyroconvective processes: e.g., as occurred around the time of the pre-335
frontal trough passing over the Kinglake fire region (examined in Section 3.2). In relation to 336
mesoscale dynamics, the initiation of deep convection around midnight LT for the Beechworth 337
pyroCb (as indicated by the lightning observations) does not match the mid-afternoon peak in the 338
severity of the near-surface fire weather conditions in this region [BoM, 2009; Cruz et al., 2012], 339
whereas the occurrence of rising air masses above the leading edge of the bore that passed over 340
this region (as shown previously by Engel et al. [2015]) is consistent with the timing of the onset 341
of lightning activity close to midnight. In addition to mesoscale dynamics associated with this 342
bore, strong fire-atmosphere interactions likely also played a role in triggering this pyroCb, given 343
that lightning is not observed in the broader surrounding region away from the Beechworth fire 344
plume. 345
Fire ignition by pyrogenic lightning has been reported by fire management authorities for 346
a number of recent wildfires, including the Fort McMurray fire in Alberta, Canada, in May 2016 347
and the Waroona fire in January 2016 in Western Australia [Ferguson, 2016], however, this 348
phenomena has not previously been examined in the scientific literature. The examinations 349
presented here for Black Saturday demonstrate that fires ignited by lightning generated within 350
the fire plume can occur at much larger distances ahead of the main fire front—of the order of 351
about 100 km—than fires ignited by burning debris transported by the fire plume (up to about 33 352
km [Cruz et al., 2012]), noting that this also has implications in relation to understanding the 353
maximum rate of spread of a wildfire. 354
The Black Saturday fire plumes were observed at stratospheric altitudes in the subsequent 355
days as detailed in a number of studies [Siddaway et al., 2010; Pumphrey et al., 2011; Glatthor 356
et al., 2013] and although these studies did not examine the stratospheric injection event 357
specifically they all speculated that pyroCb activity was likely the cause. However, a remarkable 358
aspect of the pyroCb phenomenon is that it has often been overlooked and its effects 359
misattributed [Fromm et al., 2010]. For example, de Laat et al. [2012] examined the Black 360
Saturday conditions and concluded that ‘extensive deep pyroconvection is not observed and 361
unlikely to have developed due to unfavorable meteorological conditions’ and proposed a 362
diabatic process for lofting between the middle troposphere and stratosphere. Hence it is 363
essential to fully explore events such as these to properly characterize the fire behavior, pyroCb 364
dynamics and resultant influence on conditions in the upper troposphere and lower stratosphere 365
(UTLS). It is also important to accurately characterize this transport process so that cloud, 366
Accepted manuscript July 2017 - Journal of Geophysical Research: Atmospheres
10
chemistry and climate models have a firm basis on which to evaluate the pyrogenic source term, 367
pathway from the boundary layer through cumulus cloud, and exhaust from the convective 368
column. 369
A greater understanding of pyroCb activity is important, given that fire-atmosphere 370
feedback processes can exacerbate the conditions associated with dangerous fire behavior. It is 371
intended that our findings will have benefits for fire response capabilities, based on improved 372
preparedness and real-time monitoring of the potential for dangerous fire conditions associated 373
with pyroconvection. Additionally, understanding the combined effects of heat, moisture and 374
aerosols on cloud microphysics is important for a range of weather and climate processes, 375
including in relation to improved modelling and prediction capabilities. 376
Acknowledgments 377
This research was supported by the Australian Government’s National Environmental Science 378
Programme. Assistance provided by Michael Whimpey and Josh Soderholm with radar data is 379
gratefully acknowledged. MODIS Active Fire Product data are available from the Land 380
Processes Distributed Active Archive Center (LP-DAAC) using the EOS Data Gateway web 381
interface (located at: http://reverb.echo.nasa.gov). Other data used here are available on request 382
from the Australia Bureau of Meteorology. The authors would like to thank the anonymous 383
reviewers for their insightful comments and suggestions that have contributed to improve this 384
paper. 385
References 386
Bannister, T. (2009), Modelling challenges from the Black Saturday 2009 event, In 'Modelling 387
and Understanding High Impact Weather': extended abstracts of the third CAWCR 388
Modelling Workshop, pp 134. Centre for Australian Weather and Climate Research, 389
Melbourne, Australia. 390
Bannister, T. (2014), Black Saturday 2009: A radar view of the Kilmore East fire, CAWCR 391
Research Letters, Issue 11, 10-13pp, ISSN: 1836-5949. 392
Banta, R. M., L. D. Olivier, E. T., Holloway, R. A., Kropfli, B. W., Bartram, R. E., Cupp, and M. 393
J. Post (1992), Smoke-column observations from two forest fires using Doppler lidar and 394
Doppler radar, J. Appl. Meteorol., 31(11), 1328-1349. 395
Baum, T. C., L. Thompson, and K. Ghorbani (2015), The Nature of Fire Ash Particles: 396
Microwave Material Properties, Dynamic Behavior, and Temperature Correlation. IEEE 397
Journal of Selected Topics in Applied Earth Observations and Remote Sensing, 8(2), 480-398
492. 399
Bradstock, R. A. (2010), A biogeographic model of fire regimes in Australia: current and future 400
implications, Global Ecology and Biogeography, 19(2), 145-158. 401
Bureau of Meteorology (BoM) (2009), Meteorological aspects of the 7 February 2009 Victorian 402
fires, an overview. Bureau of Meteorology report for the 2009 Victorian Bushfires Royal 403
Commission, Bureau of Meteorology, Melbourne, Australia. 404
Cheney, N. P., and G. A. V. Bary (1969), The propagation of mass conflagrations in a standing 405
eucalypt forest by the spotting process, In Mass Fire Symposium (pp. 10-12). Defense 406
Standards Laboratory. 407

Accepted manuscript July 2017 - Journal of Geophysical Research: Atmospheres
11
Clark, T. L., M. A. Jenkins, J. L. Coen, and D. R. Packham (1997), A coupled atmosphere-fire 408
model: Role of the convective Froude number and dynamic fingering at the fireline, Int. 409
J. Wildland Fire, 6(4), 177-190. 410
Clements, C. B. (2010), Thermodynamic structure of a grass fire plume, Int. J. Wildland Fire, 411
19(7), 895-902. 412
Cruz, M. G., A. L. Sullivan, J. S., Gould, N. C., Sims, A. J., Bannister, J. J., Hollis, R. J., and R. 413
J. Hurley (2012), Anatomy of a catastrophic wildfire: the Black Saturday Kilmore East 414
fire in Victoria, Australia, Forest Ecology and Management, 284, 269-285. 415
Cummins, K. L., and M. J. Murphy (2009), An overview of lightning locating systems: History, 416
techniques, and data uses, with an in-depth look at US NLDN, IEEE Trans. 417
Electromagn.Compat., 51, 499-518. 418
Cunningham, P., and M. J. Reeder (2009), Severe convective storms initiated by intense wild 419
fires: Numerical simulations of pyrocumulonimbi and pyro-tornadogenesis, Geophys. 420
Res. Lett., 36:L12812, DOI:10.1029/2009GL039262. 421
De Laat, A. T. J., D. C. Stein Zweers, and R. Boers (2012), A solar escalator: Observational 422
evidence of the self-lifting of smoke and aerosols by absorption of solar radiation in the 423
February 2009 Australian Black Saturday plume, J. Geophys. Res. Atmos., 117(D4). 424
Dowdy, A. J., and G. A. Mills (2012a), Characteristics of lightning-attributed wildland fires in 425
south-east Australia, Int. J. Wildland Fire, 21(5), 521-524. 426
Dowdy, A. J., and Mills, G. A. (2012b), Atmospheric and fuel moisture characteristics associated 427
with lightning-attributed fires, J. Appl. Meteorol. Climatol., 51, 2025-2037, 428
doi:10.1175/JAMC-D-11-0219.1. 429
Ellis, P. F. M. (2011), Fuelbed ignition potential and bark morphology explain the notoriety of 430
the eucalypt messmate 'stringybark' for intense spotting, Int. J. Wildland Fire, 20(7), 897-431
907. 432
Engel, C. B., T. P. Lane, M. J. Reeder, and M. Rezny (2013), The meteorology of Black 433
Saturday, Q. J. R. Meteorol. Soc., 139, 585-599. 434
Ferguson, E (2016), Reframing Rural Fire Management: Report of the Special Inquiry into the 435
January 2016 Waroona Fire. Public Service Commission, Government of Western 436
Australia (available from https://publicsector.wa.gov.au/document/reframing-rural-fire-437
management-report-special-inquiry-january-2016-waroona-fire). 438
Fernandes, W. A., I. R. Pinto, O. Pinto, K. M. Longo, and S. R. Freitas (2006), New findings 439
about the influence of smoke from fires on the cloud-to-ground lightning characteristics 440
in the Amazon region, Geophys. Res. Lett., 33(20). 441
Fiddes, S. L., A. B. Pezza, and J. Renwick (2015), Significant extra-tropical anomalies in the 442
lead up to the Black Saturday fires, Int. J. Climatol., 36(2), 1011-1018, DOI: 443
10.1002/joc.4387. 444
Field, R. D., M. Luo, M. Fromm, A. Voulgarakis, S. Mangeon, and J. Worden (2016), 445
Simulating the Black Saturday 2009 smoke plume with an interactive composition-446
climate model: Sensitivity to emissions amount, timing, and injection height, J. Geophys. 447
Res. Atmos., 121(8), 4296-4316. 448

Accepted manuscript July 2017 - Journal of Geophysical Research: Atmospheres
12
Fromm, M., A. Tupper, D. Rosenfeld, R. Servranckx, and R. McRae (2006), Violent pyro-449
convective storm devastates Australia's capital and pollutes the stratosphere, Geophys. 450
Res. Lett., 33, L05815, doi:10.1029/2005GL025161. 451
Fromm, M., D. T. Lindsey, R. Servranckx, G. Yue, T. Trickl, R. Sica, P. Doucet, and S. Godin-452
Beekmann, S. (2010), The untold story of pyrocumulonimbus, Bull. Americ. Meteorol. 453
Soc., 91(9). 454
Fromm, M. D., R. H. D. McRae, J. J. Sharples, and G. P. Kablick III (2012), Pyrocumulonimbus 455
pair in Wollemi and Blue Mountains National Parks, 22 November 2006, Australian 456
Meteorological and Oceanographic Journal, 62(3), 117-126. 457
Fuquay, D. M., R. G. Baughman, A. R. Taylor, and R. G. Hawe (1967), Characteristics of seven 458
lightning discharges that caused forest fires, J. Geophys. Res., 72(24), 6371-6373. 459
Giglio, L., T. Loboda, D. P. Roy, B. Quayle, and C. O. Justice (2009), An active-fire based 460
burned area mapping algorithm for the MODIS sensor, Remote Sensing of Environment, 461
113(2), 408-420. 462
Glatthor, N., M. Höpfner, K. Semeniuk, A. Lupu, P. I. Palmer, J. C. McConnell, J. W. Kaminski, 463
T. V. Clarmann, G. P. Stiller, B. Funke, and S. Kellmann (2013), The Australian 464
bushfires of February 2009: MIPAS observations and GEM-AQ model results, Atmos. 465
Chem. Phys., 13(3), 1637-1658. 466
Goens, D. W., and O. L. Andrews (1998), Weather and fire behavior factors related to the 1990 467
Dude Fire near Payson, AZ, NWCG Wildland Fire Leadership Development Program. 468
Haines, D. (1988), A lower atmosphere severity index for wildland fire, National Weather 469
Digest, 13, 23-27. 470
Jones, R. F. (1950), Radar echoes from smoke, Meteorological Magazine, London, 79, p.89. 471
Jones, D., W. Wang, and R. Fawcett (2009), High-quality spatial climate datasets for Australia, 472
Aust. Meteorol. Mag., 58, 233-248 473
Johnson, R. H., R. S. Schumacher, J. H. Ruppert Jr, D. T. Lindsey, J. E. Ruthford, & L. 474
Kriederman (2014), The Role of Convective Outflow in the Waldo Canyon Fire, Mon. 475
Weath. Rev., 142(9), 3061-3080.Koo, E., P. J. Pagni, D. R. Weise, and J. P. Woycheese 476
(2010), Firebrands and spotting ignition in large-scale fires, Int. J. Wildland Fire, 19(7), 477
818-843. 478
Kuleshov, Y., D. Mackerras and M. Darveniza (2006), Spatial distribution and frequency of 479
lightning activity and lightning flash density maps for Australia, J. Geophys. Res., 111, 480
D19105, doi:10.1029/2005JD006982. 481
Kurino, T. (2012), Future Plan and Recent Activities for the Japanese Follow-on Geostationary 482
Meteorological Satellite Himawari-8/9, AGU Fall Meeting Abstracts. Vol. 1. 483
Lang, T. J., and S. A. Rutledge (2006), Cloud-to-ground lightning downwind of the 2002 484
Hayman forest fire in Colorado, Geophys. Res. Lett., 33(3). 485
Lang, T. J., S. A. Rutledge, B. Dolan, P. Krehbiel, W. Rison, and D. T. Lindsey (2014), 486
Lightning in wildfire smoke plumes observed in Colorado during summer 2012, Mon. 487
Weath. Rev., 142(2), 489-507. 488
Accepted manuscript July 2017 - Journal of Geophysical Research: Atmospheres
13
Latham, D. (1991), Lightning flashes from a prescribed fire-induced cloud, J. Geophys. Res. 489
Atmos., 96(D9), 17151-17157. 490
Lindley, T., J. Vitale, W. Burgett, and M. Beierle (2011), Proximity Meteorological 491
Observations for Wind-driven Grassland Wildfire Starts on the Southern High Plains, 492
Electronic-J. Severe Storms Meteor., 6(1), 1-27. 493
Luderer, G., J. Trentmann, and M. O. Andreae (2009), A new look at the role of fire-released 494
moisture on the dynamics of atmospheric pyro-convection, Int. J. Wildland Fire, 18(5), 495
554-562. 496
Luke, R. H., and A. G. McArthur (1978), Bushfires in Australia, AGPS Canberra, 359 pp. 497
McCaw, L., G. Mills, A. Sullivan, R. Hurley, P. Ellis, S. Matthews, M. Plucinski, B. Pippen, and 498
J. Boura (2009), Fire behavior investigation, Victorian 2009 Bushfire Research Response 499
Final Report. 500
McRae, R. H., J. J. Sharples, S. R. Wilkes, and A. Walker (2013), An Australian pyro-501
tornadogenesis event, Natural Hazards, 65(3), 1801-1811. 502
McRae, R. H. D, J. J. Sharples, and M. D. Fromm (2015), Linking local wildfire dynamics to 503
pyroCb development, Nat. Hazards Earth Syst. Sci., 15, 417-428, doi:10.5194/nhess-15-504
417-2015. 505
Mills, G. A. (2005a), A re-examination of the synoptic and mesoscale meteorology of 506
AshWednesday 1983, Aust. Meteorol. Mag., 54, 35-55. 507
Mills, G.A. (2005b), On the sub-synoptic scale meteorology of two extreme fire weather days 508
during the Eastern Australian fires of January 2003, Aust. Meteorol. Mag., 54, 265-290. 509
Mills, G.A. (2008), Abrupt surface drying and fire weather Part 2: a preliminary synoptic 510
climatology in the forested areas of southern Australia, Aust. Meteorol. Mag., 57(4). 511
Mills, G. A., and L. McCaw (2010), Atmospheric Stability Environments and Fire Weather in 512
Australia - extending the Haines Index. CAWCR Technical report No. 20. Centre for 513
Australian Weather and Climate Research. 514
Murphy, B. P., R. A. Bradstock, M. M. Boer, J. Carter, G. J. Cary, M. A. Cochrane, R. J. 515
Fensham, J. Russell-Smith, G. J. Williamson, and D. M. Bowman (2013), Fire regimes of 516
Australia: a pyrogeographic model system, J. Biogeography, 40(6), 1048-1058. 517
Peterson, D. A., E. J. Hyer, J. R. Campbell, M. D. Fromm, J. W. Hair, C. F. Butler, and M. A. 518
Fenn (2015), The 2013 Rim Fire: Implications for predicting extreme fire spread, 519
pyroconvection, and smoke emissions, Bull. Amer. Meteorol. Soc., 96(2), 229-247. 520
Peterson, D. A., E. J. Hyer, J. R. Campbell, J. E. Solbrig, and M. D. Fromm (2016), A 521
Conceptual Model for Development of Intense Pyrocumulonimbus in Western North 522
America, Mon. Weath. Rev., doi:10.1175/MWR-D-16-0232.1. 523
Potter, B.E. (2012a), Atmospheric interactions with wildland fire behaviour-I. Basic surface 524
interactions, vertical profiles and synoptic structures, Int. J. Wildland Fire, 21(7), 779-525
801. 526
Potter, B. E. (2012b), Atmospheric interactions with wildland fire behaviour-II. Plume and 527
vortex dynamics, Int. J. Wildland Fire, 21(7), 802-817. 528

Accepted manuscript July 2017 - Journal of Geophysical Research: Atmospheres
14
Pumphrey, H. C., M. L. Santee, N. J. Livesey, M. J. Schwartz, and W. G. Read (2011), 529
Microwave Limb Sounder observations of biomass-burning products from the Australian 530
bush fires of February 2009, Atmos. Chem. Phys., 11(13), 6285-6296. 531
Reeder, M. J., and R. K. Smith (1987), A study of frontal dynamics with application to the 532
Australian summertime cool change, J. Atmos. Sci., 44, 687-705. 533
Reeder, M. J., T. Spengler, and R. Musgrave (2015), Rossby waves, extreme fronts, and 534
wildfires in southeastern Australia. Geophys. Res. Lett., 42(6), 535
doi:10.1002/2015GL063125. 536
Rorig, M. L., and S. A. Ferguson (1999), Characteristics of lightning and wildland fire ignition in 537
the Pacific Northwest, J. App. Meteorol., 38(11), 1565-1575. 538
Rosenfeld, D., M. Fromm, J. Trentmann, G. Luderer, M. O. Andreae, and R. Servranckx (2007), 539
The Chisholm firestorm: observed microstructure, precipitation and lightning activity of a 540
pyro-cumulonimbus, Atmos. Chem. Phys., 7(3), 645-659. 541
Rothermel, R. C. (1991), Predicting behavior and size of crown fires in the Northern Rocky 542
Mountains, Res. Pap. INT-438. Ogden, UT: U.S. Department of Agriculture, Forest 543
Service. 544
Russell-Smith, J., C. P. Yates, P. J. Whitehead, R. Smith, R. Craig, G. E. Allan, R. Thackway, I. 545
Frakes, S. Cridland, M. C. Meyer, and A. M. Gill (2007), Bushfires down under: patterns 546
and implications of contemporary Australian landscape burning, Int. J. Wildland Fire, 547
16(4), 361-377. 548
Siddaway, J. M., S. V. Petelina, A. Feofilov, A. Y. Zasetsky, A. R. Klekociuk, and J. Urban 549
(2010). UTLS hydration by the smoke plume from 2009 Australian Black Saturday 550
bushfire, In AGU Fall Meeting Abstracts (Vol. 1, p. 0059). 551
Sullivan, A. L., W. L. McCaw, M. G. Cruz, S. Matthews, and P. F. Ellis (2012), Fuel, fire 552
weather and fire behaviour in Australian ecosystems, Flammable Australia: fire regimes, 553
biodiversity and ecosystems in a changing world, CSIRO Publishing, Australia, 51-77. 554
Sullivan, A. L., and S. Matthews (2013), Determining landscape fine fuel moisture content of the 555
Kilmore East 'Black Saturday'wildfire using spatially-extended point-based models, 556
Environmental Modelling and Software, 40, 98-108. 557
Tosca, M. G., D. J. Diner, M. J. Garay, and O. V. Kalashnikova (2015), Human-caused fires 558
limit convection in tropical Africa: First temporal observations and attribution, Geophys. 559
Res. Lett., 42(15), 6492-6501. 560
Victorian Bushfire Royal Commission (VBRC) (2009), Final Report, Volume 1, The Fires and 561
the Fire-Related Deaths, ISBN 978-0-646-51830-5. 562

Accepted manuscript July 2017 - Journal of Geophysical Research: Atmospheres
15
563
Figure 1. Synoptic features on Black Saturday, as represented by the Mean Sea Level Pressure 564
(MSLP) analysis produced operationally by the Bureau of Meteorology. This is shown for 2300 565
LT on 7 February 2009. 566

Accepted manuscript July 2017 - Journal of Geophysical Research: Atmospheres
16
567
Figure 2. Map of southeast Australia showing cities (Melbourne and Canberra: 'x' symbols), 568
radar locations, coastlines, latitude and longitude. The inset boxes represent two regions of focus 569
for this study, for Black Saturday (orange box) and the Canberra fire event (green box), 570
respectively. The locations of radars referred to in this study are also shown. 571

Accepted manuscript July 2017 - Journal of Geophysical Research: Atmospheres
17
572
Figure 3. Fire, lightning and precipitation observations on Black Saturday. Active fire 573
observations are shown, with six notable fire events listed (a). Lightning stroke counts (strokes 574
per 0.05° x 0.05° grid-cell) are shown based on observations obtained from a ground-based 575
network of sensors (b). Precipitation data are based on a gridded analysis of observations over 576
land (c). The fire and lightning data represent all observations within the time period from 1500 577
LT on 7 February 2009 to 0300 LT on 8 February 2009, while the precipitation data are based on 578
daily observations for the 24-hour time period from 0900 LT on 7 February 2009 to 0900 LT on 579
8 February 2009. Coastlines, latitude and longitude are shown. 580
Accepted manuscript July 2017 - Journal of Geophysical Research: Atmospheres
18
581
Figure 4. Echo-top heights obtained from radar observations. Hourly values are shown from 582
1800 LT on Black Saturday to 0200 LT the following day, representing the highest echo-top 583
recorded during the 1-hour period starting from the time shown. Coastlines, latitude and 584
longitude are shown. 585

Accepted manuscript July 2017 - Journal of Geophysical Research: Atmospheres
19
586
Figure 5. Temporal evolution of the lightning and fire activity. Lightning activity (blue '+' 587
symbols) and active fire observations from satellite overpasses (red regions) are shown during 588
the hours of 1500 LT and 2300 LT on 7 February 2009 as well as 0200 LT on 8 February 2009. 589
Data are presented in hourly intervals from 1500 LT on 7 February 2009 to 0200 LT on 8 590
February 2009 in panels a) to l), respectively, representing all observations within one-hour 591
periods starting from the specified times. The hour is listed at the top of each panel, followed in 592
brackets by the total number of lightning strokes recorded during that hour in the region shown. 593
Coastlines, latitude and longitude are shown, as well as the location of a fire examined in relation 594
to pyrogenic lightning ignition (purple circle) with the active fire observations for that case 595
shown in panel l). 596

Accepted manuscript July 2017 - Journal of Geophysical Research: Atmospheres
20
597
Figure 6. Synoptic features for the Canberra fire event, as represented by the Mean Sea Level 598
Pressure (MSLP) analysis produced operationally by the Bureau of Meteorology. This is shown 599
for 1100 LT on 18 January 2003. 600
601

Accepted manuscript July 2017 - Journal of Geophysical Research: Atmospheres
21
602
Figure 7. Observations for the Canberra fire event, 18 January 2003 in the Australian Capital 603
Territory: active fire observations (a), lightning (‘*’ symbols) and precipitation data (b), as well 604
as echo-top heights from the Captains Flat radar (c). The fire and lightning data represent all 605
observations within the period from 1500 LT on 18 January 2003 to 0300 LT on 19 January 606
2003. Precipitation data are based on daily observations over land for the 24-hour time period 607
from 0900 LT on 18 January 2003 to 0900 LT on 19 January 2003. Echo-top heights are for the 608
period from 1800 LT on 18 January 2003 to 0200 LT on 19 January 2003. Coastlines, latitude 609
and longitude are shown. 610
Accepted manuscript July 2017 - Journal of Geophysical Research: Atmospheres
22
611
Figure 8. Radiosonde observations showing vertical profiles of temperature and dewpoint (a) as 612
well as dewpoint depression (b). This is shown for the Canberra fire event (blue) based on 613
observations from Wagga Wagga at 0000 UT on 18 January 2003, as well as for Black Saturday 614
(red) based on observations from Melbourne Airport at 2300 UT on 6 February 2009. 615