pyramid servings intakes in the united states … servings intakes in the united states 1999-2002, 1...
TRANSCRIPT

PYRAMID SERVINGS INTAKES in the United States 1999-2002,
1 Day
CNRG Table Set. 3.0released online from
http://www.ba.ars.usda.gov/cnrg
byAnnetta J. Cook and James E. Friday
Community Nutrition Research Group Beltsville Human Nutrition Research Center Agricultural Research Service U.S. Department of Agriculture 10300 Baltimore Ave., Bldg 005 Room 117, BARC-West Beltsville, MD 20705-2350
March 2005
i
Acknowledgments
Several people deserve special thanks for their roles in the production of these tables:
John P. Cherry, Acting Director, Beltsville Human Nutrition Research Center (BHNRC), Agriculture Research Service (ARS), USDA
Ellen Harris, Assistant Director for Nutrition Monitoring, BHNRC and Research Leader, Community Nutrition Research Group(CNRG), ARS, USDA
Alvin Nowverl, Mathematical Statistician, CNRGCecilia Wilkinson Enns, Nutritionist, Food Surveys Research Group (FSRG), BHNRC, ARS, USDA
Peer reviewers:
Linda Cleveland, FSRG, BHNRC, ARS, USDAJoseph Goldman, FSRG, BHNRC, ARS, USDAPatricia Guenther, Center for Nutrition Policy and Promotion, USDASusan M. Krebs-Smith, National Cancer Institute, National Institutes of Health, USDHHS

1
PYRAMID SERVINGS INTAKES, 1999-2002, 1 Day
Introduction
This report provides national probability estimates of Pyramidserving intakes computed using food intake data from the NationalHealth and Nutrition Examination Surveys (NHANES) conductedbetween 1999 and 2002 (CDC/NCHS 2004) and servings data fromthe Pyramid Servings Database for USDA Survey Food CodesVersion 2.0 (PyrServDB_v2) (Cook and Friday 2004). Theseestimates are based on 1 day of food intake data collected from17,107 individuals 2 years of age and over using a 24-hour recallmethod. The design, methodology, and operation of the NHANES1999-2002 are available at http://www.cdc.gov/nchs/nhanes.htm. The servings data in PyrServDB_v2 were determined using a newmethod for computing lean meat, discretionary fat, and added sugars(Cook and Friday 2004).
These tables include: C summary tables reporting mean numbers of Pyramid
Servings and percentages of individuals consuming specifiednumbers of servings 1 for all individuals 2 years old andover, by selected sex and age groups;
C comparison of intakes to USDA Food Guide Pyramid
recommendations (USDA 1992, USDA/CNPP 1999, Daviset. al., USDA and HHS 2000);
1 Values for the percent of the population meeting Pyramid Serving
recommendations are estimates of the distribution based on 1 day ofreported food intakes and should not be interpreted to represent ususalintakes for the population.
The Pyramid provides guidance for individuals 2 years of age and over. This guidance indicates everyone should eat at least the lowestnumber of servings within the recommended range, amounts appropriatefor a 1600 calorie diet, and increase intakes of all food groupsproportionately with energy intakes.
For the dairy group, individuals ages 9 through 18 years and ages 51 years and over, should have three servings; all others should have twodairy servings a day. Pregnant and lactating women should have the same number of dairy servings as for nonpregnant women.
The number of servings for an individual depends on their energy needwhich is based on age, sex, body size, and activity. Generally speaking,the smallest end of the recommended range of servings is about right foryoung children (2 through 6 years old) and many sedentary women andolder adults; the middle is about right for most other children, teenagegirls, active women, and many sedentary men, and the top of the range is about right for teenage boys, many active men, and some very activewomen. Very young children (2-3 years old) should have smaller serving sizes (2/3 of the standard size).
2
C flexibility to report contributions of dry beans and peas toeither the meat and meat alternate group or the vegetablegroup (see Appendix A).
The Food Guide Pyramid (see the box) is a general guide designed tohelp Americans choose healthful diets as described in the DietaryGuidelines for Americans (USDA and HHS 2000, USDA 1992). The Pyramid provides information on food choices andrecommended amounts to consume from five major groups (grain,vegetable, fruit, dairy, and meat), including some subgroups, as wellas fats and added sugars.
Sample sizes on which estimates were based are provided inAppendix B. In general, the sample sizes for each sex-age groupprovided a sufficient level of precision to ensure statistical reliabilityof the estimates. A statistic that is potentially unreliable because of asmall sample size or large coefficient of variation is flagged: seeAppendix C, for the criteria used in flagging estimates.
Background information on the method used to develop PyramidServings and lists of foods assigned to each food group are providedin Appendix D. For more information on the translation of foodamounts into numbers of servings see Cook and Friday 2004.
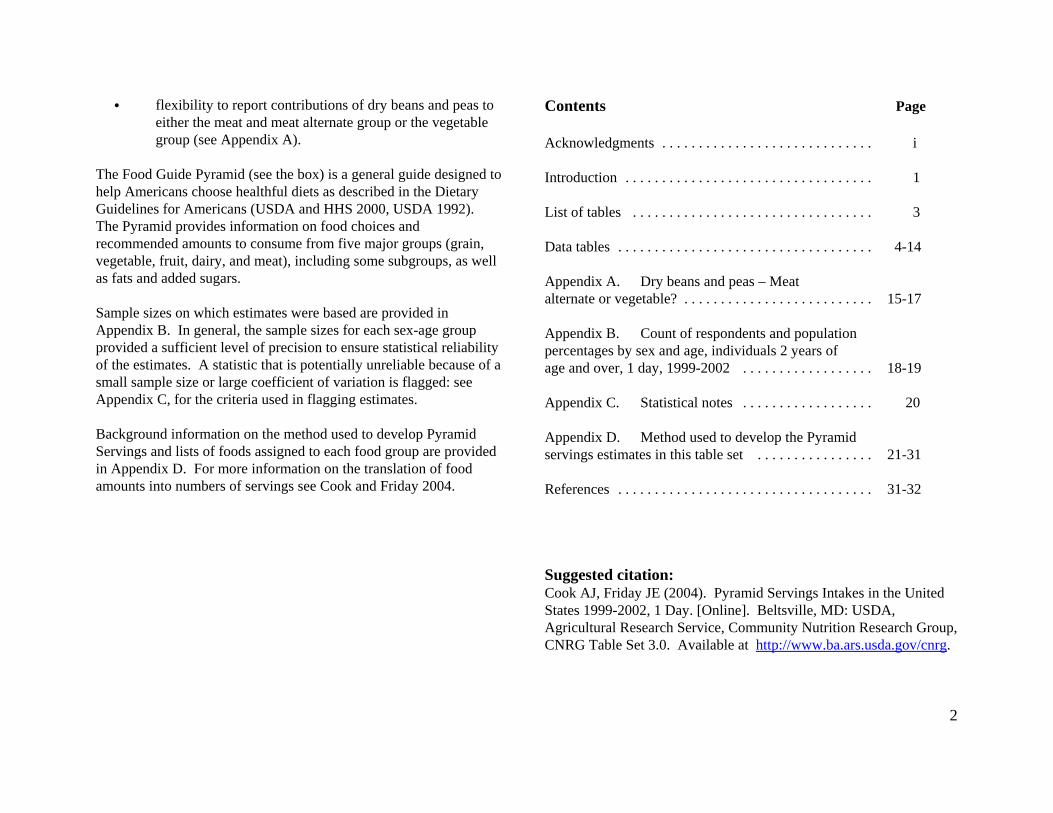
Contents Page
Acknowledgments . . . . . . . . . . . . . . . . . . . . . . . . . . . . . i
Introduction . . . . . . . . . . . . . . . . . . . . . . . . . . . . . . . . . . 1
List of tables . . . . . . . . . . . . . . . . . . . . . . . . . . . . . . . . . 3
Data tables . . . . . . . . . . . . . . . . . . . . . . . . . . . . . . . . . . . 4-14
Appendix A. Dry beans and peas – Meat alternate or vegetable? . . . . . . . . . . . . . . . . . . . . . . . . . . 15-17
Appendix B. Count of respondents and populationpercentages by sex and age, individuals 2 years of age and over, 1 day, 1999-2002 . . . . . . . . . . . . . . . . . . 18-19
Appendix C. Statistical notes . . . . . . . . . . . . . . . . . . 20
Appendix D. Method used to develop the Pyramid servings estimates in this table set . . . . . . . . . . . . . . . . 21-31
References . . . . . . . . . . . . . . . . . . . . . . . . . . . . . . . . . . . 31-32
Suggested citation: Cook AJ, Friday JE (2004). Pyramid Servings Intakes in the UnitedStates 1999-2002, 1 Day. [Online]. Beltsville, MD: USDA,Agricultural Research Service, Community Nutrition Research Group,CNRG Table Set 3.0. Available at http://www.ba.ars.usda.gov/cnrg.
3
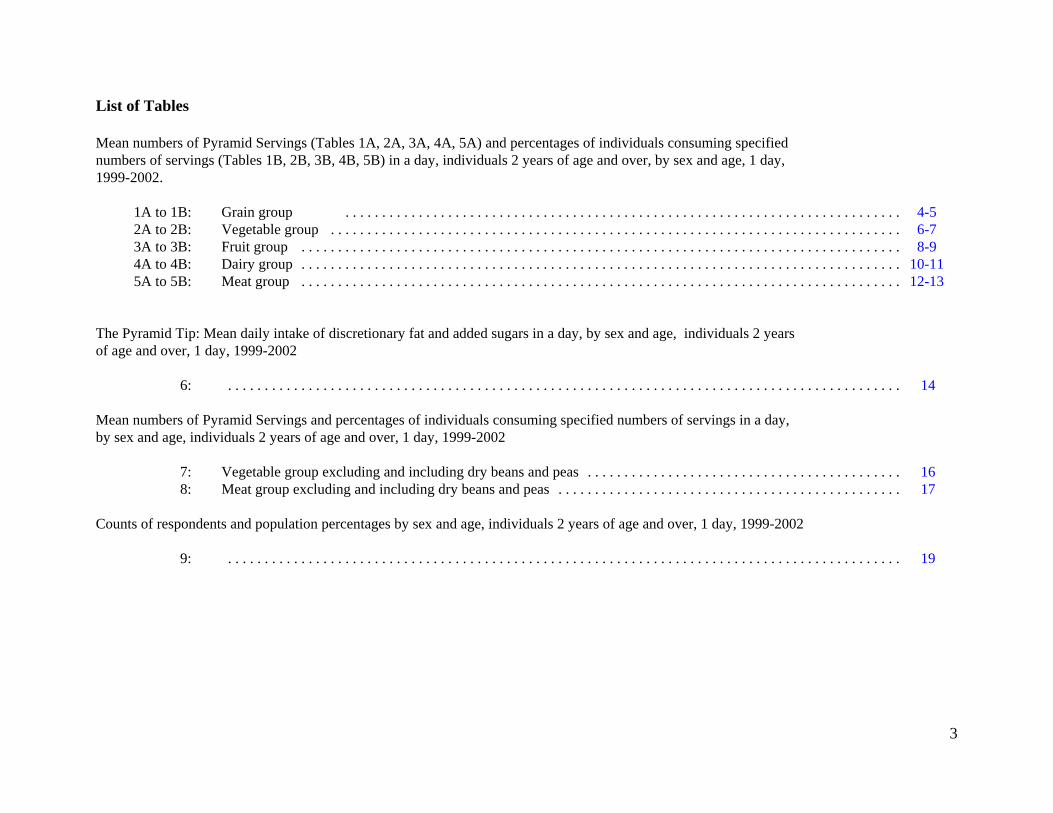
List of Tables
Mean numbers of Pyramid Servings (Tables 1A, 2A, 3A, 4A, 5A) and percentages of individuals consuming specified numbers of servings (Tables 1B, 2B, 3B, 4B, 5B) in a day, individuals 2 years of age and over, by sex and age, 1 day, 1999-2002.
1A to 1B: Grain group . . . . . . . . . . . . . . . . . . . . . . . . . . . . . . . . . . . . . . . . . . . . . . . . . . . . . . . . . . . . . . . . . . . . . . . . . . . . 4-52A to 2B: Vegetable group . . . . . . . . . . . . . . . . . . . . . . . . . . . . . . . . . . . . . . . . . . . . . . . . . . . . . . . . . . . . . . . . . . . . . . . . . . . . . . 6-73A to 3B: Fruit group . . . . . . . . . . . . . . . . . . . . . . . . . . . . . . . . . . . . . . . . . . . . . . . . . . . . . . . . . . . . . . . . . . . . . . . . . . . . . . . . . . 8-94A to 4B: Dairy group . . . . . . . . . . . . . . . . . . . . . . . . . . . . . . . . . . . . . . . . . . . . . . . . . . . . . . . . . . . . . . . . . . . . . . . . . . . . . . . . . . 10-115A to 5B: Meat group . . . . . . . . . . . . . . . . . . . . . . . . . . . . . . . . . . . . . . . . . . . . . . . . . . . . . . . . . . . . . . . . . . . . . . . . . . . . . . . . . . 12-13
The Pyramid Tip: Mean daily intake of discretionary fat and added sugars in a day, by sex and age, individuals 2 years of age and over, 1 day, 1999-2002
6: . . . . . . . . . . . . . . . . . . . . . . . . . . . . . . . . . . . . . . . . . . . . . . . . . . . . . . . . . . . . . . . . . . . . . . . . . . . . . . . . . . . . . . . . . . . . 14
Mean numbers of Pyramid Servings and percentages of individuals consuming specified numbers of servings in a day, by sex and age, individuals 2 years of age and over, 1 day, 1999-2002
7: Vegetable group excluding and including dry beans and peas . . . . . . . . . . . . . . . . . . . . . . . . . . . . . . . . . . . . . . . . . . . 16 8: Meat group excluding and including dry beans and peas . . . . . . . . . . . . . . . . . . . . . . . . . . . . . . . . . . . . . . . . . . . . . . . 17
Counts of respondents and population percentages by sex and age, individuals 2 years of age and over, 1 day, 1999-2002
9: . . . . . . . . . . . . . . . . . . . . . . . . . . . . . . . . . . . . . . . . . . . . . . . . . . . . . . . . . . . . . . . . . . . . . . . . . . . . . . . . . . . . . . . . . . . . 19

Table 1A.--Grain group: Mean numbers of Pyramid Servings consumed in a day, by sex and age, individuals 2 years of age and over, 1 day, 1999-2002
USDA's Food Guide Pyramid recommends eating between 6 and 11 servings of grain products each day, depending on calorie needs
Percentage Nonwhole-grain Whole-grain Total ofSex and age products products grain products population(years)
------------------------------------------- Servings ‡ --------------------------------------------Percent
Males:6.20.87.02.7x 2-5.........................................6.8 .87.64.6x 6-11.......................................7.71.08.76.0x 12-19.....................................7.6 .88.36.8x 20-29.....................................7.5 .88.37.5x 30-39.....................................7.0 .97.97.9x 40-49.....................................6.1 .97.05.8x 50-59.....................................5.71.06.73.6x 60-69.....................................5.11.16.23.5x 70 and over...........................6.7 .97.635.2x 20 and over........................
Females:5.5 .66.12.8x 2-5.........................................5.7 .76.44.4x 6-11.......................................5.8 .76.55.9x 12-19.....................................5.9 .76.66.9x 20-29.....................................5.4 .76.17.9x 30-39.....................................4.9 .85.78.2x 40-49.....................................4.7 .95.66.0x 50-59.....................................4.5 .95.44.2x 60-69.....................................4.1 .84.95.2x 70 and over...........................5.0 .85.838.4x 20 and over........................
6.0 .86.8100.0xAll Individuals 2 and over..........
‡ In the Food Guide Pyramid (USDA 1992), one serving is 1 slice of bread; 1 small roll; 1/2 bagel, English muffin, or croissant; 1 ounce of ready-to-eat cereal; 1/2 cup cooked cereal, rice, or pasta; 1 small muffin; or amounts of other grain products such as pretzels and cakes that contain an amount of grain equivalent to that in a standard slice of bread. For children 2-3 years old, 1 serving is two-thirds of the standard serving size to allow for their lower energy needs (USDA 1999). Whole- and nonwhole-grain servings were calculated based on the proportion of whole- and nonwhole-grain ingredients in foods as consumed.
SOURCES: What We Eat in America, National Health and Nutrition Examination Survey (NHANES) 2001-2002, and NHANES 1999-2000 (CDC/NCHS 2004). Pyramid Servings Database for USDA Survey Food Codes Version 2.0 (Cook and Friday 2004).
4
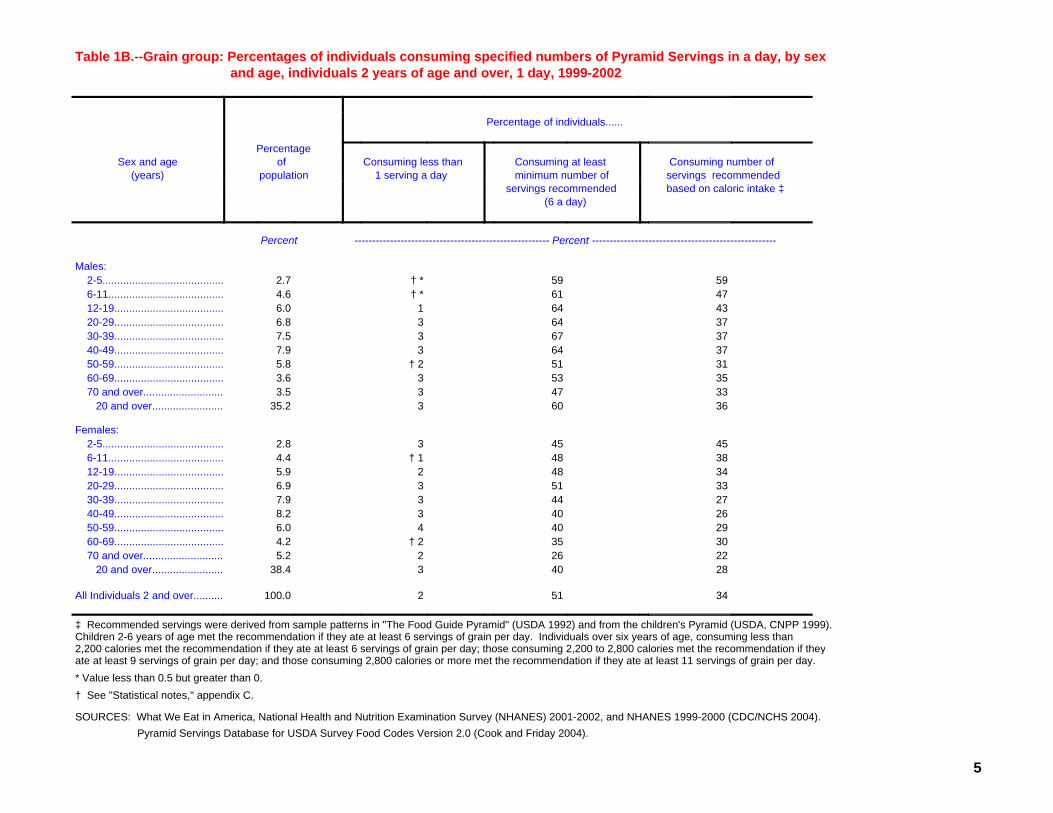
Table 1B.--Grain group: Percentages of individuals consuming specified numbers of Pyramid Servings in a day, by sex and age, individuals 2 years of age and over, 1 day, 1999-2002
Percentage of individuals......
Percentage Consuming number of Consuming at least Consuming less than ofSex and age servings recommended minimum number of 1 serving a day population(years) based on caloric intake ‡ servings recommended
(6 a day)
------------------------------------------------------- Percent ----------------------------------------------------Percent
Males:5959† *2.7x 2-5.........................................4761† *4.6x 6-11.......................................436416.0x 12-19.....................................376436.8x 20-29.....................................376737.5x 30-39.....................................376437.9x 40-49.....................................3151† 25.8x 50-59.....................................355333.6x 60-69.....................................334733.5x 70 and over...........................3660335.2x 20 and over........................
Females:454532.8x 2-5.........................................3848† 14.4x 6-11.......................................344825.9x 12-19.....................................335136.9x 20-29.....................................274437.9x 30-39.....................................264038.2x 40-49.....................................294046.0x 50-59.....................................3035† 24.2x 60-69.....................................222625.2x 70 and over...........................2840338.4x 20 and over........................
34512100.0xAll Individuals 2 and over..........
‡ Recommended servings were derived from sample patterns in "The Food Guide Pyramid" (USDA 1992) and from the children's Pyramid (USDA, CNPP 1999). Children 2-6 years of age met the recommendation if they ate at least 6 servings of grain per day. Individuals over six years of age, consuming less than2,200 calories met the recommendation if they ate at least 6 servings of grain per day; those consuming 2,200 to 2,800 calories met the recommendation if theyate at least 9 servings of grain per day; and those consuming 2,800 calories or more met the recommendation if they ate at least 11 servings of grain per day. * Value less than 0.5 but greater than 0.† See "Statistical notes," appendix C.
SOURCES: What We Eat in America, National Health and Nutrition Examination Survey (NHANES) 2001-2002, and NHANES 1999-2000 (CDC/NCHS 2004). Pyramid Servings Database for USDA Survey Food Codes Version 2.0 (Cook and Friday 2004).
5
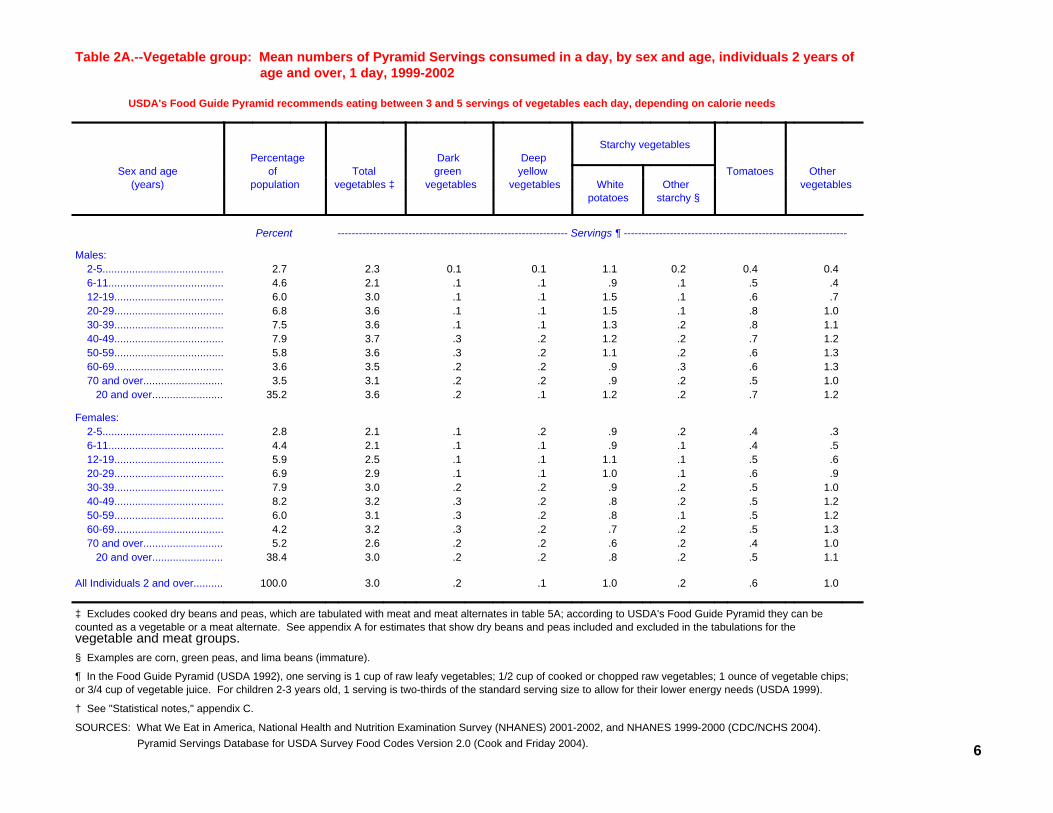
Table 2A.--Vegetable group: Mean numbers of Pyramid Servings consumed in a day, by sex and age, individuals 2 years of age and over, 1 day, 1999-2002
USDA's Food Guide Pyramid recommends eating between 3 and 5 servings of vegetables each day, depending on calorie needs
Starchy vegetables Deep Dark Percentage
Other Tomatoes yellow green Total ofSex and age vegetables Other White vegetables vegetables vegetables ‡ population(years)
starchy § potatoes
----------------------------------------------------------------- Servings ¶ ---------------------------------------------------------------Percent
Males:0.40.40.21.10.10.12.32.7x 2-5......................................... .4 .5 .1 .9 .1 .12.14.6x 6-11....................................... .7 .6 .11.5 .1 .13.06.0x 12-19.....................................1.0 .8 .11.5 .1 .13.66.8x 20-29.....................................1.1 .8 .21.3 .1 .13.67.5x 30-39.....................................1.2 .7 .21.2 .2 .33.77.9x 40-49.....................................1.3 .6 .21.1 .2 .33.65.8x 50-59.....................................1.3 .6 .3 .9 .2 .23.53.6x 60-69.....................................1.0 .5 .2 .9 .2 .23.13.5x 70 and over...........................1.2 .7 .21.2 .1 .23.635.2x 20 and over........................
Females: .3 .4 .2 .9 .2 .12.12.8x 2-5......................................... .5 .4 .1 .9 .1 .12.14.4x 6-11....................................... .6 .5 .11.1 .1 .12.55.9x 12-19..................................... .9 .6 .11.0 .1 .12.96.9x 20-29.....................................1.0 .5 .2 .9 .2 .23.07.9x 30-39.....................................1.2 .5 .2 .8 .2 .33.28.2x 40-49.....................................1.2 .5 .1 .8 .2 .33.16.0x 50-59.....................................1.3 .5 .2 .7 .2 .33.24.2x 60-69.....................................1.0 .4 .2 .6 .2 .22.65.2x 70 and over...........................1.1 .5 .2 .8 .2 .23.038.4x 20 and over........................
1.0 .6 .21.0 .1 .23.0100.0xAll Individuals 2 and over..........
‡ Excludes cooked dry beans and peas, which are tabulated with meat and meat alternates in table 5A; according to USDA's Food Guide Pyramid they can becounted as a vegetable or a meat alternate. See appendix A for estimates that show dry beans and peas included and excluded in the tabulations for the vegetable and meat groups.§ Examples are corn, green peas, and lima beans (immature).
¶ In the Food Guide Pyramid (USDA 1992), one serving is 1 cup of raw leafy vegetables; 1/2 cup of cooked or chopped raw vegetables; 1 ounce of vegetable chips; or 3/4 cup of vegetable juice. For children 2-3 years old, 1 serving is two-thirds of the standard serving size to allow for their lower energy needs (USDA 1999).
† See "Statistical notes," appendix C.
SOURCES: What We Eat in America, National Health and Nutrition Examination Survey (NHANES) 2001-2002, and NHANES 1999-2000 (CDC/NCHS 2004). Pyramid Servings Database for USDA Survey Food Codes Version 2.0 (Cook and Friday 2004). 6
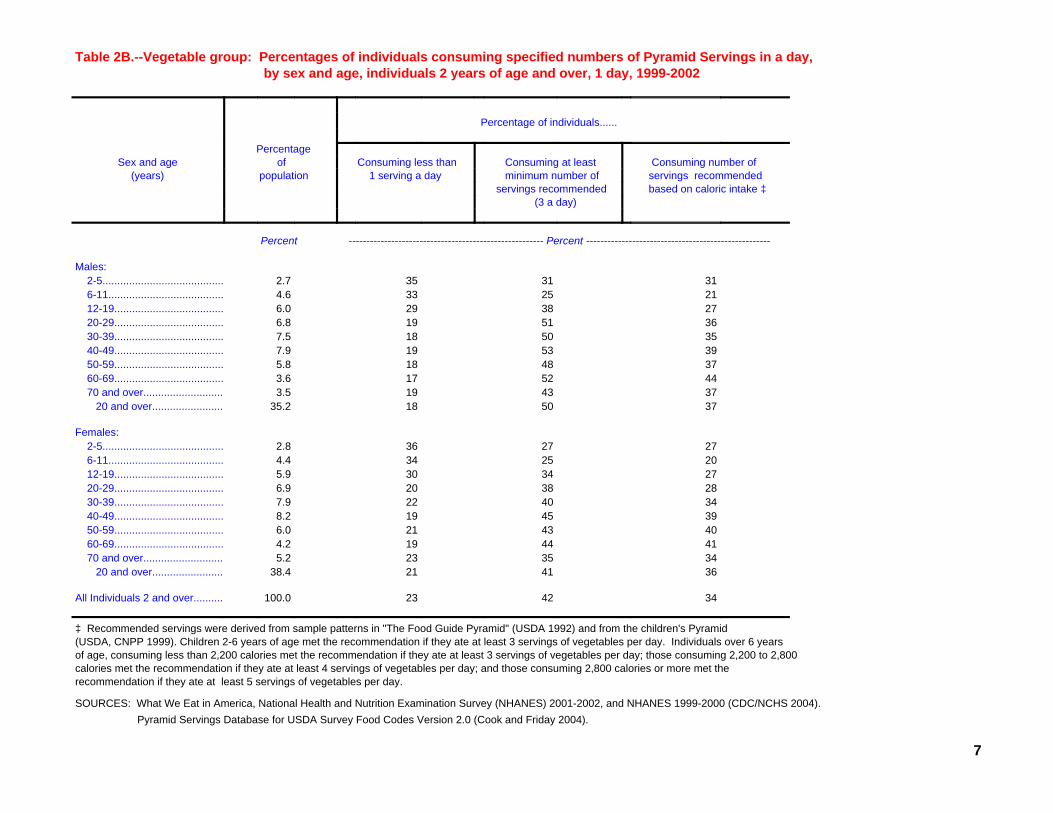
Table 2B.--Vegetable group: Percentages of individuals consuming specified numbers of Pyramid Servings in a day, by sex and age, individuals 2 years of age and over, 1 day, 1999-2002
Percentage of individuals......
Percentage Consuming number of Consuming at least Consuming less than ofSex and age servings recommended minimum number of 1 serving a day population(years) based on caloric intake ‡ servings recommended
(3 a day)
------------------------------------------------------- Percent ----------------------------------------------------Percent
Males:3131352.7x 2-5.........................................2125334.6x 6-11.......................................2738296.0x 12-19.....................................3651196.8x 20-29.....................................3550187.5x 30-39.....................................3953197.9x 40-49.....................................3748185.8x 50-59.....................................4452173.6x 60-69.....................................3743193.5x 70 and over...........................37501835.2x 20 and over........................
Females:2727362.8x 2-5.........................................2025344.4x 6-11.......................................2734305.9x 12-19.....................................2838206.9x 20-29.....................................3440227.9x 30-39.....................................3945198.2x 40-49.....................................4043216.0x 50-59.....................................4144194.2x 60-69.....................................3435235.2x 70 and over...........................36412138.4x 20 and over........................
344223100.0xAll Individuals 2 and over..........
‡ Recommended servings were derived from sample patterns in "The Food Guide Pyramid" (USDA 1992) and from the children's Pyramid (USDA, CNPP 1999). Children 2-6 years of age met the recommendation if they ate at least 3 servings of vegetables per day. Individuals over 6 years of age, consuming less than 2,200 calories met the recommendation if they ate at least 3 servings of vegetables per day; those consuming 2,200 to 2,800 calories met the recommendation if they ate at least 4 servings of vegetables per day; and those consuming 2,800 calories or more met the recommendation if they ate at least 5 servings of vegetables per day.
SOURCES: What We Eat in America, National Health and Nutrition Examination Survey (NHANES) 2001-2002, and NHANES 1999-2000 (CDC/NCHS 2004). Pyramid Servings Database for USDA Survey Food Codes Version 2.0 (Cook and Friday 2004).
7

Table 3A.--Fruit group: Mean numbers of Pyramid Servings consumed in a day, by sex and age, individuals 2 years of age and over, 1 day, 1999-2002
USDA's Food Guide Pyramid recommends eating between 2 and 4 servings of fruits each day, depending on calorie needs
Percentage Other Citrus fruits, Total ofSex and age fruits melons, berries fruits population(years)
------------------------------------ Servings ‡ ------------------------------------Percent
Males:1.60.92.62.7x 2-5......................................... .8 .61.44.6x 6-11....................................... .6 .71.36.0x 12-19..................................... .6 .81.46.8x 20-29..................................... .7 .81.57.5x 30-39..................................... .8 .71.57.9x 40-49.....................................1.0 .91.95.8x 50-59..................................... .9 .91.93.6x 60-69.....................................1.1 .92.03.5x 70 and over........................... .8 .81.635.2x 20 and over........................
Females:1.4 .82.22.8x 2-5......................................... .8 .61.44.4x 6-11....................................... .7 .71.45.9x 12-19..................................... .6 .61.36.9x 20-29..................................... .7 .61.37.9x 30-39..................................... .7 .71.48.2x 40-49..................................... .9 .71.66.0x 50-59.....................................1.01.01.94.2x 60-69.....................................1.0 .92.05.2x 70 and over........................... .8 .71.538.4x 20 and over........................
.8 .81.6100.0xAll Individuals 2 and over..........
‡ In the Food Guide Pyramid (USDA 1992), one serving is a whole fruit such as a medium apple, banana, or orange; a grapefruit half; 1/2 cup of berries, melon, or chopped raw fruit; 1/2 cup of cooked or canned fruit; 1/4 cup of dried fruit; or 3/4 cup of fruit juice. For children 2-3 years old, 1 serving is two-thirds of the standard serving size to allow for their lower energy needs (USDA 1999).
SOURCES: What We Eat in America, National Health and Nutrition Examination Survey (NHANES) 2001-2002, and NHANES 1999-2000 (CDC/NCHS 2004). Pyramid Servings Database for USDA Survey Food Codes Version 2.0 (Cook and Friday 2004).
8

Table 3B.--Fruit group: Percentages of individuals consuming specified numbers of Pyramid Servings in a day, by sex and age, individuals 2 years of age and over, 1 day, 1999-2002
Percentage of individuals......
Percentage Consuming number of Consuming at least ofSex and age servings recommended minimum number of Consuming less than population(years) based on caloric intake ‡ servings recommended 1 serving a day
(2 a day)
-------------------------------------------------------- Percent -----------------------------------------------------Percent
Males:4848332.7x 2-5.........................................2126544.6x 6-11.......................................1523626.0x 12-19.....................................1422636.8x 20-29.....................................1626587.5x 30-39.....................................1930517.9x 40-49.....................................2433485.8x 50-59.....................................2535443.6x 60-69.....................................3641373.5x 70 and over...........................20305235.2x 20 and over........................
Females:4242362.8x 2-5.........................................2326524.4x 6-11.......................................2127575.9x 12-19.....................................1723596.9x 20-29.....................................2025567.9x 30-39.....................................2328548.2x 40-49.....................................2832496.0x 50-59.....................................3638364.2x 60-69.....................................3941365.2x 70 and over...........................26305038.4x 20 and over........................
243051100.0xAll Individuals 2 and over..........
‡ Recommended servings were derived from sample patterns in "The Food Guide Pyramid" (USDA 1992) and from the children's Pyramid (USDA, CNPP 1999). Children 2-6 years of age met the recommendation if they ate at least 2 servings of fruit per day. Individuals over 6 years of age, consuming less than2,200 calories met the recommendation if they ate at least 2 servings of fruit per day; those consuming 2,200 to 2,800 calories met the recommendation if theyate at least 3 servings of fruit per day; and those consuming 2,800 calories or more met the recommendation if they ate at least 4 servings of fruit per day.
SOURCES: What We Eat in America, National Health and Nutrition Examination Survey (NHANES) 2001-2002, and NHANES 1999-2000 (CDC/NCHS 2004). Pyramid Servings Database for USDA Survey Food Codes Version 2.0 (Cook and Friday 2004).
9
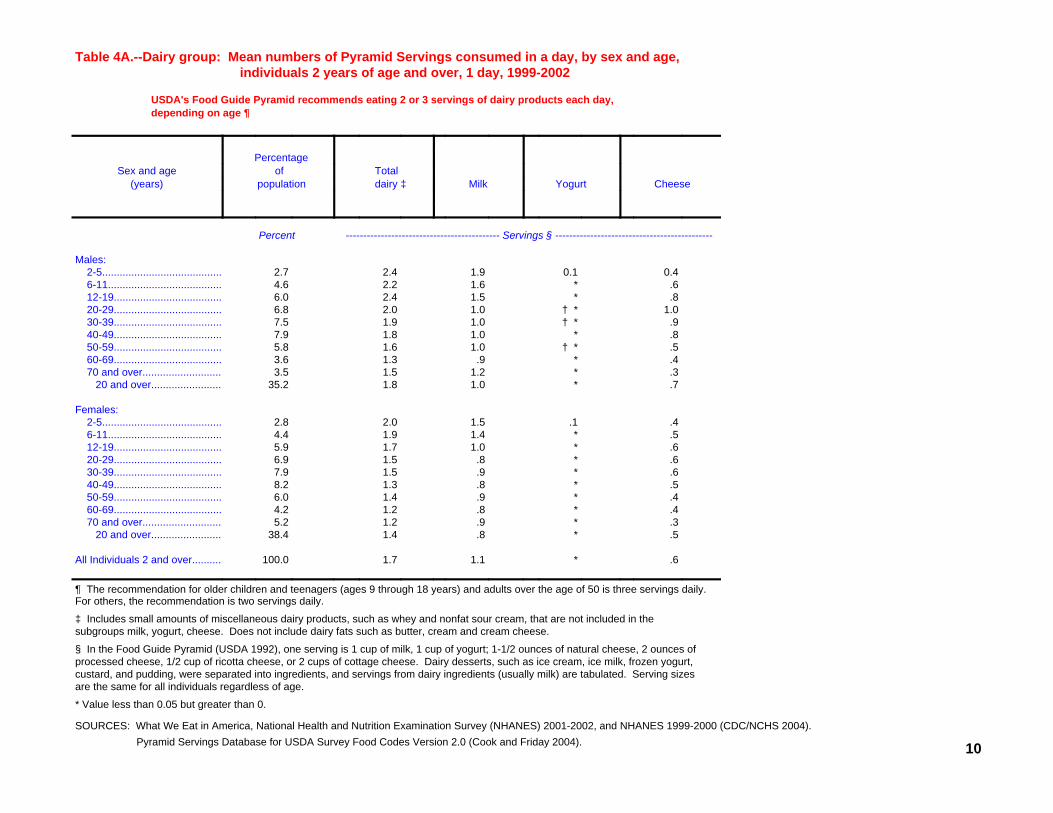
Table 4A.--Dairy group: Mean numbers of Pyramid Servings consumed in a day, by sex and age, individuals 2 years of age and over, 1 day, 1999-2002
USDA's Food Guide Pyramid recommends eating 2 or 3 servings of dairy products each day, depending on age ¶
Percentage Total ofSex and age
Cheese Yogurt Milk dairy ‡ population(years)
-------------------------------------------- Servings § ---------------------------------------------Percent
Males:0.40.11.92.4 2.7x 2-5......................................... .6 *1.62.24.6x 6-11....................................... .8 *1.52.46.0x 12-19.....................................
1.0† *1.02.06.8x 20-29..................................... .9† *1.01.97.5x 30-39..................................... .8 *1.01.87.9x 40-49..................................... .5† *1.01.65.8x 50-59..................................... .4 * .91.33.6x 60-69..................................... .3 *1.21.53.5x 70 and over........................... .7 *1.01.835.2x 20 and over........................
Females: .4 .11.52.02.8x 2-5......................................... .5 *1.41.94.4x 6-11....................................... .6 *1.01.75.9x 12-19..................................... .6 * .81.56.9x 20-29..................................... .6 * .91.57.9x 30-39..................................... .5 * .81.38.2x 40-49..................................... .4 * .91.46.0x 50-59..................................... .4 * .81.24.2x 60-69..................................... .3 * .91.25.2x 70 and over........................... .5 * .81.438.4x 20 and over........................
.6 *1.11.7100.0xAll Individuals 2 and over..........
¶ The recommendation for older children and teenagers (ages 9 through 18 years) and adults over the age of 50 is three servings daily. For others, the recommendation is two servings daily.
‡ Includes small amounts of miscellaneous dairy products, such as whey and nonfat sour cream, that are not included in the subgroups milk, yogurt, cheese. Does not include dairy fats such as butter, cream and cream cheese.
§ In the Food Guide Pyramid (USDA 1992), one serving is 1 cup of milk, 1 cup of yogurt; 1-1/2 ounces of natural cheese, 2 ounces of processed cheese, 1/2 cup of ricotta cheese, or 2 cups of cottage cheese. Dairy desserts, such as ice cream, ice milk, frozen yogurt, custard, and pudding, were separated into ingredients, and servings from dairy ingredients (usually milk) are tabulated. Serving sizes are the same for all individuals regardless of age.
* Value less than 0.05 but greater than 0.
SOURCES: What We Eat in America, National Health and Nutrition Examination Survey (NHANES) 2001-2002, and NHANES 1999-2000 (CDC/NCHS 2004). Pyramid Servings Database for USDA Survey Food Codes Version 2.0 (Cook and Friday 2004). 10
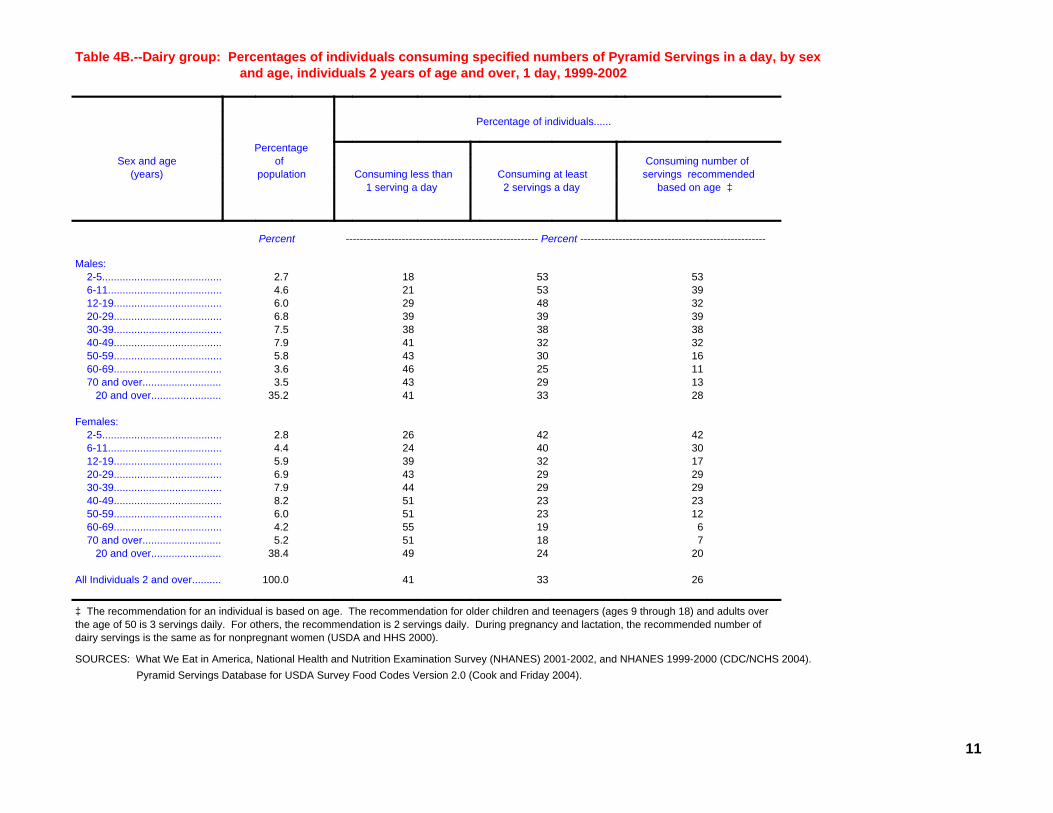
Table 4B.--Dairy group: Percentages of individuals consuming specified numbers of Pyramid Servings in a day, by sex and age, individuals 2 years of age and over, 1 day, 1999-2002
Percentage of individuals......
Percentage Consuming number of ofSex and age servings recommended Consuming at least Consuming less than population(years) based on age ‡ 2 servings a day 1 serving a day
------------------------------------------------------- Percent -----------------------------------------------------Percent
Males:5353182.7x 2-5.........................................3953214.6x 6-11.......................................3248296.0x 12-19.....................................3939396.8x 20-29.....................................3838387.5x 30-39.....................................3232417.9x 40-49.....................................1630435.8x 50-59.....................................1125463.6x 60-69.....................................1329433.5x 70 and over...........................28334135.2x 20 and over........................
Females:4242262.8x 2-5.........................................3040244.4x 6-11.......................................1732395.9x 12-19.....................................2929436.9x 20-29.....................................2929447.9x 30-39.....................................2323518.2x 40-49.....................................1223516.0x 50-59.....................................619554.2x 60-69.....................................718515.2x 70 and over...........................
20244938.4x 20 and over........................
263341100.0xAll Individuals 2 and over..........
‡ The recommendation for an individual is based on age. The recommendation for older children and teenagers (ages 9 through 18) and adults over the age of 50 is 3 servings daily. For others, the recommendation is 2 servings daily. During pregnancy and lactation, the recommended number of dairy servings is the same as for nonpregnant women (USDA and HHS 2000).
SOURCES: What We Eat in America, National Health and Nutrition Examination Survey (NHANES) 2001-2002, and NHANES 1999-2000 (CDC/NCHS 2004). Pyramid Servings Database for USDA Survey Food Codes Version 2.0 (Cook and Friday 2004).
11
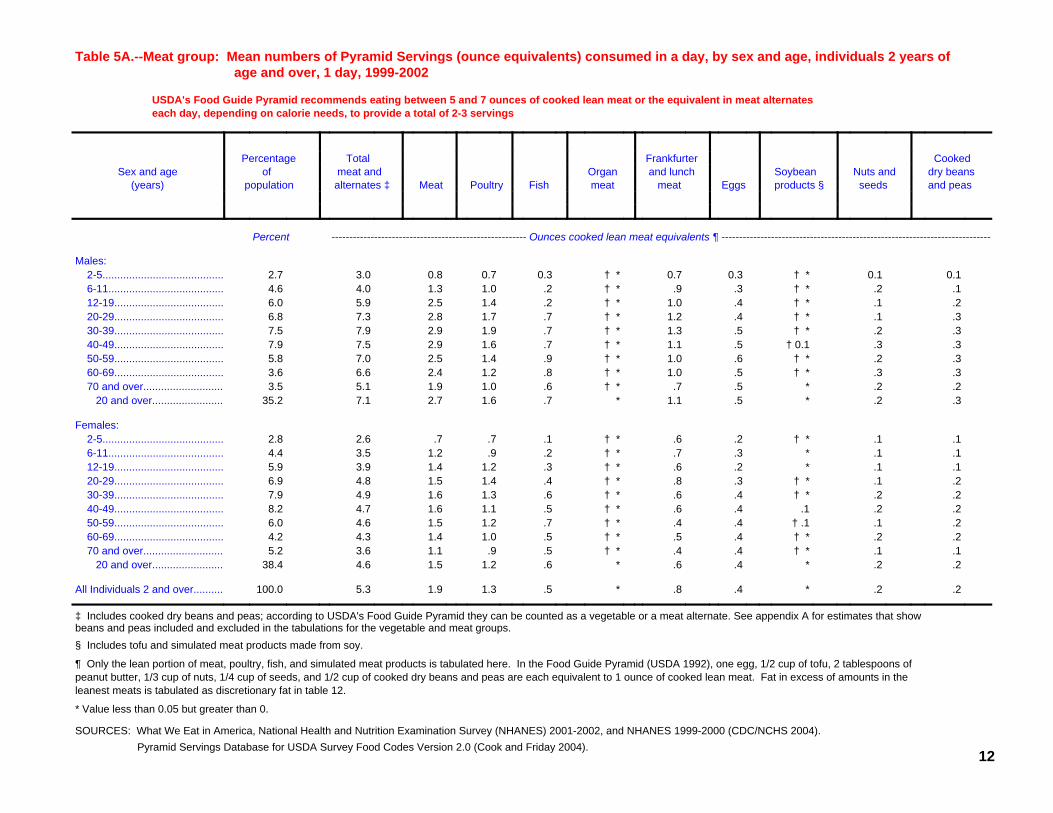
Table 5A.--Meat group: Mean numbers of Pyramid Servings (ounce equivalents) consumed in a day, by sex and age, individuals 2 years of age and over, 1 day, 1999-2002
USDA's Food Guide Pyramid recommends eating between 5 and 7 ounces of cooked lean meat or the equivalent in meat alternates each day, depending on calorie needs, to provide a total of 2-3 servings
CookedFrankfurter Total Percentagedry beansNuts andSoybean and lunchOrgan meat and ofSex and ageand peas seedsproducts §Eggs meat meat FishPoultry Meat alternates ‡ population(years)
------------------------------------------------------- Ounces cooked lean meat equivalents ¶ ----------------------------------------------------------------------------Percent
Males:0.10.1† *0.30.7† *0.30.70.83.02.7x 2-5......................................... .1 .2† * .3 .9† * .21.01.34.04.6x 6-11....................................... .2 .1† * .41.0† * .21.42.55.96.0x 12-19..................................... .3 .1† * .41.2† * .71.72.87.36.8x 20-29..................................... .3 .2† * .51.3† * .71.92.97.97.5x 30-39..................................... .3 .3† 0.1 .51.1† * .71.62.97.57.9x 40-49..................................... .3 .2† * .61.0† * .91.42.57.05.8x 50-59..................................... .3 .3† * .51.0† * .81.22.46.63.6x 60-69..................................... .2 .2 * .5 .7† * .61.01.95.13.5x 70 and over........................... .3 .2 * .51.1 * .71.62.77.135.2x 20 and over........................
Females: .1 .1† * .2 .6† * .1 .7 .72.62.8x 2-5......................................... .1 .1 * .3 .7† * .2 .91.23.54.4x 6-11....................................... .1 .1 * .2 .6† * .31.21.43.95.9x 12-19..................................... .2 .1† * .3 .8† * .41.41.54.86.9x 20-29..................................... .2 .2† * .4 .6† * .61.31.64.97.9x 30-39..................................... .2 .2 .1 .4 .6† * .51.11.64.78.2x 40-49..................................... .2 .1† .1 .4 .4† * .71.21.54.66.0x 50-59..................................... .2 .2† * .4 .5† * .51.01.44.34.2x 60-69..................................... .1 .1† * .4 .4† * .5 .91.13.65.2x 70 and over........................... .2 .2 * .4 .6 * .61.21.54.638.4x 20 and over........................
.2 .2 * .4 .8 * .51.31.95.3100.0xAll Individuals 2 and over..........
‡ Includes cooked dry beans and peas; according to USDA's Food Guide Pyramid they can be counted as a vegetable or a meat alternate. See appendix A for estimates that show beans and peas included and excluded in the tabulations for the vegetable and meat groups.§ Includes tofu and simulated meat products made from soy.
¶ Only the lean portion of meat, poultry, fish, and simulated meat products is tabulated here. In the Food Guide Pyramid (USDA 1992), one egg, 1/2 cup of tofu, 2 tablespoons of peanut butter, 1/3 cup of nuts, 1/4 cup of seeds, and 1/2 cup of cooked dry beans and peas are each equivalent to 1 ounce of cooked lean meat. Fat in excess of amounts in the leanest meats is tabulated as discretionary fat in table 12.
* Value less than 0.05 but greater than 0.
SOURCES: What We Eat in America, National Health and Nutrition Examination Survey (NHANES) 2001-2002, and NHANES 1999-2000 (CDC/NCHS 2004). Pyramid Servings Database for USDA Survey Food Codes Version 2.0 (Cook and Friday 2004).
12
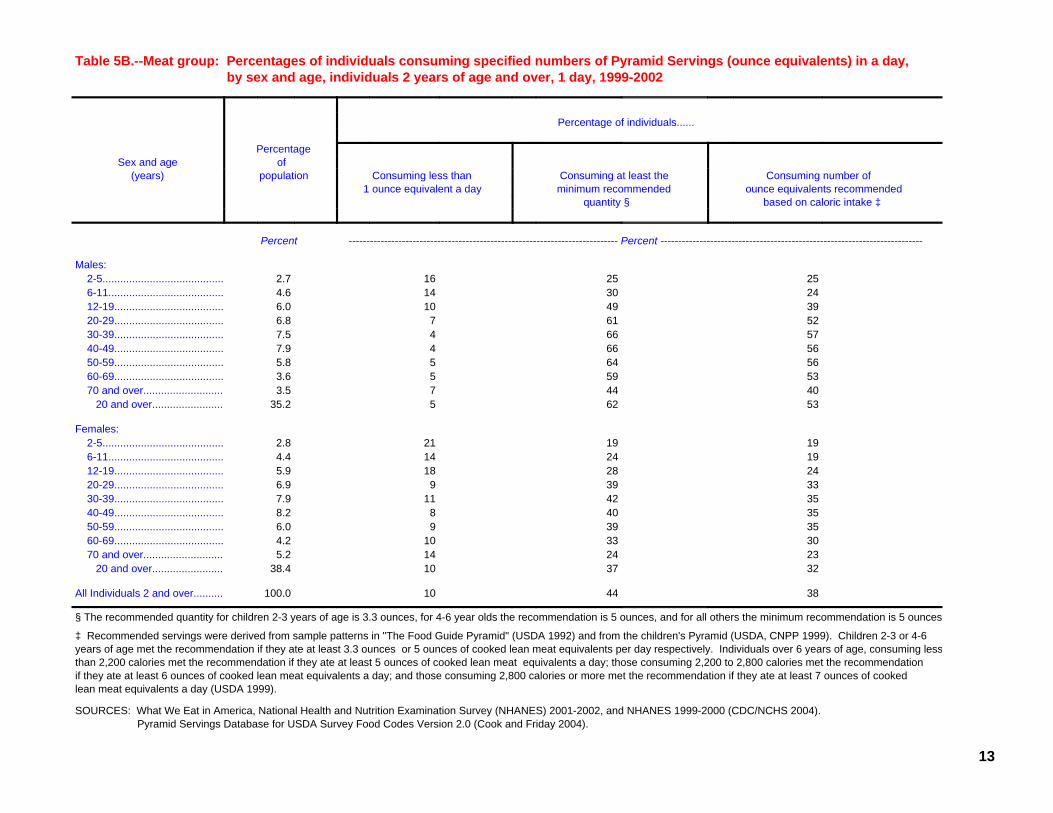
Table 5B.--Meat group: Percentages of individuals consuming specified numbers of Pyramid Servings (ounce equivalents) in a day, by sex and age, individuals 2 years of age and over, 1 day, 1999-2002
Percentage of individuals......
Percentage ofSex and age
Consuming number of Consuming at least the Consuming less than population(years) ounce equivalents recommended minimum recommended 1 ounce equivalent a day based on caloric intake ‡ quantity §
---------------------------------------------------------------------------- Percent --------------------------------------------------------------------------Percent
Males:2525162.7x 2-5.........................................2430144.6x 6-11.......................................3949106.0x 12-19.....................................526176.8x 20-29.....................................576647.5x 30-39.....................................566647.9x 40-49.....................................566455.8x 50-59.....................................535953.6x 60-69.....................................404473.5x 70 and over...........................5362535.2x 20 and over........................
Females:1919212.8x 2-5.........................................1924144.4x 6-11.......................................2428185.9x 12-19.....................................333996.9x 20-29.....................................3542117.9x 30-39.....................................354088.2x 40-49.....................................353996.0x 50-59.....................................3033104.2x 60-69.....................................2324145.2x 70 and over...........................32371038.4x 20 and over........................
384410100.0xAll Individuals 2 and over..........
§ The recommended quantity for children 2-3 years of age is 3.3 ounces, for 4-6 year olds the recommendation is 5 ounces, and for all others the minimum recommendation is 5 ounces
‡ Recommended servings were derived from sample patterns in "The Food Guide Pyramid" (USDA 1992) and from the children's Pyramid (USDA, CNPP 1999). Children 2-3 or 4-6 years of age met the recommendation if they ate at least 3.3 ounces or 5 ounces of cooked lean meat equivalents per day respectively. Individuals over 6 years of age, consuming lessthan 2,200 calories met the recommendation if they ate at least 5 ounces of cooked lean meat equivalents a day; those consuming 2,200 to 2,800 calories met the recommendation if they ate at least 6 ounces of cooked lean meat equivalents a day; and those consuming 2,800 calories or more met the recommendation if they ate at least 7 ounces of cooked lean meat equivalents a day (USDA 1999).
SOURCES: What We Eat in America, National Health and Nutrition Examination Survey (NHANES) 2001-2002, and NHANES 1999-2000 (CDC/NCHS 2004). Pyramid Servings Database for USDA Survey Food Codes Version 2.0 (Cook and Friday 2004).
13
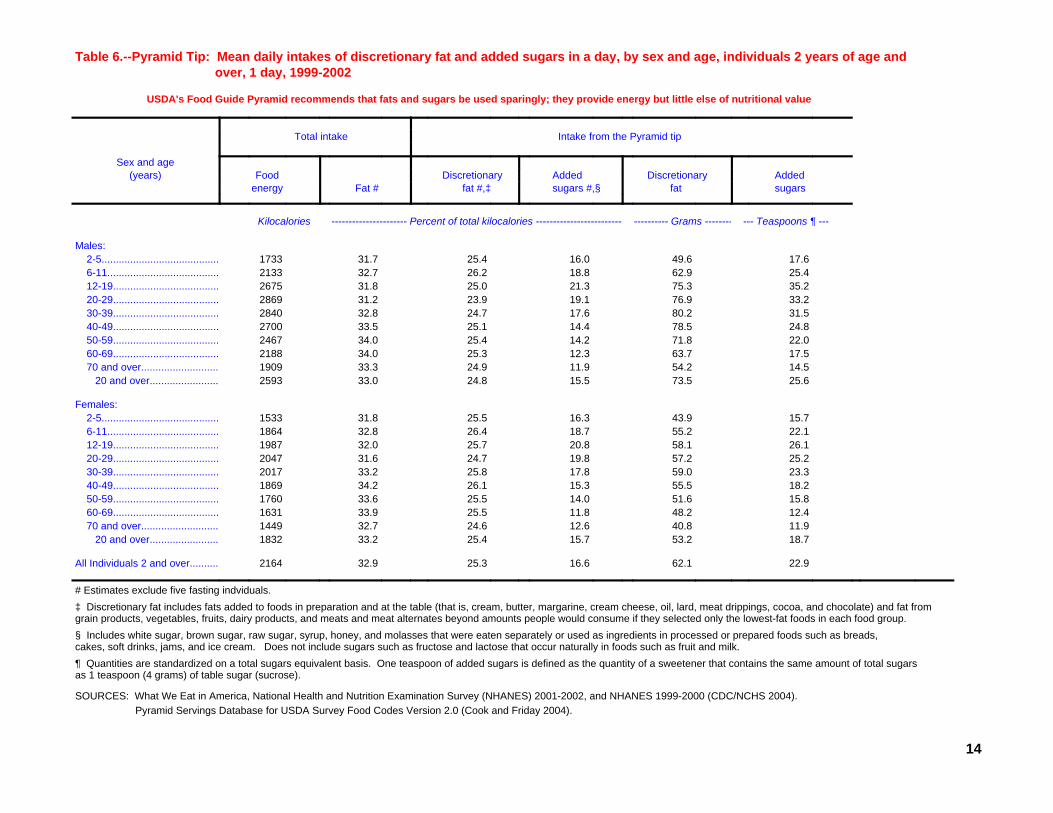
Table 6.--Pyramid Tip: Mean daily intakes of discretionary fat and added sugars in a day, by sex and age, individuals 2 years of age and over, 1 day, 1999-2002
USDA's Food Guide Pyramid recommends that fats and sugars be used sparingly; they provide energy but little else of nutritional value
Intake from the Pyramid tip Total intake Sex and age
Added Discretionary Added Discretionary Food(years) sugars fat sugars #,§ fat #,‡ Fat # energy
--- Teaspoons ¶ --- ---------- Grams -------- ---------------------- Percent of total kilocalories ------------------------- Kilocalories
Males:17.649.616.025.431.71733 2-5.........................................25.462.918.826.232.72133 6-11.......................................35.275.321.325.031.82675 12-19.....................................33.276.919.123.931.22869 20-29.....................................31.580.217.624.732.82840 30-39.....................................24.878.514.425.133.52700 40-49.....................................22.071.814.225.434.02467 50-59.....................................17.563.712.325.334.02188 60-69.....................................14.554.211.924.933.31909 70 and over...........................25.673.515.524.833.02593 20 and over........................
Females:
15.743.916.325.531.81533 2-5.........................................22.155.218.726.432.81864 6-11.......................................26.158.120.825.732.01987 12-19.....................................25.257.219.824.731.62047 20-29.....................................23.359.017.825.833.22017 30-39.....................................18.255.515.326.134.21869 40-49.....................................15.851.614.025.533.61760 50-59.....................................12.448.211.825.533.91631 60-69.....................................11.940.812.624.632.71449 70 and over...........................18.753.215.725.433.21832 20 and over........................
22.962.116.625.332.92164 All Individuals 2 and over..........
# Estimates exclude five fasting indviduals.‡ Discretionary fat includes fats added to foods in preparation and at the table (that is, cream, butter, margarine, cream cheese, oil, lard, meat drippings, cocoa, and chocolate) and fat from grain products, vegetables, fruits, dairy products, and meats and meat alternates beyond amounts people would consume if they selected only the lowest-fat foods in each food group. § Includes white sugar, brown sugar, raw sugar, syrup, honey, and molasses that were eaten separately or used as ingredients in processed or prepared foods such as breads, cakes, soft drinks, jams, and ice cream. Does not include sugars such as fructose and lactose that occur naturally in foods such as fruit and milk. ¶ Quantities are standardized on a total sugars equivalent basis. One teaspoon of added sugars is defined as the quantity of a sweetener that contains the same amount of total sugars as 1 teaspoon (4 grams) of table sugar (sucrose).
SOURCES: What We Eat in America, National Health and Nutrition Examination Survey (NHANES) 2001-2002, and NHANES 1999-2000 (CDC/NCHS 2004). Pyramid Servings Database for USDA Survey Food Codes Version 2.0 (Cook and Friday 2004).
14
15
Appendix A. Dry beans and peas – Meat alternate or vegetable?
The Food Guide Pyramid (USDA 1992, USDA and HHS 2000) indicates that dry beans and peas can count as servings of meat andmeat alternates or as vegetables.
In the main tables of this report, intakes of dry beans and peas are included in the meat group (see Tables 5A and 5B); total intakes ofvegetables (Tables 2A and 2B) exclude dry beans and peas.
The serving size for cooked dry beans and peas is defined as 1/2 cup. This amount is equivalent to either one ounce of cooked leanmeat or one vegetable serving. Because the units of measure for dry beans and peas are comparable, it is easy to show what happenswhen servings of cooked dry beans and peas are counted as either meat alternates of vegetables.
This appendix shows estimates for the vegetable group (Table 7) and meat group (Table 8) when dry beans and peas are included andexcluded in the tabulations. Individuals using these results must exercise caution to insure that dry beans and peas are not countedtoward both food groups.
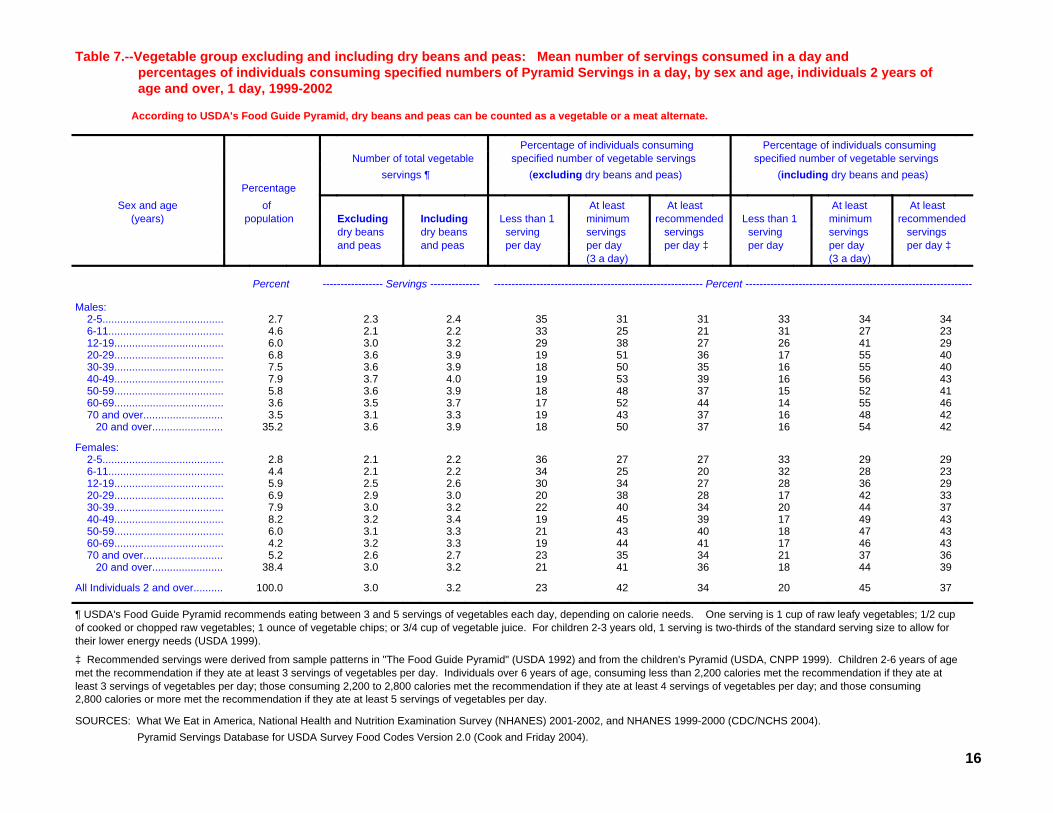
Table 7.--Vegetable group excluding and including dry beans and peas: Mean number of servings consumed in a day and percentages of individuals consuming specified numbers of Pyramid Servings in a day, by sex and age, individuals 2 years of age and over, 1 day, 1999-2002
According to USDA's Food Guide Pyramid, dry beans and peas can be counted as a vegetable or a meat alternate.
Percentage of individuals consuming Percentage of individuals consuming specified number of vegetable servings specified number of vegetable servings Number of total vegetable (including dry beans and peas) (excluding dry beans and peas) servings ¶
Percentage At least At least At least At least ofSex and age recommended minimum Less than 1 recommended minimum Less than 1 Including Excluding population(years) servings servings serving servings servings serving dry beans dry beans per day ‡ per day per day per day ‡ per day per day and peas and peas
(3 a day) (3 a day)
----------------------------------------------------------- Percent --------------------------------------------------------------------------------- Servings --------------Percent
Males:3434333131352.42.32.7x 2-5.........................................2327312125332.22.14.6x 6-11.......................................2941262738293.23.06.0x 12-19.....................................4055173651193.93.66.8x 20-29.....................................4055163550183.93.67.5x 30-39.....................................4356163953194.03.77.9x 40-49.....................................4152153748183.93.65.8x 50-59.....................................4655144452173.73.53.6x 60-69.....................................4248163743193.33.13.5x 70 and over...........................4254163750183.93.635.2x 20 and over........................
Females:2929332727362.22.12.8x 2-5.........................................2328322025342.22.14.4x 6-11.......................................2936282734302.62.55.9x 12-19.....................................3342172838203.02.96.9x 20-29.....................................3744203440223.23.07.9x 30-39.....................................4349173945193.43.28.2x 40-49.....................................4347184043213.33.16.0x 50-59.....................................4346174144193.33.24.2x 60-69.....................................3637213435232.72.65.2x 70 and over...........................3944183641213.23.038.4x 20 and over........................
3745203442233.23.0100.0xAll Individuals 2 and over..........
¶ USDA's Food Guide Pyramid recommends eating between 3 and 5 servings of vegetables each day, depending on calorie needs. One serving is 1 cup of raw leafy vegetables; 1/2 cup of cooked or chopped raw vegetables; 1 ounce of vegetable chips; or 3/4 cup of vegetable juice. For children 2-3 years old, 1 serving is two-thirds of the standard serving size to allow for their lower energy needs (USDA 1999).
‡ Recommended servings were derived from sample patterns in "The Food Guide Pyramid" (USDA 1992) and from the children's Pyramid (USDA, CNPP 1999). Children 2-6 years of age met the recommendation if they ate at least 3 servings of vegetables per day. Individuals over 6 years of age, consuming less than 2,200 calories met the recommendation if they ate at least 3 servings of vegetables per day; those consuming 2,200 to 2,800 calories met the recommendation if they ate at least 4 servings of vegetables per day; and those consuming 2,800 calories or more met the recommendation if they ate at least 5 servings of vegetables per day.
SOURCES: What We Eat in America, National Health and Nutrition Examination Survey (NHANES) 2001-2002, and NHANES 1999-2000 (CDC/NCHS 2004). Pyramid Servings Database for USDA Survey Food Codes Version 2.0 (Cook and Friday 2004).
16
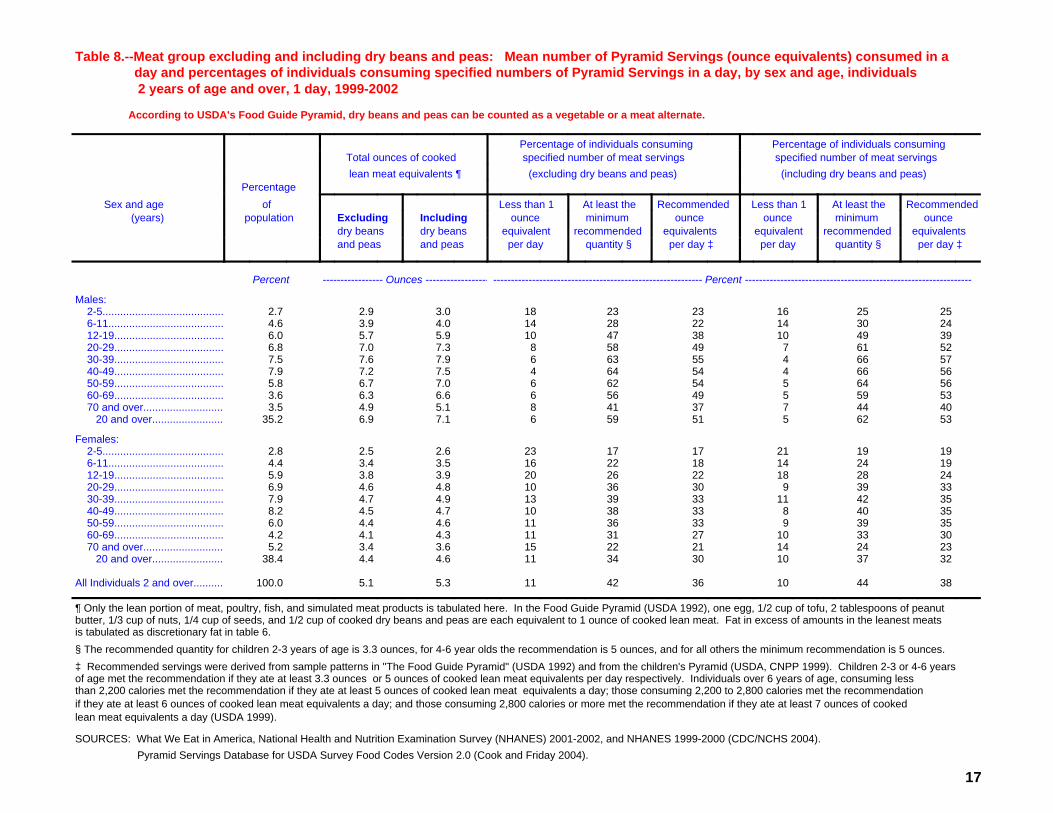
Table 8.--Meat group excluding and including dry beans and peas: Mean number of Pyramid Servings (ounce equivalents) consumed in a day and percentages of individuals consuming specified numbers of Pyramid Servings in a day, by sex and age, individuals 2 years of age and over, 1 day, 1999-2002
According to USDA's Food Guide Pyramid, dry beans and peas can be counted as a vegetable or a meat alternate.
Percentage of individuals consuming Percentage of individuals consuming specified number of meat servings specified number of meat servings Total ounces of cooked (including dry beans and peas) (excluding dry beans and peas) lean meat equivalents ¶
Percentage Recommended At least the Less than 1 Recommended At least the Less than 1 of Sex and age ounce minimum ounce ounce minimum ounce Including Excluding population(years) equivalents recommended equivalent equivalents recommended equivalent dry beans dry beans per day ‡ quantity § per day per day ‡ quantity § per day and peas and peas
----------------------------------------------------------- Percent --------------------------------------------------------------------------------- Ounces ------------------Percent
Males:2525162323183.02.92.7x 2-5.........................................2430142228144.03.94.6x 6-11.......................................3949103847105.95.76.0x 12-19.....................................52617495887.37.06.8x 20-29.....................................57664556367.97.67.5x 30-39.....................................56664546447.57.27.9x 40-49.....................................56645546267.06.75.8x 50-59.....................................53595495666.66.33.6x 60-69.....................................40447374185.14.93.5x 70 and over...........................53625515967.16.935.2x 20 and over........................
Females:1919211717232.62.52.8x 2-5.........................................1924141822163.53.44.4x 6-11.......................................2428182226203.93.85.9x 12-19.....................................333993036104.84.66.9x 20-29.....................................3542113339134.94.77.9x 30-39.....................................354083338104.74.58.2x 40-49.....................................353993336114.64.46.0x 50-59.....................................3033102731114.34.14.2x 60-69.....................................2324142122153.63.45.2x 70 and over...........................3237103034114.64.438.4x 20 and over........................
3844103642115.35.1100.0xAll Individuals 2 and over..........
¶ Only the lean portion of meat, poultry, fish, and simulated meat products is tabulated here. In the Food Guide Pyramid (USDA 1992), one egg, 1/2 cup of tofu, 2 tablespoons of peanut butter, 1/3 cup of nuts, 1/4 cup of seeds, and 1/2 cup of cooked dry beans and peas are each equivalent to 1 ounce of cooked lean meat. Fat in excess of amounts in the leanest meats is tabulated as discretionary fat in table 6. § The recommended quantity for children 2-3 years of age is 3.3 ounces, for 4-6 year olds the recommendation is 5 ounces, and for all others the minimum recommendation is 5 ounces.‡ Recommended servings were derived from sample patterns in "The Food Guide Pyramid" (USDA 1992) and from the children's Pyramid (USDA, CNPP 1999). Children 2-3 or 4-6 yearsof age met the recommendation if they ate at least 3.3 ounces or 5 ounces of cooked lean meat equivalents per day respectively. Individuals over 6 years of age, consuming less than 2,200 calories met the recommendation if they ate at least 5 ounces of cooked lean meat equivalents a day; those consuming 2,200 to 2,800 calories met the recommendation if they ate at least 6 ounces of cooked lean meat equivalents a day; and those consuming 2,800 calories or more met the recommendation if they ate at least 7 ounces of cooked lean meat equivalents a day (USDA 1999).
SOURCES: What We Eat in America, National Health and Nutrition Examination Survey (NHANES) 2001-2002, and NHANES 1999-2000 (CDC/NCHS 2004). Pyramid Servings Database for USDA Survey Food Codes Version 2.0 (Cook and Friday 2004).
17
18
Appendix B. Counts of respondents and population percentages by sex and age, individuals 2 years of age and over, 1 day, NHANES 1999-2002
The table below shows unweighted counts of survey respondents in each sex-age group in the Pyramid Servings tables and theweighted percentages of the population that they represent. These counts and population percentages only include individuals 2 yearsof age and over with reliable and complete intakes and five individuals reporting no foods or beverages consumed for the day(fasters); breast-fed children are excluded. (Pyramid serving recommendations are for individuals 2 years and over.) The statisticspresented in tables 1A through 8 are based on data from the same respondents.
Data in the report tables (1A through 8) are weighted to provide national probability estimates for the U.S. population. Four yearsampling weights were calculated by the National Center for Health Statistics (NCHS) using data from the Bureau of the Census (CDC/NCHS 2004). These weights adjust for differential rates of sample selection and non-response.
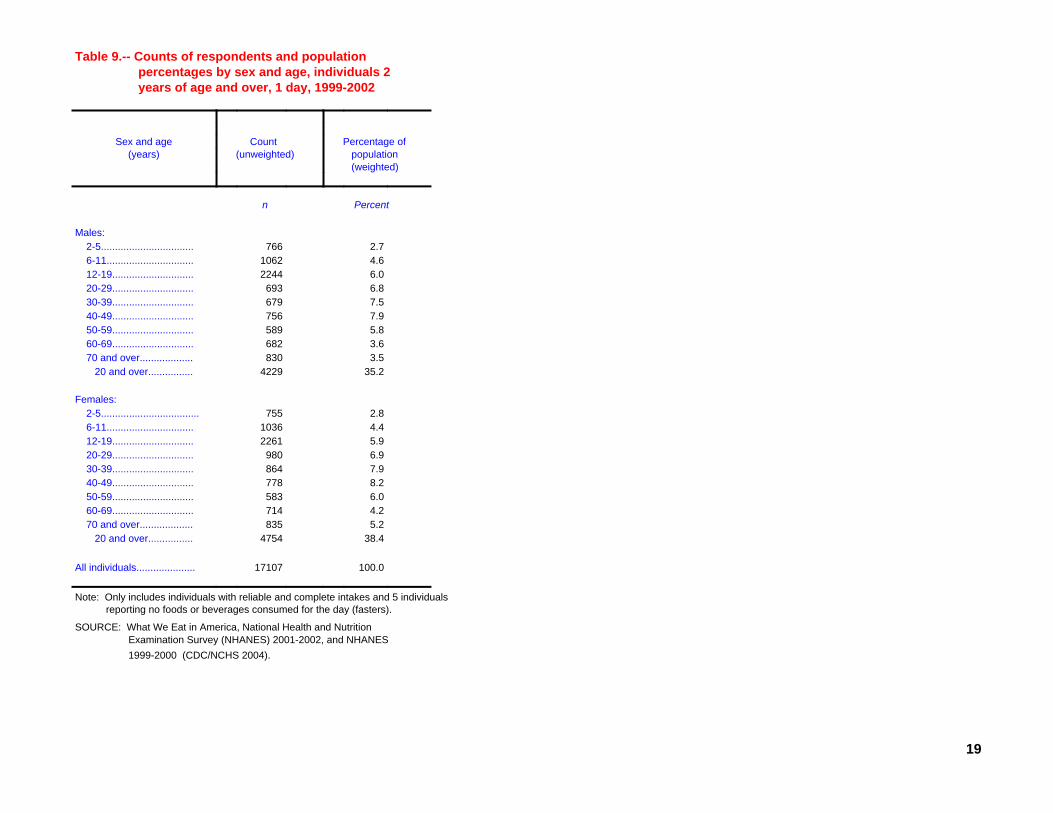
Table 9.-- Counts of respondents and population percentages by sex and age, individuals 2 years of age and over, 1 day, 1999-2002
Percentage of Count Sex and age population (unweighted)(years) (weighted)
Percent n
Males:2.7766 2-5.................................4.61062 6-11...............................6.02244 12-19.............................6.8693 20-29.............................7.5679 30-39.............................7.9756 40-49.............................5.8589 50-59.............................3.6682 60-69.............................3.5830 70 and over...................
35.24229 20 and over................
Females:2.8755 2-5...................................4.41036 6-11...............................5.92261 12-19.............................6.9980 20-29.............................7.9864 30-39.............................8.2778 40-49.............................6.0583 50-59.............................4.2714 60-69.............................5.2835 70 and over...................
38.44754 20 and over................
100.017107All individuals.....................
Note: Only includes individuals with reliable and complete intakes and 5 individuals reporting no foods or beverages consumed for the day (fasters).
SOURCE: What We Eat in America, National Health and Nutrition Examination Survey (NHANES) 2001-2002, and NHANES 1999-2000 (CDC/NCHS 2004).
19

20
Appendix C. Statistical Notes
Estimates based on small cell sizes may be less statistically reliable than estimates based on larger cell sizes. Cell size refers to the unweightednumber of individuals in a given sex-age group (see Appendix B). The guidelines (listed below) for determining when a cell size is small take intoaccount the average design effect for the survey. The design effect results from the complex sample design and from the procedures used to weightthe data. When the design effect is 1.00, its effect on accuracy is negligible; a larger design effect implies a greater effect on the variance. Theguidelines were derived from a policy statement (FASEB/LSRO 1995) that specifies the use of a broadly calculated design effect. The varianceinflation factor used to generate this set of tables for the 1999-2002 was 2.02.
Daggers in the tables flag estimates that may be less statistically reliable than those which are not flagged. The rules used for flagging estimatesare listed below, and tables to which each rule applies are identified.
1. An estimated mean is flagged when it is based on a cell size of less than 30 times the average design effect or when its coefficient of variation(CV) is equal to or greater than 30 percent. The CV is the ratio of the estimated standard error of the mean to the estimated mean, expressed as apercentage.
Rule 1 was applied to mean intakes in tables 1A, 2A, 3A, 4A, 5A, 6, 7 and 8 to flag estimates that should be used with caution. This rule was alsoapplied to the percentage of kilocalories data in tables 6.
2. An estimated proportion (percentage) that falls above 25 percent and below 75 percent is flagged when it is based on a cell size of less than 30times the average design effect or when the CV is equal to or greater than 30 percent.
3. An estimated proportion of 25 percent or lower or 75 percent or higher is flagged when the smaller of np and n(1–p) is less than eight times theaverage design effect, where n is the cell size on which the estimate is based and p is the proportion expressed as a fraction.
Rules 2 and 3 were applied to data in tables 1B, 2B, 3B, 4B, and 5B to flag estimates that should be used with caution. These rules were alsoapplied to the data on percentage of population meeting recommendation in Appendix A tables 7 and 8.
Values for the percentage of the population meeting Pyramid Serving recommendations are estimates of the distribution based on 1 day ofreported food intakes and should not be interpreted to represent ususal intakes for the population.
21
Appendix D: Method Used to Develop Pyramid Servings Estimates in this Table Set.
Overview
The Food Guide Pyramid (USDA 1992) was designed as an educational tool to help explain and interpret the Dietary Guidelines forAmericans—ten basic principles for healthful eating that form the basis of Federal nutrition policy (USDA and HHS 2000, US Congress 1990). The Pyramid depicts the total diet, specifying amounts to eat from five major food groups (grain, vegetable, fruit, dairy, and meat) and selectedsubgroups and provides advice about intakes of fats, added sugars, and alcohol (items found at the Pyramid tip). In general, Pyramidrecommendations are defined in terms of servings expressed in household measures, such as slices, pieces, and cups.
The Pyramid recommends that individuals 2 years of age and over eat at least the lowest number of servings within recommended ranges. Exceptfor the dairy group, the number of servings that is right for a person depends on his or her calorie needs; people who need more calories should eatmore servings. For the dairy group, the recommended number of servings depends on age and is not based on caloric needs. The Pyramid alsorecommends limiting fat intake to 30 percent of total calories and limiting added sugar intake to 6, 12, and 18 teaspoons per day for energy intakesof 1600, 2200, and 2800 calories respectively.
Below are sample diets for a day at three calorie levels for the general population (7 years and over):
Lower+ Moderate Higher
Food Group 1,600-calorie diet 2,200-calorie diet 2,800-calorie diet
Bread (servings) 6 9 11
Vegetable (servings) 3 4 5
Fruit (servings) 2 3 4
Dairy (servings) 2 or 3* 2 or 3* 2 or 3*
Meat (ounces) 5 6 7
+ The recommendations for young children 2 through 6 years of age are dependent on age alone; the number of servings are the same as those recommended for the 1,600 calorie diet; for very young
children (2-3 years of age), the serving size should be 2/3 the standard size for all Pyramid groups except dairy (USDA/CNPP 1999).
* The number of dairy servings is age dependent: The recommendation for older children and teenagers (ages 9 through 18 years) and adults over the age of 50 is three servings daily. For others, the recommendation is two servings daily. During pregnancy and lactation, the recommended number of milk group servings is the same as for nonpregnant women.
Source: USDA (1992) and USDA and HHS (2000).
22
These diets are guides to the number of servings from each food group that people should eat depending on their calorie needs. Generally speaking, the bottom of the recommended range of servings is about right for many sedentary women and older adults; themiddle is about right for most children, teenage girls, active women, and many sedentary men; and the top of the range is about rightfor teenage boys, many active men, and some very active women.
Young children (2 through 6 years of age) should eat the number of servings shown in the lower calorie diet. What counts as aserving for children 4 to 6 years old is the same as for the general population. On the other hand, the serving size for very youngchildren (2 through 3 years of age) is 2/3 of the standard serving, except for the dairy group which remains full size (USDA/CNPP1999).
Converting Food Consumption Data Into Pyramid Servings
In 1993, researchers at the Agricultural Research Service (ARS) of the U.S. Department of Agriculture (USDA), in collaboration withresearchers from the National Cancer Institute, began development of a method to assess food intakes in terms of food-guidance-based servings (Cleveland et al. 1997, Krebs-Smith et al. 1995, 1996). The goal was to convert food intake data for the U.S.population collected in the Continuing Survey of Food Intakes by Individuals (CSFII) 1989-91 (USDA/HNIS 1996) into a form thatwould yield estimates for the U.S. population that could be compared to recommendations in USDA's Food Guide Pyramid (USDA1992). The conversion required development of a method with very specific operational definitions and processing procedures inorder to provide serving estimates consistent with the general consumer-oriented type of guidance provided by the Food GuidePyramid. Such a method was required to translate complex food mixtures and food combinations into Pyramid servings by foodgroups. Decisions about how to do this were guided by information derived from consumer publications on the Pyramid (USDA1992, 1993) and technical publications about its research base (Cronin et al. 1985, 1987; Welsh et al. 1993), while taking into accountthe diversity of the U.S. food supply as it existed during the survey period.
Further development and documentation of the methodology for producing Pyramid servings databases continued (USDA/ARS 1997,1998) and today the Pyramid servings methodology is maintained as part of FoodLink (seehttp://www.ba.ars.usda.gov/cnrg/services/foodlink.html), a computerized food data linkage system that translates data on USDAsurvey food codes to information on ingredients and commodities.
23
Serving weights were assigned to foods or to their ingredients in forms as close to “as eaten” as possible. If appropriate, servingweights were assigned to the food as reported in the survey. Foods that contained ingredients from more than one Pyramid groupneeded to be separated into ingredients before assigning serving weights. Much of the ingredient data came from recipes in theUSDA survey food databases (USDA/ARS 2000, 2004a). Some ingredients of survey foods needed further separation into morespecific ingredients. For example, it the ingredients listed in the survey recipe for “soup prepared with water” were condensed soupand water, the condensed soup was separated into ingredients. The information to do this secondary level of separation came fromARS' Nutrient Data Laboratory or from the ingredient and nutrient information on food labels or other manufacturer dietary data. Every attempt was made to adhere strictly to the concepts and definitions described in the Food Guide Pyramid (USDA 1992) whencategorizing foods and defining servings.
Source of Serving Weights for Foods or Ingredients
The Food and Nutrient Database for Dietary Studies (FNDDS), 1.0 (USDA/ARS 2004a) and the CSFII 1994-96, 1998 food codingdatabase (USDA/ARS 2000) were the primary sources used to derive food- or ingredient-specific weights consistent with Pyramiddefinitions for serving sizes. For many food codes, weights for several portion sizes were available. From these weights, a weightconsistent with the Pyramid definition for a serving of that food (or ingredient) was selected or imputed. Other weights came fromfiles that are in the USDA Nutrient Database for Standard Reference (USDA/ARS 2004b, USDA/ARS 1999).
What Foods Count As Servings in Each of the Five Major Food Groups?
Grain group. In the Food Guide Pyramid, the grain group includes yeast breads and rolls; quick breads such as muffins, biscuits,pancakes, and tortillas; rice; pasta; breakfast cereals; grain-based snacks such as crackers, pretzels, popcorn, and corn chips; andbaked goods made from flour, such as cakes, cookies, croissants, doughnuts, pastries, and pie crust (USDA 1992, 1993). The Pyramidemphasizes whole-grain choices; it recommends choosing several servings a day of foods made from whole grains (USDA 1992;USDA and HHS 2000). For that reason, the Pyramid Servings data present data separately on servings of whole grains and nonwholegrains. Some foods in the grain group contain relatively high amounts of fat and sugar; those ingredients count toward the Pyramidtip.
Definitions of grain servings were derived from the Food Guide Pyramid (USDA 1992, 1993). Educational materials about thePyramid list the following as a serving size for grain products: one slice of bread; 1/2 of a hamburger bun, English muffin, bagel, orcroissant; one small roll, biscuit, or muffin; one tortilla; one ounce of ready-to-eat cereal; 1/2 cup of cooked cereal, rice, or pasta; 3 to
24
4 small or 2 large crackers; 1/2 of a medium doughnut or Danish; or 2 medium cookies. The Pyramid does not specify serving sizesfor all foods in the grain group, and those specified are relatively imprecise. For example, slices of bread come in many sizes, andterms like small, medium, and large are relative. Therefore, ARS developed operational definitions and procedures for the grainservings sizes based on two primary criteria:
– Consistency with the underlying rationale for the grain group as the primary source of complex carbohydrate in diets and amajor contributor to fiber intake.
S Maintenance of the Pyramid concept of defining servings in common household measures (cups, ounces) and easilyrecognizable units (1 slice of bread, one roll).
Pyramid serving sizes were used as a basis for selecting or imputing appropriate serving weights from the FNDDS, CSFII 1994-96,1998 food coding database, and Standard Reference, but guidelines were developed to standardize the selection process. Whereneeded, methods were also developed to define servings based on either the grain content or the complex carbohydrate content of thefood. Details are presented below.
S For yeast breads (rolls, English muffins, bagels, croissants), some quick breads (muffins, tea breads), rice, pasta, and breakfastcereals, the basic Pyramid definitions for servings were used, and guidelines were established for selecting serving weightsfrom the food coding database.
– For snack-type grain products (crackers, pretzels, corn chips), grain-based desserts (cookies, cakes, sweet rolls, pastries, piecrust), certain quick breads (hush puppies, dumplings), and miscellaneous grains (thickeners, batter, breading), a method wasdeveloped for defining servings based on the grain content of the food.
– For some grain products, notably quick breads (biscuits, pancakes, waffles, tortillas, taco shells) and pita bread, a combinationof the two approaches presented above was used. The grams needed per serving were calculated based on the grain content ofthe food, but then the serving size was defined as a household measure for which a gram weight was available in the FNDDS(for example, a pancake of a given diameter). A serving was defined as the household measure with a gram weight closest tothe weight calculated based on grain content.
– For popcorn, the serving size was defined in terms of common household units based on the complex carbohydrate content.
25
– To determine whole-grain servings, CNRG FoodLink staff, in consultation with food specialists at ARS, Nutrient DataLaboratory, Beltsville, MD, classified all grain ingredients used in the FNDDS - Standard Reference link file and the CSFII1994-96, 1998 recipe database as whole or nonwhole grain. The total number of grain servings per 100 grams of each foodreported in the survey was determined. Then, this total number of servings was divided into whole and nonwhole grainservings based on the proportion of the grain ingredients in the food that were whole grain and nonwhole grain.
Vegetables. The Food Guide Pyramid separates vegetables into five subgroups: dark green vegetables; deep yellow vegetables;starchy vegetables; dry beans and peas (legumes); and other vegetables (USDA 1992, 1993). A list of vegetables classified accordingto these subgroups is shown below. It includes all those from the FNDDS (USDA/ARS 2004a) and codes used in the coding databasefor the CSFII 1994 -96, 1998 (USDA/ARS 2000). The classification for those marked with an asterisk is from a publicationdescribing the Pyramid and its use (USDA 1993). The remainders were assigned by ARS nutritionists and food specialists.
S Dark green vegetables: arugula, balsam-pear tips, beet greens*, broccoli*, chard*, chicory*, cilantro, collard greens*,dandelion greens*, endive*, escarole*, grape leaves, kale*, lambsquarters, mustard greens*, parsley, poke greens, pumpkinleaves, romaine lettuce*, spinach*, sweet potato leaves, taro leaves, turnip greens*, watercress*.
S Deep-yellow vegetables: calabaza, carrots*, carrot juice, pumpkin*, sweet potato*, winter squash*, yams.
– Starchy vegetables: black-eyed peas (not dried), breadfruit*, burdock, cassava, corn*, cowpeas (not dried), dasheen, greenpeas*, hominy*, jicama, lima beans (immature)*, parsnips, pigeonpeas, poi, salsify, white potato*, rutabaga*, tannier, taro*,yambean.
S Dry beans and peas include: bayo beans, black beans*, black-eyed peas*, broadbeans, calico beans, chickpeas (garbanzos)*,cowpeas, fava beans, kidney beans*, lentils*, lima beans (mature)*, mung beans*, navy beans*, pinto beans*, pink beans, redMexican beans, split peas*, soybeans (mature), white beans.
Note: According to the Pyramid, dry beans and peas can count as a vegetable or as a meat alternate. In this table set, intakes ofthis subgroup are included under the meat group (Tables 5A and 5B). Appendix A shows estimates when dry beans and peasare included and excluded in the tabulations for the vegetable group (Table 7) and meat group (Table 8).

26
– Other vegetables: algae, aloe vera juice, artichoke*, asparagus*, balsam-pear pods, bamboo shoots, bean and alfalfa sprouts*, beets*, broccoflower, Brussels sprouts*, cabbage* (green and red, and sauerkraut), cactus, capers, cauliflower*, celery*, celeryjuice, chayote, Chinese cabbage*, chives, christophine, chrysanthemum, coriander, cucumber*, eggplant*, garlic, ginger root,green beans*, horseradish, jute (potherb), kohlrabi, leek, lettuce*, lotus root, mushrooms*, nopales, okra*, olives, onions(mature and green)*, oriental radishes, palm hearts, peppers (green*, red, hot, banana), pimiento, pumpkin flowers, radicchio,radishes*, seaweed, snow peas*, summer squash*, swamp cabbage, tomatillos, tomato*, tomato juice*, tree fern, turnips*,water chestnuts, wax beans, waxgourd, winter melon, zucchini*.
Pyramid Servings data further subdivided these groups. White potatoes are listed separately from other starchy vegetables becausethey account for a large proportion of starchy vegetable consumption. Similarly, tomatoes are listed as a separate group; the FoodGuide Pyramid includes them with "other vegetables."
Serving sizes were based on those in the Food Guide Pyramid, which defines a serving as one cup of raw leafy vegetables; 1/2 cup ofother vegetables, cooked or chopped raw; or 3/4 cup of vegetable juice. These serving sizes were used as the basis for selecting orimputing appropriate serving weights from the FNDDS, CSFII 1994-96, 1998 food coding database, and Standard Reference.
Often, the food coding database provided several different weights for the various forms in which a vegetable might be available forconsumption. When mashed vegetables were reported, the weight for the mashed form was used. For other forms, the followinggeneral order of priority was used to select a serving weight: chopped, sliced, cubed, diced, pieces, whole. For broccoli, the order ofpriority was: chopped, cut, pieces, florets, spears. In general, this had the effect of counting as a serving the most dense form of thevegetable for which a weight was available.
Although serving weights were assigned to vegetables in their "as consumed" form, the nonvegetable ingredients were counted towardappropriate food groups as well. For example, the fats added in cooking and the added sugars were counted toward amounts in thePyramid tip, and the milk in mashed potatoes was counted toward the dairy group. Vinegar does not count toward a food groupbecause it has no calories.
For vegetable combinations containing vegetables from more than one subgroup (for example, peas and carrots), first the servingweight was selected from the food coding database. Then the number of servings from each subgroup per 100 grams was determinedbased on the proportion by weight that each vegetable in the recipe contributed to the total.
27
Fruits. The Food Guide Pyramid separates fruits into two subgroups: "citrus, melons, berries" and "other fruits" (USDA 1993). Alist of fruits classified according to these subgroups is shown below. The classification for those marked with an asterisk is from apublication describing the Pyramid and its use (USDA 1993). The remainders were assigned by ARS nutritionists and foodspecialists.
– Citrus fruit, melons, berries: Acerola, blackberries, blueberries*, boysenberries, calamondin, cantaloupe*, casaba melon,cranberries*, elderberries, gooseberries, grapefruit*, honeydew melon*, huckleberries, juneberries, kiwifruit*, kumquat,lemon*, lime, loganberries, mandarin oranges, mulberries, orange*, raspberries*, strawberries*, tangelo, tangerine*, uglifruit*, watermelon*, and juices made from these fruits.
– Other fruits: Apple*, apricot*, Asian pear*, avocado*, banana*, cherries*, currants, dates*, figs*, genip, guava*, grapes*,jackfruit, Japanese pear, jobo, loquats, lychee, mamey (mamea apple), mango*, nectarine*, papaya*, passion fruit*, peach*,pear*, persimmon, plantain*, pineapple*, plum*, pomegranate, prickly pear*, prunes*, quince, raisins*, red banana, rhubarb*,sapodilla, soursop (guanabana), star fruit* (carambola), sweetsop, tamarind, watermelon rind, wi-apple, and juices made fromthese fruits.
Definitions of serving sizes were based on those in the Food Guide Pyramid. It defines a serving as a whole fruit, such as a mediumapple, banana, or orange; a grapefruit half; a melon wedge; 3/4 cup fruit juice; 1/2 cup berries; 1/2 cup chopped, cooked, or cannedfruit; or 1/4 cup dried fruit (USDA 1992). These serving sizes were used as the basis for selecting or imputing appropriate servingweights from the FNDDS, CSFII 1994-96, 1998 food coding database, and Standard Reference.
Servings from all fruits, whether eaten plain or consumed as an ingredient of any food, were counted toward fruit group servings. Aswith foods in the grain and vegetable groups, foods were separated into ingredients before serving weights were assigned only if aserving weight consistent with Pyramid guidance could not be determined for the food consumed. Therefore, serving weights wereassigned to fruits prepared with added sugar if the sugar did not increase the volume appreciably. For example, weights from the foodcoding database appropriate for a 1/2-cup serving were selected for fruits that were unsweetened and sweetened and for those cannedin juice, light syrup, and heavy syrup. A few fruit sources such as fruit nectars and cranberry sauces were defined as mixtures andseparated into ingredients before serving weights were assigned because they contained large proportions of added sugar, which couldchange the volume measurement.

28
For fruit combinations containing fruits from more than one subgroup (for example, fruit cocktail with citrus fruits), first the servingweight was selected from the food coding database. Then the number of servings from each subgroup per 100 grams was determinedbased on the proportion by weight that each fruit in the recipe contributed to the total.
Dairy. According to the Pyramid, most dairy foods are classified in this group (also called the milk, yogurt, and cheese group). Dairyfoods that are excluded are those which are primarily fats, namely butter, cream, sour cream, and cream cheese.
For milk and yogurt, the serving size used was taken directly from the Pyramid, which defines a serving as one cup of milk or yogurt(USDA 1992). For cheeses, serving sizes were based on the Pyramid's underlying criterion for a dairy serving, which is that it shouldprovide about the same amount of calcium as one cup of skim milk (that is, 302 milligrams) (USDA 1992, 1993).
Most foods containing dairy products were separated into ingredients, and the number of servings from the dairy group wasdetermined based on the amount of milk or cheese they contained using the serving sizes specified above. This was true for foodshaving dairy products as primary ingredients, such as ice cream, ice milk, frozen yogurt, puddings, and custards (including those usedas fillings). It also applied to mixed dishes (such as casseroles, omelets, soups, and vegetables with cream or cheese sauces) and tomixtures (such as salad dressings, milk gravies, meal replacements, and candies) that contained milk or cheese as an ingredient. However, for a few foods, such as grain products, processed meats, and meat analogs, milk was considered such an integral part of thefood that to count the milk toward servings from the dairy group would have constituted double counting.
Meat. Meats and meat alternates are classified in the meat group. Meats include beef, pork, lamb, veal, game, poultry, fish, shellfish,frankfurters, sausages, bacon, luncheon meats, and organ meats. Meat alternates include eggs, soy-based products such as tofu andmeat analogs, nuts, and seeds. According to the Pyramid, dry beans and peas can count as a vegetable or as a meat alternate. In thistable set, intakes of this subgroup are included under the meat group (Tables 5A and 5B). Appendix A shows estimates when drybeans and peas are included and excluded in the tabulations for the vegetable group (Table 7) and meat group (Table 8).
The Food Guide Pyramid recommends eating two to three servings each day of foods from the meat group (also called the meat,poultry, fish, dry beans, eggs, and nuts group). The Pyramid states that the total amount of these servings should be the equivalent of5 to 7 ounces of cooked lean meat, poultry, or fish per day (USDA 1992). For meat alternates, the Pyramid specifies amountsequivalent to one ounce of cooked lean meat as follows: 1/2 cup cooked dry beans or peas, one egg, 2 tablespoons peanut butter, 1/3cup nuts, 1/4 cup seeds, and 1/2 cup tofu (USDA 1992, 1993). Thus, the same serving unit, ounces of cooked lean meat equivalents,is used for all foods that count toward the meat group. This measure standardizes the definition of a serving unit for the different
29
types of foods that count toward the meat group and presents the data in the unit of measure in which the meat group recommendationis specified.
Dry beans and peas include: bayo beans, black beans*, black-eyed peas*, broadbeans, calico beans, chickpeas (garbanzos)*, cowpeas,fava beans, kidney beans*, lentils*, lima beans (mature)*, mung beans*, navy beans*, pinto beans*, pink beans, red Mexican beans,split peas*, soybeans (mature), white beans.
When the Food Guide Pyramid was developed, nutrient profiles were established for the food groups and subgroups as a preliminarystep toward determining the number of servings to recommend (Cronin et al. 1985, 1987; Welsh et al. 1993). For the five majornutrient-bearing groups and their subgroups, each profile represents the quantities of nutrients one would expect to obtain on averagefrom a serving if foods were in their lowest fat forms (Welsh et al. 1993). The profile for the meat group provides 2.651 grams of fatper ounce of cooked lean meat, poultry, or fish. This translates to 9.35 grams of fat per 100 grams of cooked lean meat.
Therefore, the definition of cooked lean meat is meat, poultry, or fish that contains 9.35 grams or less of fat per 100 grams and at least90.65 grams of nonfat meat per 100 grams. Thus, by definition, every 100 grams of meat, poultry, or fish with 9.35 grams or less offat is 3.53 ounces of cooked lean meat (that is, 100/28.35 = 3.53) and has no discretionary fat to count toward the Pyramid tip.
For meat, poultry, or fish having more than 9.35 grams of fat per 100 grams when cooked, an algorithm was developed to provide astandardized method for determining the amount of cooked lean meat and the amount of discretionary (or excess) fat per 100 grams. This means that meats generally considered high in fat, such as frankfurters and bacon, for which there are low-fat alternatives, can besystematically categorized into Pyramid food groups in a manner consistent with the concepts behind the Pyramid. As the variety oflow-fat meat products on the market increases, this will become increasingly important.
Some foods contained raw meat as an ingredient. ARS developed a standard for raw meat comparable to the standard for cookedmeat by estimating the grams of fat in 100 grams of raw meat that would be equivalent to 9.35 grams or less of fat in the cookedstandard. This standard was 6.16 grams of fat or less per 100 grams of raw meat, poultry, or fish. For details see Cook and Friday2004.
The Pyramid tip. The Pyramid tip includes fats, sugars, and alcohol. Fats and sugars eaten separately or added to foods obviouslycount toward the tip. So do most of the fats and the added sugars from foods in the five major food groups (USDA 1992). The tablesin this report include information on discretionary fat and added sugars but not alcohol.
30
Discretionary fat includes:– all "excess" fats from the five major food groups beyond amounts that would be consumed if only the lowest fat forms of food
in each food group were eaten – fats added to foods in preparation or at the table, including cream, butter, margarine, regular or low-fat cream cheese, oil, lard,
meat drippings, cocoa, and chocolate
Added sugars include:– all sugars used as ingredients in processed and prepared foods, such as breads, cakes, soft drinks, jam, and ice cream– sugars eaten separately or added to foods at the table
For this table set, sugars include white sugar, brown sugar, raw sugar, corn syrup, honey, and molasses. Excluded were naturallyoccurring sugars such as fructose from fruit and lactose from milk. For more details see Cook and Friday 2004.
References
CDC/NCHS. (2004). National Health and Nutrition Examination Surveys 2001-2002 and 1999-2000. [Online]. Hyattsville, MD:NCHS. Available at http://www.cdc.gov/nchs/nhanes.htm.
Cleveland LE, Cook DA, Krebs-Smith SM, and Friday J. (1997). Method for assessing food intakes in terms of servings based onfood guidance. Am J Clin Nutr. 65 (suppl):1254S-1263S.
Cook AJ and Friday JE. (2004). Pyramid Servings Database for USDA Survey Food Codes Version 2.0. [Online]. Beltsville, MD:USDA, Agricultural Research Service, Community Nutrition Research Group. Available at http://www.barc.usda.gov/bhnrc/cnrg.
Cronin FJ, Shaw AM, Krebs-Smith SM, Marsland PM, and Light L. (1987). Developing a food guidance system to implement thedietary guidelines. J Nutr Ed. 19:281-302.
Cronin FJ, Shaw AM, Krebs-Smith SM, Marsland PM, and Light L. (1985). Developing the food guidance system for “Better Eatingfor Better Health,” a nutrition course for adults. Hyattsville, MD: HNIS. Administrative Report No. 377.
31
Davis CA, Escobar A, Marcoe K, Tarone C, Shaw A, Saltos E, and Powell R. (1999). Food Guide Pyramid for Young Children 2-6Years Old: Technical Report on Background and Development. Washington, DC: CNPP. CNPP Program Aid 10.
FASEB/LSRO (Federation of American Societies for Experimental Biology, Life Science Research Office). 1995. Third report onnutrition monitoring in the United States, Vol. 1, pp. III-1 to III-10. Interagency Board for Nutrition Monitoring and RelatedResearch. U.S. Government Printing Office, Washington, D.C.
Krebs-Smith SM, Cook DA, Subar AF, Cleveland L, Friday J, and Kahle LL. (1996). Fruit and vegetable intakes of children and adolescents in the United States. Arch Pediatr Adolesc Med. 150: 81-86.
Krebs-Smith SM, Cook DA, Subar AF, Cleveland L, and Friday J. (1995). U.S. adults’ fruit and vegetable intakes, 1989 to 1991: Arevised baseline for the Healthy People 2000 objective. Am J Public Health 85(12):1623-1629. U.S. Congress. 1990. Public Law 101-445. National Nutrition Monitoring and Related Research Act of 1990.
USDA. (1993). Eat a variety of foods. Washington, DC: Government. Printing Office (out of print). USDA Home and GardenBulletin 253–2.
USDA. (1992, slightly revised 1996). The Food Guide Pyramid. [Online]. Washington, DC: CNPP. USDA Home and GardenBulletin 252. Available at http://www.cnpp.usda.gov/cnpp/pyramid.html.
USDA/ARS. (2004a). USDA Food and Nutrient Database for Dietary Studies, 1.0. [Online]. Beltsville, MD: FSRG. Available athttp://www.barc.usda.gov/bhnrc/foodsurvey.
USDA/ARS. (2004b). USDA Nutrient Database for Standard Reference, Release 16.1. [Online]. Beltsville, MD: Nutrient DataLaboratory. Available at http://www.nal.usda.gov/fnic/foodcomp.
USDA/ARS. (2000). Continuing Survey of Food Intakes by Individuals 1994-96, 1998 (CSFII). [CD-ROM]. Available for purchasefrom the National Technical Information Services (http://www.ntis.gov). NTIS Accession number PB2000-500027.

32
USDA/ARS. (1999.) USDA Nutrient Database for Standard Reference, Release 13. [Online]. Beltsville, MD: Nutrient DataLaboratory. Available at http://www.nal.usda.gov/fnic/foodcomp.
USDA/ARS. (1998). Continuing Survey of Food Intakes by Individuals (CSFII) and Diet and Health Knowledge Survey (DHKS),1994-1996. [CD-ROM]. Available for purchase from the National Technical Information Services (http://www.ntis.gov). NTISAccession number PB98500457.
USDA/ARS. (1997). Continuing Survey of Food Intakes by Individuals (CSFII), 1994: Pyramid Servings. [CD-ROM.]. Availablefor purchase from the National Technical Information Services (http://www.ntis.gov). NTIS Accession number PB97502058.
USDA/CNNP. (1999). Tips for Using the Food Guide Pyramid for Young Children 2 to 6 Years Old. Washington, DC: CNPP. CNPP Program Aid 1647.
USDA/HNIS. (1996). The Continuing Survey of Food Intakes by Individuals (CSFII) and the Diet and Health Knowledge Survey(DHKS) 1989-91. [CD-ROM.]. Available for purchase from the National Technical Information Services (http://www.ntis.gov). NTIS Accession number PB96501747.
USDA and HHS. (2000). Nutrition and Your Health: Dietary Guidelines for Americans, 5th ed. [Online]. Washington, DC: CNPP. Available at http://www.cnpp.usda.gov/dietary_guidelines.html.
Welsh SO, Davis C, and Shaw A. (1993). USDA's food guide: background and development. [Online]. Hyattsville, MD: HNIS. USDA Miscellaneous Publication No. 1514. Available at http://www.cnpp.usda.gov/Pubs/Pyramid/FoodGuideDevt.pdf.