pylon-based jet noise suppressorssupersonic.eng.uci.edu/download/aiaa-2008-0040.pdf · pylon based...
TRANSCRIPT
Pylon Based Jet Noise Suppressors
Dimitri Papamoschou* University of California, Irvine, Irvine, CA, 92697-3975
This investigation examined the potential of pylon-based, deployable flaps to reduce noise of separate-flow turbofan engines with bypass ratio 8. The main function of the flap deflectors is to thicken the low-speed region surrounding the core jet in the downward and sideline directions. The study encompassed acoustic measurements, noise source imaging, mean velocity surveys, and aerodynamic estimates. Three types of deflectors were tested: solid flaps, porous flaps made of coarse perforation, and porous flaps made of fine perforation. It is shown that all the deflectors reduce noise sources near the end of the primary potential core. However, the solid flaps create excess noise in the vicinity of their location that can overwhelm this noise benefit, particularly at large polar angles. Porous flaps significantly reduce velocity gradients that cause excess noise. Noise generation from the perforations themselves can be shifted to very high frequency (rapidly attenuated by atmospheric absorption) by reducing the size of the perforation. Accordingly, the fine-perforation flaps provided superior acoustic results yielding estimated EPNL benefits of 2.1 dB in the downward direction and 1.0 dB in the sideline direction. The static-thrust loss of these flaps is estimated at 0.7%.
Nomenclature A = Nozzle area c = Flap chord length Cp = Pressure coefficient Df = Fan nozzle exit diameter Dflap = Flap drag f = Frequency F = Thrust h = Flap height he = Fan nozzle exit height r = Radial coordinate x = Axial coordinate from exit of core nozzle y = Transverse coordinate on symmetry plane z = Transverse coordinate normal to symmetry plane u = Axial mean velocity Up = Primary (core) exit velocity Us = Secondary (fan) exit velocity α = Flap angle θ = Polar angle from jet axis ρs = Density of exit fan flow φ = Azimuth angle measured from downward vertical Ψ = Noise source distribution
* Professor, Department of Mechanical and Aerospace Engineering, 4200 Engineering Gateway, Irvine, CA 92697-3975, AIAA Associate Fellow.
American Institute of Aeronautics and Astronautics
1
46th AIAA Aerospace Sciences Meeting and Exhibit7 - 10 January 2008, Reno, Nevada
AIAA 2008-40
Copyright © 2008 by D. Papamoschou. Published by the American Institute of Aeronautics and Astronautics, Inc., with permission.
I. Introduction an flow deflection is a directional noise suppression method applicable to separate-flow
turbofan engines1,2. The deflectors thicken the low-speed flow underneath the core jet, resulting in lower noise emission towards the ground. One aspect of the noise suppression mechanism involves extending the “secondary core” of the jet, defined by the inflection points i2 and i3 of the radial velocity profile shown in Fig.1. Fisher et al.3 studied coaxial jets with normal velocity profile and suggested that, in the initial region where a secondary potential core exists, the primary shear layer (between the primary and secondary flows) makes a negligible contribution to sound emission. Papamoschou2 extended this concept to a secondary core defined by the outer inflection points of the radial velocity profile. The ability of the secondary flow to silence the primary shear layer is the foundation of noise-reduction concepts that extend the secondary core (via offset nozzles or deflectors) to cover a greater portion of the primary shear layer that emits downward noise. 1,2,4-6
F
Fig. 1 Principal features of mean velocity field in a coaxial jet vis a vis noise generation. SC= Secondary core defined by the inflection points i2 and i3 of the radial velocity profile. PC=primary core defined as the region where the velocity exceeds a certain threshold, typically 80% of the core exit velocity.
The present work extends previous concepts of wedge-shaped fan flow deflectors1,4,5,6 to wing-mounted turbofan engines incorporating a pylon. This type of engine installation is found in the majority of commercial jet aircraft. The mounting pylon becomes a natural place to attach a wedge or flap that directs the fan flow in the sideward and downward directions. The most practical implementation is thought to be that of a moveable flap, depicted in Fig.2, that deploys during takeoff and retracts for the remainder of the flight. The paper presents acoustic data, mean velocity distributions, and aerodynamic estimates for the basic configuration shown in Fig.2 and some variants. The nozzle has the flow lines of the NASA GRC 5BB nozzle with bypass ratio of 8.
a)
PYLON
CORE NOZZLE
FAN NOZZLE
FLAP
CORESTREAM
FANSTREAM
b)
PYLON
CORE NOZZLE
FAN NOZZLE
CORESTREAM
FAN STREAM
FLAP
Fig. 2 Basic concept of pylon-mounted jet noise suppressor. a) Side view; b) top view. The advent of non-axisymmetric nozzle concepts for jet nozzle suppression led to large-scale tests at
NASA GRC under the program entitled “Offset Stream Technologies.” Configurations included internal vanes and internal wedge deflectors5. The overall agreement with the UCI data on vanes was good. However, the GRC wedges suffered from excessive noise in the 90-deg polar direction which reduced significantly their EPNL benefit. The precise reasons for the excess noise remain under investigation. However, one can focus on two likely suspects: (a) high gradients in the core shear layer due to the lack of secondary flow in the wake of the wedge (Fig.3); (b) deflector self-noise, i.e., sound generation due to turbulence in the wake of the wedge. The generation of strong gradients, and resulting large values of the turbulent kinetic energy, in the vicinity of the wedge are evident in the experimental measurements of Ref. 6.
American Institute of Aeronautics and Astronautics
2

The present study will show that both noise sources can play a significant role in the acoustic performance of wedge-type deflectors. Importantly, these noise sources can be mitigated by proper design of the deflector. An additional consideration in the testing of offset-stream technology is the sensitivity of the base flow to the alignment of the nozzles. Small departures from concentricity can result in an asymmetric mean flow, in which case the baseline can be quieter or louder depending on the sense of the misalignment. Although it may not be possible to attain a perfectly axisymmetric flow field, the above effect on the evaluation on noise suppressors can be diminished by ensuring that the base nozzle is not disturbed when a suppressor is installed. This consideration led to a special design for the pylon discussed in Section II.B.
Fig.3 Streakline pattern on surface of nozzle
illustrating the “dead” region downstream of wedge
II. Experimental Setup
A. Nozzle The nozzle used is a 1/8th scale version of the BPR8 nozzle used at NASA GRC (“5BB” nozzle). The
UCI nozzle coordinates are shown Fig.4. The fan exit diameter was Df=31.2 mm, and the fan exit height was he=4 mm. Exit conditions are listed in Tables 1 and 2 for the acoustic tests and mean velocity surveys, respectively. The UCI facility uses helium-air mixtures to simulate a heated jet. Excellent agreement with the GRC spectra for the 5BB nozzle has been demonstrated 5. The exhaust velocities and Mach numbers for the acoustic tests are representative of those of a BPR=8 engine cycle at takeoff.
Table 1. Exhaust conditions for acoustic tests
(helium-air mixtures) Core Fan
Velocity (m/s) 390 300 Mach number 0.72 0.86
Table 2. Exhaust conditions for mean velocity tests (air only)
Core Fan Velocity (m/s) 285 217 Mach number 0.90 0.66
-30
-20
-10
0
10
20
30
-30 -20 -10 0 10 20 30 40x (mm)
r(m
m)
Fig. 4 Nozzle Coordinates
B. Pylon The pylon is also based on the GRC design used with the 5BB nozzle. A special feature of the UCI
pylon used in this study is the incorporation of slots along which one can slide inserts with various flap deflectors, as shown in Fig. 5. One pair of inserts was clean (without deflectors), thus forming the baseline pylon. This arrangement enabled the study of various deflectors without having to disassemble the nozzle or the pylon.
American Institute of Aeronautics and Astronautics
3

Fig. 5 Pylon design with slot inserts
C. Pylon Flaps The flap design used here had an angle α=22 deg (this correspond to the wedge half-angle of previous
investigations), length of 10 mm (2.5he) and height of 5 mm (1.25he). The flap material reflected the desire to allow some secondary flow over the top of the core jet to prevent creation of strong velocity gradients. Two types of perforations, coarse and fine, were tried, as listed in Table 3. Both types of perforated flaps had roughly the same open area (~50%). Solid flaps were created by attaching transparent adhesive tape of 0.05-mm thickness over the perforated sheet. Figure 6 and 7 show the two types of perforated flaps used. The perforation designs were restricted by materials that were readily available commercially. Future research will use custom-made perforations with designs influenced by the findings of this investigation.
Table 3. Flap Construction
Designation Material Porosity Hole size Hole spacing Hole pattern Solid Perforated Sheet + Tape 0.00 - - - Coarse perforation Perforated Sheet 0.45 0.97 mm 1.27 mm Straight Fine perforation Woven Mesh 0.49 0.48×0.27 mm 0.63×0.42 mm Straight
Fig. 6 Coarse-perforation pylon flaps.
American Institute of Aeronautics and Astronautics
4

Fig. 7 Fine-perforation pylon flaps
D. Noise Measurement and Imaging of Noise Sources The nozzle was attached to the dual-stream apparatus shown in Fig. 8a and cold mixtures of helium
and air are supplied to the primary (core) and secondary (bypass) nozzles. The exit flow conditions, listed in Table 1, matched the typical exit conditions of a turbofan engine with bypass ratio 8.0 at takeoff power. The Reynolds number of the jet, based on fan diameter, was 0.68 × 10⁶.
Noise measurements were performed in the aeroacoustic facility shown in Fig. 8b. The microphone array consists of eight 3.2-mm condenser microphones (Bruel & Kjaer, Model 4138) arranged on a circular arc centered at the vicinity of the nozzle exit. The polar aperture of the array is 30o and the array radius is 1 m. The angular spacing of the microphones is logarithmic. The entire array structure is rotated around its center to place the array at the desired polar angle. Positioning of the array is done remotely using a stepper motor. An electronic inclinometer displays the position of first microphone. The arrangement of the microphones inside the anechoic chamber, and the principal electronic components, are shown in Fig. 3c. The microphones were connected, in groups of four, to two amplifier/signal conditioners (Bruel & Kjaer, Model 4138) with high-pass filter set at 300 Hz and low-pass filter set at 100 kHz. The four-channel output of each amplifier was sampled at 250 kHz per channel by a multi-function data acquisition board (National Instruments PCI-6070E). Two such boards, one for each amplifier, were installed in a Pentium 4 personal computer. National Instruments LabView software was used to acquire the signals. Even though the array provides noise source location maps, in this study it was used only to survey the far-field sound emitted by the jets. The sound pressure level spectrum was corrected for actuator response, free-field correction, and atmospheric absorption. The overall sound pressure level (OASPL) was obtained by integrating the corrected spectrum. Spectra and OASPL are referenced to a distance of 1.25 Df from the nozzle exit.
The calculation of Perceived Noise Level (PNL) and Effective Perceived Noise Level (EPNL) is based on the following: flyover altitude of 1500 ft; engine angle of attack of 10 deg; engine thrust level of 25,000 lb. Details of the PNL and EPNL calculation procedure can be found in Ref. 1.
Imaging of the noise sources used the basic method described in Papamoschou and Dadvar7, with refinements (to be presented in later publications) that enable a self-consistent representation of the noise source strength. This means that axial integration of the noise source distribution gives the pressure autospectrum at a given polar angle. The source images were deconvolved using the Richardson-Lucy inversion method7. Source image maps are presented in a differential form that shows the changes from the baseline.
American Institute of Aeronautics and Astronautics
5
a)
Two Nexus 2690-A-OS4Conditioning Amplifiers
8 BK-4138Microphones
PC with two PCI-6070E 1.2 MS/sDAQ boards
Compressed air and helium mixtures
Anechoic chamber 1.9 x 2.2 x 2.2 m
Two SCB-68Blocks
Jet nozzle
Circular arc path
Two Nexus 2690-A-OS4Conditioning Amplifiers
8 BK-4138Microphones
PC with two PCI-6070E 1.2 MS/sDAQ boards
Compressed air and helium mixtures
Anechoic chamber 1.9 x 2.2 x 2.2 m
Two SCB-68Blocks
Jet nozzle
Circular arc path
8 BK-4138Microphones
PC with two PCI-6070E 1.2 MS/sDAQ boards
Compressed air and helium mixtures
Anechoic chamber 1.9 x 2.2 x 2.2 m
Two SCB-68Blocks
Jet nozzle
Circular arc path
b)
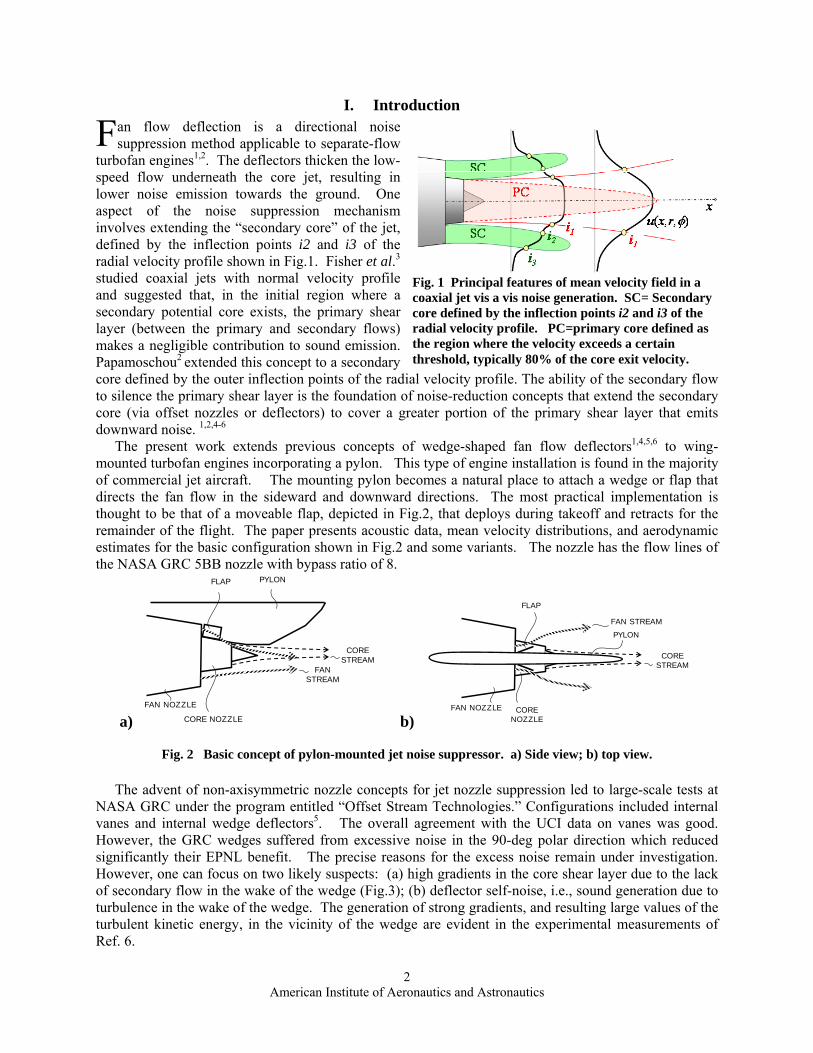
Fig. 8 a) Flow facility; b) aeroacoustic measurement.
E. Mean Velocity Measurement For the mean velocity measurements, the nozzles were attached to a duplicate of the dual-stream
apparatus shown in Fig. 8a. Compressed air was supplied to both the primary (core) and secondary (bypass) nozzles at room temperature. The Reynolds number of the jet, based on fan diameter, was 0.54 × 10⁶. The exit conditions are listed inTable 2. Even though the velocities were lower than those of a realistic turbofan exhaust (used in the acoustic tests), the velocity ratio of 0.77 matched the velocity ratio in the acoustics tests.
The mean flow conditions of the jet plume were measured using a Pitot rake system, shown in Figure 9. The rake consists of five 1 mm internal diameter probes attached to a motorized three dimensional traverse system. The 70 mm long probes are spaced vertically 10 mm apart using a streamlined mounting plate. Each pitot probe is connected individually to a Setra Model 207 pressure transducer. The pressure was sampled at a rate of 1000 Hz by an analog to digital data acquisition board (National Instruments PCI-MIO-16E). Mach number and velocity were computed from the Pitot measurements under the assumptions of constant static pressure (equal to ambient pressure) and constant total temperature (equal to room temperature). Smoothing of the velocity profiles and computation of the velocity gradients was performed using a Savitzky-Golay filter.
x
y
z x
y
z1.0 mm ID
10 mm
Fig.9 Schematic of Pitot rake system
American Institute of Aeronautics and Astronautics
6

III. Acoustic Results This section presents two types of acoustic results: Single-microphone acoustics, which means data
that did not involve correlations between the array microphones; and noise-source maps that were derived from cross-correlating the microphone signals.
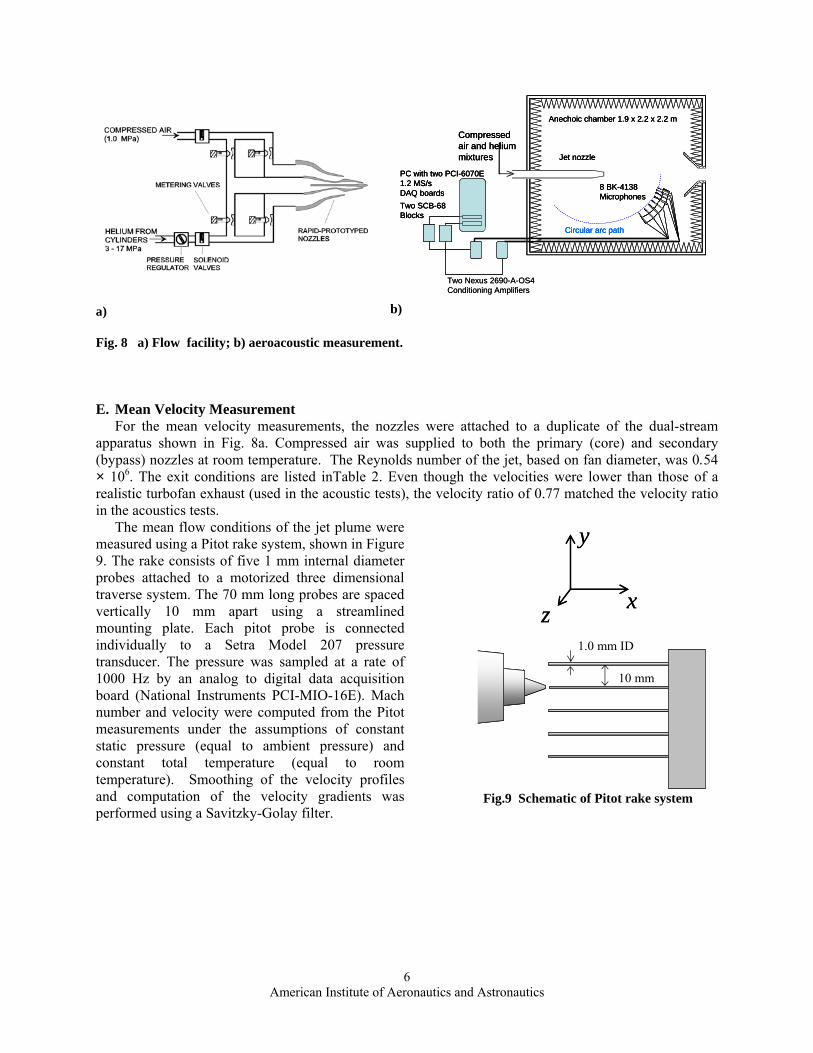
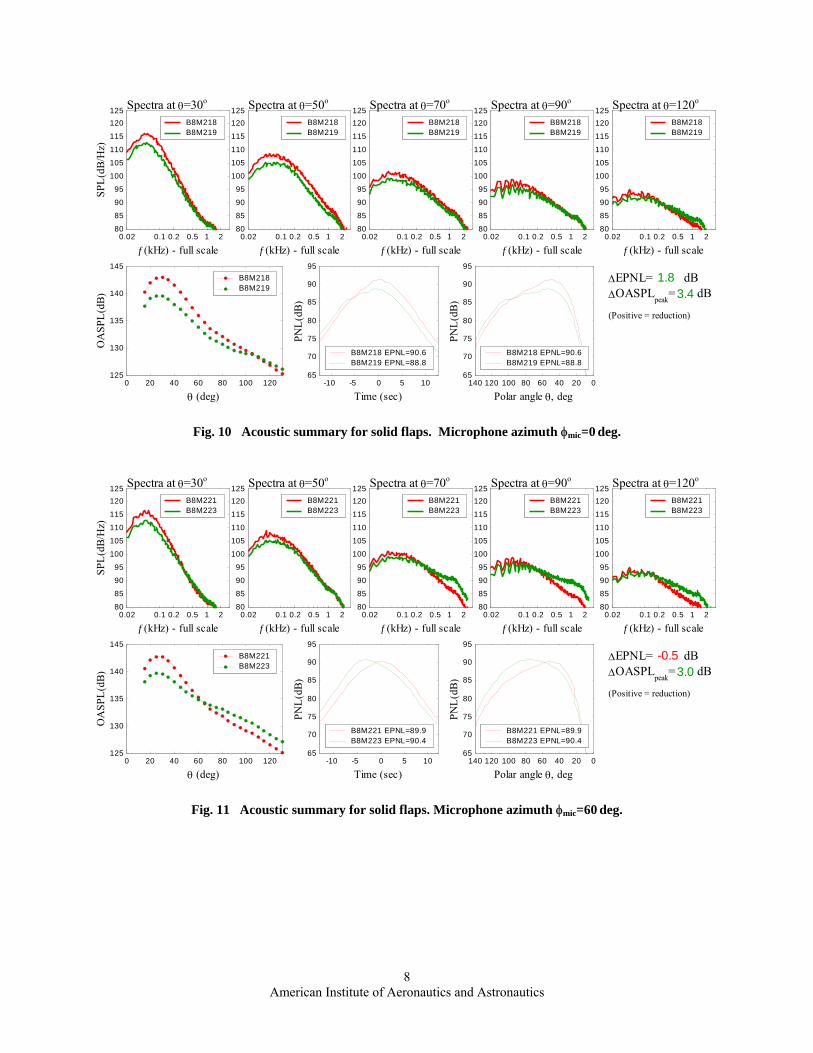
A. Single Microphone Acoustics For each pylon flap configuration we present first an “acoustic summary” comprising the following
quantities: narrowband lossless spectra, scaled to full-scale frequency (scale factor of 50), at selected polar angles; directivity of OASPL; PNL versus time; PNL versus polar angle; and estimate of EPNL reduction. These quantities are compared against the respective baseline values (red curves). We begin with the acoustic summary for the solid flaps, shown in Figs. 10 and 11 for φmic=0 deg (downward) and 60 deg (sideline), respectively. For φmic =0 deg there is acoustic benefit up to θ=100 deg, above which the spectrum shows a cross-over at high frequency. There is significant EPNL reduction of 1.8 dB. However, for φmic =60 deg the cross-over occurs much earlier, at θ=70 deg, and the increase in high-frequency sound is very pronounced. This negates the benefits at low polar angles and, as a result, there is an EPNL excess of 0.5 dB. The spectral increases at large polar angles and high frequency are reminiscent of those seen in the Offset Stream Technology tests with internal wedges5. As will be shown below, the excess sound is most likely due to the strong shear that develops on the top of the core jet as well as velocity gradients caused by the deflector itself. The reason why the 60-deg azimuth is more sensitive to these phenomena may have to do with the “line of sight” of the measurement. Assuming that the high-gradient region is fairly confined to near the top of the jet, the observer at φmic=0 “sees” this region only through refraction by the jet flow. However, the observer at φmic =60 has direct line of sight. On the other hand, if the high-gradient region spreads significantly it will affect observations at all azimuth angles.
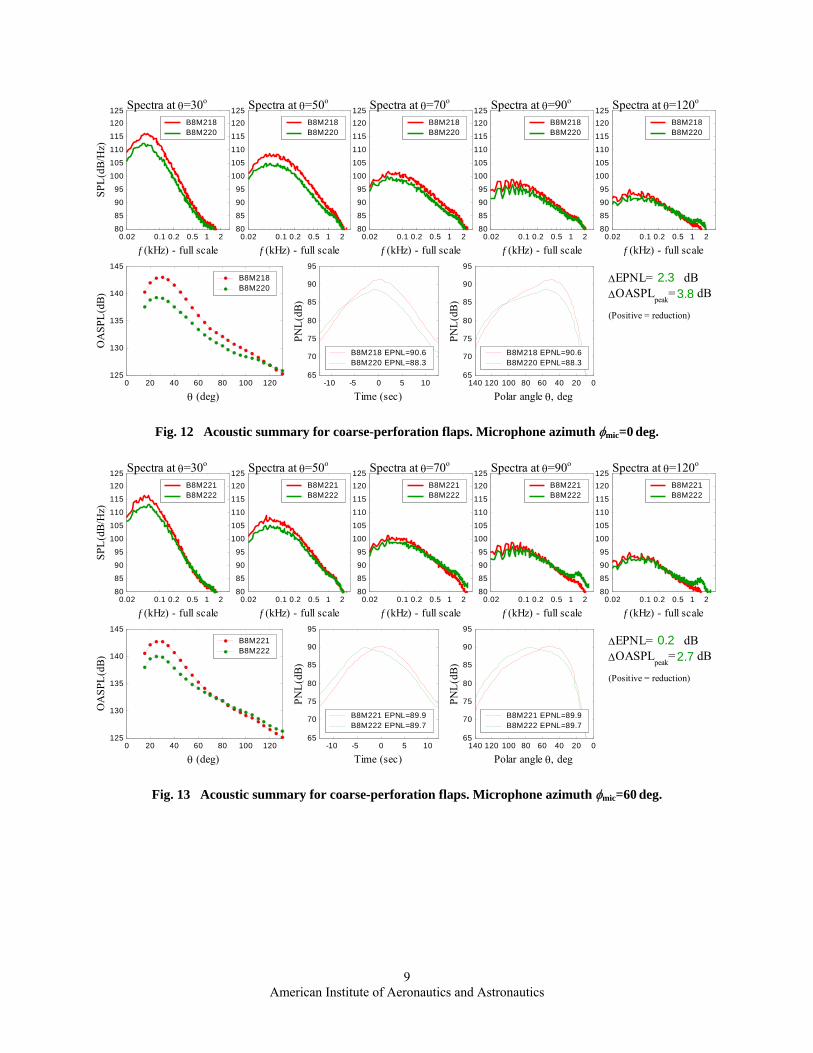
The acoustics of the coarse-perforation flaps as shown in Figs. 12 and 13 for φmic=0 deg and 60 deg, respectively. Interestingly, the reductions in peak OASPL are roughly the same as those for the solid flaps, even though the perforated flaps have a porosity of 45%. Importantly, the adverse effects of the solid flaps are mitigated significantly. The spectral increases at large polar angle and high frequency are significantly reduced. As a result, the EPNL benefit at φmic=0 deg increases to 2.3 dB. However, a new problem arises: the spectra at high polar angles show a narrowband increase at full-scale frequency of 1.5 kHz. This is particularly strong at φmic =60 deg and practically eliminates the sideline EPNL benefit. It will be shown that this spectral “spike” is connected to the acoustics of the perforation. Section IV.C discusses the possible physics of this sound generation.
Replacing the coarse perforation with a fine perforation of roughly equal porosity eliminates the problem of deflector self-noise and prevents the creation of strong gradients. It is evident from Figs. 14 and 15 that the fine-perforation flaps provided superior acoustics results and a “cumulative” EPNL reduction of 3.1 dB, versus 1.5 dB for the solid flaps and 2.5 dB for the coarse-perforation flaps. There is obviously a lot of room for optimization of deflector and perforation design. The present experiment was confined to commercially available meshes and perforations.
The impact of the flap deflectors on noise at θ=100 deg is further illustrated in the spectral plots of Fig. 16. The figure underscores the dramatic effects that small details in the deflector design can have on the acoustic field. The solid flaps create a region of high gradient (and therefore strong TKE production) that causes a broadband increase of the spectrum. The coarse-perforation flaps allowed some air over the top of the jet and thus prevented the broadband spectral increase, but introduced their own spectral spike. The fine-perforation flaps prevented both effects. Another important realization is that these adverse effects are accentuated when the troublesome source is in the line of sight of the observer.
American Institute of Aeronautics and Astronautics
7
0.02 0.1 0.2 0.5 1 280
85
90
95
100
105
110
115
120125
SPL(
dB/H
z)
f (kHz) - full scale
Spectra at θ=30o
B8M218B8M219
0.02 0.1 0.2 0.5 1 280
85
90
95
100
105
110
115
120125
f (kHz) - full scale
Spectra at θ=50o
B8M218B8M219
0.02 0.1 0.2 0.5 1 280
85
90
95
100
105
110
115
120125
f (kHz) - full scale
Spectra at θ=70o
B8M218B8M219
0.02 0.1 0.2 0.5 1 280
85
90
95
100
105
110
115
120125
f (kHz) - full scale
Spectra at θ=90o
B8M218B8M219
0.02 0.1 0.2 0.5 1 280
85
90
95
100
105
110
115
120125
f (kHz) - full scale
Spectra at θ=120o
B8M218B8M219
0 20 40 60 80 100 120125
130
135
140
145
OA
SPL(
dB)
θ (deg)
B8M218B8M219
-10 -5 0 5 1065
70
75
80
85
90
95
PNL(
dB)
Time (sec)
B8M218 EPNL=90.6B8M219 EPNL=88.8
02040608010012014065
70
75
80
85
90
95
PNL(
dB)
Polar angle θ, deg
∆EPNL= dB1.8∆OASPL
peak= dB3.4
(Positive = reduction)
B8M218 EPNL=90.6B8M219 EPNL=88.8
Fig. 10 Acoustic summary for solid flaps. Microphone azimuth φmic=0 deg.
0.02 0.1 0.2 0.5 1 280
85
90
95
100
105
110
115
120125
SPL(
dB/H
z)
f (kHz) - full scale
Spectra at θ=30o
B8M221B8M223
0.02 0.1 0.2 0.5 1 280
85
90
95
100
105
110
115
120125
f (kHz) - full scale
Spectra at θ=50o
B8M221B8M223
0.02 0.1 0.2 0.5 1 280
85
90
95
100
105
110
115
120125
f (kHz) - full scale
Spectra at θ=70o
B8M221B8M223
0.02 0.1 0.2 0.5 1 280
85
90
95
100
105
110
115
120125
f (kHz) - full scale
Spectra at θ=90o
B8M221B8M223
0.02 0.1 0.2 0.5 1 280
85
90
95
100
105
110
115
120125
f (kHz) - full scale
Spectra at θ=120o
B8M221B8M223
0 20 40 60 80 100 120125
130
135
140
145
OA
SPL(
dB)
θ (deg)
B8M221B8M223
-10 -5 0 5 1065
70
75
80
85
90
95
PNL(
dB)
Time (sec)
B8M221 EPNL=89.9B8M223 EPNL=90.4
02040608010012014065
70
75
80
85
90
95
PNL(
dB)
Polar angle θ, deg
∆EPNL= dB-0.5∆OASPL
peak= dB3.0
(Positive = reduction)
B8M221 EPNL=89.9B8M223 EPNL=90.4
Fig. 11 Acoustic summary for solid flaps. Microphone azimuth φmic=60 deg.
American Institute of Aeronautics and Astronautics
8
0.02 0.1 0.2 0.5 1 280
85
90
95
100
105
110
115
120125
SPL(
dB/H
z)
f (kHz) - full scale
Spectra at θ=30o
B8M218B8M220
0.02 0.1 0.2 0.5 1 280
85
90
95
100
105
110
115
120125
f (kHz) - full scale
Spectra at θ=50o
B8M218B8M220
0.02 0.1 0.2 0.5 1 280
85
90
95
100
105
110
115
120125
f (kHz) - full scale
Spectra at θ=70o
B8M218B8M220
0.02 0.1 0.2 0.5 1 280
85
90
95
100
105
110
115
120125
f (kHz) - full scale
Spectra at θ=90o
B8M218B8M220
0.02 0.1 0.2 0.5 1 280
85
90
95
100
105
110
115
120125
f (kHz) - full scale
Spectra at θ=120o
B8M218B8M220
0 20 40 60 80 100 120125
130
135
140
145
OA
SPL(
dB)
θ (deg)
B8M218B8M220
-10 -5 0 5 1065
70
75
80
85
90
95
PNL(
dB)
Time (sec)
B8M218 EPNL=90.6B8M220 EPNL=88.3
02040608010012014065
70
75
80
85
90
95
PNL(
dB)
Polar angle θ, deg
∆EPNL= dB2.3∆OASPL
peak= dB3.8
(Positive = reduction)
B8M218 EPNL=90.6B8M220 EPNL=88.3
Fig. 12 Acoustic summary for coarse-perforation flaps. Microphone azimuth φmic=0 deg.
0.02 0.1 0.2 0.5 1 280
85
90
95
100
105
110
115
120125
SPL(
dB/H
z)
f (kHz) - full scale
Spectra at θ=30o
B8M221B8M222
0.02 0.1 0.2 0.5 1 280
85
90
95
100
105
110
115
120125
f (kHz) - full scale
Spectra at θ=50o
B8M221B8M222
0.02 0.1 0.2 0.5 1 280
85
90
95
100
105
110
115
120125
f (kHz) - full scale
Spectra at θ=70o
B8M221B8M222
0.02 0.1 0.2 0.5 1 280
85
90
95
100
105
110
115
120125
f (kHz) - full scale
Spectra at θ=90o
B8M221B8M222
0.02 0.1 0.2 0.5 1 280
85
90
95
100
105
110
115
120125
f (kHz) - full scale
Spectra at θ=120o
B8M221B8M222
0 20 40 60 80 100 120125
130
135
140
145
OA
SPL(
dB)
θ (deg)
B8M221B8M222
-10 -5 0 5 1065
70
75
80
85
90
95
PNL(
dB)
Time (sec)
B8M221 EPNL=89.9B8M222 EPNL=89.7
02040608010012014065
70
75
80
85
90
95
PNL(
dB)
Polar angle θ, deg
∆EPNL= dB0.2∆OASPL
peak= dB2.7
(Positive = reduction)
B8M221 EPNL=89.9B8M222 EPNL=89.7
Fig. 13 Acoustic summary for coarse-perforation flaps. Microphone azimuth φmic=60 deg.
American Institute of Aeronautics and Astronautics
9

0.02 0.1 0.2 0.5 1 280
85
90
95
100
105
110
115
120125
SPL(
dB/H
z)
f (kHz) - full scale
Spectra at θ=30o
B8M231B8M232
0.02 0.1 0.2 0.5 1 280
85
90
95
100
105
110
115
120125
f (kHz) - full scale
Spectra at θ=50o
B8M231B8M232
0.02 0.1 0.2 0.5 1 280
85
90
95
100
105
110
115
120125
f (kHz) - full scale
Spectra at θ=70o
B8M231B8M232
0.02 0.1 0.2 0.5 1 280
85
90
95
100
105
110
115
120125
f (kHz) - full scale
Spectra at θ=90o
B8M231B8M232
0.02 0.1 0.2 0.5 1 280
85
90
95
100
105
110
115
120125
f (kHz) - full scale
Spectra at θ=120o
B8M231B8M232
0 20 40 60 80 100 120125
130
135
140
145
OA
SPL(
dB)
θ (deg)
B8M231B8M232
-10 -5 0 5 1065
70
75
80
85
90
95
PNL(
dB)
Time (sec)
B8M231 EPNL=90.4B8M232 EPNL=88.3
02040608010012014065
70
75
80
85
90
95
PNL(
dB)
Polar angle θ, deg
∆EPNL= dB2.1∆OASPL
peak= dB3.7
(Positive = reduction)
B8M231 EPNL=90.4B8M232 EPNL=88.3
Fig. 14 Acoustic summary for fine perforation flaps. Microphone azimuth φmic=0 deg.
0.02 0.1 0.2 0.5 1 280
85
90
95
100
105
110
115
120125
SPL(
dB/H
z)
f (kHz) - full scale
Spectra at θ=30o
B8M230B8M229
0.02 0.1 0.2 0.5 1 280
85
90
95
100
105
110
115
120125
f (kHz) - full scale
Spectra at θ=50o
B8M230B8M229
0.02 0.1 0.2 0.5 1 280
85
90
95
100
105
110
115
120125
f (kHz) - full scale
Spectra at θ=70o
B8M230B8M229
0.02 0.1 0.2 0.5 1 280
85
90
95
100
105
110
115
120125
f (kHz) - full scale
Spectra at θ=90o
B8M230B8M229
0.02 0.1 0.2 0.5 1 280
85
90
95
100
105
110
115
120125
f (kHz) - full scale
Spectra at θ=120o
B8M230B8M229
0 20 40 60 80 100 120125
130
135
140
145
OA
SPL(
dB)
θ (deg)
B8M230B8M229
-10 -5 0 5 1065
70
75
80
85
90
95
PNL(
dB)
Time (sec)
B8M230 EPNL=90.0B8M229 EPNL=89.0
02040608010012014065
70
75
80
85
90
95
PNL(
dB)
Polar angle θ, deg
∆EPNL= dB1.0∆OASPL
peak= dB2.8
(Positive = reduction)
B8M230 EPNL=90.0B8M229 EPNL=89.0
Fig. 15 Acoustic summary for fine perforation flaps. Microphone azimuth φmic=60 deg.
American Institute of Aeronautics and Astronautics
10

a) b)
0.05 0.1 0.2 0.5 1 280
82
84
86
88
90
92
94
96
98SP
L (d
B/H
z)
Full-scale frequency (kHz)
BaseSolid flapsCoarse-perforation flapsFine-perforation flaps
0.05 0.1 0.2 0.5 1 280
82
84
86
88
90
92
94
96
98
SPL
(dB
/Hz)
Full-scale frequency (kHz)
BaseSolid flapsCoarse-perforation flapsFine-perforation flaps
Fig. 16 Spectra at θ=100 deg for baseline and various pylon flaps. a) φmic=0 deg; b) φmic=60 deg.
B. Noise Source Maps Cross-correlations of the microphone signals enabled the determination of an axial noise source
distribution Ψ(θ,x,f). The source imaging procedure developed at UCI allows Ψ(θ,x,f) to be self-consistent, that is, its axial integration (weighted by the distance factor) gives the autospectrum S(θ, f) for each polar angle surveyed:
∫ Ψ=L
dxfxxl
fS ),,()(
1),( 2 θθ
where l(x) is the distance of the observer from source and L denotes the axial extent of the noise source region. In this paper we focus on the changes in the noise source distribution Ψ caused by the various pylon deflector and accordingly define the parameter
)(),,(),,(100Reduction Source NoisePercent
maxbase,
base
θθθ
ΨΨ−Ψ
=fxfx
where the normalization is done by the global maximum of the baseline noise source distribution for each polar angle. It is not appropriate to present this type of noise reduction in decibels, hence the presentation is done in a linear scale. This causes the dynamic range of the maps to be somewhat limited. Negative values of the above parameter indicate noise increase. Figures 17 and 18 show contours of the differential noise source maps for the sideline direction (φ=60 deg) and for polar angles of 45 deg and 100 deg, respectively. At θ=45 deg, all deflectors act similarly to decrease noise in the low- to mid-frequency range. The maximum reduction is centered at x/Df=4 to 6, which as we will see later corresponds to the end of the primary potential core. We note that the solid flaps create a slight excess noise source at Strouhal number Sr ≈1 and x/Df ≈0. We will see that this excess noise, although small at θ=45 deg, dominates at large polar angles. At θ=100 deg, Fig. 18, the solid flaps create comparatively very strong excess noise near the nozzle exit, which overwhelms the noise benefit that occurs near the end of the potential core. The excess noise is reduced significantly by the perforated flaps. The coarse-perforation flaps, however, create a small noise increase at Sr ≈8 and x/Df ≈0. This corresponds to the spectral spike of Fig. 16b and is believed to
American Institute of Aeronautics and Astronautics
11

be caused by the “jetlets” emerging from the circular perforations, to be discussed in Section IV.C. The fine-perforation flaps give the least amount of excess noise. Figure 18 captures some important acoustical aspects of the pylon-flap deflectors. All of them did their intended job of reducing noise emitted near the end of the potential core. However, the solid flaps created excess noise that overwhelmed the noise benefit at large polar angles. The excess noise is believed to be associated with the increased shear at the top of the jet. As a result, the sound pressure level spectrum increased, as shown in Fig. 16b. The perforated flaps significantly mitigated this undesirable phenomenon.
a)
-40
-30
-20
-10
0
10
20
30
40
50
-2 0 2 4 6 8 10 120.1
0.2
0.30.40.5
1
2
345
10
Sr
= fD
f / U
s
x/Df
b)
-40
-30
-20
-10
0
10
20
30
40
50
-2 0 2 4 6 8 10 120.1
0.2
0.30.40.5
1
2
345
10
Sr
= fD
f / U
s
x/Df
c)
-40
-30
-20
-10
0
10
20
30
40
50
-2 0 2 4 6 8 10 120.1
0.2
0.30.40.5
1
2
345
10
Sr
= fD
f / U
s
x/Df
Fig. 17 Percent noise source reduction maps for θ=45 deg and φ=60 deg. a) Solid flaps; b) coarse-perforation flaps; c) fine-perforation flaps.
a)
-70
-60
-50
-40
-30
-20
-10
0
10
20
30
40
-2 0 2 4 6 8 10 120.1
0.2
0.30.40.5
1
2
345
10
Sr
= fD
f / U
s
x/Df
b)
-70
-60
-50
-40
-30
-20
-10
0
10
20
30
40
-2 0 2 4 6 8 10 120.1
0.2
0.30.40.5
1
2
345
10
Sr
= fD
f / U
s
x/Df
c)
-70
-60
-50
-40
-30
-20
-10
0
10
20
30
-2 0 2 4 6 8 10 120.1
0.2
0.30.40.5
1
2
345
10
Sr
= fD
f / U
s
x/Df
Fig. 18 Percent noise source reduction maps for θ=100 deg and φ=60 deg. a) Solid flaps; b) coarse-perforation flaps; c) fine-perforation flaps.
American Institute of Aeronautics and Astronautics
12
IV. Aerodynamics We now discuss aerodynamics aspects of the deflector flaps as they impact thrust loss and sound
generation.
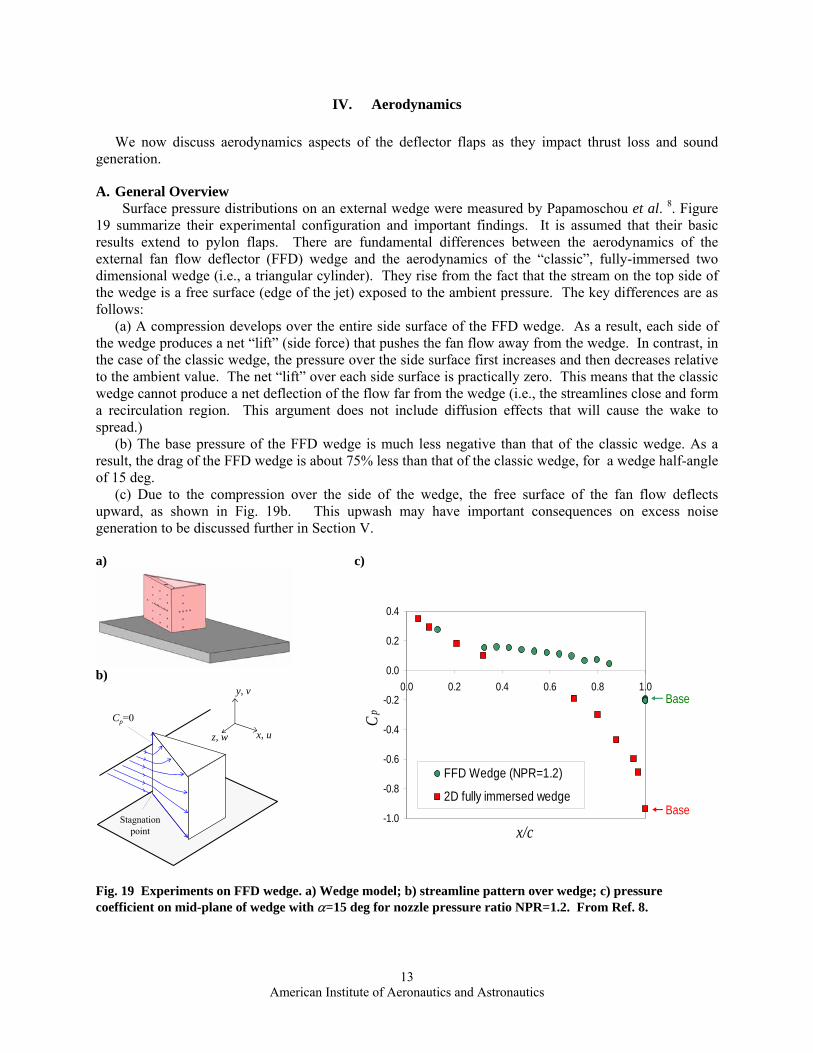
A. General Overview Surface pressure distributions on an external wedge were measured by Papamoschou et al. 8. Figure
19 summarize their experimental configuration and important findings. It is assumed that their basic results extend to pylon flaps. There are fundamental differences between the aerodynamics of the external fan flow deflector (FFD) wedge and the aerodynamics of the “classic”, fully-immersed two dimensional wedge (i.e., a triangular cylinder). They rise from the fact that the stream on the top side of the wedge is a free surface (edge of the jet) exposed to the ambient pressure. The key differences are as follows:
(a) A compression develops over the entire side surface of the FFD wedge. As a result, each side of the wedge produces a net “lift” (side force) that pushes the fan flow away from the wedge. In contrast, in the case of the classic wedge, the pressure over the side surface first increases and then decreases relative to the ambient value. The net “lift” over each side surface is practically zero. This means that the classic wedge cannot produce a net deflection of the flow far from the wedge (i.e., the streamlines close and form a recirculation region. This argument does not include diffusion effects that will cause the wake to spread.)
(b) The base pressure of the FFD wedge is much less negative than that of the classic wedge. As a result, the drag of the FFD wedge is about 75% less than that of the classic wedge, for a wedge half-angle of 15 deg.
(c) Due to the compression over the side of the wedge, the free surface of the fan flow deflects upward, as shown in Fig. 19b. This upwash may have important consequences on excess noise generation to be discussed further in Section V.
a)
b)
Cp=0
Stagnation point
y, v
x, uz, w
c)
-1.0
-0.8
-0.6
-0.4
-0.2
0.0
0.2
0.4
0.0 0.2 0.4 0.6 0.8 1.0
x/c
Cp
FFD Wedge (NPR=1.2)
2D fully immersed wedgeBase
Base
Fig. 19 Experiments on FFD wedge. a) Wedge model; b) streamline pattern over wedge; c) pressure coefficient on mid-plane of wedge with α=15 deg for nozzle pressure ratio NPR=1.2. From Ref. 8.
American Institute of Aeronautics and Astronautics
13
The dramatic differences in the pressure field are illustrated by the pressure coefficient plots of Fig. 19c. For the classic wedge, the pressure coefficient on the side surface is positive near the apex but becomes negative near the base. The base pressure coefficient is CPb=-0.95. For the FFD wedge, the side surface develops a uniformly positive CP with average value of about 0.15, and the base pressure coefficient is is CPb=-0.20. These results are fairly insensitive to the jet Mach number.
To estimate the effect of perforations on drag created by the flaps, we use the results of Castro9 who studied the wake characteristics of two-dimensional perforated plates normal to an air stream. Although Castro’s geometry and flow field is different from ours, it is assumed that the relative reduction in drag due to porosity applies to the FFD perforated flaps. According to Castro’s data, increasing the porosity from 0% to 50% reduces the drag by roughly 50%.
B. Drag Estimate In the aerodynamics experiments of Papamoschou et al.8 each half of the wedge was treated like an
airfoil producing lift (side force) and drag. The sectional lift and drag coefficients were based on the “chord length” c of the wedge. Assuming that their finding also extend to flaps, the drag of a pair of flaps is
hcUCD ssDflap 212 2ρ=
The static thrust of the secondary (fan) stream is s
2 AUF sss ρ= thus,
sD
s
flap
AhcC
FD
=
For the dimensions of the 5BB nozzle and current flaps,
0.12 Ds
flap CF
D=
According to Ref. 8, for a wedge with half angle α=15 deg, the drag coefficient at NPR=1.6 is 0.063. Here we assume that CD scales with α2, so for α=22 deg we get CD=0.135 for the solid flaps. For the perforated flaps, with porosity of 50%, the drag coefficient is expected to drop by 50% to CD=0.067. The thrust loss of the fan stream therefore is 1.6% with the solid flaps and 0.8% for the perforated flaps. Considering that the fan stream delivers 86% of the total thrust, the thrust loss for the entire engine is 1.4% for the solid flaps and 0.7% for the perforated flaps. It is emphasized again that the flaps would be retractable so this penalty would occur only for the takeoff portion of the flight.
C. Sound Generation In an effort to understand the spectral increase caused by the coarse perforation (Fig. 16b), it is
assumed that the self-noise of the perforated flap is primarily due to the “jetlets” emerging from the perforations. A similar argument can be found in the study of perforated drag plates by Sakaliyski et al.10. The velocity of each jetlet depends on the pressure difference between the front and back sides of the flap. It is easy to show that the jetlet velocity is given by
PbPfsj CCUu −=
Now we assume that the pressure coefficient on the front side of the flap scales linearly with flap angle α. Scaling the result of Fig. 19c to α=22o we obtain CPf =0.2. It will be shown in the next section that the base pressure coefficient of the perforated flap is practically zero. For CPf=0.2, CPb=0, and Us=300 m/s we obtain uj=140 m/s. In terms of lab-scale frequency, the coarse perforation caused a spectral peak at f=75 kHz. The corresponding Strouhal number for hole size dj=0.96 mm is
American Institute of Aeronautics and Astronautics
14
5.0==j
j
ufd
Sr
which is near the peak value for noise from fine-scale turbulence emitted by turbulent jets. Assuming that this relation holds for the fine (woven-mesh) perforation, the fine-perforation flaps produced noise at full-scale frequencies ranging from 3.1 kHz to 7.8 kHz, depending on whether on uses the long or short side of the perforation (these frequencies were not resolved in this experiment). For a full-scale application, a perforation of 10-mm diameter circular holes is expected to generate sound at 7.0 kHz which gets attenuated very quickly by atmospheric absorption.
V. Mean Velocity Field
A. Near-field profiles The presence of the pylon (see Fig.5) prevented full 3D
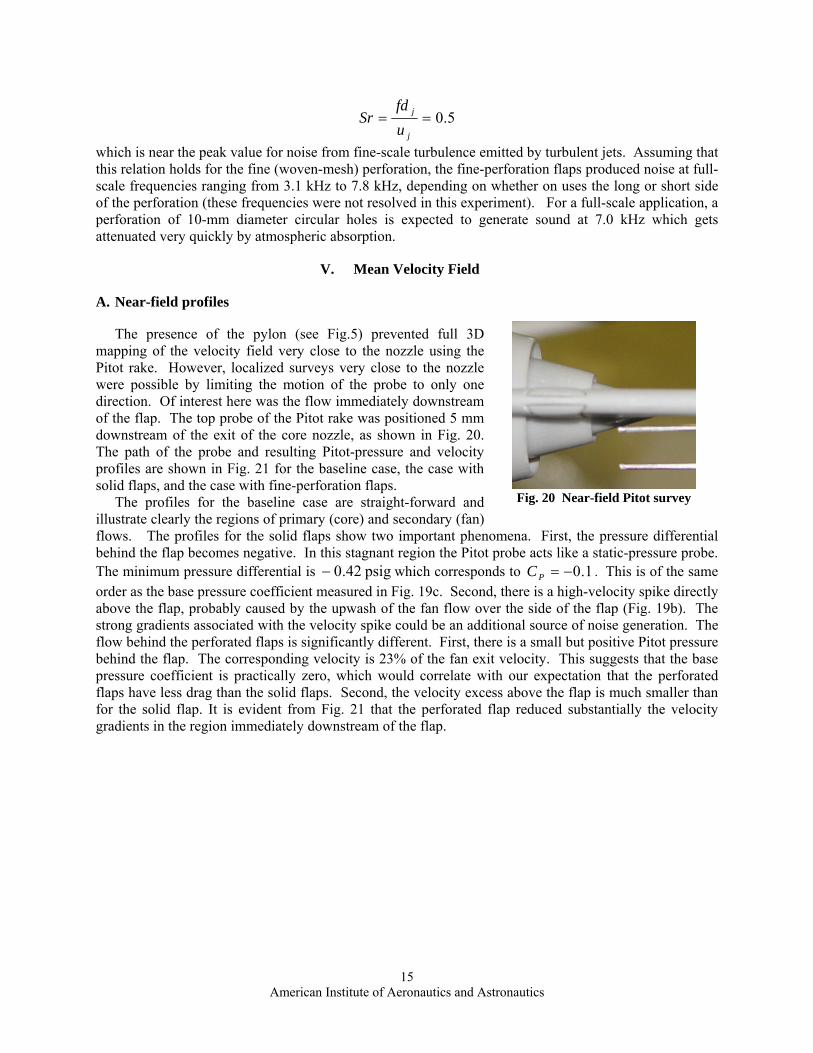
mapping of the velocity field very close to the nozzle using the Pitot rake. However, localized surveys very close to the nozzle were possible by limiting the motion of the probe to only one direction. Of interest here was the flow immediately downstream of the flap. The top probe of the Pitot rake was positioned 5 mm downstream of the exit of the core nozzle, as shown in Fig. 20. The path of the probe and resulting Pitot-pressure and velocity profiles are shown in Fig. 21 for the baseline case, the case with solid flaps, and the case with fine-perforation flaps.
The profiles for the baseline case are straight-forward and illustrate clearly the regions of primary (core) and secondary (fan) flows. The profiles for the solid flaps show two important phenomena. First, the pressure differential behind the flap becomes negative. In this stagnant region the Pitot probe acts like a static-pressure probe. The minimum pressure differential is which corresponds to psig 42.0− 1.0−=PC . This is of the same order as the base pressure coefficient measured in Fig. 19c. Second, there is a high-velocity spike directly above the flap, probably caused by the upwash of the fan flow over the side of the flap (Fig. 19b). The strong gradients associated with the velocity spike could be an additional source of noise generation. The flow behind the perforated flaps is significantly different. First, there is a small but positive Pitot pressure behind the flap. The corresponding velocity is 23% of the fan exit velocity. This suggests that the base pressure coefficient is practically zero, which would correlate with our expectation that the perforated flaps have less drag than the solid flaps. Second, the velocity excess above the flap is much smaller than for the solid flap. It is evident from Fig. 21 that the perforated flap reduced substantially the velocity gradients in the region immediately downstream of the flap.
Fig. 20 Near-field Pitot survey
American Institute of Aeronautics and Astronautics
15

-2 0 2 4 6 8 10 12-0.75
-0.5
-0.25
0
0.25
0.5
0.75
P(psig)y/
D
-0.2 0 0.2 0.4 0.6 0.8 1-0.75
-0.5
-0.25
0
0.25
0.5
0.75
u/Up
-2 0 2 4 6 8 10 12-0.75
-0.5
-0.25
0
0.25
0.5
0.75
P(psig)
y/D
-0.2 0 0.2 0.4 0.6 0.8 1-0.75
-0.5
-0.25
0
0.25
0.5
0.75
u/Up
-2 0 2 4 6 8 10 12-0.75
-0.5
-0.25
0
0.25
0.5
0.75
P(psig)
y/D
-0.2 0 0.2 0.4 0.6 0.8 1-0.75
-0.5
-0.25
0
0.25
0.5
0.75
u/Up
a)
b)
c)
Fig. 21 Near-field Pitot pressure and velocity profiles. Dashed blue line indicates path of Pitot probe. Axial location of probe was 10 mm downstream of flap trailing edge. a) Baseline; b) solid flaps; perforated flaps (fine mesh).
B. Mean flow mapping This section presents the full 3D mapping of the mean velocity field and its first and second radial
derivatives. Profiles start at x/Df=1.7, so small-scale details seen in the near-field profiles are likely to be smeared-out or dissipated by that station. For each axial station, the radial derivatives are calculated on the radial-azimuthal (r-φ) coordinate system. The origin of the r-φ plane is defined as the centroid of the region where the Pitot pressure exceeds 95% of its maximum value. The first and second derivatives are calculated along radial lines from φ=-178 to 180 deg in increments of 2 deg. The derivative values on the
American Institute of Aeronautics and Astronautics
16

r-φ plane are then interpolated on the Cartesian y-z plane. The radial velocity gradient is presented in the normalized form
ru
UD
p
f
∂∂
a) 0.2
0.4
0.6
0.8
2 2.5 3 3.5 4 4.5 5 5.5 6 6.5
-1
-0.5
0
0.5
1
x/Df
y/D
f
b) 0.2
0.4
0.6
0.8
2 2.5 3 3.5 4 4.5 5 5.5 6 6.5
-1
-0.5
0
0.5
1
x/Df
y/D
f
c) 0.2
0.4
0.6
0.8
2 2.5 3 3.5 4 4.5 5 5.5 6 6.5
-1
-0.5
0
0.5
1
x/Df
y/D
f
Fig. 22 Isocontours of u/Up on the z=0 (symmetry) plane.
American Institute of Aeronautics and Astronautics
17

Isocontours of the mean axial velocity u, normalized by the core velocity Up, on the symmetry plane z=0 are shown in Fig. 22. The base flow is asymmetric due to the presence of the pylon. The pylon flaps enhance this asymmetry but in subtle ways not readily apparent in these plots. One feature that is clear, though, is that the deflectors reduce the extent of the high-speed region. The primary potential core length, defined here as the length of the u/Up=0.9 level, is reduced from x/Df=3.5 to x/Df=2.7 (23%) using the solid flaps and to x/Df=2.9 (17%) using the fine-perforation flaps. In addition, both types of flaps reduce the radial extent of the high-speed region. This will become more evident in subsequent figures.
Figure 23 plots isocontours of u(x0,y,z)/Up for various axial stations x0. We note again that the baseline flow is not axisymmetric because of the presence of the pylon. The baseline profiles are pear-shaped with moderately thicker fan flow below the core flow. This distortion from axial symmetry does not evolve significantly with downstream distance. In contrast, the profiles for the jets with flaps distort into more vertically oblong shapes with downstream distance, with significant thickening of the low-speed flow underneath the core jet. Interestingly, the perforated flaps create more distortion than the solid flaps far downstream of the nozzle. Importantly, both types of flaps reduce the extent of the high-speed region and thus compact the noise sources closer to the nozzle.
The contours of radial velocity gradient, plotted in Fig.24, show important features not easily discernible from the velocity profiles. The baseline jet has strong velocity gradients near the extended location of the pylon, on the top side of the jet. Surprisingly, the flaps reduce these gradients, a significant departure from wedges installed on axisymmetric nozzles. It is important to note that the high-gradient region for the baseline flow in Fig. 22 coincides with the region of noise source generation in the computational studies of Massey et al. 11. On the lower side of the jet, the flaps reduce the velocity gradient for x/Df>4.
The maps of the second radial derivative of the mean velocity allow location of the inflection points of the velocity profile on the r-φ plane. As discussed in the Introduction (Fig.1), the locus of inflection points i2 and i3 defines the region where the core jet is “silenced” by the fan flow. Figure 25 shows the locus of the inflection points and highlights by light green color the area enclosed by the lines i2 and i3. Also plotted, in red, is the high-speed region of the flow defined by u≥0.8Up. In simple terms, one can think of the red region as the core noise source region and the green inflectional layer as a “fluid shield” that silences the core noise sources. The greater the extent of the inflectional layer in relation to the noise source region, the stronger the potential for noise reduction. The azimuthal extent of the inflectional layer may indicate which azimuthal directions are best treated using this approach. It is evident by the plots of Fig. 23 that both types of flaps cause of more extensive inflectional layer. In addition, as noted earlier, both types of flaps shrink the high-speed region. By x/Df=4.1, the baseline jet loses almost completely its inflectional layer but still has an appreciable high-speed region. In contrast, the jets with flaps retain a noticeable inflectional layer and their high-speed region is practically vanished. The biggest advantage occurs past x/Df=4.1, consistent with the noise source reduction seen in the maps of Figs. 17 and 18. Overall, the inflectional layer is thicker at φ=0 deg than at φ=60 deg, which may explain the better noise reduction at φ=0 deg noted in Section III. These plots may serve as guidance for optimizing the deflector configurations.
American Institute of Aeronautics and Astronautics
18

Baseline Solid Flaps Fine Perforation Flaps
x/Df=1.7
-1 -0.5 0 0.5 1-1
-0.5
0
0.5
1
z/Df
y/D
f
-1 -0.5 0 0.5 1-1
-0.5
0
0.5
1
z/Df
0
0.2
0.4
0.6
0.8
-1 -0.5 0 0.5 1-1
-0.5
0
0.5
1
z/Df
x/Df=2.5
-1 -0.5 0 0.5 1-1
-0.5
0
0.5
1
z/Df
y/D
f
-1 -0.5 0 0.5 1-1
-0.5
0
0.5
1
z/Df
0
0.2
0.4
0.6
0.8
-1 -0.5 0 0.5 1-1
-0.5
0
0.5
1
z/Df
x/Df=3.4
-1 -0.5 0 0.5 1-1
-0.5
0
0.5
1
z/Df
y/D
f
-1 -0.5 0 0.5 1-1
-0.5
0
0.5
1
z/Df
0
0.2
0.4
0.6
0.8
-1 -0.5 0 0.5 1-1
-0.5
0
0.5
1
z/Df
x/Df=4.2
-1 -0.5 0 0.5 1-1
-0.5
0
0.5
1
z/Df
y/D
f
-1 -0.5 0 0.5 1-1
-0.5
0
0.5
1
z/Df
0
0.2
0.4
0.6
-1 -0.5 0 0.5 1-1
-0.5
0
0.5
1
z/Df
x/Df=5.0
-1 -0.5 0 0.5 1-1
-0.5
0
0.5
1
z/Df
y/D
f
-1 -0.5 0 0.5 1-1
-0.5
0
0.5
1
z/Df
0.1
0.2
0.3
0.4
0.5
0.6
-1 -0.5 0 0.5 1-1
-0.5
0
0.5
1
z/Df Fig. 23 Isocontours of u/Up on various x-planes.
American Institute of Aeronautics and Astronautics
19

Baseline Solid Flaps Fine Perforation Flaps
x/Df=1.7
-1 -0.5 0 0.5 1-1
-0.5
0
0.5
1
z/Df
y/D
f
-1 -0.5 0 0.5 1-1
-0.5
0
0.5
1
z/Df
0
0.5
1
1.5
2
2.5
-1 -0.5 0 0.5 1-1
-0.5
0
0.5
1
z/Df
x/Df=2.5
-1 -0.5 0 0.5 1-1
-0.5
0
0.5
1
z/Df
y/D
f
-1 -0.5 0 0.5 1-1
-0.5
0
0.5
1
z/Df
0.5
1
1.5
-1 -0.5 0 0.5 1-1
-0.5
0
0.5
1
z/Df
x/Df=3.4
-1 -0.5 0 0.5 1-1
-0.5
0
0.5
1
z/Df
y/D
f
-1 -0.5 0 0.5 1-1
-0.5
0
0.5
1
z/Df
0
0.5
1
1.5
-1 -0.5 0 0.5 1-1
-0.5
0
0.5
1
z/Df
x/Df=4.2
-1 -0.5 0 0.5 1-1
-0.5
0
0.5
1
z/Df
y/D
f
-1 -0.5 0 0.5 1-1
-0.5
0
0.5
1
z/Df
0.2
0.4
0.6
0.8
1
1.2
-1 -0.5 0 0.5 1-1
-0.5
0
0.5
1
z/Df
x/Df=5.0
-1 -0.5 0 0.5 1-1
-0.5
0
0.5
1
z/Df
y/D
f
-1 -0.5 0 0.5 1-1
-0.5
0
0.5
1
z/D
0.2
0.4
0.6
0.8
1
-1 -0.5 0 0.5 1-1
-0.5
0
0.5
1
z/Dff Fig. 24 Isocontours of radial velocity gradient on various x-planes.
American Institute of Aeronautics and Astronautics
20

Baseline Solid Flaps Fine Perforation Flaps
x/Df=1.7
x/Df=2.5
x/Df=3.4
x/Df=3.8
x/Df=4.2
Fig. 25 Inflectional layer and high-speed region on several x-planes. Green lines: locus of inflection points of radial velocity profile. Region enclosed by i2 and i3 is shaded light green. Red region represents u/Up > 0.8.
American Institute of Aeronautics and Astronautics
21

VI. Conclusions This experimental investigation examined the potential of pylon-mounted flap deflectors to reduce
noise of separate-flow turbofan engines with bypass ratio 8. The main function of the deflectors is to thicken the low-speed region surrounding the core jet in the downward and sideline directions. The study encompassed acoustic measurements, noise source imaging, mean velocity surveys, and aerodynamic estimates. Three types of deflectors were tested: solid flaps, porous flaps made of coarse perforation, and porous flaps made of fine perforation. The porosity was about 50% for both coarse- and fine-perforation flaps. The deflection angle was 22 deg. for all the flaps.
The baseline flow is non-axisymmetric due to the presence of the pylon. The baseline flow field includes a moderately thickened flow on the bottom side of the jet and strong velocity gradients at the top of the jet. It is shown that all the deflectors reduce noise sources near the end of the primary potential core. The reduction is strongest for sources emitting sound in the aft quadrant but remains appreciable for sources emitting sound at large polar angles from the jet exit. Mechanisms of the noise reduction involve elongation of the secondary inflectional layer on the lower side of the jet in combination with a compaction of the high-speed region and reduced velocity gradients past the end of the potential core.
However, the solid flaps create excess noise in the vicinity of their location that can overwhelm the noise benefit, particularly at large polar angles and azimuth angles that allow direct “line of sight” of the flaps. It is noted that the excess noise is particularly strong for the relatively large flap angle (22 deg) used here. Flaps with smaller angles produce less excess noise. Nevertheless, it is important to understand and cure this undesirable feature of wedge- and flap-type deflectors. Likely sources of the excess noise are the increased shear on the top of the jet, caused by the dead region behind the flap, and a strong velocity spike on the top of the flap, caused by the upwash of the fan flow over the surface of the flap. Perforated flaps significantly mitigate both of these adverse effects and reduce substantially the resulting excess noise. However, the perforations themselves can cause noise at high frequency. It is shown that this noise can be moved to very high frequency (rapidly attenuated by atmospheric absorption) by reducing the size of the perforation. Accordingly, the fine-perforation flaps provided superior acoustic results yielding estimated EPNL benefits of 2.1 dB in the downward direction and 1.0 dB in the sideline direction.
A surprising result is that the flaps reduce the velocity gradients, created by the pylon, on the top of the jet. This is opposite to the trends observed when wedges or flaps were installed in axisymmetric nozzles. The gradient reduction may have beneficial impacts on upward-emitted noise that reflects from the wing surface.
Acknowledgment The author thanks Mr. An Vu for his CAD design of the slotted pylon. The noise suppression method
of pylon flaps is proprietary to the University of California. U.S. Patent Pending.
References 1. Papamoschou, D., “Fan Flow Deflection in Simulated Turbofan Exhaust,” AIAA Journal, Vol. 44,
No.12, 2006, pp. 3088-3097. 2. D. Papamoschou, “New Method for Jet Noise Suppression in Turbofan Engines,” AIAA Journal,
Vol. 42, No.11, 2004, pp. 2245-2253. 3. Fisher, M.J., Preston, G.A., and Bryce, W.D., “A Modelling of the Noise from Simple Coaxial
Jets, Part 1: With Unheated Primary Flow,” Journal of Sound and Vibration, Vol. 209, No. 3, 1998, pp. 385-403.
4. Zaman, K.B.M.Q., and Papamoschou, D. “Effect of a Wedge on Coannular Jet Noise”, AIAA Paper 2006-0007, Jan. 2006.
American Institute of Aeronautics and Astronautics
22

5. Zaman, K.B.M.Q., Bridges, J., and Papamoschou, D., “Offset Stream Technology - Comparison of Results from UCI and GRC,” AIAA-2007-0438, Jan. 2007.
6. Shupe, R.S., Zaman, K.B.M.Q., and Papamoschou, D., “Effect of Wedge-Shaped Deflectors on Flow Fields of Dual-Stream Jets,” AIAA Paper 2007-3659, May 2007.
7. Papamoschou, D., and Dadvar, A., “Localization of Multiple Types of Jet Noise Sources,” AIAA-2006-2644, May 2006.
8. D. Papamoschou, A. Vu, and A. Johnson, “Aerodynamics of Wedge-Shaped Deflectors for Jet Noise Reduction,” AIAA Paper 2006-3655, June 2006.
9. Castro, I.P., “Wake Characteristics of Two-Dimensional Perforated Plates Normal to an Airstream,” Journal of Fluid Mechanics, Vol, 46, Part 3, 1971, pp. 599-609.
10. Sakaliyski, K.D., Hileman, J.I., and Spakovzky, Z.S., “Aero-Acoustics of Perforated Drag Plates for Quiet Transportation Aircraft, AIAA Paper 2007-1032, Jan. 2007.
11. Massey, S.J., Elmiligui, A.A., Hunter, C.A., Thomas, R.H., and Pao, S.P., “Computational Analysis of a Chevron Nozzle Uniquely Tailored for Propulsion Airframe Aeroacoustics,” AIAA Paper 2006-2436, May 2006.
American Institute of Aeronautics and Astronautics
23