pwc m&a 2014 review and 2015 outlook · pwc key messages – china m&a in 2014 (2 of 3) 6...
TRANSCRIPT
PwC M&A 2014 Review and 2015 Outlook
27 January 2015 David Brown, PwC China and Hong Kong Transaction Services Leader Christopher Chan, PwC China and Hong Kong Advisory Partner

PwC
Foreword – explanation of data shown in this presentation (1 of 2)
2
• The data presented is based on information compiled by ThomsonReuters, ChinaVenture and PwC analysis unless stated otherwise
• Thomson Reuters and ChinaVenture record announced deals. Some announced deals will not go on to complete
• The deal volume figures presented in this report refer to the number of deals announced, whether or not a value is disclosed for the deal
• The deal value figures presented in this report refers only to those deals where a value has been disclosed (referred to in this presentation as “disclosed value”)
• “Domestic” means China including Hong Kong and Macau
• “Outbound” relates to mainland China company acquisitions abroad
• “Inbound” relates to overseas company acquisitions of Domestic companies,
• “Private Equity deals” or “PE deals” refer to financial buyer deals with deal value over US$10mn and/or with undisclosed deal value, mainly invested by private equity GPs but also including direct investments by financial institutions and conglomerates which are of the nature of private equity type investing
PwC
Foreword – explanation of data shown in this presentation (2 of 2)
3
• “VC deals” refer to financial buyer deals with deal value less than US$10mn and/or with undisclosed deal, but invested by venture capital funds
• “Strategic buyer” refers to corporate buyers (as opposed to financial buyers) that acquire companies with the objective of integrating the acquisition in their existing business
• “Financial buyer” refers to investors that acquire companies with the objective of realizing a return on their investment by selling the business at a profit at a future date and mainly, but not entirely, comprise PE and VC funds
• In order to exclude foreign exchange impact, deal values from 2008 to 2012 were adjusted based on 2014 average Rmb/US$ exchange rate

PwC
Key messages
4

PwC
Key messages – China M&A in 2014 (1 of 3)
5
Overall
• China M&A surged by 55% in both volume and value terms to reach record levels in 2014
• Nearly all sub-sectors achieved new volume records - led by domestic strategic M&A which increased by nearly two thirds compared to the prior year
• Deals sizes were also bigger in nearly all sub-sectors – 2014 China M&A at US$407bn was more than half as much again as the previous high set in 2013
Domestic and Foreign-Inbound Strategic
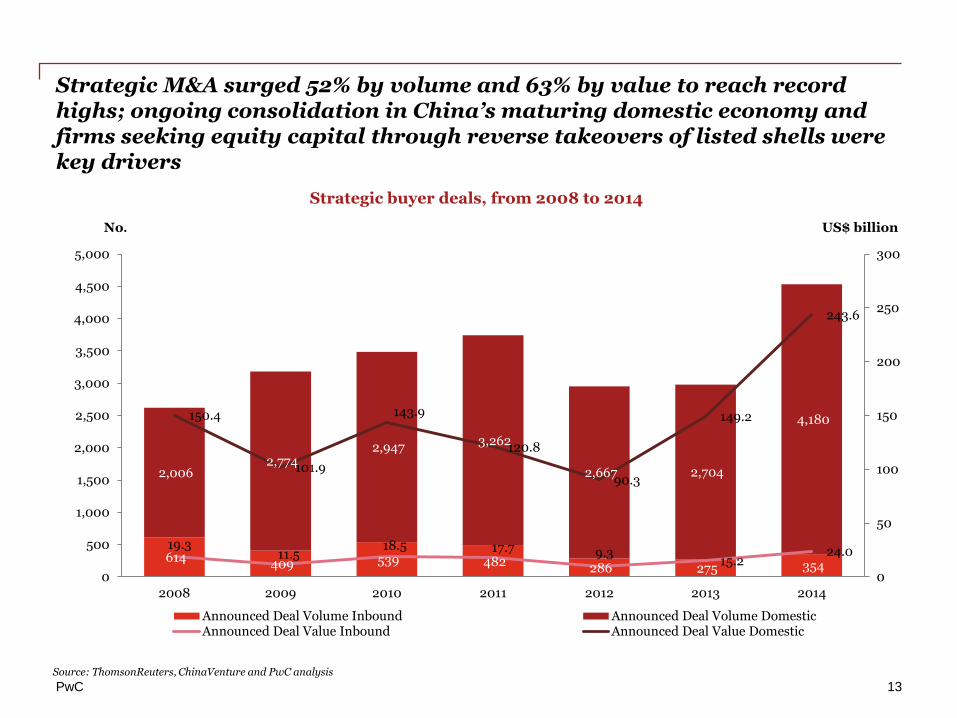
• Strategic M&A surged 52% by volume and 63% by value to reach record highs; ongoing consolidation in China’s maturing domestic economy and firms seeking equity capital through reverse takeovers of listed shells were key drivers
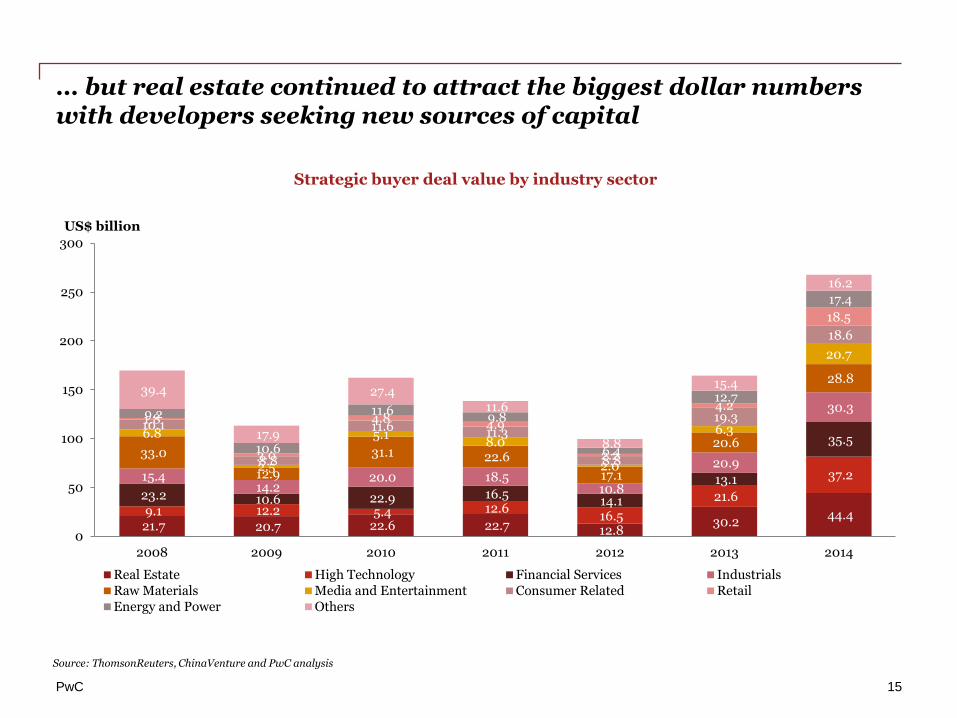
• Technology, consumer-related and financial services deals were important industry sectors, reflecting to some extent the development of the broader economy, but real estate continued to attract the biggest dollar numbers with developers seeking new sources of capital
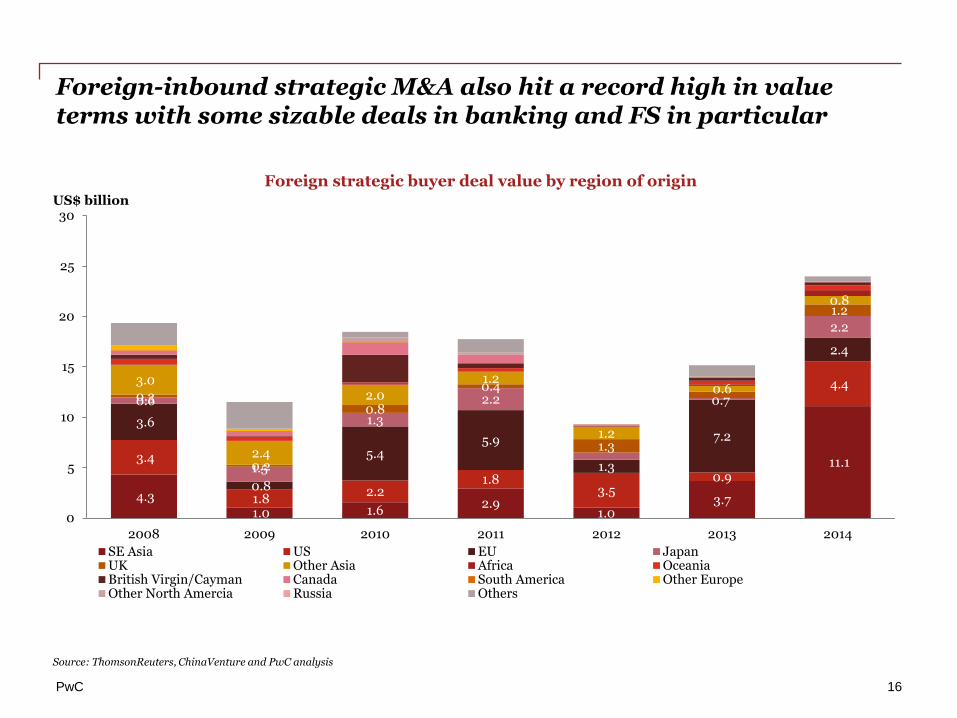
• Foreign-inbound strategic M&A also hit a record high in value terms with some sizable deals in banking and FS in particular
PwC
Key messages – China M&A in 2014 (2 of 3)
6
Private Equity
• Fundraising by PEs remained healthy, with the strongest US$ fundraise since 2008 and a slight uptick in Renminbi fundraising despite some disintermediation of domestic GPs
• 2014 was a banner year for new investments by PEs and financial-buyers with record volumes (up 51%) and values (up 101%); participation in SOE reforms and - for the first time at scale - outbound deals involving Chinese GPs and financial buyers underpinned this performance
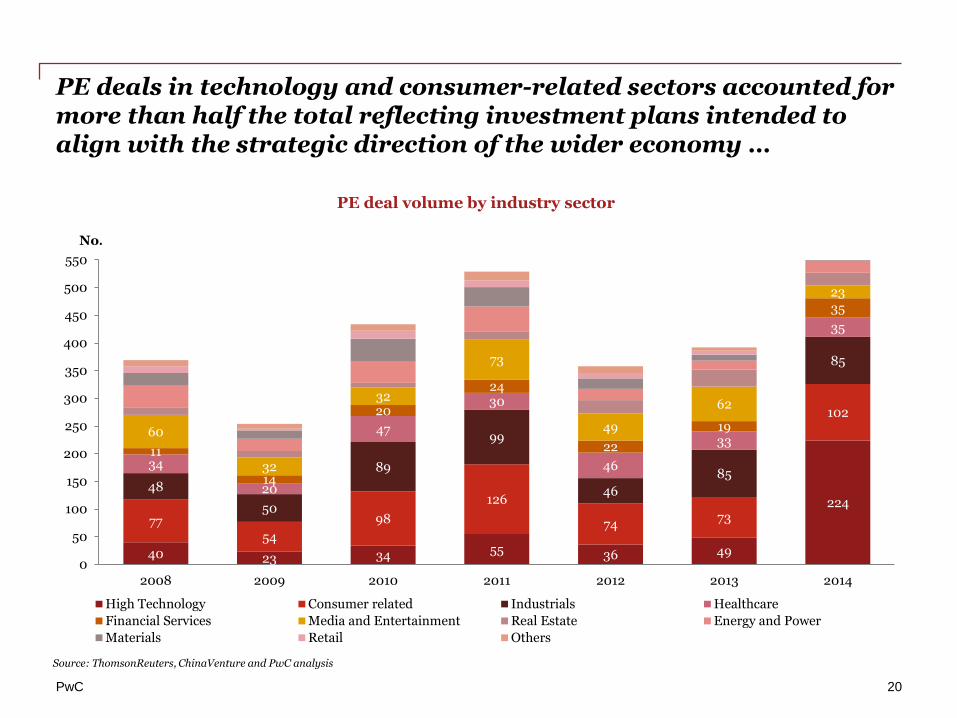
• PE deals in technology and consumer-related sectors accounted for more than half the total reflecting investment plans intended to align with the strategic direction of the wider economy; a similar trend was seen in deal values: in total there were 15 PE / financial-buyer deals valued at more than US$1bn in 2014, another record
• Outbound investment by local PEs and financial buyers almost doubled in volume terms and outbound deal values also reached a record high; PEs typically look for overseas businesses which have a strong China-angle in their growth strategies
• As expected, there was a rebound in the number of PE exits; trade sale exits by M&A hit a record high, but IPO activity – although at a three year best - remains well below the levels seen in 2010/11
• A-share listings, although rebounding, nevertheless remain somewhat challenging and overseas listings in Hong Kong and New York are important exit routes
• The longer term overhang of new investments compared to exits continues to present a challenge to the PE industry
PwC
Key messages – China M&A in 2014 (3 of 3)
7
China Outbound
• The number of China outbound deals surged by more than a third to reach a record high; at US$56.9bn, outbound transaction values have been exceeded only once (in 2012) despite a lack of mega-deals
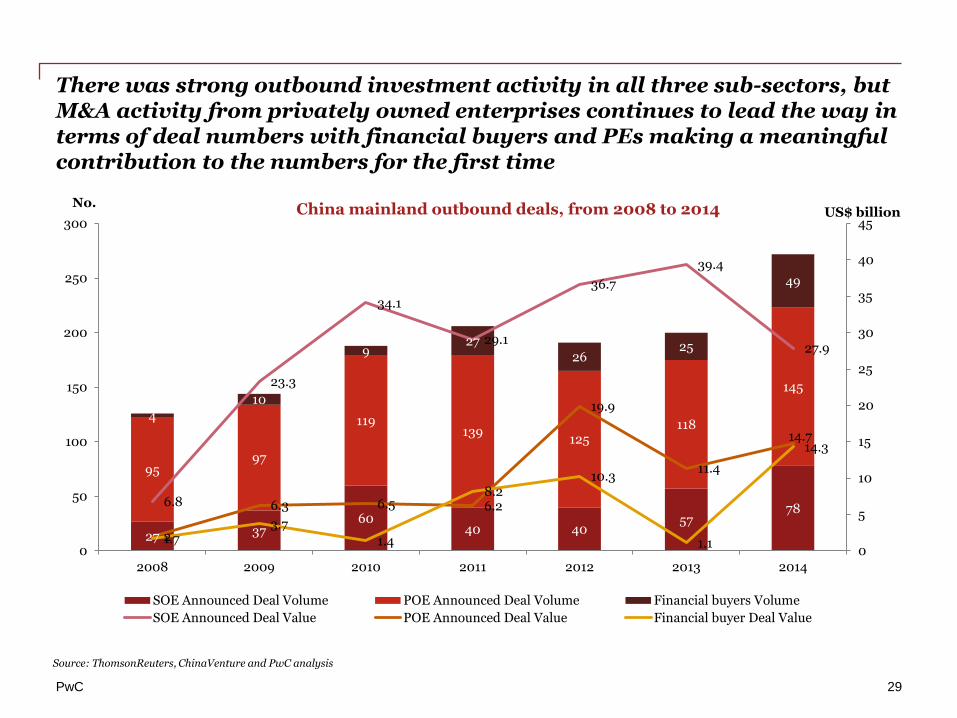
• There was strong outbound investment activity in all three sub-sectors, but M&A activity from privately owned enterprises continues to lead the way in terms of deal numbers with financial buyers and PEs making a meaningful contribution to the numbers for the first time
• SOEs continue to do deals in the industrials, resources and energy sectors; POEs are looking for technologies and brands to bring back to the China market; PEs and financial buyers have backed some of these strategic deals as well as investing on their own account
• Chinese buyers in particular tend to favour developed markets where advanced technologies and brands can be found

PwC
Overview

PwC
Volume Value Volume Value Volume Value Volume Value Volume Value Volume Value Volume Value
Strategic buyers (US$bn) (US$bn) (US$bn) (US$bn) (US$bn) (US$bn) (US$bn)
Domestic 3,006 150.4 2,774 101.9 2,947 143.9 3,262 120.8 2,667 90.3 2,704 149.2 4,180 243.6 55% 63%
Foreign 614 19.3 409 11.5 539 18.5 482 17.7 286 9.3 275 15.2 354 24.0 29% 58%
Total Strategic buyers 3,620 169.7 3,183 113.4 3,486 162.3 3,744 138.5 2,953 99.6 2,979 164.4 4,534 267.6 52% 63%
Financial buyers
Private Equity 369 22.0 264 22.8 434 27.0 529 41.0 358 34.3 392 36.4 593 73.2 51% 101%
VC 694 1.8 712 1.8 1,011 2.6 903 1.9 473 1.0 738 0.9 1,334 1.4 81% 63%
Total Financial buyers 1,063 23.8 976 24.6 1,445 29.5 1,432 42.9 831 35.3 1,130 37.2 1,927 74.6 71% 101%
China mainland Outbound
SOE 27 6.8 37 23.3 60 34.1 40 29.1 40 36.7 57 39.4 78 27.9 37% -29%
POE 95 2.0 97 6.3 119 6.8 139 6.2 125 19.9 118 11.4 145 14.7 23% 29%
Financial buyers 4 1.7 10 3.7 9 1.4 27 8.2 26 10.3 25 1.1 49 14.3 96% 1200%
Total China mainland Outbound 126 10.4 144 33.3 188 42.1 206 43.5 191 66.9 200 51.9 272 56.9 36% 10%
HK Outbound 156 6.7 152 6.3 171 19.4 183 8.5 166 13.1 164 9.7 215 22.4 31% 131%
Total 4,961 208.9 4,445 173.9 5,281 251.9 5,538 225.1 4,115 204.6 4,448 262.1 6,899 407.2 55% 55%
2010 2011 2012 2013 2014% Diff
volume
2014 vs.
2013
% Diff
value
2014 vs.
2013
20092008
9
Source: ThomsonReuters, ChinaVenture and PwC analysis
Total deal volume and value, from 2008 to 2014
China M&A surged by 55% in both volume and value terms to reach
record levels in 2014
*
*
* Some financial buyer backed outbound deals are also recorded in private equity deals, but they are not double counted in the total deal volume and deal value in the table above

PwC
3,006 2,774 2,947
3,262
2,667 2,704
4,180
614
409 539
482
286 275
354
369
264
434
529
358 392
593*
126
144
188
206
191 200
272*
-500
500
1,500
2,500
3,500
4,500
5,500
2008 2009 2010 2011 2012 2013 2014
Deal volume by main category
Domestic Strategic Buyers Foreign Strategic Buyers Private Equity Deals China Mainland Outbound
Nearly all sub-sectors achieved new volume records - led by domestic strategic M&A which increased by nearly two thirds compared to the prior year
10
Source: ThomsonReuters, ChinaVenture and PwC analysis
No.
* 49 financial buyer backed outbound deals are also recorded in private equity deals

PwC
Deals sizes were also bigger in nearly all sub-sectors – 2014 China M&A at US$407bn was more than half as much again as the previous high set in 2013
150.4
101.9 143.9
120.8 90.3
149.2
243.6
19.3
11.5
18.5
17.7
9.3
15.2
24.0
22.0
22.8
27.0 41.0
34.3
36.4
73.2*
10.4
33.3
42.1 43.5
66.9
51.9
56.9*
0
50
100
150
200
250
300
350
400
450
2008 2009 2010 2011 2012 2013 2014
Deal value by main category
Domestic Strategic Buyers Foreign Strategic Buyers Private Equity Deals China Mainland Outbound
US$ billion
11
Source: ThomsonReuters, ChinaVenture and PwC analysis * US$14.3bn of financial buyer backed outbound deals are also recorded in private equity deals

PwC
Strategic buyers
12
PwC
Strategic M&A surged 52% by volume and 63% by value to reach record highs; ongoing consolidation in China’s maturing domestic economy and firms seeking equity capital through reverse takeovers of listed shells were key drivers
614 409 539 482 286 275 354
2,006 2,774
2,947 3,262
2,667 2,704
4,180
19.3 11.5
18.5 17.7 9.3 15.2
24.0
150.4
101.9
143.9
120.8
90.3
149.2
243.6
0
50
100
150
200
250
300
0
500
1,000
1,500
2,000
2,500
3,000
3,500
4,000
4,500
5,000
2008 2009 2010 2011 2012 2013 2014
Strategic buyer deals, from 2008 to 2014
Announced Deal Volume Inbound Announced Deal Volume DomesticAnnounced Deal Value Inbound Announced Deal Value Domestic
No. US$ billion
13
Source: ThomsonReuters, ChinaVenture and PwC analysis

PwC
Technology, consumer-related and financial services deals were important industry sectors, reflecting to some extent the development of the broader economy …
372 310 320 395 352 404 766
529 428 475
575 439 434
659 522 381 446
500 402 400
568 664
539 614
668
570 429
550 358
106 137
252
264 300
501 432
404 369
384
273 315
372 241
253 248
272
203 235
353
194
120 179
190
176 167
296
308
642
698
508
274 295
469
0
500
1000
1500
2000
2500
3000
3500
4000
4500
5000
2008 2009 2010 2011 2012 2013 2014
Strategic buyer deal volume by industry sector
High Technology Industrials Consumer Related Raw Materials Financial Services
Real Estate Energy and Power Healthcare Others
No.
14
Source: ThomsonReuters, ChinaVenture and PwC analysis
PwC
… but real estate continued to attract the biggest dollar numbers with developers seeking new sources of capital
21.7 20.7 22.6 22.7 12.8 30.2
44.4 9.1 12.2 5.4 12.6 16.5
21.6
37.2
23.2 10.6 22.9 16.5 14.1
13.1
35.5
15.4 14.2
20.0 18.5 10.8
20.9
30.3
33.0
12.9
31.1 22.6
17.1
20.6
28.8
6.8
2.5
5.1 8.0
2.0
6.3
20.7
10.1
8.8
11.6 11.3
8.8
19.3
18.6
1.8
3.0
4.8 4.9
2.2
4.2
18.5
9.2
10.6
11.6 9.8
6.4
12.7
17.4
39.4
17.9
27.4 11.6
8.8
15.4
16.2
0
50
100
150
200
250
300
2008 2009 2010 2011 2012 2013 2014
Strategic buyer deal value by industry sector
Real Estate High Technology Financial Services IndustrialsRaw Materials Media and Entertainment Consumer Related RetailEnergy and Power Others
US$ billion
15
Source: ThomsonReuters, ChinaVenture and PwC analysis
PwC
Foreign-inbound strategic M&A also hit a record high in value terms with some sizable deals in banking and FS in particular
4.3
1.0 1.6 2.9
1.0 3.7
11.1 3.4
1.8 2.2
1.8 3.5
0.9
4.4
3.6
0.8
5.4 5.9
1.3
7.2
2.4
0.6
1.5
1.3
2.2
2.2
0.3
0.2
0.8
0.4
1.3
0.7
1.2
3.0
2.4
2.0
1.2
1.2
0.6
0.8
0
5
10
15
20
25
30
2008 2009 2010 2011 2012 2013 2014
Foreign strategic buyer deal value by region of origin
SE Asia US EU JapanUK Other Asia Africa OceaniaBritish Virgin/Cayman Canada South America Other EuropeOther North Amercia Russia Others
16
Source: ThomsonReuters, ChinaVenture and PwC analysis
US$ billion

PwC
PE/VC deals and financial buyer deals
17

PwC
4.9 6.8
20.3
30.7
20.8
13.3 15.6
50.0
9.7
15.6
17.6
21.6
19.8
28.4
172
165
249
277
123 130
96
0
10
20
30
40
50
60
0
50
100
150
200
250
300
2008 2009 2010 2011 2012 2013 2014
PE/VC fund raising for China investment*
Renminbi Fund Size Non-renminbi Fund Size Fund Volume
No. US$ billion
Fundraising by PEs remained healthy, with the strongest US$ fundraise since 2008 and a slight uptick in renminbi fundraising despite some disintermediation of domestic GPs
18
Source: AVCJ and PwC analysis
* Excludes PEs investing in China from non-region specific funds

PwC
2014 was a banner year for new investments by PEs and financial-buyers with record volumes (up 51%) and values (up 101%); participation in SOE reforms and - for the first time at scale - outbound deals involving Chinese GPs and financial buyers underpinned this performance
369
264
434
529
358 392
593
22.0 22.8
27.0
41.0
34.3 36.4
73.2
0
10
20
30
40
50
60
70
80
0
50
100
150
200
250
300
350
400
450
500
550
2008 2009 2010 2011 2012 2013 2014
Private Equity deals, from 2008 to 2014
Announced Deal Volume Announced Deal Value
No. US$ billion
19
Source: ThomsonReuters, ChinaVenture and PwC analysis
PwC
PE deals in technology and consumer-related sectors accounted for more than half the total reflecting investment plans intended to align with the strategic direction of the wider economy …
40 23 34 55 36 49
224
77 54
98
126
74 73
102
48
50
89
99
46
85
85
34
20
47
30
46
33
35
11
14
20
24
22
19
35
60
32
32
73
49
62
23
0
50
100
150
200
250
300
350
400
450
500
550
2008 2009 2010 2011 2012 2013 2014
PE deal volume by industry sector
High Technology Consumer related Industrials Healthcare
Financial Services Media and Entertainment Real Estate Energy and Power
Materials Retail Others
No.
20
Source: ThomsonReuters, ChinaVenture and PwC analysis
PwC
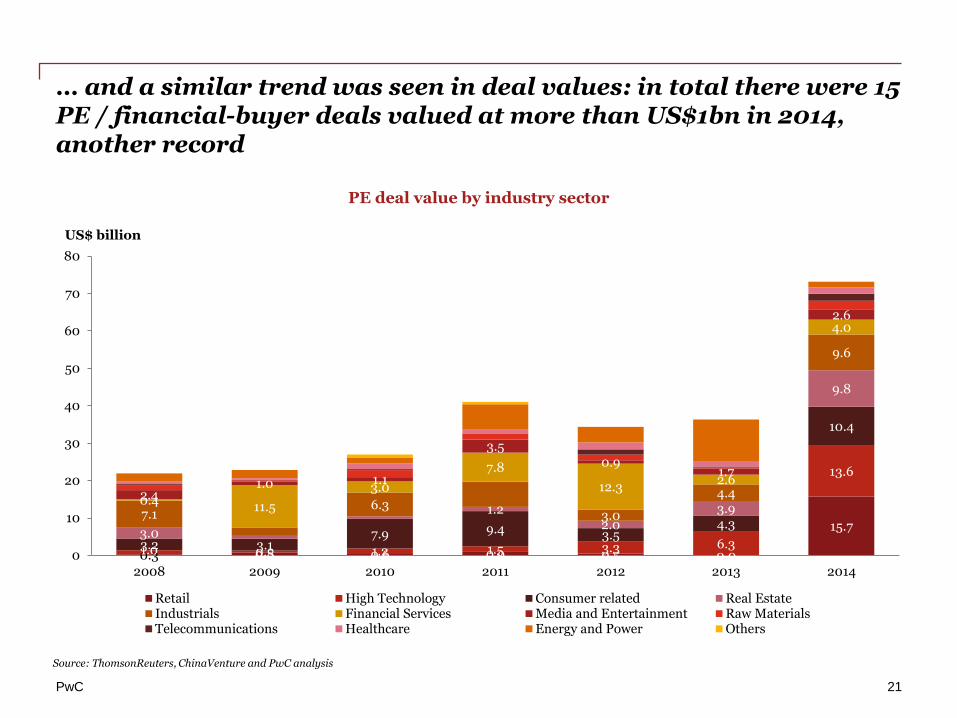
… and a similar trend was seen in deal values: in total there were 15 PE / financial-buyer deals valued at more than US$1bn in 2014, another record
0.3 0.8 0.6 0.9 0.5 0.0
15.7
1.0 0.5 1.2 1.5 3.3 6.3
13.6
3.2 3.1 7.9 9.4 3.5
4.3
10.4
3.0
1.2 2.0
3.9
9.8
7.1 6.3
3.0
4.4
9.6
0.4 11.5
3.0
7.8
12.3 2.6
4.0
2.4 1.0 1.1
3.5 0.9
1.7
2.6
0
10
20
30
40
50
60
70
80
2008 2009 2010 2011 2012 2013 2014
PE deal value by industry sector
Retail High Technology Consumer related Real EstateIndustrials Financial Services Media and Entertainment Raw MaterialsTelecommunications Healthcare Energy and Power Others
US$ billion
21
Source: ThomsonReuters, ChinaVenture and PwC analysis

PwC
Outbound investment by local PEs and financial buyers almost doubled in volume terms …
4 10 9
27 26 25
49
0
10
20
30
40
50
60
2008 2009 2010 2011 2012 2013 2014
China mainland PE/Financial buyer backed outbound deal volume
Financial buyers
22
Source: ThomsonReuters, ChinaVenture and PwC analysis
No.
PwC
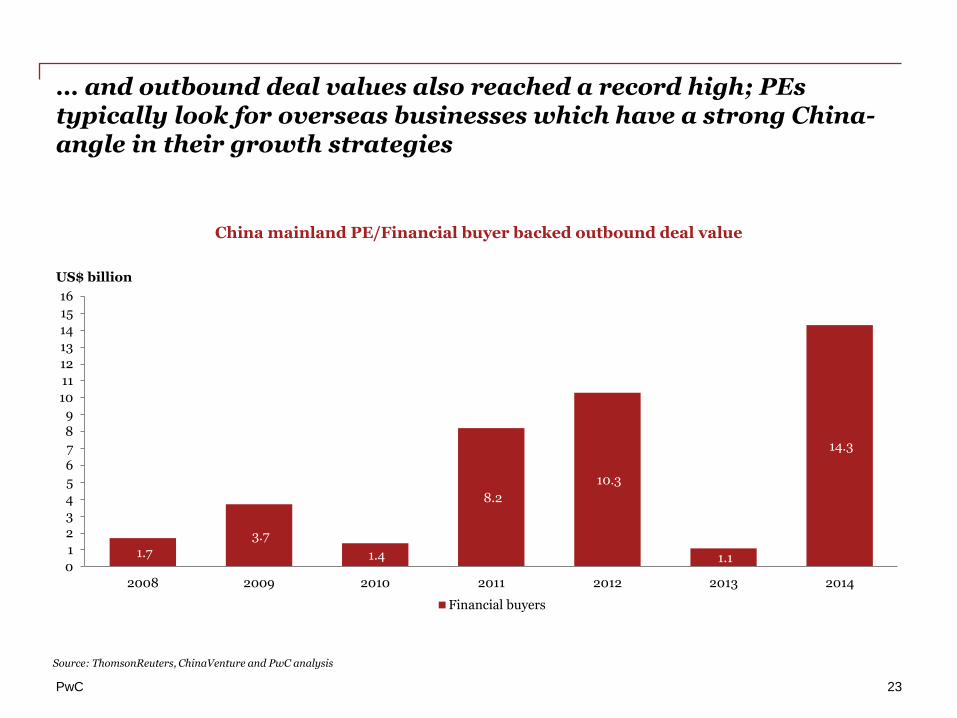
… and outbound deal values also reached a record high; PEs typically look for overseas businesses which have a strong China-angle in their growth strategies
1.7
3.7
1.4
8.2
10.3
1.1
14.3
0
1
2
3
4
5
6
7
8
9
10
11
12
13
14
15
16
2008 2009 2010 2011 2012 2013 2014
China mainland PE/Financial buyer backed outbound deal value
Financial buyers
US$ billion
23
Source: ThomsonReuters, ChinaVenture and PwC analysis

PwC
As expected, there was a rebound in the number of PE exits; trade sale exits by M&A hit a record high, but IPO activity – although at a three year best - remains well below the levels seen in 2010/11
46
88
212
171
98
35
114 44
84
83
91
92
85
111
7
5
8
6
8
6
7
0
50
100
150
200
250
300
350
2008 2009 2010 2011 2012 2013 2014
PE/VC backed deal exit volume by type
IPO M&A - trade M&A - PE
24
No.
Source: AVCJ and PwC analysis

PwC
A-share listings, although rebounding, nevertheless remain somewhat challenging and overseas listings in Hong Kong and New York are important exit routes
21
48
118 106
70
-
45 12
27
39
26
11
29
38
2
-
11
18
11
-
17
4
7
30
11
2
6
13
0
50
100
150
200
250
2008 2009 2010 2011 2012 2013 2014
PE/VC backed IPO exit volume by bourse
Shenzhen Hong Kong Shanghai A NYSE/ NASDAQ Others
25
No.
Source: AVCJ and PwC analysis
PwC
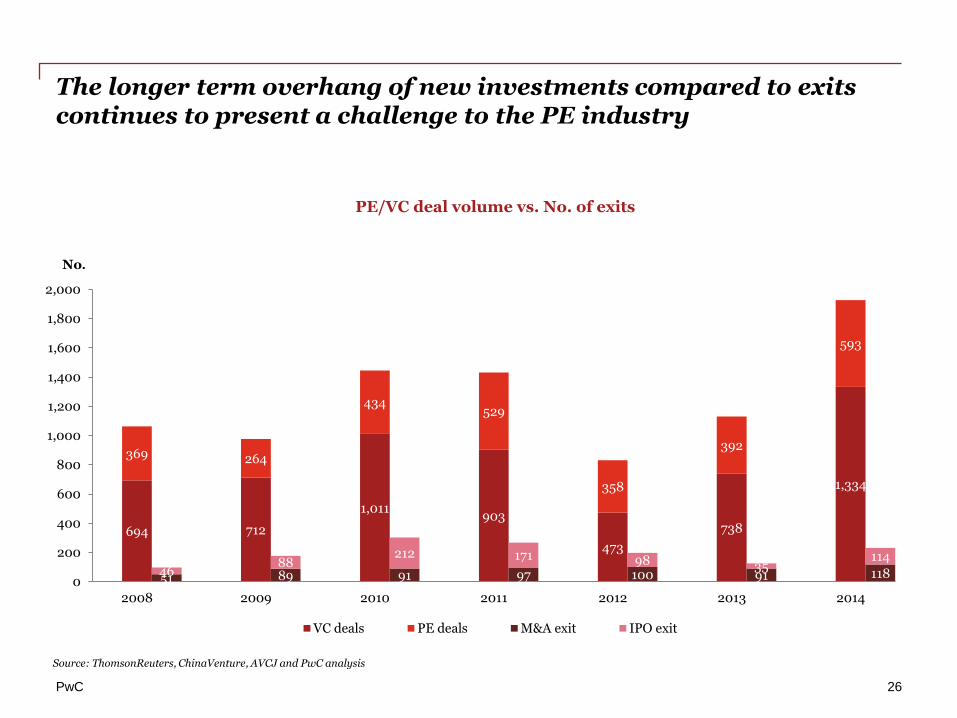
The longer term overhang of new investments compared to exits continues to present a challenge to the PE industry
26
694 712
1,011 903
473
738
1,334
369 264
434 529
358
392
593
51 89 91 97 100 91 118 46 88
212 171 98 35 114
0
200
400
600
800
1,000
1,200
1,400
1,600
1,800
2,000
2008 2009 2010 2011 2012 2013 2014
PE/VC deal volume vs. No. of exits
VC deals PE deals M&A exit IPO exit
Source: ThomsonReuters, ChinaVenture, AVCJ and PwC analysis
No.
PwC
Mainland China outbound
27

PwC
The number of China outbound deals surged by more than a third to reach a record high; at US$56.9bn, outbound transaction values have been exceeded only once (in 2012) despite a lack of mega-deals
126 144
188 206
191 200
272
10.4
33.3
42.1 43.5
66.9
51.9 56.9
0
10
20
30
40
50
60
70
80
0
50
100
150
200
250
300
2008 2009 2010 2011 2012 2013 2014
China mainland outbound deals, from 2008 to 2014
Announced Deal Volume Announce Deal Value
No. US$ billion
28
Source: ThomsonReuters, ChinaVenture and PwC analysis
PwC
There was strong outbound investment activity in all three sub-sectors, but M&A activity from privately owned enterprises continues to lead the way in terms of deal numbers with financial buyers and PEs making a meaningful contribution to the numbers for the first time
29
Source: ThomsonReuters, ChinaVenture and PwC analysis
27 37 60
40 40 57
78
95 97
119 139
125 118
145
4
10
9 27
26 25
49
6.8
23.3
34.1
29.1
36.7
39.4
27.9
2
6.3 6.5 6.2
19.9
11.4
14.7
1.7 3.7
1.4
8.2 10.3
1.1
14.3
0
5
10
15
20
25
30
35
40
45
0
50
100
150
200
250
300
2008 2009 2010 2011 2012 2013 2014
SOE Announced Deal Volume POE Announced Deal Volume Financial buyers Volume
SOE Announced Deal Value POE Announced Deal Value Financial buyer Deal Value
China mainland outbound deals, from 2008 to 2014 No. US$ billion

PwC
SOEs continue to do deals in the industrials, resources and energy sectors; POEs are looking for technologies and brands to bring back to the China market; PEs and financial buyers have backed some of these strategic deals as well as investing on their own account
30
19 14
10 10 6 5
14
21
13
13 12 24
30
32
6
2
1 3
7
17
13
15 18
11 5 5
1 2
27 14
17
4
20
10
26
3
3
1
1
6
5
6
0
10
20
30
40
50
60
70
Industrials Energy and Power Raw Materials Financial Services Consumer related High Technology Others
2014 SOE 2014 POE 2014 Financial buyers 2013 SOE 2013 POE 2013 Financial buyers
China mainland outbound deals by industry sector
–By number of deals, 2014 vs. 2013
Source: ThomsonReuters, ChinaVenture and PwC analysis
No.

PwC
POEs and financial buyers in particular tend to favour developed markets where advanced technologies and brands can be found
Outbound M&A deal volume by region of destination 2014 vs. 2013
Source: ThomsonReuters and PwC analysis
31
33
North America
51 63
South America
Europe
Africa
Asia
Oceania
11 29 8
64
7
82 96
5 17
5
Russia
2014 2013
1

PwC
Outlook
32
PwC
Outlook for 2015 (1 of 5)
Overall
• The healthy trends in China M&A will continue into 2015
• Drivers for M&A activity include:
─ Growth in domestic M&A with SOE reform a key source of larger transactions
─ POE-led outbound M&A, with increasing involvement of PE and financial buyers
─ An active PE market, including exit-related activity
Key industry sectors
Technology, especially internet:
- The BAT group will continue to lead deal activities both domestically and outbound
- Hot sub-sectors include internet, eCommerce, media and semi-conductors
- M&A activity will be increasingly centred around mobile, location-based services and social networks, as well as opportunities around O2O
- We expect TMT to continue to be a hot sector in 2015
33
PwC
Outlook for 2015 (2 of 5)
Key industry sectors (continued)
Financial services:
- We anticipate inbound interest in P&C insurance (especially specialty insurance) and money lenders (leasing, micro-finance, guarantee companies) which are driven by the expected rapid growth in the SME and retail lending sectors
- With the fast evolving electronic media channel providing efficiencies in market coverage and customer analytics, we expect significant inbound and domestic interest in third party payment platforms and internet banking platforms
34
Retail and consumer:
- R&C generally is expected to be an active sector for M&A in 2015
- Active sub-sectors tend to be changeable, but we expect activity in the following areas
◦ Education
◦ Healthcare
◦ Restaurants
◦ Food related sectors including agriculture and businesses related to food quality and safety
◦ Technology, electrical, home appliance products
◦ Consumer targeted e-commerce

PwC
Outlook for 2015 (3 of 5)
35
Key industry sectors (continued)
Real estate:
- We expect M&A activity in real estate to be driven by a number of factors including group restructurings, back door listings to access capital, funding requirements, growth, etc
- Liquidity of developers will become more challenging
- We think more distressed assets will become available in 2015, especially in tier-2 and tier-3 cities
Healthcare:
- Healthcare sector is attracting investment from SOEs, POEs and PE, but less so from MNCs at this stage
- We expect investment interest in the full industry value chain of “Big Healthcare” with special focus on public and enterprise owned hospital
- There are some challenges, however, including:
◦ Longer investment return periods
◦ Defining sustainable business models
◦ Post deal management and exit
◦ The sensitive nature of the sector (policymakers must consider how to monitor and manage investments activities in order to balance economic interests with social responsibility and the interests of various stakeholders involved)
- We also expect to see some outbound activity around healthcare

PwC
Outlook for 2015 (4 of 5)
Domestic and Foreign-Inbound Strategic
• Domestic M&A will show steady single digit or low double digit growth driven by:
─ Continuing consolidation in many industries to remove excess or competitive capacity
─ SOE reforms – which will lead to some large transactions
─ A-share listed companies looking for inorganic growth
─ Back-door listings in response to difficulties in achieving new IPOs
• Technology (especially internet), FS, retail and consumer, and real estate are hot sectors; healthcare is also a focus, albeit smaller
China Outbound
• POEs will continue to lead double digit growth in China outbound chasing:
─ New markets for growth
─ Technologies, brands and know-how to bring back to China market
─ Diversified investments
• SOE outbound should also be strong as domestic reform plans work through
• SOEs in particular are increasingly building presence in Hong Kong as a platform for future outbound activity
• Financial investors and PEs will also drive growth in outbound M&A as a means to diversify investment portfolios, whilst usually seeking foreign companies with a China angle in their growth strategies
36

PwC
Outlook for 2015 (5 of 5)
Private equity
• PE activity will remain robust in 2015
• Trends in the market will include:
─ More larger sized deals and buyouts
─ PE involvement in outbound transactions
─ PE participation in SOE reforms as a source of diversified capital
─ Deals involving A-share listed companies, both as targets and as buyers of PE held assets (trade sale exit)
─ More exit activity from IPOs, strategic trade sales and – eventually – secondary PE sales
37
PwC
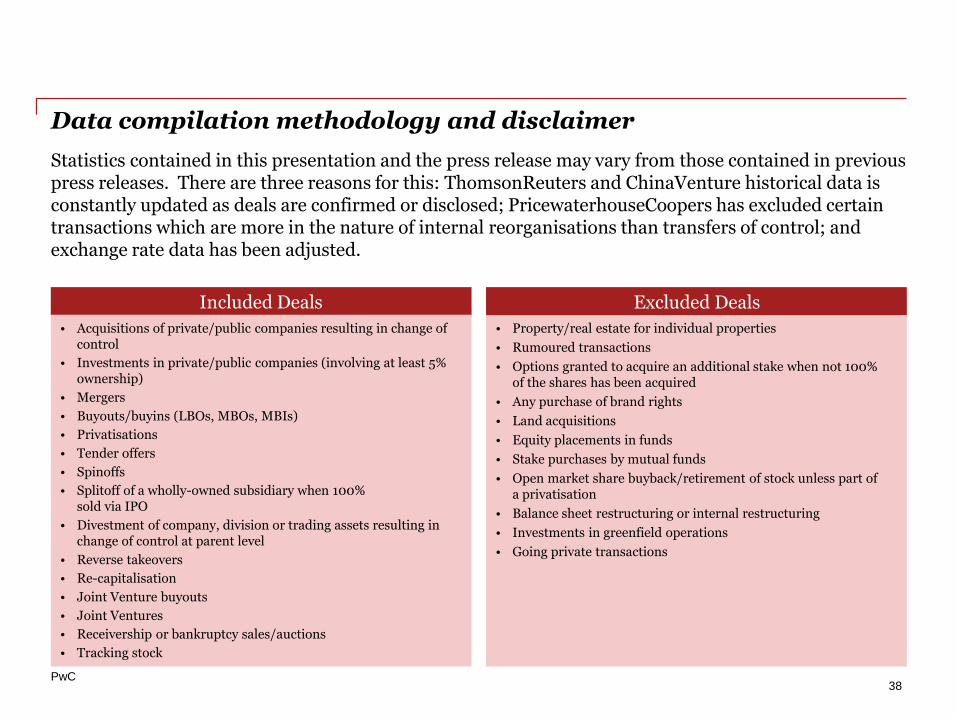
Data compilation methodology and disclaimer
Statistics contained in this presentation and the press release may vary from those contained in previous press releases. There are three reasons for this: ThomsonReuters and ChinaVenture historical data is constantly updated as deals are confirmed or disclosed; PricewaterhouseCoopers has excluded certain transactions which are more in the nature of internal reorganisations than transfers of control; and exchange rate data has been adjusted.
• Acquisitions of private/public companies resulting in change of control
• Investments in private/public companies (involving at least 5% ownership)
• Mergers
• Buyouts/buyins (LBOs, MBOs, MBIs)
• Privatisations
• Tender offers
• Spinoffs
• Splitoff of a wholly-owned subsidiary when 100% sold via IPO
• Divestment of company, division or trading assets resulting in change of control at parent level
• Reverse takeovers
• Re-capitalisation
• Joint Venture buyouts
• Joint Ventures
• Receivership or bankruptcy sales/auctions
• Tracking stock
• Property/real estate for individual properties
• Rumoured transactions
• Options granted to acquire an additional stake when not 100% of the shares has been acquired
• Any purchase of brand rights
• Land acquisitions
• Equity placements in funds
• Stake purchases by mutual funds
• Open market share buyback/retirement of stock unless part of a privatisation
• Balance sheet restructuring or internal restructuring
• Investments in greenfield operations
• Going private transactions
Included Deals Excluded Deals
38

Thank you
© 2015 PricewaterhouseCoopers. All rights reserved. "PricewaterhouseCoopers" refers to the Hong Kong firm of
PricewaterhouseCoopers or, as the context requires, the network of member firms of PricewaterhouseCoopers
International Limited, each of which is a separate and independent legal entity.