pwc - etude top-100 companies europe.231013
TRANSCRIPT
Top 100 companies Europe and Germany
www.pwc.de
September 2013
PwC Capital Markets
PwC
Europe Top 100 from 2008 to 2013
Ranked by market capitalisation
September 2013 Top 100 companies Europe and Germany Slide 2
PwC
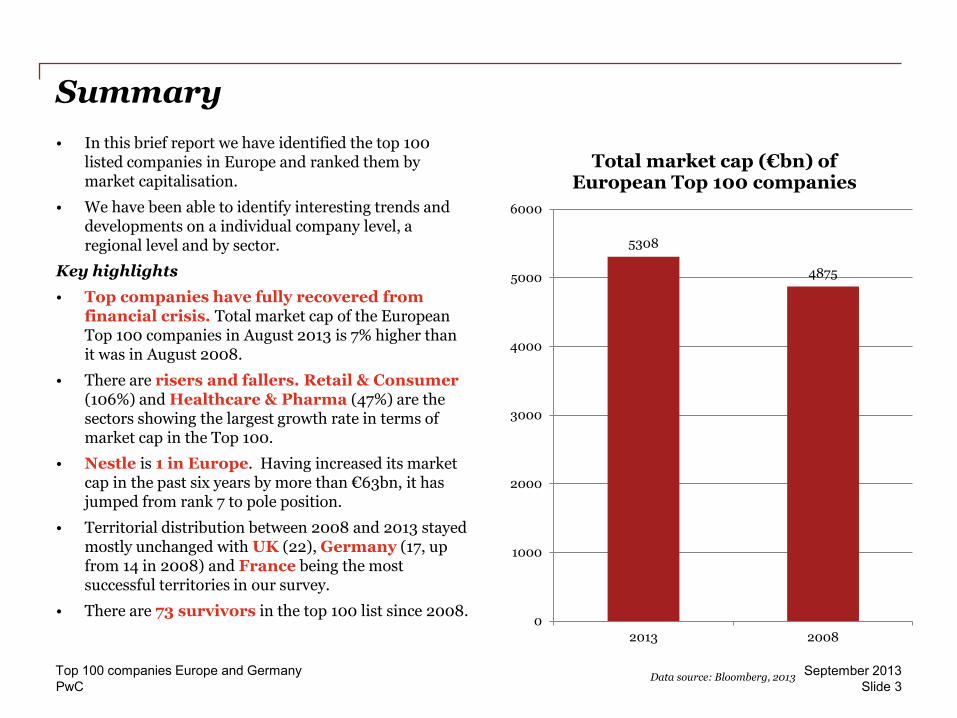
Summary • In this brief report we have identified the top 100
listed companies in Europe and ranked them by market capitalisation.
• We have been able to identify interesting trends and developments on a individual company level, a regional level and by sector.
Key highlights • Top companies have fully recovered from
financial crisis. Total market cap of the European Top 100 companies in August 2013 is 7% higher than it was in August 2008.
• There are risers and fallers. Retail & Consumer (106%) and Healthcare & Pharma (47%) are the sectors showing the largest growth rate in terms of market cap in the Top 100.
• Nestle is 1 in Europe. Having increased its market cap in the past six years by more than €63bn, it has jumped from rank 7 to pole position.
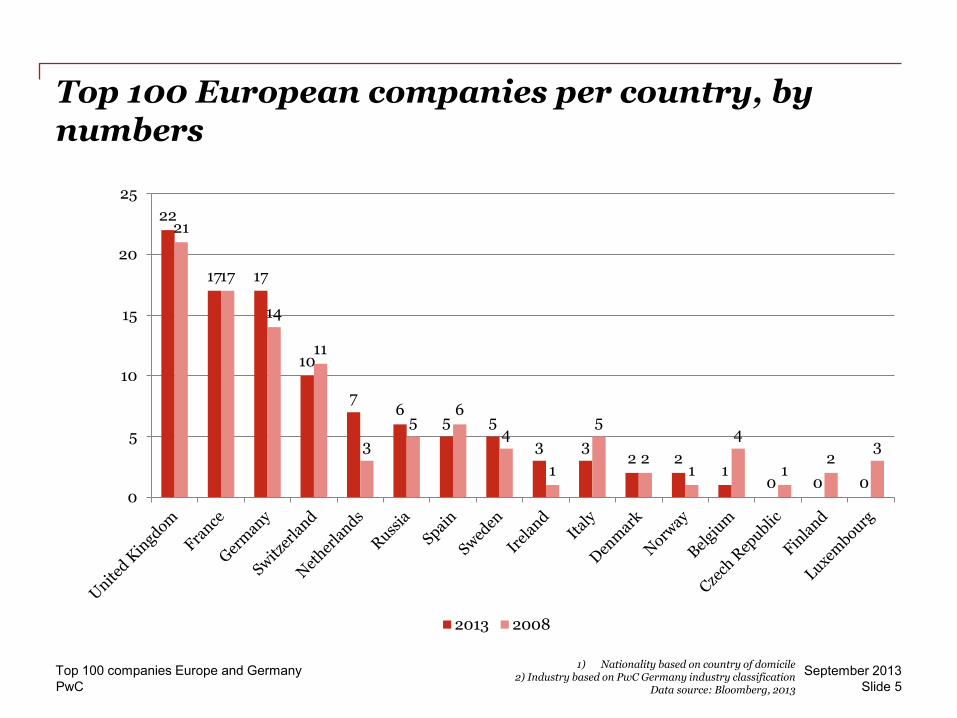
• Territorial distribution between 2008 and 2013 stayed mostly unchanged with UK (22), Germany (17, up from 14 in 2008) and France being the most successful territories in our survey.
• There are 73 survivors in the top 100 list since 2008.
September 2013 Top 100 companies Europe and Germany Slide 3
5308
4875
0
1000
2000
3000
4000
5000
6000
2013 2008
Total market cap (€bn) of European Top 100 companies
Data source: Bloomberg, 2013
PwC
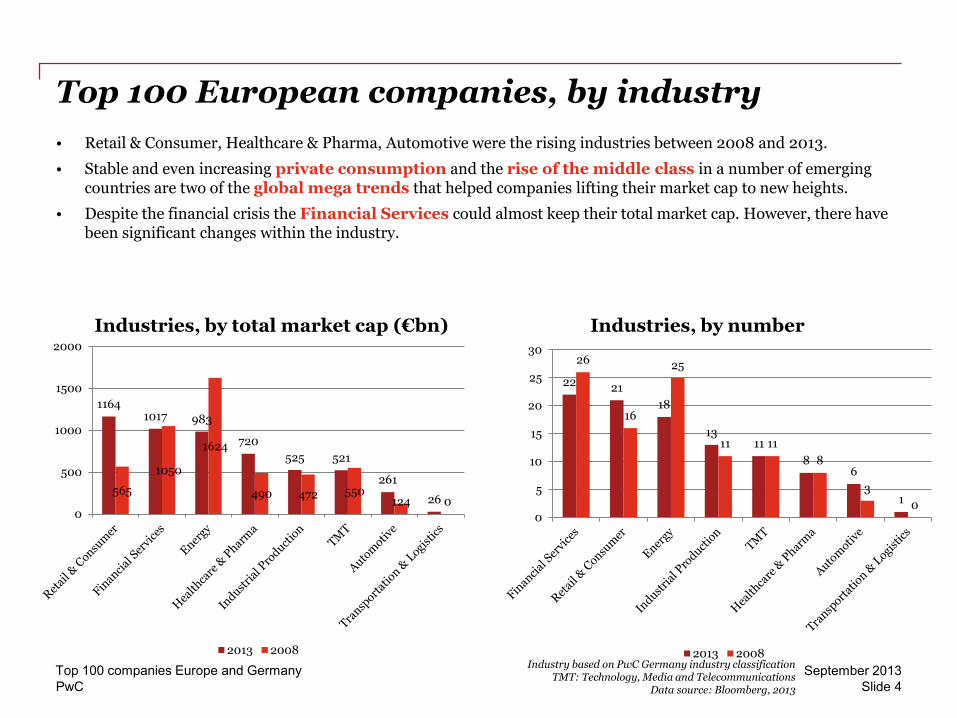
Top 100 European companies, by industry • Retail & Consumer, Healthcare & Pharma, Automotive were the rising industries between 2008 and 2013.
• Stable and even increasing private consumption and the rise of the middle class in a number of emerging countries are two of the global mega trends that helped companies lifting their market cap to new heights.
• Despite the financial crisis the Financial Services could almost keep their total market cap. However, there have been significant changes within the industry.
September 2013 Top 100 companies Europe and Germany Slide 4
22 21 18
13 11
8 6
1
26
16
25
11 11 8
3 0
0
5
10
15
20
25
30
2013 2008
1164 1017 983
720 525 521
261
26 565
1050
1624
490 472 550 124 0
0
500
1000
1500
2000
2013 2008Industry based on PwC Germany industry classification
TMT: Technology, Media and Telecommunications Data source: Bloomberg, 2013
Industries, by number Industries, by total market cap (€bn)
PwC
Top 100 European companies per country, by numbers
September 2013 Top 100 companies Europe and Germany Slide 5
1) Nationality based on country of domicile 2) Industry based on PwC Germany industry classification
Data source: Bloomberg, 2013
22
17 17
10
7 6
5 5 3 3
2 2 1
0 0 0
21
17
14
11
3 5
6 4
1
5
2 1
4
1 2
3
0
5
10
15
20
25
2013 2008
PwC
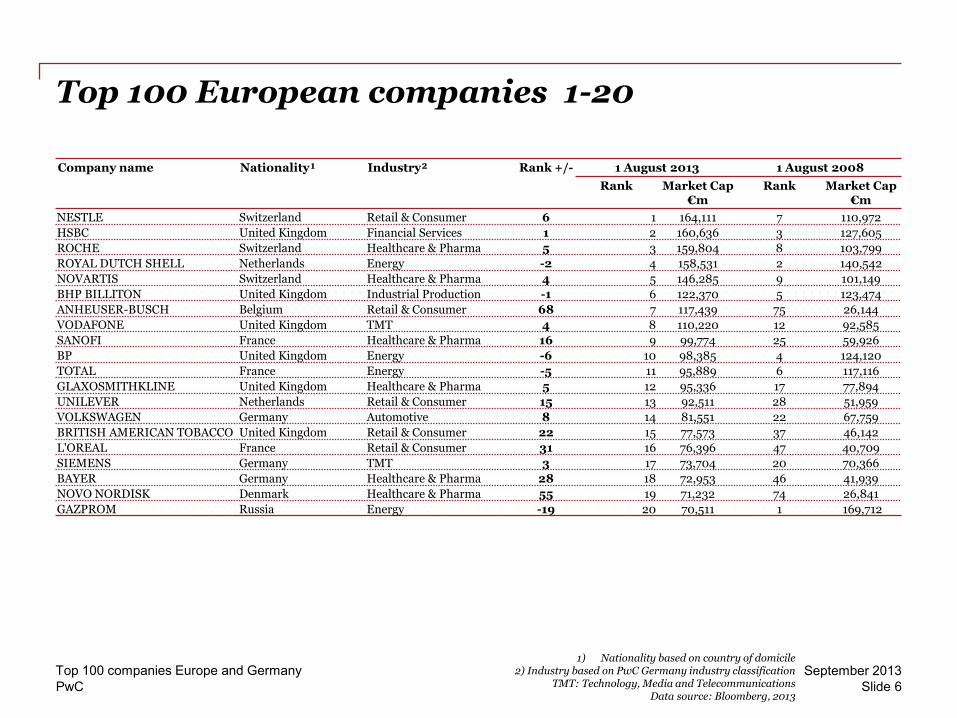
Top 100 European companies 1-20
September 2013 Top 100 companies Europe and Germany Slide 6
Company name Nationality¹ Industry² Rank +/- 1 August 2013 1 August 2008 Rank Market Cap
€m Rank Market Cap
€m NESTLE Switzerland Retail & Consumer 6 1 164,111 7 110,972 HSBC United Kingdom Financial Services 1 2 160,636 3 127,605 ROCHE Switzerland Healthcare & Pharma 5 3 159,804 8 103,799 ROYAL DUTCH SHELL Netherlands Energy -2 4 158,531 2 140,542 NOVARTIS Switzerland Healthcare & Pharma 4 5 146,285 9 101,149 BHP BILLITON United Kingdom Industrial Production -1 6 122,370 5 123,474 ANHEUSER-BUSCH Belgium Retail & Consumer 68 7 117,439 75 26,144 VODAFONE United Kingdom TMT 4 8 110,220 12 92,585 SANOFI France Healthcare & Pharma 16 9 99,774 25 59,926 BP United Kingdom Energy -6 10 98,385 4 124,120 TOTAL France Energy -5 11 95,889 6 117,116 GLAXOSMITHKLINE United Kingdom Healthcare & Pharma 5 12 95,336 17 77,894 UNILEVER Netherlands Retail & Consumer 15 13 92,511 28 51,959 VOLKSWAGEN Germany Automotive 8 14 81,551 22 67,759 BRITISH AMERICAN TOBACCO United Kingdom Retail & Consumer 22 15 77,573 37 46,142 L'OREAL France Retail & Consumer 31 16 76,396 47 40,709 SIEMENS Germany TMT 3 17 73,704 20 70,366 BAYER Germany Healthcare & Pharma 28 18 72,953 46 41,939 NOVO NORDISK Denmark Healthcare & Pharma 55 19 71,232 74 26,841 GAZPROM Russia Energy -19 20 70,511 1 169,712
1) Nationality based on country of domicile 2) Industry based on PwC Germany industry classification
TMT: Technology, Media and Telecommunications Data source: Bloomberg, 2013
PwC
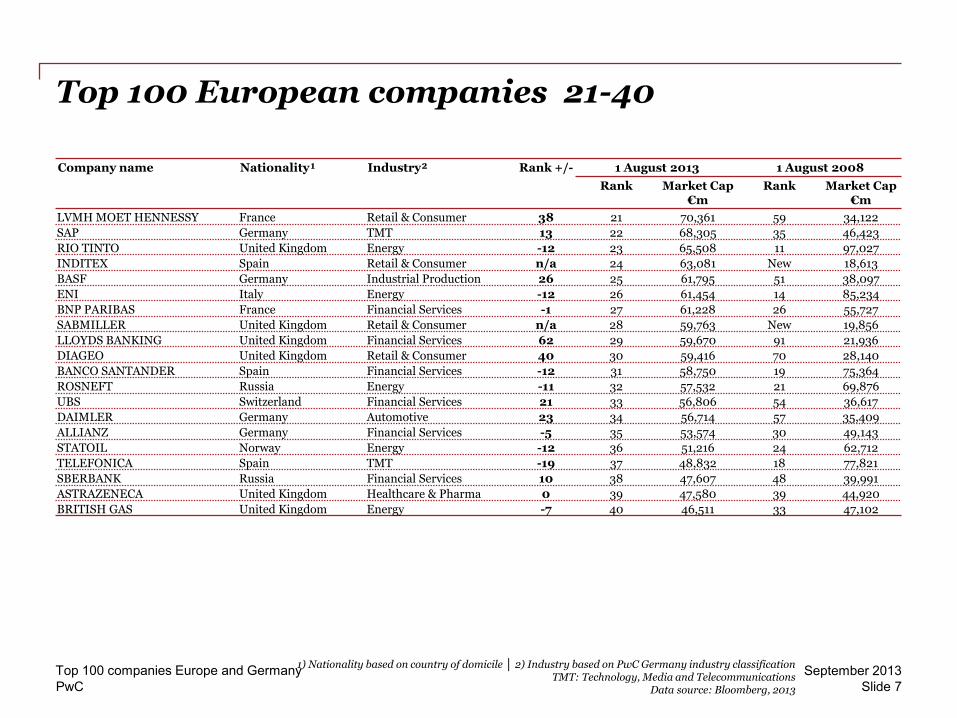
Top 100 European companies 21-40
September 2013 Top 100 companies Europe and Germany Slide 7
Company name Nationality¹ Industry² Rank +/- 1 August 2013 1 August 2008 Rank Market Cap
€m Rank Market Cap
€m LVMH MOET HENNESSY France Retail & Consumer 38 21 70,361 59 34,122 SAP Germany TMT 13 22 68,305 35 46,423 RIO TINTO United Kingdom Energy -12 23 65,508 11 97,027 INDITEX Spain Retail & Consumer n/a 24 63,081 New 18,613 BASF Germany Industrial Production 26 25 61,795 51 38,097 ENI Italy Energy -12 26 61,454 14 85,234 BNP PARIBAS France Financial Services -1 27 61,228 26 55,727 SABMILLER United Kingdom Retail & Consumer n/a 28 59,763 New 19,856 LLOYDS BANKING United Kingdom Financial Services 62 29 59,670 91 21,936 DIAGEO United Kingdom Retail & Consumer 40 30 59,416 70 28,140 BANCO SANTANDER Spain Financial Services -12 31 58,750 19 75,364 ROSNEFT Russia Energy -11 32 57,532 21 69,876 UBS Switzerland Financial Services 21 33 56,806 54 36,617 DAIMLER Germany Automotive 23 34 56,714 57 35,409 ALLIANZ Germany Financial Services -5 35 53,574 30 49,143 STATOIL Norway Energy -12 36 51,216 24 62,712 TELEFONICA Spain TMT -19 37 48,832 18 77,821 SBERBANK Russia Financial Services 10 38 47,607 48 39,991 ASTRAZENECA United Kingdom Healthcare & Pharma 0 39 47,580 39 44,920 BRITISH GAS United Kingdom Energy -7 40 46,511 33 47,102
1) Nationality based on country of domicile │ 2) Industry based on PwC Germany industry classification TMT: Technology, Media and Telecommunications
Data source: Bloomberg, 2013
PwC
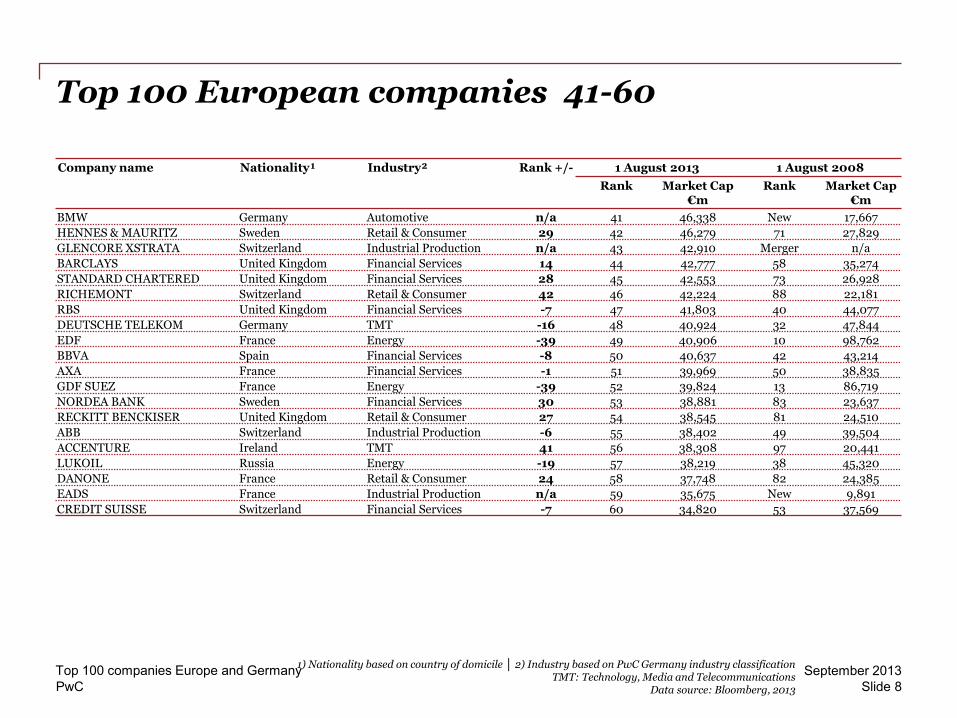
Top 100 European companies 41-60
September 2013 Top 100 companies Europe and Germany Slide 8
Company name Nationality¹ Industry² Rank +/- 1 August 2013 1 August 2008 Rank Market Cap
€m Rank Market Cap
€m BMW Germany Automotive n/a 41 46,338 New 17,667 HENNES & MAURITZ Sweden Retail & Consumer 29 42 46,279 71 27,829 GLENCORE XSTRATA Switzerland Industrial Production n/a 43 42,910 Merger n/a BARCLAYS United Kingdom Financial Services 14 44 42,777 58 35,274 STANDARD CHARTERED United Kingdom Financial Services 28 45 42,553 73 26,928 RICHEMONT Switzerland Retail & Consumer 42 46 42,224 88 22,181 RBS United Kingdom Financial Services -7 47 41,803 40 44,077 DEUTSCHE TELEKOM Germany TMT -16 48 40,924 32 47,844 EDF France Energy -39 49 40,906 10 98,762 BBVA Spain Financial Services -8 50 40,637 42 43,214 AXA France Financial Services -1 51 39,969 50 38,835 GDF SUEZ France Energy -39 52 39,824 13 86,719 NORDEA BANK Sweden Financial Services 30 53 38,881 83 23,637 RECKITT BENCKISER United Kingdom Retail & Consumer 27 54 38,545 81 24,510 ABB Switzerland Industrial Production -6 55 38,402 49 39,504 ACCENTURE Ireland TMT 41 56 38,308 97 20,441 LUKOIL Russia Energy -19 57 38,219 38 45,320 DANONE France Retail & Consumer 24 58 37,748 82 24,385 EADS France Industrial Production n/a 59 35,675 New 9,891 CREDIT SUISSE Switzerland Financial Services -7 60 34,820 53 37,569
1) Nationality based on country of domicile │ 2) Industry based on PwC Germany industry classification TMT: Technology, Media and Telecommunications
Data source: Bloomberg, 2013
PwC
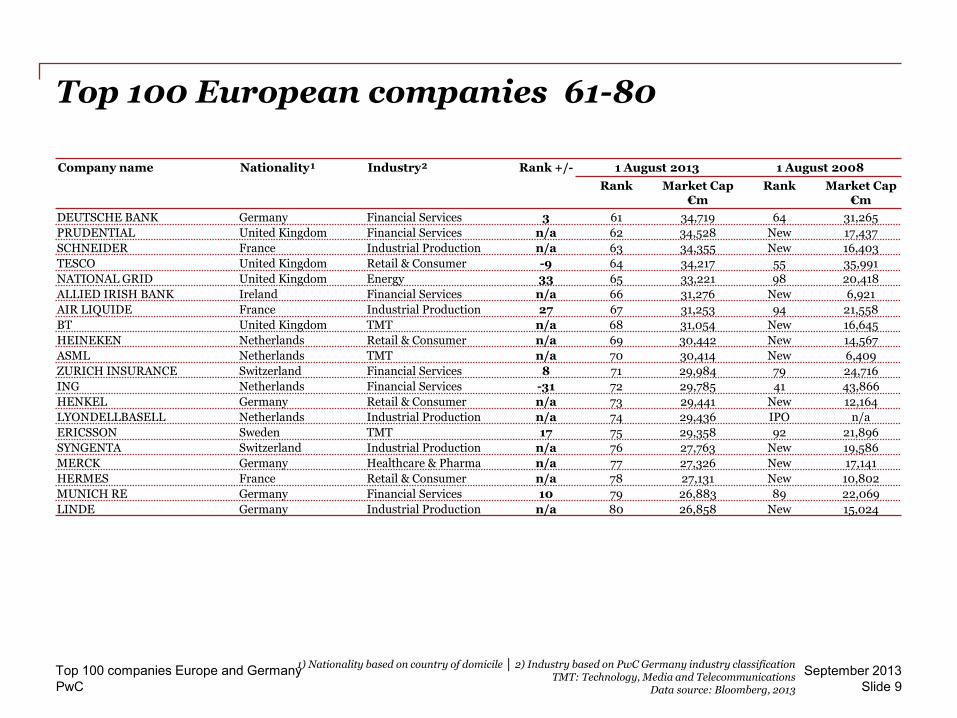
Top 100 European companies 61-80
September 2013 Top 100 companies Europe and Germany Slide 9
Company name Nationality¹ Industry² Rank +/- 1 August 2013 1 August 2008 Rank Market Cap
€m Rank Market Cap
€m DEUTSCHE BANK Germany Financial Services 3 61 34,719 64 31,265 PRUDENTIAL United Kingdom Financial Services n/a 62 34,528 New 17,437 SCHNEIDER France Industrial Production n/a 63 34,355 New 16,403 TESCO United Kingdom Retail & Consumer -9 64 34,217 55 35,991 NATIONAL GRID United Kingdom Energy 33 65 33,221 98 20,418 ALLIED IRISH BANK Ireland Financial Services n/a 66 31,276 New 6,921 AIR LIQUIDE France Industrial Production 27 67 31,253 94 21,558 BT United Kingdom TMT n/a 68 31,054 New 16,645 HEINEKEN Netherlands Retail & Consumer n/a 69 30,442 New 14,567 ASML Netherlands TMT n/a 70 30,414 New 6,409 ZURICH INSURANCE Switzerland Financial Services 8 71 29,984 79 24,716 ING Netherlands Financial Services -31 72 29,785 41 43,866 HENKEL Germany Retail & Consumer n/a 73 29,441 New 12,164 LYONDELLBASELL Netherlands Industrial Production n/a 74 29,436 IPO n/a ERICSSON Sweden TMT 17 75 29,358 92 21,896 SYNGENTA Switzerland Industrial Production n/a 76 27,763 New 19,586 MERCK Germany Healthcare & Pharma n/a 77 27,326 New 17,141 HERMES France Retail & Consumer n/a 78 27,131 New 10,802 MUNICH RE Germany Financial Services 10 79 26,883 89 22,069 LINDE Germany Industrial Production n/a 80 26,858 New 15,024
1) Nationality based on country of domicile │ 2) Industry based on PwC Germany industry classification TMT: Technology, Media and Telecommunications
Data source: Bloomberg, 2013
PwC
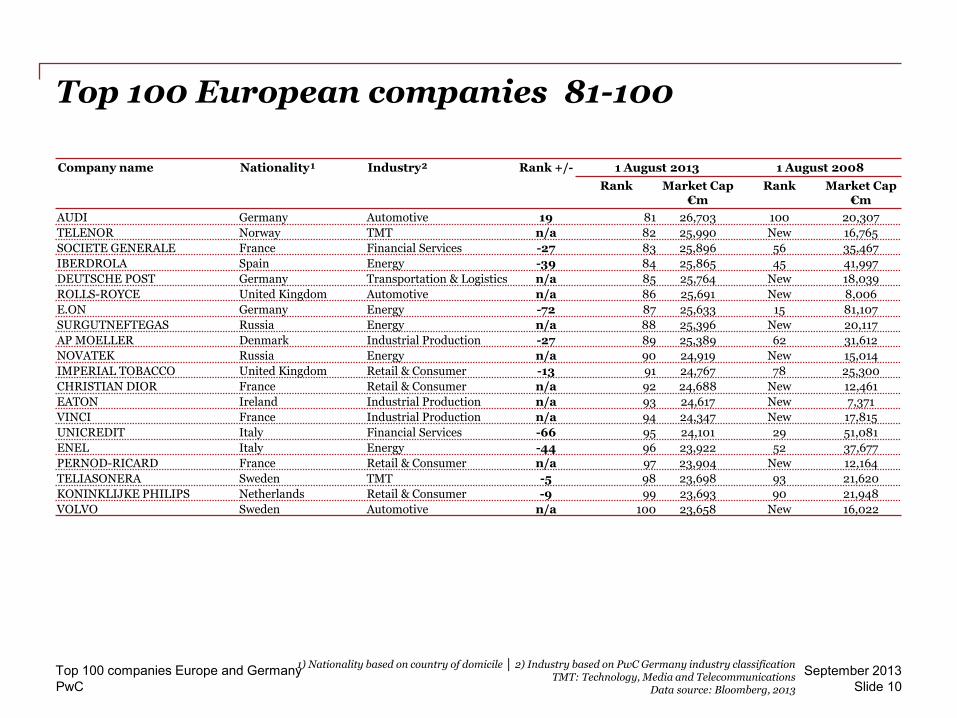
Top 100 European companies 81-100
September 2013 Top 100 companies Europe and Germany Slide 10
Company name Nationality¹ Industry² Rank +/- 1 August 2013 1 August 2008 Rank Market Cap
€m Rank Market Cap
€m AUDI Germany Automotive 19 81 26,703 100 20,307 TELENOR Norway TMT n/a 82 25,990 New 16,765 SOCIETE GENERALE France Financial Services -27 83 25,896 56 35,467 IBERDROLA Spain Energy -39 84 25,865 45 41,997 DEUTSCHE POST Germany Transportation & Logistics n/a 85 25,764 New 18,039 ROLLS-ROYCE United Kingdom Automotive n/a 86 25,691 New 8,006 E.ON Germany Energy -72 87 25,633 15 81,107 SURGUTNEFTEGAS Russia Energy n/a 88 25,396 New 20,117 AP MOELLER Denmark Industrial Production -27 89 25,389 62 31,612 NOVATEK Russia Energy n/a 90 24,919 New 15,014 IMPERIAL TOBACCO United Kingdom Retail & Consumer -13 91 24,767 78 25,300 CHRISTIAN DIOR France Retail & Consumer n/a 92 24,688 New 12,461 EATON Ireland Industrial Production n/a 93 24,617 New 7,371 VINCI France Industrial Production n/a 94 24,347 New 17,815 UNICREDIT Italy Financial Services -66 95 24,101 29 51,081 ENEL Italy Energy -44 96 23,922 52 37,677 PERNOD-RICARD France Retail & Consumer n/a 97 23,904 New 12,164 TELIASONERA Sweden TMT -5 98 23,698 93 21,620 KONINKLIJKE PHILIPS Netherlands Retail & Consumer -9 99 23,693 90 21,948 VOLVO Sweden Automotive n/a 100 23,658 New 16,022
1) Nationality based on country of domicile │ 2) Industry based on PwC Germany industry classification TMT: Technology, Media and Telecommunications
Data source: Bloomberg, 2013
PwC
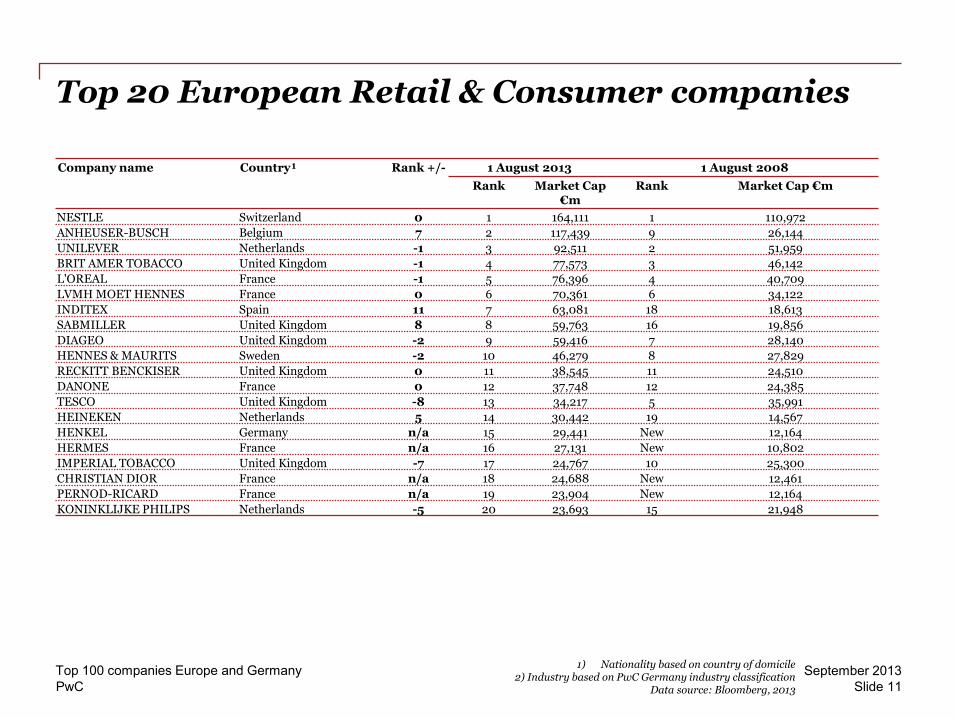
Top 20 European Retail & Consumer companies
September 2013 Top 100 companies Europe and Germany Slide 11
1) Nationality based on country of domicile 2) Industry based on PwC Germany industry classification
Data source: Bloomberg, 2013
Company name Country¹ Rank +/- 1 August 2013 1 August 2008 Rank Market Cap
€m Rank Market Cap €m
NESTLE Switzerland 0 1 164,111 1 110,972 ANHEUSER-BUSCH Belgium 7 2 117,439 9 26,144 UNILEVER Netherlands -1 3 92,511 2 51,959 BRIT AMER TOBACCO United Kingdom -1 4 77,573 3 46,142 L'OREAL France -1 5 76,396 4 40,709 LVMH MOET HENNES France 0 6 70,361 6 34,122 INDITEX Spain 11 7 63,081 18 18,613 SABMILLER United Kingdom 8 8 59,763 16 19,856 DIAGEO United Kingdom -2 9 59,416 7 28,140 HENNES & MAURITS Sweden -2 10 46,279 8 27,829 RECKITT BENCKISER United Kingdom 0 11 38,545 11 24,510 DANONE France 0 12 37,748 12 24,385 TESCO United Kingdom -8 13 34,217 5 35,991 HEINEKEN Netherlands 5 14 30,442 19 14,567 HENKEL Germany n/a 15 29,441 New 12,164 HERMES France n/a 16 27,131 New 10,802 IMPERIAL TOBACCO United Kingdom -7 17 24,767 10 25,300 CHRISTIAN DIOR France n/a 18 24,688 New 12,461 PERNOD-RICARD France n/a 19 23,904 New 12,164 KONINKLIJKE PHILIPS Netherlands -5 20 23,693 15 21,948
PwC
Germany Top 100
Ranked by market capitalisation
September 2013 Top 100 companies Europe and Germany Slide 12
PwC
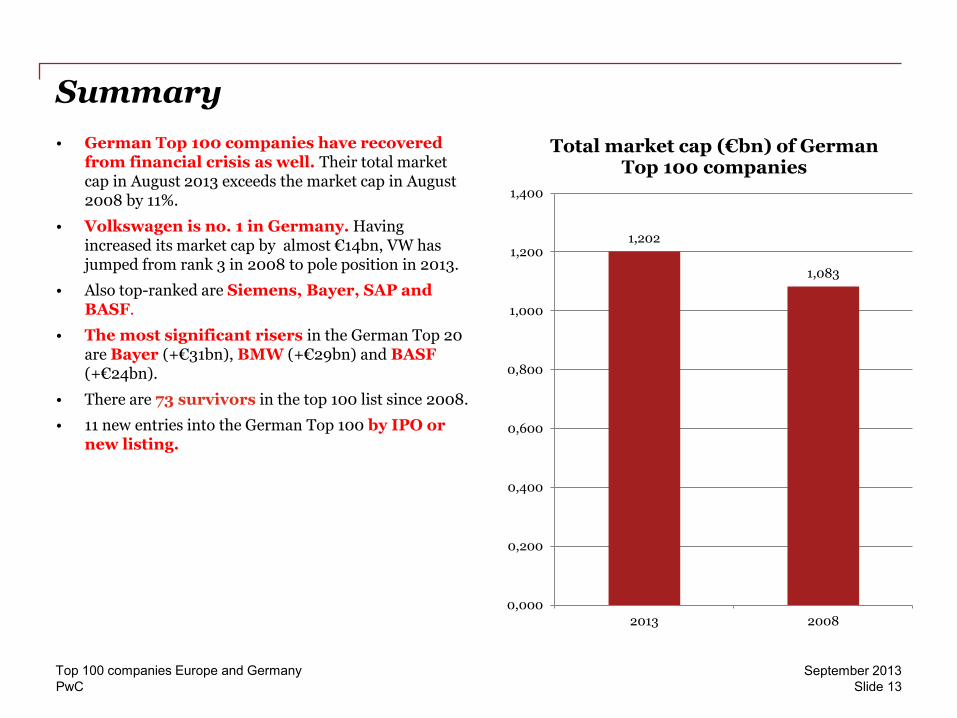
Summary • German Top 100 companies have recovered
from financial crisis as well. Their total market cap in August 2013 exceeds the market cap in August 2008 by 11%.
• Volkswagen is no. 1 in Germany. Having increased its market cap by almost €14bn, VW has jumped from rank 3 in 2008 to pole position in 2013.
• Also top-ranked are Siemens, Bayer, SAP and BASF.
• The most significant risers in the German Top 20 are Bayer (+€31bn), BMW (+€29bn) and BASF (+€24bn).
• There are 73 survivors in the top 100 list since 2008.
• 11 new entries into the German Top 100 by IPO or new listing.
September 2013 Top 100 companies Europe and Germany Slide 13
1,202
1,083
0,000
0,200
0,400
0,600
0,800
1,000
1,200
1,400
2013 2008
Total market cap (€bn) of German Top 100 companies
PwC
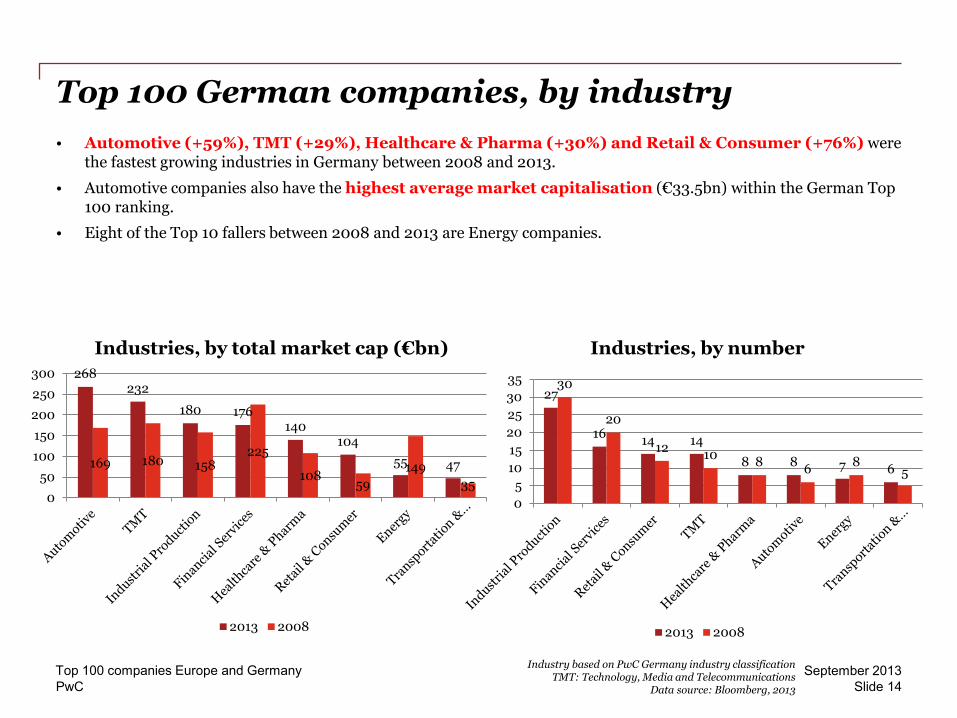
Top 100 German companies, by industry • Automotive (+59%), TMT (+29%), Healthcare & Pharma (+30%) and Retail & Consumer (+76%) were
the fastest growing industries in Germany between 2008 and 2013.
• Automotive companies also have the highest average market capitalisation (€33.5bn) within the German Top 100 ranking.
• Eight of the Top 10 fallers between 2008 and 2013 are Energy companies.
September 2013 Top 100 companies Europe and Germany Slide 14
Industry based on PwC Germany industry classification TMT: Technology, Media and Telecommunications
Data source: Bloomberg, 2013
Industries, by number Industries, by total market cap (€bn)
27
16 14 14
8 8 7 6
30
20
12 10 8 6 8 5
05
101520253035
2013 2008
268 232
180 176 140
104 55 47 169 180 158
225
108 59
149 35
050
100150200250300
2013 2008
PwC
Top 100 German companies 1-20
September 2013 Top 100 companies Europe and Germany Slide 15
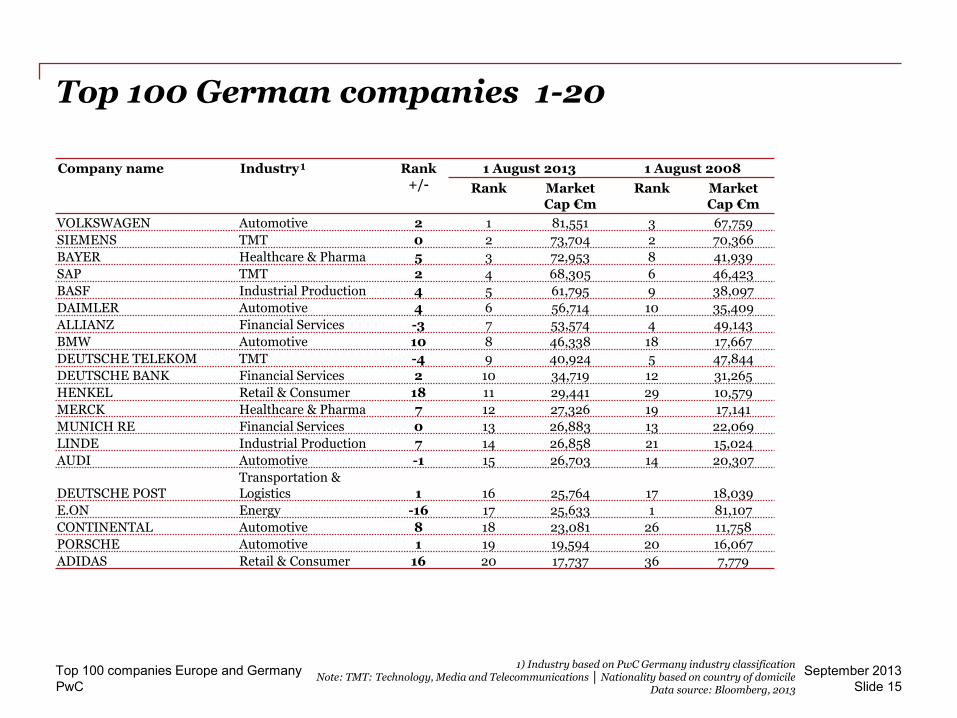
Company name Industry¹ Rank +/-
1 August 2013 1 August 2008 Rank Market
Cap €m Rank Market
Cap €m VOLKSWAGEN Automotive 2 1 81,551 3 67,759 SIEMENS TMT 0 2 73,704 2 70,366 BAYER Healthcare & Pharma 5 3 72,953 8 41,939 SAP TMT 2 4 68,305 6 46,423 BASF Industrial Production 4 5 61,795 9 38,097 DAIMLER Automotive 4 6 56,714 10 35,409 ALLIANZ Financial Services -3 7 53,574 4 49,143 BMW Automotive 10 8 46,338 18 17,667 DEUTSCHE TELEKOM TMT -4 9 40,924 5 47,844 DEUTSCHE BANK Financial Services 2 10 34,719 12 31,265 HENKEL Retail & Consumer 18 11 29,441 29 10,579 MERCK Healthcare & Pharma 7 12 27,326 19 17,141 MUNICH RE Financial Services 0 13 26,883 13 22,069 LINDE Industrial Production 7 14 26,858 21 15,024 AUDI Automotive -1 15 26,703 14 20,307
DEUTSCHE POST Transportation & Logistics 1 16 25,764 17 18,039
E.ON Energy -16 17 25,633 1 81,107 CONTINENTAL Automotive 8 18 23,081 26 11,758 PORSCHE Automotive 1 19 19,594 20 16,067 ADIDAS Retail & Consumer 16 20 17,737 36 7,779
1) Industry based on PwC Germany industry classification Note: TMT: Technology, Media and Telecommunications │ Nationality based on country of domicile
Data source: Bloomberg, 2013
PwC
Top 100 German companies 21-40
September 2013 Top 100 companies Europe and Germany Slide 16
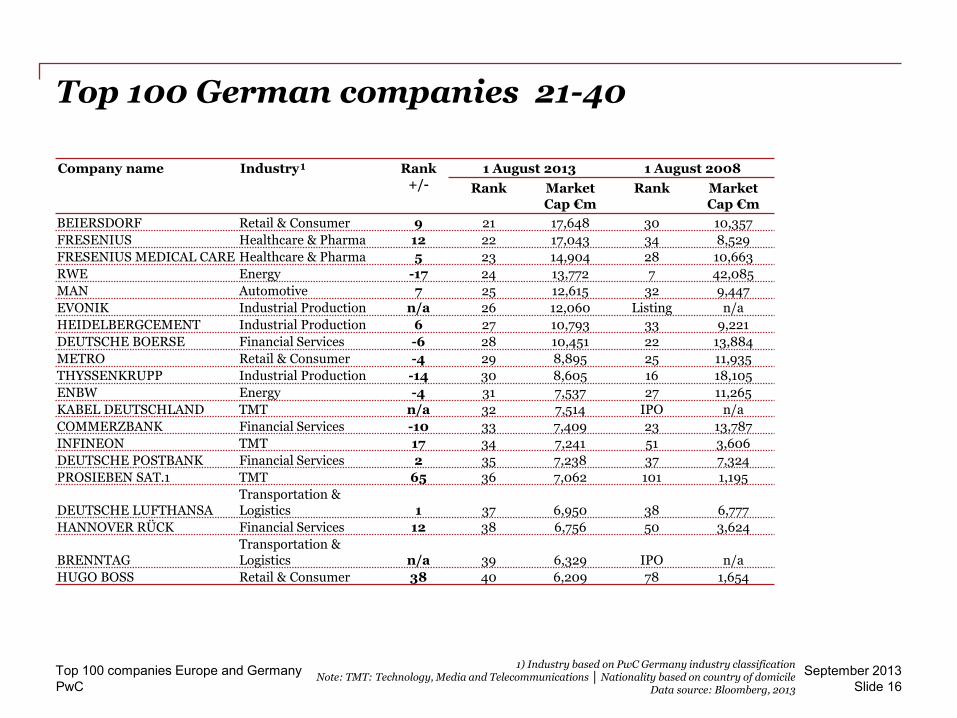
Company name Industry¹ Rank +/-
1 August 2013 1 August 2008 Rank Market
Cap €m Rank Market
Cap €m BEIERSDORF Retail & Consumer 9 21 17,648 30 10,357 FRESENIUS Healthcare & Pharma 12 22 17,043 34 8,529 FRESENIUS MEDICAL CARE Healthcare & Pharma 5 23 14,904 28 10,663 RWE Energy -17 24 13,772 7 42,085 MAN Automotive 7 25 12,615 32 9,447 EVONIK Industrial Production n/a 26 12,060 Listing n/a HEIDELBERGCEMENT Industrial Production 6 27 10,793 33 9,221 DEUTSCHE BOERSE Financial Services -6 28 10,451 22 13,884 METRO Retail & Consumer -4 29 8,895 25 11,935 THYSSENKRUPP Industrial Production -14 30 8,605 16 18,105 ENBW Energy -4 31 7,537 27 11,265 KABEL DEUTSCHLAND TMT n/a 32 7,514 IPO n/a COMMERZBANK Financial Services -10 33 7,409 23 13,787 INFINEON TMT 17 34 7,241 51 3,606 DEUTSCHE POSTBANK Financial Services 2 35 7,238 37 7,324 PROSIEBEN SAT.1 TMT 65 36 7,062 101 1,195
DEUTSCHE LUFTHANSA Transportation & Logistics 1 37 6,950 38 6,777
HANNOVER RÜCK Financial Services 12 38 6,756 50 3,624
BRENNTAG Transportation & Logistics n/a 39 6,329 IPO n/a
HUGO BOSS Retail & Consumer 38 40 6,209 78 1,654
1) Industry based on PwC Germany industry classification Note: TMT: Technology, Media and Telecommunications │ Nationality based on country of domicile
Data source: Bloomberg, 2013
PwC
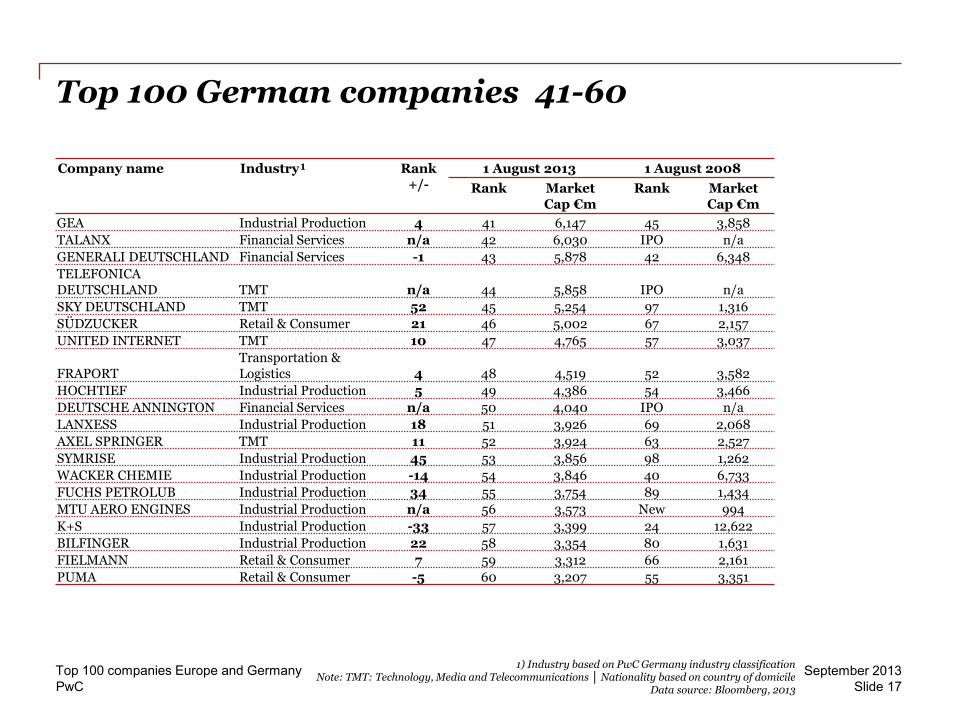
Top 100 German companies 41-60
September 2013 Top 100 companies Europe and Germany Slide 17
Company name Industry¹ Rank +/-
1 August 2013 1 August 2008 Rank Market
Cap €m Rank Market
Cap €m GEA Industrial Production 4 41 6,147 45 3,858 TALANX Financial Services n/a 42 6,030 IPO n/a GENERALI DEUTSCHLAND Financial Services -1 43 5,878 42 6,348 TELEFONICA DEUTSCHLAND TMT n/a 44 5,858 IPO n/a SKY DEUTSCHLAND TMT 52 45 5,254 97 1,316 SÜDZUCKER Retail & Consumer 21 46 5,002 67 2,157 UNITED INTERNET TMT 10 47 4,765 57 3,037
FRAPORT Transportation & Logistics 4 48 4,519 52 3,582
HOCHTIEF Industrial Production 5 49 4,386 54 3,466 DEUTSCHE ANNINGTON Financial Services n/a 50 4,040 IPO n/a LANXESS Industrial Production 18 51 3,926 69 2,068 AXEL SPRINGER TMT 11 52 3,924 63 2,527 SYMRISE Industrial Production 45 53 3,856 98 1,262 WACKER CHEMIE Industrial Production -14 54 3,846 40 6,733 FUCHS PETROLUB Industrial Production 34 55 3,754 89 1,434 MTU AERO ENGINES Industrial Production n/a 56 3,573 New 994 K+S Industrial Production -33 57 3,399 24 12,622 BILFINGER Industrial Production 22 58 3,354 80 1,631 FIELMANN Retail & Consumer 7 59 3,312 66 2,161 PUMA Retail & Consumer -5 60 3,207 55 3,351
1) Industry based on PwC Germany industry classification Note: TMT: Technology, Media and Telecommunications │ Nationality based on country of domicile
Data source: Bloomberg, 2013
PwC
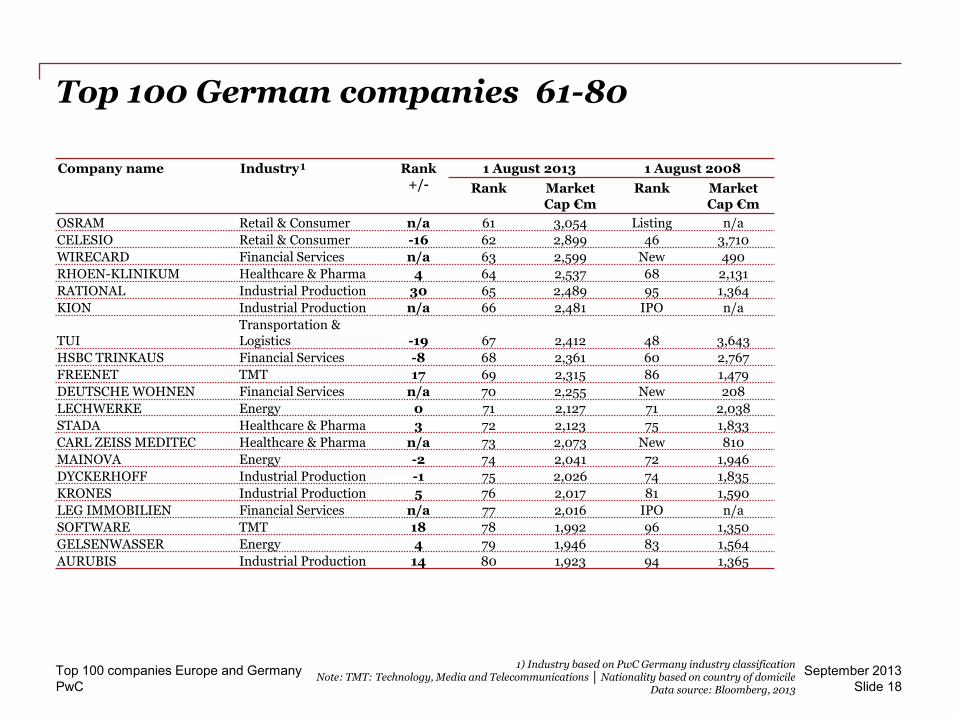
Top 100 German companies 61-80
September 2013 Top 100 companies Europe and Germany Slide 18
Company name Industry¹ Rank +/-
1 August 2013 1 August 2008 Rank Market
Cap €m Rank Market
Cap €m OSRAM Retail & Consumer n/a 61 3,054 Listing n/a CELESIO Retail & Consumer -16 62 2,899 46 3,710 WIRECARD Financial Services n/a 63 2,599 New 490 RHOEN-KLINIKUM Healthcare & Pharma 4 64 2,537 68 2,131 RATIONAL Industrial Production 30 65 2,489 95 1,364 KION Industrial Production n/a 66 2,481 IPO n/a
TUI Transportation & Logistics -19 67 2,412 48 3,643
HSBC TRINKAUS Financial Services -8 68 2,361 60 2,767 FREENET TMT 17 69 2,315 86 1,479 DEUTSCHE WOHNEN Financial Services n/a 70 2,255 New 208 LECHWERKE Energy 0 71 2,127 71 2,038 STADA Healthcare & Pharma 3 72 2,123 75 1,833 CARL ZEISS MEDITEC Healthcare & Pharma n/a 73 2,073 New 810 MAINOVA Energy -2 74 2,041 72 1,946 DYCKERHOFF Industrial Production -1 75 2,026 74 1,835 KRONES Industrial Production 5 76 2,017 81 1,590 LEG IMMOBILIEN Financial Services n/a 77 2,016 IPO n/a SOFTWARE TMT 18 78 1,992 96 1,350 GELSENWASSER Energy 4 79 1,946 83 1,564 AURUBIS Industrial Production 14 80 1,923 94 1,365
1) Industry based on PwC Germany industry classification Note: TMT: Technology, Media and Telecommunications │ Nationality based on country of domicile
Data source: Bloomberg, 2013
PwC
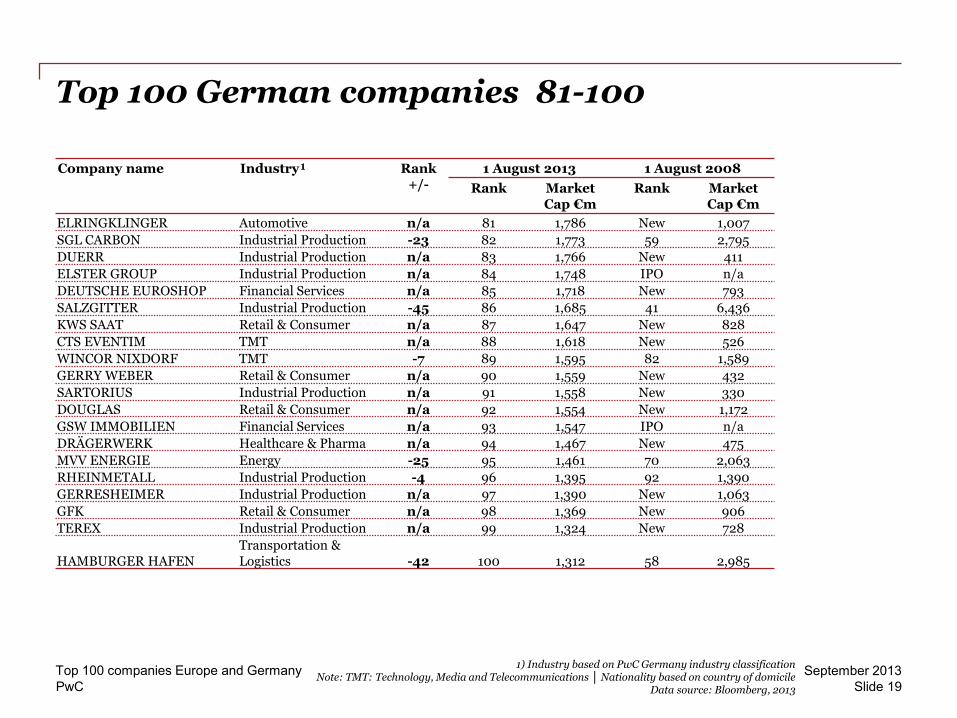
Top 100 German companies 81-100
September 2013 Top 100 companies Europe and Germany Slide 19
Company name Industry¹ Rank +/-
1 August 2013 1 August 2008 Rank Market
Cap €m Rank Market
Cap €m ELRINGKLINGER Automotive n/a 81 1,786 New 1,007 SGL CARBON Industrial Production -23 82 1,773 59 2,795 DUERR Industrial Production n/a 83 1,766 New 411 ELSTER GROUP Industrial Production n/a 84 1,748 IPO n/a DEUTSCHE EUROSHOP Financial Services n/a 85 1,718 New 793 SALZGITTER Industrial Production -45 86 1,685 41 6,436 KWS SAAT Retail & Consumer n/a 87 1,647 New 828 CTS EVENTIM TMT n/a 88 1,618 New 526 WINCOR NIXDORF TMT -7 89 1,595 82 1,589 GERRY WEBER Retail & Consumer n/a 90 1,559 New 432 SARTORIUS Industrial Production n/a 91 1,558 New 330 DOUGLAS Retail & Consumer n/a 92 1,554 New 1,172 GSW IMMOBILIEN Financial Services n/a 93 1,547 IPO n/a DRÄGERWERK Healthcare & Pharma n/a 94 1,467 New 475 MVV ENERGIE Energy -25 95 1,461 70 2,063 RHEINMETALL Industrial Production -4 96 1,395 92 1,390 GERRESHEIMER Industrial Production n/a 97 1,390 New 1,063 GFK Retail & Consumer n/a 98 1,369 New 906 TEREX Industrial Production n/a 99 1,324 New 728
HAMBURGER HAFEN Transportation & Logistics -42 100 1,312 58 2,985
1) Industry based on PwC Germany industry classification Note: TMT: Technology, Media and Telecommunications │ Nationality based on country of domicile
Data source: Bloomberg, 2013
PwC
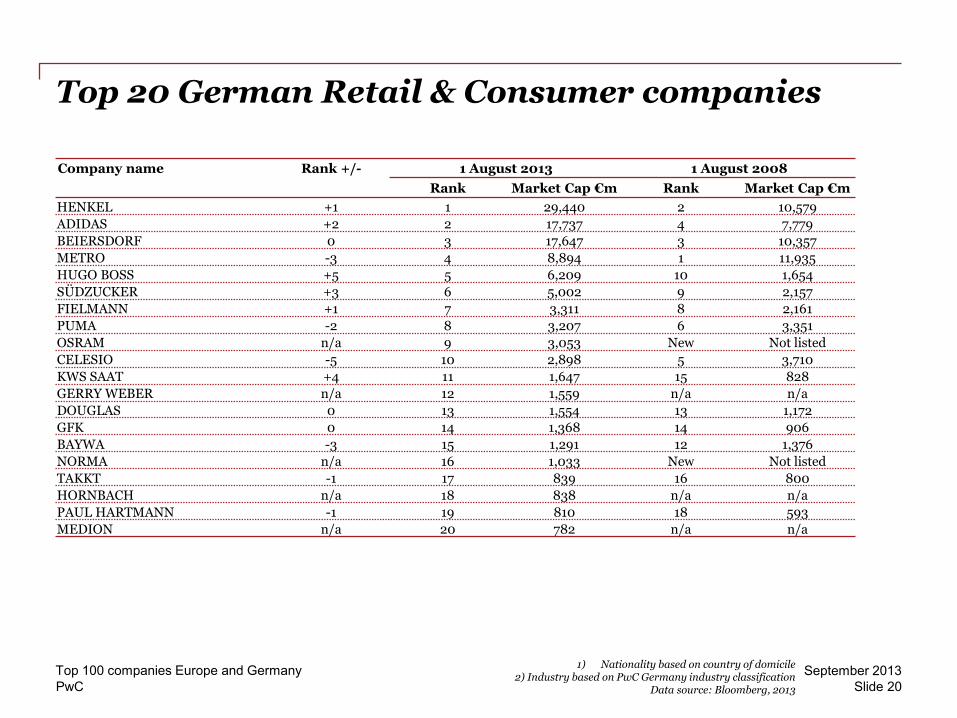
Top 20 German Retail & Consumer companies
September 2013 Top 100 companies Europe and Germany Slide 20
1) Nationality based on country of domicile 2) Industry based on PwC Germany industry classification
Data source: Bloomberg, 2013
Company name Rank +/- 1 August 2013 1 August 2008 Rank Market Cap €m Rank Market Cap €m
HENKEL +1 1 29,440 2 10,579 ADIDAS +2 2 17,737 4 7,779 BEIERSDORF 0 3 17,647 3 10,357 METRO -3 4 8,894 1 11,935 HUGO BOSS +5 5 6,209 10 1,654 SÜDZUCKER +3 6 5,002 9 2,157 FIELMANN +1 7 3,311 8 2,161 PUMA -2 8 3,207 6 3,351 OSRAM n/a 9 3,053 New Not listed CELESIO -5 10 2,898 5 3,710 KWS SAAT +4 11 1,647 15 828 GERRY WEBER n/a 12 1,559 n/a n/a DOUGLAS 0 13 1,554 13 1,172 GFK 0 14 1,368 14 906 BAYWA -3 15 1,291 12 1,376 NORMA n/a 16 1,033 New Not listed TAKKT -1 17 839 16 800 HORNBACH n/a 18 838 n/a n/a PAUL HARTMANN -1 19 810 18 593 MEDION n/a 20 782 n/a n/a