pw3390€¦ · thank you for purchasing the hioki pw3390 power analyzer. to obtain maximum...
TRANSCRIPT

PW3390 PO
WER
AN
ALYZER
Instruction Manual * 6 0 0 4 9 9 3 9 0 *
EN
Instruction Manual
POWER ANALYZER
PW3390
Feb. 2017 Edition 1PW3390A961-00 17-02H
PW3390-01PW3390-02PW3390-03
p. 4Be sure to read this manual before using the instrument.
Safety Notes
Troubleshooting
Maintenance and ServiceError Indication
p. 207p. 210
When using the instrument for the first time
Names and Functions of PartsBasic OperationsMeasurement Preparations
p. 15p. 18
Usage Notes p. 7
p. 25


Contents
i
1
2
3
4
5
6
7
8
9
10
12付録
索
11
ContentsIntroduction.................................................................................1
Confirming Package Contents....................................................2
Safety Notes...............................................................................4
Usage Notes...............................................................................7
Chapter 1Overview __________________________________ 11
1.1 Product Overview.............................................................. 11
1.2 Features............................................................................ 12
1.3 Operating Overview .......................................................... 14
Chapter 2Names and Functions of Parts, Basic Operations & Screens__________________ 15
2.1 Names and Functions of Parts.......................................... 15
2.2 Basic Operations............................................................... 18
2.3 Display Items and Screen Types ...................................... 192.3.1 Common Display Items .......................................................... 19
2.3.2 Measurement Screen ............................................................. 20
2.3.3 Screen Types ......................................................................... 21
Chapter 3Measurement Preparations___________________ 25
3.1 Operations in general........................................................ 25
3.2 Initial Instrument Preparations .......................................... 26
3.3 Pre-Operation Inspection .................................................. 28
3.4 Connecting the Power Cord.............................................. 29
3.5 Grounding the Instrument's Functional Earth (when measuring in noisy environments) .........................29
3.6 Connecting the Voltage Measurement Cables ................. 30
3.7 Connecting the Current Sensors....................................... 30
3.8 Turning the Power On and Off .......................................... 33
3.9 Selecting the Wiring Mode ................................................ 34
3.10 Setting the Current Sensors.............................................. 38
引PW3390A961-00

Contents
ii
3.11 Attaching to the Lines to be Measured and Zero Adjustment .......................................................................................... 41
3.12 Verifying Correct Wiring (Connection Check) ................... 43
Chapter 4Viewing Measurement Values_________________45
4.1 Measurement Value Display Procedure ........................... 45
4.2 Viewing Power Measurements, and Changing the Measurement Configuration ............................................. 494.2.1 Displaying Power Measurements .......................................... 49
4.2.2 Selecting Ranges................................................................... 51
4.2.3 Selecting the Sync Source..................................................... 56
4.2.4 Frequency Measurement Settings ......................................... 58
4.2.5 Selecting the Rectification Method......................................... 60
4.2.6 Setting Scaling (when using VT(PT) or CT)........................... 61
4.2.7 Setting the Low-Pass Filter .................................................... 62
4.3 Integration Value Observation .......................................... 634.3.1 Displaying Integration Values ................................................ 63
4.3.2 Setting the Integration Mode.................................................. 66
4.3.3 Manual Integration Method .................................................... 67
4.3.4 Integration Combined with Timing Control............................. 69
4.4 Viewing Harmonic Measurement Values.......................... 724.4.1 Displaying the Harmonic Bar Graph ...................................... 72
4.4.2 Displaying the Harmonic List ................................................. 74
4.4.3 Displaying Harmonic Vectors................................................. 75
4.4.4 Selecting the Harmonic Sync Source .................................... 77
4.4.5 Selecting the THD Calculation Method.................................. 78
4.5 Viewing Waveforms .......................................................... 794.5.1 Displaying Waveforms ........................................................... 79
4.5.2 Resizing Waveforms.............................................................. 82
4.6 Viewing Noise Measurement Values (FFT Function) ....... 834.6.1 Displaying Noise Voltage and Current ................................... 83
4.6.2 Setting the Sampling Frequency and Points.......................... 85
4.6.3 Setting the Minimum Noise Frequency.................................. 86
4.6.4 Measurement Channel and Window Function Settings ......... 88
4.7 Viewing Efficiency and Loss Measurement Values .......... 894.7.1 Displaying Efficiency and Loss .............................................. 89
4.7.2 Selecting the Calculation Formula ......................................... 90
4.7.3 Measurement Examples ........................................................ 91
4.8 Viewing Motor Measurement Values (Model PW3390-03 only) ................................................. 94

Contents
iii
付録
索
12
3
4
5
6
7
8
9
10
11
11
12
13
4
5
6
7
4.8.1 Motor Input Settings ............................................................... 96
4.8.2 Measuring Motor Electrical Angle......................................... 102
4.8.3 Detecting the Motor Rotation Direction................................. 104
Chapter 5Operating Functions _______________________ 105
5.1 Timing Control Functions ................................................ 105
5.2 Averaging Function ......................................................... 108
5.3 Data Hold and Peak Hold Functions............................... 1105.3.1 Data Hold Function............................................................... 110
5.3.2 Peak Hold Function .............................................................. 111
5.4 X-Y Plot Function ............................................................ 113
5.5 Delta Star Transform Function........................................ 114
5.6 Selecting the Calculation Method ................................... 116
Chapter 6Changing System Settings __________________ 117
6.1 Initializing the Instrument (System Reset) ...................... 120
6.2 Factory Default Settings.................................................. 121
Chapter 7Data Saving and File Operations _____________ 123
7.1 Inserting and Removing Storage Media.......................... 124
7.2 The File Operation Screen.............................................. 126
7.3 Media Formatting ............................................................ 127
7.4 Saving Operations .......................................................... 128
7.5 Measurement Data Saving ............................................. 1297.5.1 Manually Saving Measurement Data.................................... 129
7.5.2 Auto-Saving Measurement Data .......................................... 131
7.5.3 Selecting Measurement Items to Save................................. 134
7.6 Saving Waveform Data ................................................... 136
7.7 Saving Screen Capture Images ...................................... 136
7.8 Saving Setting Configurations......................................... 137
7.9 Reloading Setting Configurations ................................... 139
7.10 File and Folder Operations ............................................. 1407.10.1 Creating Folders ................................................................... 140
7.10.2 Copying Files and Folders.................................................... 141
7.10.3 Deleting Files and Folders.................................................... 143
7.10.4 Renaming Files and Folders................................................. 144
引

Contents
iv
Chapter 8Connecting External Devices ________________145
8.1 Connecting Multiple PW3390 (Synchronized Measurements) ....................................... 145
8.2 Controlling Integration with External Signals .................. 149
8.3 Using Analog and Waveform D/A Output ....................... 1528.3.1 Connecting Application-Specific Devices to the Instrument. 152
8.3.2 Output Item Selection .......................................................... 154
8.3.3 Output Level ........................................................................ 157
8.3.4 D/A Output Examples .......................................................... 158
8.4 Connecting the Instrument to a LR8410 Link-compatible Logger .......... 1608.4.1 Configuring and Connecting the Adapter............................. 161
8.5 Using the Motor Testing.................................................. 162
Chapter 9Operation with a Computer __________________165
9.1 Control and Measurement via Ethernet ("LAN") Interface 1669.1.1 LAN Settings and Network Environment
Configuration 166
9.1.2 Instrument Connection......................................................... 168
9.2 Remote Control of the Instrument by Internet Browser .. 1709.2.1 Connecting to the Instrument............................................... 170
9.2.2 Operating Procedure ........................................................... 171
9.3 Control and Measurement via USB Interface ................. 1729.3.1 Connecting to the Instrument............................................... 172
9.3.2 After Connecting .................................................................. 172
9.4 Control and Measurement via RS-232C Interface.......... 1739.4.1 Connecting to the Instrument............................................... 173
9.4.2 Setting the RS-232C Communications Speed..................... 174
Chapter 10Specifications_____________________________177
10.1 General Specifications.................................................... 177
10.2 Basic Specifications........................................................ 178
10.3 Functions Specifications ................................................. 187
10.4 Setting Specifications ..................................................... 192
10.5 Measurement Item Details.............................................. 195
10.6 Calculation Formula Specifications................................. 198
10.7 Wiring System Diagram Specifications........................... 205

Contents
v
12
3
4
5
6
7
8
9
10
12
13
4
5
6
7
AppendixInde
11
Chapter 11Maintenance and Service ___________________ 207
11.1 Cleaning.......................................................................... 207
11.2 Trouble Shooting............................................................. 207
11.3 Error Indication................................................................ 210
11.4 Disposing of the Instrument ............................................ 214
Appendix__________________________________A1Appendix 1 Block Diagram .......................................................... A1
Appendix 2 Measurement Data Saving Format........................... A2
Appendix 3 Physical Illustration................................................... A5
Appendix 4 Rack Mounting.......................................................... A6
Index ______________________________________ i
x

Contents
vi

Introduction
1
Thank you for purchasing the Hioki PW3390 Power Analyzer. To obtain maximum performance from theproduct, please read this manual first, and keep it handy for future reference.To measure current, the power analyzer requires clamp-on current probes or AC/DC current probes(Options, (p. 3), afterwards referred to generically as “current sensors”). See your current sensor’sinstruction manual for details.
Trademarks• CompactFlash is a registered trademark of Sandisk Corporation (USA).• Windows is a registered trademark of Microsoft Corporation in the United States and/or other coun-
tries.• Adobe and Reader are either registered trademarks or trademarks of Adobe Systems Incorporated in
the United States and/or other countries.• Bluetooth® is a registered trademark of Bluetooth SIG, Inc.(USA). The trademark is used by HIOKI
E.E. CORPORATION under license.• ParaniTM is a trademark of Sena Technologies Inc.
Product model numbers
Introduction
Product model number Feature
PW3390-01 Basic model (model without motor analysis and D/A output)
PW3390-02 Model with D/A output
PW3390-03 Model with motor analysis and D/A output
Rear side Product model number

Confirming Package Contents
2
When you receive the instrument, inspect it carefully to ensure that no damage occurred during shipping.In particular, check the accessories, panel switches, and connectors. If damage is evident, or if it fails tooperate according to the specifications, contact your authorized Hioki distributor or reseller.
Confirm that these contents are provided.
Main instrument PW3390 Power Analyzer ×1
Accessories Grounded power cord ×1
USB cable ×1
D-Sub connector ×1 (used only with the D/A output function-equipped PW3390-02 or PW3390-03)
Instruction manual ×1
Measurement guide ×1
Input cable labels (to identify voltage cords and current sensor channels) ×2
Please attach to the instrument before use. (p. 26)
Confirming Package Contents

Confirming Package Contents
3
OptionsCurrent measurement options• 9272-05 Clamp On Sensor (20 A/200 A AC)• CT6841-05 AC/DC Current Probe (20 A)• CT6843-05 AC/DC Current Probe (200 A)• CT6844-05 AC/DC Current Probe (500 A, φ20 mm)• CT6845-05 AC/DC Current Probe (500 A, φ50 mm)• CT6846-05 AC/DC Current Probe (1000 A)• PW9100-03 AC/DC Current Box (50 A, 3 channels)• PW9100-04 AC/DC Current Box (50 A, 4 channels)• CT6862-05 AC/DC Current Sensor (50 A)• CT6863-05 AC/DC Current Sensor (200 A)• 9709-05 AC/DC Current Sensor (500 A)• CT6865-05 AC/DC Current Sensor (1000 A)• CT9557 Sensor Unit (sensor power supply with 4-channel addition function)• CT9904 Connection Cable (for connecting the CT9557)• CT9900 Conversion Cable (PL23 receptacle/ME15W plug)• Special-order: 5 A rated version of the PW9100• Special-order: 2000 A pass-through sensor• Special-order: High-accuracy version of the 9709-05• Special-order: High-accuracy version of the CT6862-05• Special-order: High-accuracy version of the CT6863-05• CT7742 AC/DC Auto-Zero Current Sensor (2000 A)• CT7642 AC/DC Current Sensor (2000 A)• CT7044 AC Flexible Current Sensor (6000 A, φ100 mm)• CT7045 AC Flexible Current Sensor (6000 A, φ180 mm)• CT7046 AC Flexible Current Sensor (6000 A, φ254 mm)• CT9920 Conversion Cable (PL14 receptacle/ME15W plug)
Voltage measurement options• L9438-50 Voltage Cord (banana/banana; 1 each red and black; with alligator clips/3 m)• L1000 Voltage Cord (banana/banana; 1 each red, yellow, blue, and gray; 4 black; with alligator clips/3
m)• L4931 Extension Cable Set (banana/banana; 1 each red and black/1.5 m, for extending the L9438-50
or L1000)• 9243 Grabber Clip (1 each red and black)• PW9000 Wiring Adapter (for three-phase 3-wire)• PW9001 Wiring Adapter (for three-phase 4-wire)
Connection options• L9217 Connection Cord (isolated BNC/isolated BNC; 1.6 m; for motor analysis input)
See "8.5 Using the Motor Testing" (p. 162)• Special-order: D/A Output Cable (25-pin D-sub/male BNC; 16-channel conversion/2.5 m)• 9683 Connection Cable (for synchronization /1.5 m)
See "Connecting Multiple PW3390 (Synchronized Measurements)" (p. 145)• 9642 LAN Cable (5 m, with straight/cross conversion connector)• 9637 RS-232C Cable (9pin-9pin/1.8 m, crossing cable)
Other options• 9728 PC Card 512M (512 MB CF Card + Adapter)• 9729 PC Card 1G (1 GB CF Card + Adapter)• 9830 PC Card 2G (2 GB CF Card + Adapter)• 9794 Carrying Case (PW3390 dedicated hard type)• Special-order: Rack mounting hardware (EIA/JIS)

Safety Notes
4
This manual contains information and warnings essential for safe operation of the product and for main-taining it in safe operating condition. Before using the product, be sure to carefully read the followingsafety notes.
The following symbols in this manual indicate the relative importance of cautions and warnings.
Safety Notes
This instrument is designed to comply with IEC 61010 Safety Standards, and hasbeen thoroughly tested for safety prior to shipment. However, mishandling dur-ing use could result in injury or death, as well as damage to the instrument. How-ever, using the instrument in a way not described in this manual may negate theprovided safety features.Be certain that you understand the instructions and precautions in the manualbefore use. We disclaim any responsibility for accidents or injuries not resultingdirectly from instrument defects.
Safety symbols
Indicates cautions and hazards. When the symbol is printed on the instrument, refer toa corresponding topic in the Instruction Manual.
Indicates a grounding terminal.
Indicates the ON side of the power switch.
Indicates the OFF side of the power switch.
Indicates that incorrect operation presents a significant hazard that could result in seri-ous injury or death to the user.
Indicates that incorrect operation presents a significant hazard that could result in seri-ous injury or death to the user.
Indicates that incorrect operation presents a possibility of injury to the user or damageto the product.
Advisory items related to performance or correct operation of the product.
Symbols for various standards
Indicates the Waste Electrical and Electronic Equipment Directive (WEEE Directive) inEU member states.
Indicates that the product conforms to regulations set out by the EU Directive.

Safety Notes
5
AccuracyWe define measurement tolerances in terms of f.s. (full scale), rdg. (reading) and dgt. (digit) values, withthe following meanings:
Other symbols
Symbols in this manual
Indicates the prohibited action.
(p. ) Indicates the location of reference information.
Indicates quick references for operation and remedies for troubleshooting.
* Indicates that descriptive information is provided below.
[ ] Menus, commands, dialogs, buttons in a dialog, and other names on the screenand the keys are indicated in brackets.
CURSOR(Bold character)
Bold characters within the text indicate operating key labels.
Windows Unless otherwise specified, “Windows” represents Windows 7, Windows 8, or Win-dows 10.
Dialog Dialog box represents a Windows dialog box.
Mouse action terminologyClick: Press and quickly release the left button of the mouse.
Right-click: Press and quickly release the right button of the mouse.
Double click: Quickly click the left button of the mouse twice.
Drag: While holding down the left button of the mouse, move the mouse and then releasethe left button to deposit the chosen item in the desired position.
Activate: Click on a window on the screen to activate that window.
f.s. (maximum display value or scale length)The maximum displayable value or scale length. This is usually the name of thecurrently selected range.
rdg. (reading or displayed value)The value currently being measured and indicated on the measuring instrument.
dgt. (resolution)The smallest displayable unit on a digital measuring instrument, i.e., the input valuethat causes the digital display to show a "1" as the least-significant digit.

Safety Notes
6
This instrument complies with CAT II (1000 V) and CAT III (600 V) safety requirements.To ensure safe operation of measurement instruments, IEC 61010 establishes safety standards for vari-ous electrical environments, categorized as CAT II to CAT IV, and called measurement categories.
Using a measurement instrument in an environment designated with a higher-numbered category than that forwhich the instrument is rated could result in a severe accident, and must be carefully avoided.Use of a measurement instrument that is not CAT-rated in CAT II to CAT IV measurement applicationscould result in a severe accident, and must be carefully avoided.
Measurement categories
CAT II Primary electrical circuits in equipment connected to an AC electrical outlet by a powercord (portable tools, household appliances, etc.) CAT II covers directly measuring electri-cal outlet receptacles.CAT II covers directly measuring electrical outlet receptacles.
CAT III Primary electrical circuits of heavy equipment (fixed installations) connected directly to thedistribution panel, and feeders from the distribution panel to outlets.
CAT IV The circuit from the service drop to the service entrance, and to the power meter and pri-mary overcurrent protection device (distribution panel).

Usage Notes
7
Follow these precautions to ensure safe operation and to obtain the full benefits of the various functions.
Before using the instrument the first time, verify that it operates normally to ensure that the no damageoccurred during storage or shipping. If you find any damage, contact your authorized Hioki distributor orreseller.
Installing• The instrument should be operated only with the bottom or rear side downwards.• Vents (on the right side of the instrument) must not be obstructed.
Usage Notes
Before use
Before using the instrument, make sure that the insulation on the voltage cordsis undamaged and that no bare conductors are improperly exposed. Using theinstrument in such conditions could cause an electric shock, so contact yourauthorized Hioki distributor or reseller for replacements.
Instrument installation
Avoid the following locations that could cause an accident or damage to the instrument.
Exposed to direct sunlightExposed to high temperature
In the presence of corrosive or explosive gases
Exposed to liquidsExposed to high humidity or condensation
Exposed to strong electromag-netic fieldsNear electromagnetic radiators
Exposed to high levels of par-ticulate dust
Near induction heating systems(e.g., high-frequency induction heating systems and IH cooking utensils)
Subject to vibration
50 mm or more
50 mm or more

Usage Notes
8
Handling the instrument
To avoid electric shock, do not remove the instrument's case. The internal com-ponents of the instrument carry high voltages and may become very hot duringoperation.
• If the instrument exhibits abnormal operation or display during use, review the infor-mation in Troubleshooting section "11.2 Trouble Shooting" (p. 207) and Error Indi-cations section "11.3 Error Indication" (p. 210) before contacting your authorizedHioki distributor or reseller.
• To avoid damage to the instrument, protect it from physical shock when transportingand handling. Be especially careful to avoid physical shock from dropping.
• To move the instrument, first disconnect all cables, remove any CF card and USBmemory, and carry it by the handle.
• Do not apply heavy downward pressure with the stand extended. The stand couldbe damaged. See "Using the Handle as a Stand" (p. 15)
This instrument may cause interference if used in residential areas. Such use must beavoided unless the user takes special measures to reduce electromagnetic emissionsto prevent interference to the reception of radio and television broadcasts.

Usage Notes
9
Handling the cords and current sensors
Connect the current sensors or voltage cords to the instrument first, and then tothe active lines to be measured. Observe the following to avoid electric shockand short circuits.
• Do not allow the voltage cord clips to touch two wires at the same time. Nevertouch the edge of the metal clips.
• When the current sensor is opened, do not allow the metal part of the clamp totouch any exposed metal, or to short between two lines, and do not use overbare conductors.
• To avoid short circuits and potentially life-threatening hazards, never attach thecurrent sensor to a circuit that operates at more than the maximum rated volt-age to earth (See your current sensor's instruction manual for its maximum rat-ings.)
• Current sensor and voltage cables should only be connected to the secondaryside of a breaker, so the breaker can prevent an accident if a short circuitoccurs. Connections should never be made to the primary side of a breaker,because unrestricted current flow could cause a serious accident if a short cir-cuit occurs.
• Connect only those voltage cables necessary for measurement.
• To prevent an electric shock accident, confirm that the white or red portion(insulation layer) inside the cable is not exposed. If a color inside the cable isexposed, do not use the cable.
In order to use the CT6862 AC/DC Current Sensor, the line to be measured mustbe temporarily disconnected.To avoid shock and short circuits, turn off the power to lines to be measuredbefore making connections to terminals to be measured and turning on theinstrument.
• To avoid electric shock and short-circuit accidents, use only the specified voltagecord to connect the instrument input terminals to the circuit to be tested.
• For safety reasons, when taking measurements, only use the optional voltage cord.Avoid stepping on or pinching cables, which could damage the cable insulation.
• To avoid breaking the cables, do not bend or pull them.• To avoid damaging the power cord, grasp the plug, not the cord, when unplugging it
from the power outlet.• Keep the cables well away from heat sources, as bare conductors could be exposed
if the insulation melts.• Be careful to avoid dropping the current sensors or otherwise subjecting them to
mechanical shock, which could damage the mating surfaces of the core andadversely affect measurement.
• Be careful when handling the cords, since the conductor being measured maybecome very hot.
• When disconnecting the connector, be sure to release the lock before pulling off theconnector. Forcibly pulling the connector without releasing the lock, or pulling on thecable, can damage the connector.
• To prevent damage to the instrument and current sensors, never connect or discon-nect a sensor while the power is on, or while the sensor is clamped around a con-ductor.

Usage Notes
10
Before connecting measurement cables
• Do not use the instrument with circuits that exceed its ratings or specifica-tions. Doing so may damage the instrument or cause it to become hot, result-ing in bodily injury.
• Never exceed a current sensor’s input current rating. Doing so could destroythe instrument and cause personal injury.
• Before turning the instrument on, make sure the source voltage matches thatindicated on the instrument's power connector. Connection to an impropersupply voltage may damage the product and present an electrical hazard.
• To avoid electrical accidents and to maintain the safety specifications of thisinstrument, connect the power cord provided only to an outlet.
For safety reasons, disconnect the power cord when the instrument is not used.
Before connecting to the lines to be measured
To avoid electrical hazards and damage to the instrument, do not apply voltageexceeding the rated maximum to the external input terminals.
• To avoid electrical accidents, confirm that all connections are secure. Theincreased resistance of loose connections can lead to overheating and fire.
• Ensure that the input does not exceed the maximum input voltage or current toavoid instrument damage, short-circuiting and electric shock resulting fromheat building.
• When the power is turned off, do not apply voltage or current to the voltage input termi-nals, current input terminals, or current sensors. Doing so may damage the instrument.
• Note that the instrument may be damaged if the applied voltage or current exceedsthe measurement range.
While measuring
If an abnormality such as smoke, strange sound or offensive smell occurs, stopmeasuring immediately, disconnect from the measurement lines, turn off theinstrument, unplug the power cord from the outlet, and undo any changes to thewiring. Contact your authorized Hioki distributor or reseller as soon as possible.Continuing to use the instrument may result in fire or electric shock.

1.1 Product Overview
11
1
Chapter 1 O
verview
• High precision and stability ensure highly reproducible power measurements
• Electrical phase angle measurements necessary for motor analysis
• Measure motor efficiency by connecting with a high precision torque meter or encoder.
• Simultaneously measure AC and DC power.
• Separately measure power input, sold, consumed, and regenerated using the DC mode and the cur-rent and integrated power (electrical energy) in RMS mode.
• Save long-term measurement data to high-capacity storage media.
• Easily measure inverter secondary power on site.
• Simultaneously measure primary and secondary inverter power.
• Measure inverter noise.
Overview Chapter 1
1.1 Product Overview
The Hioki PW3390 Power Analyzer is a high-precision, broad-range instrument for measuring electricalpower from DC to inverter frequencies. Four input channels are provided to support single- and three-phase inverter motor system measurements.
For developing and evaluating high efficiency inverter motors
For developing and evaluating alternative energy sources such as solar, wind power, and fuel cells
For inverter motor maintenance

1.2 Features
12
• Four isolated voltage and current input channels are provided to support simultaneous multi-system measurements such as inverter primary and secondary power.
• Measure power system wiring configurations from single-phase to three-phase, four-wire.
• Broad frequency range (0.5 Hz to 5 kHz fundamental) supports DC to inverter frequencies.
• Basic accuracy is ±0.04% rdg. ±0.05% f.s. at DC and from 0.5 Hz to 200 kHz.
• Precise measurements over a broad range of inverter carrier frequencies: ±0.2% rdg. ±0.1% f.s.at 10 kHz, and ±1.5% rdg. ±0.5% f.s. at 100 kHz.
• This function utilizes virtual oversampling, a new technology, to correct current sensor phaseerrors at a resolution of 0.01°, allowing accurate measurement of the high-frequency, low-power-factor power components contained in inverter output switching frequencies.
• While maintaining high accuracy, power measurements and harmonic analysis updates every50 ms.
• During low-frequency measurements, data is automatically updated in sync with frequency, sono refresh (data update rate) switching is needed when changing from low to high rotationrates.
• Simultaneously measure RMS, mean, AC and DC components, and fundamental waveforms.
• Perform harmonic analysis up to the 100th order and inverter noise (FFT) analysis up to 100kHz.
• Display high-speed waveforms sampled at up to 500 kS/s.
• Perform multifaceted analysis with X-Y graph functions.
• Simultaneously analyzes harmonics and noise while performing integration and displayingwaveforms.
• Select from various AC and AC/DC clamp-on current probes with ranges from 20 A to 1000 A.
• Measure high currents with high precision using clamp-on current sensor probes.
• Clamp-on current probes eliminate the need for problematic direct contact with wiring.
• In-phase effects on inverter measurements are greatly reduced by isolating current sensorsfrom the measurement objects.
1.2 FeaturesSupports multiple power system configurations
High accuracy over a broad range
Current sensor phase correction function (standard feature)
Provides both fast data processing and high accuracy
Extensive data analysis functions are included as standard features
Simultaneous analysis of all parameters
Supports measurements with both easy-to-use clamp probes and high-precision penetrating probes

1.1 Product Overview
13
1
Chapter 1 O
verview
• Small and light weight (approx. 4.6 kg), with a convenient carrying handle (p. 15).
• Rack mountable in 170 mm (EIA 4U) vertical space.
• Includes 100 Mbps Ethernet and USB 2.0 High Speed communications interfaces.
• Supports high-speed data communication systems.
• Provides a dedicated front-panel USB port and CF card slot for removable storage devices.
• Supports high-capacity media for high-speed data storage.
• With the instrument connected to a computer by LAN, USB cable, or RS-232C, use the PCapplication program to acquire data on the computer and control the instrument remotely.Download the PC application program from Hioki's website. (http://www.hioki.com)
• Even without the PC application program, the same operations can be performed using abrowser to access the HTTP server function.
• The vector display avoids wiring mistakes by confirming even complicated three-phase wiring.
• Measure with up to 8 instruments simultaneously.
• Slave instruments measure and record data in synchronization with the master instrument.
• Using the PC application program, synchronously acquire and record data on up to 8 instru-ments.
• Motor power can be determined by measuring torque meter output and rotation rate.
• Supports both analog DC and frequency-output-type torque measurement inputs.
• Supports both analog DC and rotation pulse outputs for measurement inputs.
• Supports encoder Z-phase signals for phase measurements with standard encoder pulses.
• Outputs up to 16 analog measurement parameters on 16 D/A output channels.
• Voltage and current waveforms sampled at 500 kHz in the waveform output mode providesafely isolated voltage and current waveforms for other waveform measuring instruments.
• Includes a 9-inch color TFT LCD.
• Easily view waveforms and graphs on the wide-screen 800 × 480 dot display.
Single-unit instrument ideal for portable as well as rack-mountapplications
Variety of interfaces are equipped in standard
PC application program provides remote control and data acquisition (p. 165)
Wiring confirmation function avoids wiring mistakes (p. 43)
Multi-instrument synchronization capability supports additional measurement channels (p. 145)
Prepared for motor evaluation options (p. 162)
D/A output option for waveform output (p. 152)
Easy-to-see color LCD (p. 15)

1.3 Operating Overview
14
Be sure to read "Usage Notes" (p. 7) before measuring.Follow the procedures below to perform measurements. Data saving and analysis on the computer canbe performed as necessary.
1.3 Operating Overview
Saving
Turning Power Off
Analyzing Saved Data on a Computer
Installing the Instrument
Initial Instrument Preparations
Stops automatically at the specified stop time.
Press the key to
force stop.
After pressing
saving starts at the speci-
fied start time.
Connect the instrument to a computer with the sup-plied USB cable or an Ethernet cable and use the dedicated PC application program to transfer data to the computer for analysis. This also enables remote operation and control of the instrument.
See 3.2 ( p.26)
See 3.3 ( p.28)
See 3.4 ( p.29) to 3.8 ( p.33)
See 3.9 ( p.34) to 3.12 ( p.43)
See Chapter 7 ( p.123)
See "Instrument installation" (p. 7)
See Chapter 9 ( p.165)
Press the key, and select display contents
with the and F keys.See "2.2 Basic Operations" (p. 18)
Viewing Measurement Values
Press the .
Manual saving
Pre-Operation Inspection
Connecting Cables and Probes, and Turning Power On
Configuring wiring settings and sensor settings, and checking the wiring
See Section 3.8 ( p.33)
Always perform these checks before connect-ing, and when turning the power on.
See Chapter 4 ( p.45)
For high-precision measurements, allow at least30 minutes warm-up after power-on before exe-cuting zero adjustment.
Configure current sensor phase correction tofacilitate more precise measurement.Always execute zero adjustment before con-necting to measurement objects.
Press to save
for a specified time
span.
Save timer control
Press to start.
Save the specified time span.
Press to stop.
When the timer and real-time control are set, stops at the specified time.
Stops automatically when the specified time has elapsed.
Press the key to
force stop.
Save interval controlSave in realtimecontrol

2.1 Names and Functions of Parts
15
2
Chapter 2 N
ames and F
unctions of Parts, B
asic Operations &
Screens
Names and Functions of Parts, Basic Operations & Screens Chapter 2
2.1 Names and Functions of Parts
DisplayDisplays the Measurement,Setting, or File Operationscreen.See p. 19
CF card interfaceInsert a CF card.See p. 124
Front
F key (Function key)Select and change display contents and settings.See p. 18
Operation keysSee p. 16
HandleUse to carry the instrument, and fold it down to serve as a stand.See Bottom part of this page
Power switchTurns the instrument onand off.See p. 33
USB memory interfaceConnect a USB flash drive storage device.See p. 123
Using the Handle as a Stand
Press PressKeep on pressing
Rotate the handle to the click point.
1 2

2.1 Names and Functions of Parts
16
SHIFT key(Lit when running)Activates alternate key func-tions.
START/STOP key(Lit when running)Starts and stops integration and saving operations.To restart integration and saving: Press the DATA RESET key to reset integration values, then press this key. (Press the START/STOP key without reset-ting the integrated value if you wish to add the inte-gration result to the previous one.)
SAVE keySaves data to the storage media.See 7.5.2 (p.131)(Screen Capture)Press the SAVE key while holding the SHIFT key to cap-ture a screen image to the specified storage media. (p. 136)
ESC keyCancels the last change to a setting, and returns it to its original state.(Key-lock)Hold for three seconds to toggle the key lock. The key lock state is indicated at the top of the screen (p. 19).
Operation keys
DATA RESET keyResets the integration values.See 4.3.1 (p.63)
0 ADJ keyPerforms zero adjustment and current sensor degaussing.See 3.11 (p.41)
HOLD key(Lit when running)Toggles the peak-hold function.See 5.3 (p.110)
RANGE keys• The U + and – keys change
the voltage measurementrange, and the I + and –keys change the currentmeasurement range.
• Pressing the AUTO keyactivates Auto Ranging (p.52).
• These keys also set the low-pass filter (p. 62) and thelower measurement limit set-ting (p. 58).
PAGE key• Changes the screen page.• Allows you to configure
averaging (p. 108).
MENU keys (Screen selection)Press a key to select a screen (the lit key indicates the current selection).
Displays the Measurement screen for viewing measurement values. Voltage and cur-rent ranges can be selected, and low-pass filter settings can be changed.(p. 21)
Displays the Setting screen for setting measurement criteria, wiring mode (phase sys-tems), wiring check and system environment configuration.(p. 22)
Displays the File Operation screen for performing file operations on data saved to storage media, and selecting data file formats.(p. 23)
ENTER keyAccepts selections and changes to settings.
CURSOR keyMove the cursors.
• When the key lock function is enabled, all other key operations are disabled.• The key lock state is retained even when power is off.

2.1 Names and Functions of Parts
17
2
Chapter 2 N
ames and F
unctions of Parts, B
asic Operations &
Screens
Right side
Ethernet interface jackFor LAN connection with an Ethernet cable.See p. 168
Sync interfaceFor synchronizing cables, as needed.See p. 145
VentKeep clear of obstructions.See p. 7
RS-232C interfaceFor RS-232C cable connection, as needed.See p. 173
USB portFor the supplied USB cable, as needed.See p. 172
Rear side
Voltage input terminalsConnect Hioki-specified voltage measurement cables.See p. 30,
"Usage Notes" (p. 7)
Current input terminalsConnect an Hioki-specified cur-rent sensor.See p. 30,
"Usage Notes" (p. 7)
Power inlet Connect the supplied power cord.See p. 29,
"Usage Notes" (p. 7)
Output terminalConnect the supplied D-sub plug (PW3390-02 [model with D/A output] and PW3390-03 [mod-el with motor analysis and D/A output] only).See p. 152
CH A torque signal input BNC jackConnect the Hioki L9217 BNC connection cable to this terminal (PW3390-03 [model with motor anal-ysis and D/A output] only). See p. 162,
"Usage Notes" (p. 7)
CH B and CH Z rotation signalinput BNC jacksConnect the Hioki L9217 Connection Cord to these terminals (PW3390-03 [mod-el with motor analysis and D/A output] only). See p. 162,
"Usage Notes" (p. 7)
Serial No.This is the instrument’s serialnumber.
Functional ground terminalConnect this terminal to a clean common ground to suppress elec-trical noise when measuring in an electrically noisy environment.See p. 29

2.2 Basic Operations
18
2.2 Basic Operations
Set any channel to [AUTO].
1 All channels are set to[AUTO].
3Select [All CH Set]2
To select a display screen
Press , , or to display the corre-sponding screen.See p. 21 to p. 23
Help commentDescribes the object at the currentcursor position (only on Setting andFile Operations screens).
Using [All CH Set](For example, to enable auto-ranging on all channels.)
CH1 CH2 CH3 CH4
To select the displayed screen page
Press the keys to change.See p. 21, p. 23
To select and change display contents and settingsPress one of the F keys to select and change display con-tents and settings. The displayed function labels depend onthe currently displayed screen.Special Setting Items
All CH Set Select to apply the same setting to all channels.
NextThis appears when more than six setting items are available. Press F6 to display the function labels of the additional items.

2.3 Display Items and Screen Types
19
2
Chapter 2 N
ames and F
unctions of Parts, B
asic Operations &
Screens
These items are displayed on every screen.
2.3 Display Items and Screen Types
2.3.1 Common Display Items
Operating State Indicators 45 Key-Lock Indicator2Displayed Page
Interface Indicators Storage Media Indicators
3
Displayed Screen
Time Display
Level indicators for the CF card and USB memorystick. The used storage space is indicated in yel-low, and it turns to red when the media is 95% full.
1 Storage Media Indicators
2 Key-Lock Indicator
Lights to indicate Key Lock is active
(keys are locked), after holding the key for three seconds.
3 Interface Indicators
Lights when the instrument is con-nected to a computer by USB cable(and the computer is on).
Lights when the instrument is con-nected to a LAN.
Displays the current date and time.To set the Clock: (p. 119)
4 Time Display
5 Operating State Indicators
Indicates that the instrument is in theintegration standby state.
Indicates integration is in progress.
Indicates integration is stopped.
Indicates Data Hold is active.
Indicates Peak Hold is active.
1

2.3 Display Items and Screen Types
20
These display items appear only on the Measurement screen.
2.3.2 Measurement Screen
Current peak over rangeVoltage peak over range
Sync Unlocked
Peak Over display indicators1
Wiring mode2 Voltage range3 Current range3Average5
Low-pass filter4
Lower measurement limit
6
Sync source7Harmonic sync source
8Δ-Y Transform9
These indicators appear in red at the bottom ofeach channel page tab (CH1 to CH4). These indi-cate (from the left) when voltage and current peaksranges are exceeded (p. 48), and when synchroni-zation is unlocked (p. 57).
Indicates the selected wiring mode (p. 34). The wir-ing mode (phase system selection) must be set tomatch actual measurement connections.
• Indicate the voltage and current range settings.• The settings are made by the RANGE keys (p. 52). • When the range has been set manually, [MANU]
appears.• When the auto-ranging is enabled, [AUTO]
appears (p. 51).
Indicates the low-pass filter setting (p. 62).
To change the setting, hold the key while
pressing an LPF key (one of the left-most or
RANGE keys).
1 Peak Over display indicators
2 Wiring mode
3 Voltage range/Current range
4 Low-pass filter
Indicates the averaging setting state (p. 108).
To change the setting, hold the key while
pressing the AVG key either or of thePAGE key.
Displays the lower measurement limit setting (p. 58).
To change the setting, hold the key whilepressing a LOW FREQ key (one of the right-most
or RANGE keys).
Indicates the synchronization source signal thatdetermines the period (between zero crossings)used as the basis for all calculations.(p. 56) The set-ting is made on the Input Settings page of the Set-tings screen.
Indicates the synchronization signal source used forharmonic measurements.(p. 77) The setting is madeon the Input Settings page of the Settings screen.
Indicates whether Δ-Y transform is enabled or dis-abled (ON/OFF)(p. 114). The setting is made on theInput Settings page of the Settings screen.
5 Average
6 Lower measurement limit
7 Sync source
8 Harmonic sync source
9 Δ-Y Transform

2.3 Display Items and Screen Types
21
2
Chapter 2 N
ames and F
unctions of Parts, B
asic Operations &
Screens
2.3.3 Screen Types
[CH1 to CH4]
[Efficiency]
[Motor]
[XY Graph]
[Wave + Noise]
[Vector]
[Select]
Measurement Screen (Press the key to display)
Press the keys to change the screen page as follows.
This screen displays measurement values.
This page displays measured harmonic voltage, harmonic current, and harmonic power on channels 1 to 4 as numerical values and as vectors.
This page displays measured values for the motor analysis.
This page displays an X-Y graph of measurement parameters selected for horizontal and vertical axes.
This page displays the numerical values of efficiency and loss determined by calculation formulas.
This page displays measured power, voltage and current values, integration values, and provides access to harmonic graphs and lists for each channel.
This page displays voltage, current, and noise waveforms. The waveforms can be saved.
Select any parameter on this page for display.
Displayed only on the PW3390-03 (model with motor analysis and D/A output).

2.3 Display Items and Screen Types
22
[Motor]
[Wiring]
[D/A Out]
Select the appropriate wiring mode (phase system configu-rations) and execute quick setup on this page. Wiring dia-grams for each mode depict the appropriate measurement cable connections.
Make D/A output-related settings on this page.
Make motor measurement-related settings on this page.
[Sensor]
[Input]
Make detailed measurement criteria settings on this page.
[Calc]
Make calculation-related settings on this page.
Setting Screen (Press the key to display)
Press the keys to change the screen page as follows.
Use this screen to view and change settings for measurement criteria,wiring mode, wiring check and system environment configuration.
To next page
Displayed only on the PW3390-03 (model with motor analysis and D/A output).

2.3 Display Items and Screen Types
23
2
Chapter 2 N
ames and F
unctions of Parts, B
asic Operations &
Screens
[Interface]
Make settings related to synchronization, data saving and interfaces on this page.
Press the keys to change the screen page as follows.
[System]
Configure system environment settings and perform system reset on this page.
[Time]
Set measurement timers and the number of parameters to save on this page.
To previous page
[USB memory][CF card]
File Operations Screen (Press the key to display)
Press the keys to change the screen page as follows.
Use this screen to configure saving of data files to removablestorage media, and to save and reload settings files.
This page displays data files on a CF card. This page displays data files on a USB flash memory.

2.3 Display Items and Screen Types
24

3.1 Operations in general
25
3
Chapter 3 M
easurement P
reparations
Measurement Preparations Chapter 3
3.1 Operations in general
See 3.6 ( p.30)
Installing the Instrument
Initial Instrument PreparationsSee 3.2 ( p.26)
See 3.3 ( p.28)
See 3.7 ( p.30)
See 3.12 ( p.43)
See "Instrument installation" (p. 7)
Pre-Operation Inspection
Verifying Correct Wiring
Always perform these checks before connect-ing, and when turning the power on.
Always execute zero adjustment before con-necting to measurement objects. (p. 41)See 3.11 ( p.41)
Connecting to the Lines to be Measured
See 3.9 ( p.34) to 3.10 ( p.38)
Setting the wiring mode and current sensors
See 3.8 ( p.33)
Turning Power On
See 3.4 ( p.29)
Rear side
Apply the appropriate adhesive labels to thevoltage cords and current sensors. Then bun-dle the voltage cables together with the spiraltubes.
Connecting the Voltage Measurement Cables
Connecting the Current Sensors
Connecting the Power Cord
For best precision, allow at least 30 minuteswarm-up before executing zero adjustment andmeasuring.
Configure current sensor phase correction tofacilitate more precise measurement.

3.2 Initial Instrument Preparations
26
Perform the following before starting measurement the first time.
The labels are provided to clearly indicate which cable connects to each input jack.
Five spiral tubes are supplied with the Model L9438-50 Voltage Cord. Use the spiral tubes as needed to wrap red and black leads together.
Preparation items
3.2 Initial Instrument Preparations
Put the provided input cord labels for each voltage cord and current sensor
Before applying the labelsWipe any dust from the surface of the voltage measurement cables and current sensors,and ensure that it is dry.
Measurement Cable Labels
For each input jack, apply labelswith the same color near the jackand to its corresponding voltagemeasurement cable lead or clampsensor cable.
Apply labels to both ends of the voltage measurement ca-bles.
Apply labels to both ends of the current sensor cables.
Red
YellowBlueGray
Bundle the voltage measurement cable leads with the spiral tubes
L9438-50 Voltage Cord
Alligator Clips ×2 (one each red and black)Banana Plug Leads ×2 (one each red and black)Spiral Tubes ×5 (for cable bundling)

3.2 Initial Instrument Preparations
27
3
Chapter 3 M
easurement P
reparations
Procedure
1. Hold two cable leads (one each red and black) side-by-side.Start bundling from one end of the leads.
2. Wind the spiral tube around the leads.
Wrap the two leads together with the spiral tube. The five supplied spiral tubes should be applied with suitable spacing.
Red
Black
Spiral tube

3.3 Pre-Operation Inspection
28
3.3 Pre-Operation Inspection
Before using the instrument the first time, verify that it operates normally to ensure that the no damageoccurred during storage or shipping. If you find any damage, contact your authorized Hioki distributor orreseller.
An error is displayed
Do not use if damage is present, as
you could receive an electric shock.Contact your authorized Hioki distribu-tor or reseller if you find any damage.
Metal Exposed
Yes
No Metal Exposed
No
No
Yes Contact your authorized Hioki distribu-tor or reseller if you find any damage.
No
Yes
Initial Screen
PW3390 POWER ANALYZER1.00
Pre-connection inspection1
Power-on confirmation2
Inspect the current sensors
Is a jaw cracked or damaged?
Inspect the instrument
Is damage to the instrument evident?
Inspect the voltage measurement cables
Does any cable insulation appear damaged,or is bare metal exposed?
Does the self-test (model and version) display appear?(The version number may be changed to the latestversion number.)
The power cord may be disconnected,or the instrument may have internaldamage.Please contact your authorized Hiokidistributor or reseller.
When the self-test finishes, does the [Wiring] page of the Setting or Measurement screen appear(according to when the instrument was last turned off).
YesInspection complete
The instrument may bedamaged internally. Please contact your autho-rized Hioki distributor orreseller.
See "3.8 Turning the Power On and Off" (p. 33)

3.4 Connecting the Power Cord
29
3
Chapter 3 M
easurement P
reparations
Be sure to read the "Usage Notes" (p. 7) before connecting power.Connect the power cord to the power inlet on the instrument, and plug it into an outlet.
Ground the instrument's functional earth.Connect the functional ground terminal to a clean common ground to suppress noise effects when mea-suring in an electrically noisy environment.
3.4 Connecting the Power Cord
Connection Procedure
Back side of the instrument
1. Check that the instrument’s power switch is turnedoff.
2. Confirm that the line voltage matches instrumentrequirements, and plug the power cord into thepower inlet on the instrument.
3. Plug the other end of the power cord into an outlet.Turn off the power before disconnecting the power cord.
Power Inlet
Power cord
3.5 Grounding the Instrument's Functional Earth (when measuring in noisy envi-ronments)
Functional earth

3.6 Connecting the Voltage Measurement Cables
30
Be sure to read the "Usage Notes" (p. 7) before connecting measurement cables.Plug the voltage measurement cable leads into the voltage measurement jacks on the instrument (thenumber of connections depends on the lines to be measured and selected wiring mode).
Be sure to read the "Usage Notes" (p. 7) before connecting measurement cables.Plug the current sensor cables into the current measurement jacks on the instrument (the number of con-nections depends on the lines to be measured and selected wiring mode). See the instruction manualsupplied with the current sensor for specification details and usage procedures.
3.6 Connecting the Voltage Measurement Cables
Connection Procedure
Insert each voltage cable into the jack with the same color as theindicated channel.Insert the plugs into the terminals as far as they will go.
3.7 Connecting the Current Sensors
Connection Procedure
1 Align the guide position of the connector.
2 Push the connector straight in until it locks in place.
The instrument will automatically recognize the currentsensor type.
Align so that the thick band is positioned at the top of the instrument (facing up).
Grip the top of the metal portion.
Disconnecting the current sensors
1 Grip the metal portion of the connector and slide ittoward you to disengage the lock.
2 Pull out the connector.
Grip the metal portion.

3.7 Connecting the Current Sensors
31
3
Chapter 3 M
easurement P
reparations
Current sensors in the 9709, 9272, CT6860, and CT6840 series are available in two variants: one versionwith a metal connector, in which case the model number ends in -05, and another with a black plasticconnector, in which case the -05 is omitted. Sensors with a metal connector can be connected directly tothe instrument’s current input terminal. Current sensors with a black plastic connector (whose model numbers lack the -05) can be connected tothe instrument’s current input terminal by using the optional CT9900 Conversion Cable.
When connecting the CT6865 (rated for 1000 A) or CT6846 (rated for 1000 A) with the CT9900 Conver-sion Cable, the sensor will be recognized as a 500 A AC/DC sensor. Use a CT ratio setting of 2.00.
CT9900 Conversion Cable
PW3390 side

3.7 Connecting the Current Sensors
32
The CT7642, CT7742, CT7044, CT7045, and CT7046 Current Sensors can be used to measure largecurrents of 1000 A and greater. When using these current sensors, connect them to the instrument viathe CT9920 Conversion Cable.
When connecting a sensor via the CT9920 Conversion Cable, it is necessary to configure a setting toselect the current sensor being used.See "3.10 Setting the Current Sensors" (p. 38)
Use an external VT (PT) or CT. By specifying the VT or CT winding ratio on the instrument, the input levelat the primary side can be read directly.See "4.2.6 Setting Scaling (when using VT(PT) or CT)" (p. 61)
Connecting the CT7000 series sensors
CT9920 Conversion Cable
PW3390 side
Current sensor side
To measure voltage and current beyond the range of the instrument or current sensor
During wiring, avoid touching the VT (PT), CT or input terminals. Exposed live con-tacts can cause electric shock or other accident resulting in personal injury or death.
• When using an external VT (PT), avoid short-circuiting the secondary winding.If voltage is applied to the primary when the secondary is shorted, high currentflow in the secondary could burn it out and cause a fire.
• When using an external CT, avoid open-circuiting the secondary winding. Ifcurrent flows through the primary when the secondary is open, high voltageacross the secondary could present a dangerous hazard.
• Phase difference in an external VT (PT) or CT can cause power measurementerrors. For optimum power measurement accuracy, use a VT (PT) or CT that exhib-its minimal phase difference at the operating frequency.
• To ensure safety when using a VT (PT) or CT, one side of the secondary should begrounded.

3.8 Turning the Power On and Off
33
3
Chapter 3 M
easurement P
reparations
Be sure to read the "Usage Notes" (p. 7) before turning the instrument on.Connect the power cord and voltage and current measurement cables before turning the instrument on.
For best precision, after turning on the instrument, allow a warm-up period of at least 30 minutes toelapse before performing zero-adjustment. (p. 41)
3.8 Turning the Power On and Off
Turning the power on
Turn the power switch on ( ).
The instrument performs a 10-second power-on self test. See 3.3 ( p.28)
The instrument performs a 10-second power-on self test.
When the self test finishes, the [Wiring] page of the Setting screen appears (initialscreen). If [Start page] is set to [Last Screen] (p. 119), the last displayed Measure-ment screen appears.
If the self-test fails, operation stops at the self-test screen. If the fault recurs after turn-ing the power off and on, the instrument may be damaged. Perform the following pro-cedure:
1. Stop measuring, disconnect the measurement cables from the object being mea-sured, and turn the instrument off.
2. Disconnect the power cord and all cables from the instrument.3. Contact your authorized Hioki distributor or reseller.
Turning the power off
Turn the power switch off ( ).

3.9 Selecting the Wiring Mode
34
Select the wiring mode to match the phase system(s) to be measured. Eight wiring modes are available.
Press the key and select the [Wiring] page with the .
3.9 Selecting the Wiring Mode
To open the [Wiring] page
To select the wiring mode
2
3 To accept the selection:
Press (or the key)
To cancel the selection:
Press (or the key)
1 Press the key to select
[Select] (or press the key)
to display the pull-down menu.
2
1
3
Select the wiring mode
Accepting the selection displays the wiringdiagram of the selected wiring mode.(p. 35)
• To measure multiphase power, use the same type of current sensor on each phaseline. For example, to measure 3-phase 4-wire power, use the same model currentsensors on channels 1 to 3.
• When using a current sensor with switchable sensor rating (such as Model 9272-05), set the sensor rating to match the rating of the line.
• When the selected wiring mode uses multiple channels, channel-specific settings(such as voltage range) are linked to the first channel’s settings.

3.9 Selecting the Wiring Mode
35
3
Chapter 3 M
easurement P
reparations
Wiring configuration diagram
Wiring Mode 1. Single-phase, 2-wire (1P2W) × 4
Wiring configuration diagram
SeePages p.205 and p.206 for additional wiring diagrams.
Wiring Mode 2. Single-phase, 3-wire (1P3W) + single-phase, 2-wire (1P2W) × 2
Wiring Mode 3. 3-phase, 3-wire (3P3W2M) + single-phase, 2-wire (1P2W) × 2

3.9 Selecting the Wiring Mode
36
Wiring Mode 4. Single-phase, 3-wire (1P3W) × 2
Connection diagrams
SeeConnection diagrams can also be found on p.205 and p.206.
Wiring Mode 5. 3-phase, 3-wire (3P3W2M) + single-phase, 3-wire (1P3W)
Wiring Mode 6. 3-phase, 3-wire (3P3W2M) × 2

3.9 Selecting the Wiring Mode
37
3
Chapter 3 M
easurement P
reparations
Wiring Mode 7. 3-phase, 3-wire (3P3W3M) + single-phase, 2-wire (1P2W)
Wiring Mode 8. 3-phase, 4-wire (3P4W) + single-phase, 2-wire (1P2W)
Wiring Description
1P2W Single-phase, 2-wire Select this wiring mode when measuring DC lines.
1P3W Single-phase, 3-wire -
3P3W2M 3-phase, 3-wire
This wiring mode is used for 2-meter measurement to measure 3-phasedelta lines with two channels. It allows accurate measurement of activepower, even with unbalanced and distorted waveforms. Apparent power,reactive power, and power factor values for unbalanced lines may differfrom values obtained with other instruments. In that case, use the3P3W3M wiring mode.
3P3W3M 3-phase, 3-wire This wiring mode is used for 3-meter measurement to measure 3-phasedelta lines with three channels.
3P4W 3-phase, 4-wire This wiring mode is used for 3-meter measurement to measure 3-phaseY (star) lines with three channels.

3.10 Setting the Current Sensors
38
If a CT7044, CT7045, CT7046, CT7642, or CT7742 large current sensor has been connected to theinstrument's current input terminal via the CT9920 Conversion Cable, set the model or output rate of thecurrent sensor in use.
3.10 Setting the Current Sensors
Selecting the current sensors in use
Display the [Sensor] page
Select with the F keys
Select the item to display
Select a [Current sensor] for the channel being set.
If a high-precision sensor that does not require the CT9920 Conversion Cable hasbeen connected directly to one of the instrument’s current input terminals, there is noneed to select the current sensor since the instrument will detect it automatically.

3.10 Setting the Current Sensors
39
3
Chapter 3 M
easurement P
reparations
Generally speaking, phase error tends to increase gradually for current sensors in the high-frequencydomain of the frequency band (see illustrative figure below). Power measurement error in the high-frequency domain can be reduced by using information about thesensor’s unique phase characteristics to correct phase error.
Representative values for all sensors reflect the following conditions:• Standard cable length (not using an extended cable)• Conductor under measurement positioned in the center of the sensor
Configuring current sensor phase correction
Illustrative figure
Phase characteristics after correction
Phase characteristics before correction
Frequency [Hz]
Ph
ase
[deg
.]
Current sensor phase characteristics representative values
Model Frequency [kHz] Input/output phase difference representative values [deg.]
CT6841 100.000 -1.82
CT6843 100.000 -1.68
CT6844 50.000 -1.29
CT6845 20.000 -0.62
CT6846 20.000 -1.89
CT6862 300.000 -10.96
CT6863 100.000 -4.60
CT6865 1.000 -1.21
9709 20.000 -1.11
PW9100 300.000 -2.80
9272-05 (20 A) 50.000 -3.34
9272-05 (200 A) 50.000 -4.18
CT7044 5.000 -11.18
CT7045 5.000 -11.90
CT7046 5.000 -13.02
CT7642 1.000 -8.17
CT7742 1.000 -18.62

3.10 Setting the Current Sensors
40
Determine the frequency and phase difference for the sensor to which correction is being applied based on the table of current sensor phase characteristics (Reference: "Configuring current sensor phase correction" (p. 39)).(Refer to the “Frequency” column for the frequency and the “Input/output phase difference representative values” column for the phase difference.)
Example for CT6862: To set a frequency of 300.000 kHz and a phase difference of -10.96 deg.
Display the [Sensor] page
Select [ON] with the F2 keys
Select the item to display
Select a [Phase corr.] for the channel being set.
Select [300.000] with the F keys
Select the item to display
Select a [Frequency[kHz]] for the channel being set.
Select a [Angle[deg.]] for the channel being set.
Select [-10.96] with the F keys
Method for inputting values using F keysSelect which digit to input with the F3 and F4 keys.Then increment or decrement the value as desired with theF1 (+1) and F2 (-1) keys (to select a value from 0 to 9).
• The valid setting range for the angle [deg.] setting is -90 deg. to +90 deg. However,the time difference calculated from the frequency and phase difference is limited tothe range of -200 μs to 200 μs, and phase correction calculations are performed at aresolution of 5 ns.
• Set the frequency and phase difference as appropriate for the current sensor in use.• Use of an improper setting may result in erroneous correction, which may in turn
cause the measurement error to increase. Be sure to enter the settings accurately.

3.11 Attaching to the Lines to be Measured and Zero Adjustment
41
3
Chapter 3 M
easurement P
reparations
Be sure to read the "Usage Notes" (p. 7) before attaching to the lines.Always perform zero adjustment before attaching to the lines. Then attach the voltage measurement clips and current sensors to the measurement lines according tothe on-screen wiring diagrams. For proper accuracy, attach to the lines exactly as shown.** The diagram appears when the wiring mode is selected.(p. 34)
To obtain the specified accuracy, after 30 minutes warm-up, perform zero-adjustment on both voltageand current measurement channels. When using an AC/DC current sensor, perform degaussing along with zero adjustment.
3.11 Attaching to the Lines to be Measured and Zero Adjustment
Although the instrument can measure multiple lines at the same time, to avoidelectric shock and short-circuit accidents, do not attach any unnecessarycables.
The phases are named A, B, and C on the wiring diagram display. Substitute withequivalent names such as R,S, and T or U,V, and W, as appropriate.
Zero Adjustment and Degaussing
3. Press the key.( to cancel.)
[Executing zero adjustment] is displayed for 30 seconds, until finished.
2. Press the key.[Execute Zero Adjust.] is displayed.
1. Press the key.
• Perform zero adjustment only after plugging the current sensor into the instru-ment (proper adjustment requires that the current sensor be connected).
• Perform zero adjustment before attaching to the lines to be measured (properadjustment requires the absence of any input voltage or current).
• For optimum measurement accuracy, zero adjustment should be performedwithin the specified ambient temperature range.
• The operating keys are disabled during zero adjustment.• If the instrument is equipped with motor analysis functionality, zero adjustment
is not applicable for analog DC input on channels A and B. Perform the specialzero adjustment from the Motor screen.See "4.8 Viewing Motor Measurement Values (Model PW3390-03 only)" (p. 94)
Attach voltage measurement cables to measurement lines
Securely clip the leads to metal parts such as load-side screw terminals orbus bars.
Example: Secondary side of breaker
L9438-50 Voltage Cord

3.11 Attaching to the Lines to be Measured and Zero Adjustment
42
Attach current sensors to measurement lines
OK
Shield
(Example: 9272-05)
Source side
Line
Load side
Current Flow Direction Arrow
Be sure to attach each clamp around only one conductor.Correct measurement cannot be obtained if a clamp is attached around more than one conductor.
Make certain that the current flow direction arrow points toward the load.
Easy set
If measurement line power is off, turn it on before performing quick setup.
Select [Easy Set] with the
key.A confirmation dialog box appears.
2
1
1
To execute: Press .
To cancel: Press .
What settings are affected by quick setup?For accurate measurements, settings such as range and sync source must be properly config-ured. Executing quick setup automatically configures the following settings to the Hioki-recom-mended values for the selected wiring mode (phase system): voltage and current ranges, syncsource, lower measurement frequency limit, integration mode, harmonic sync source and rectifi-cation system.
Execute quick setup when using the instrument the first time, and when changing to a differentline configuration.

3.12 Verifying Correct Wiring (Connection Check)
43
3
Chapter 3 M
easurement P
reparations
Correct attachment to the lines is necessary for accurate measurements. Refer to the measured values and vector displays to verify that the measurement cables are correctly attached.
3.12 Verifying Correct Wiring (Connection Check)
Voltage Current
For 1P2W systems
• Verify that an appropri-ate measurement value is displayed.
• Verify that the vectorsare displayed with theappropriate range.
Measured voltage valueMeasured current valueMeasured active power value
Verify that an appropriate measurement value is displayed.
Vector line rangeColors match the correspond-ing lines in the wiring diagram.
For systems other than 1P2W
In this case Check• Are the cables securely plugged into the voltage measurement jacks on
the instrument? (p. 30)• Are the voltage measurement cables properly attached to the lines? (p. 41)
• Are the cables securely plugged into the current measurement jacks onthe instrument? (p. 30)
• Are the current sensors properly attached to the lines? (p. 42)• Are the current sensors appropriate for the line current to be measured? • If using the 9272-05 Clamp On Sensor is the sensor range set correctly?
• Are the voltage measurement cables properly attached to the lines? (p. 41)• Is the arrow marker on the current sensors pointing toward the load?
Voltage vectors:• Are the cables securely plugged into voltage measurement jacks on the
instrument? (p. 30)• Are the voltage measurement cable clips properly attached to the lines? (p. 41)
Current vectors:• Are the cables securely plugged into the current measurement jacks on
the instrument? (p. 30)• Are the current sensors properly attached to the lines? (p. 42)• Are the current sensors appropriate for the line current to be measured?• If using the 9272-05 Clamp On Sensor, is the sensor range set correctly?
Voltage vectors: • Check that the voltage measurement clips are attached to the lines
according to the wiring diagram.
Current vectors: • Check that the current sensors are attached to the lines according to the
wiring diagram.
If the measured voltage value istoo high or too low
If the measured current value isnot correct
If the measured active powervalue is negative
If vectors are too short, or unequal
If vector direction (phase) or color is incorrect
• The display range of the vector diagrams assumes inductive loads (such as with a motor).The vectors may appear out of range when measuring near-zero power factor, or capacitive loads.
• When measuring multiple 1P3W or 3-phase lines at the same time, vectors are not displayed cor-rectly when the harmonic sync source frequency is different from that of the lines to be measured.
• When measuring 3P3W2M systems, the active power (P) measured on each channel maybe negative.

3.12 Verifying Correct Wiring (Connection Check)
44

4.1 Measurement Value Display Procedure
45
4
Chapter 4 V
iewing M
easurement V
alues
The following procedure displays measurement values.
Viewing Measurement Values Chapter 4
4.1 Measurement Value Display Procedure
Display Procedure (the following shows 1P2W wiring mode)
Display the [CH] page
See Displays the Harmonic Graph or Harmonic List. "4.4 Viewing Harmonic Measurement Values" (p. 72)
The above screen is specific to the wiring mode (here showing four 1P2W systems)he number of measurement items displayed depends on the selected wiring mode.See Section "3.9 Selecting the Wiring Mode" (p. 34) to set the wiring mode.
Use the F keys to selectdisplay contents

4.1 Measurement Value Display Procedure
46
From all measured items, select those you want to display on one screen.
Press to display the [Select] page.
First press an F key to select the number of items to be displayed.
Selecting Measured Items for Display
4 Items Display 8 Items Display
16 Items Display 32 Items Display

4.1 Measurement Value Display Procedure
47
4
Chapter 4 V
iewing M
easurement V
alues
Display Item Selection Procedure
Display the [Select] page
(a blinking cursor appears)
Enter
Select the item to display
Cancel
Press when finished making changes.
Move the cursorto the item to change
Accept(the pull-down menu appears)

4.1 Measurement Value Display Procedure
48
The valid measurement range (the range of guaranteed accuracy) is 1% to 110% of the full-scale range(except that valid voltage is limited to 1000 V in the 1500 V scale).The display range of this unit is between the zero surpress level to 120% of the measurement range.The following display indicates over-range measurement. If input at or below the zero suppress setting for the measurement range is measured, the measuredvalue will not change from zero. To display even low input levels, turn off the zero suppress setting or setit to 0.1%.
See Zero surpress level: OFF (initial setting), 0.1%f.s., 0.5%f.s. (p. 119)
Peak Over indicators light when an input voltage or current waveform peak value exceeds three times thefull-scale range (except the 1500 V range, when the voltage exceeds ±2000 V, see the figure below). Theindicators are shown on all screens, so that Peak Over can be seen even on channels not currentlyselected.Example: The following display indicates that the CH 1 voltage and CH 3 current are at Peak Over levels.
About Valid and Displayable Ranges
About Peak Over Indicators
Peak Over voltage
Peak Over current
(red indicators)

4.2 Viewing Power Measurements, and Changing the Measurement Configuration
49
4
Chapter 4 V
iewing M
easurement V
alues
When viewing power measurements, [Power], [Voltage], and [Current] are displayed so that measured
values can be confirmed. Press to display the Measurement screen, and select the desired [CH]
page with the keys. Power measurements can be displayed in a list, and detailed voltageand current values can be displayed.
Press . (The screen shows values for Wiring mode 1, four 1P2W systems.)
4.2 Viewing Power Measurements, and Changing the Measurement Configura-tion
4.2.1 Displaying Power Measurements
Displaying Power
RMS Voltage
RMS Current
Power Factor
Active Power
Apparent Power
Reactive Power
Power Phase Angle
Frequency
• Average rectified RMS converted value is displayed for Urms or Irms according to therectification setting.See "4.2.5 Selecting the Rectification Method" (p. 60)
• Polarity of power factor (λ), Reactive power (Q), and power phase angle (φ) showsthe LEAD or LAG. "No polarity sign" means "LAG" and "-" means "LEAD".
• The polarity of power factor, reactive power and power phase angle may not be sta-ble when the voltage and current has big level difference or power phase angle isaround zero.
• During 3P3W2M measurement, the active power (P), reactive power (Q), apparentpower (S), power factor (λ), and power phase angle (φ) for each channel indicateintermediate measurement results. Use the total values (P12, P34, etc.) for final eval-uation purposes.

4.2 Viewing Power Measurements, and Changing the Measurement Configuration
50
Press . The screen shows settings for Wiring mode 7, (3 phase 3 wire (3P3W3M)+1 phase 2 wire
(1P2W)).
Press . The screen shows settings for Wiring mode 7, (3 phase 3 wire (3P3W3M)+1 phase 2
wire (1P2W)).
Displaying Voltage
Displaying Current
RMS Voltage
Rectified Mean Value of RMS Conversion
THD Voltage Percentage*
Fundamental Voltage Content
Voltage Waveform Peak+
AC Voltage Content
Frequency
Simple Averaged Voltage
Voltage Waveform Peak-
When the Wiring mode is 3P3W3M or 3P4W, voltage unbalance Uunb [%] is displayed.* When the integration mode is set to DC, the voltage ripple rate Urf [%] will be displayed instead of
the voltage total harmonic distortion.
RMS Current
Rectified Mean Value of RMS Conversion
THD Current Percentage*
Fundamental Current Content
Current Waveform Peak+
AC Current Content
Simple Averaged Current
Current Waveform Peak-
When the Wiring mode is 3P3W3M or 3P4W, current unbalance Iunb [%] is displayed.* When the integration mode is set to DC, the current ripple rate Irf [%] will be displayed instead of the
current total harmonic distortion.
Frequency

4.2 Viewing Power Measurements, and Changing the Measurement Configuration
51
4
Chapter 4 V
iewing M
easurement V
alues
Measurement ranges are selected as described below.
Measurement ranges can be selected in two ways:
The active range selection is displayed at the locations on the Measurement screen shown below (excepton the [Efficiency], [XY Graph], and [Motor] pages). Manual range selections are indicated by [Manu],and Auto-ranging selections by [Auto].
4.2.2 Selecting Ranges
• If the maximum voltage or current rating is exceeded, immediately stop mea-suring, shut off power to the measurement lines, and disconnect from the mea-surement object.
• Continuing to measure when maximum ratings are exceeded may damage theinstrument and result in injury or death.
• The maximum input voltage is 1500 V, ±2000 V peak. Do not use the voltageexceeding it to avoid damaging the unit or injury.
• Never exceed the maximum rated input current to the current sensor, as dam-age to the instrument or injury or death can result.
Types of Range Setting
Manual range settingSelect the range manually
(Press or key of the RANGE keys to select the desired range.)
Auto-RangingEach voltage and current range is set automatically according to the measurement inputs
for each wiring system. (Press the key of the RANGE keys.)
Range Display
Voltage Range Current Range

4.2 Viewing Power Measurements, and Changing the Measurement Configuration
52
Ranges can be set on the following Measurement screen pages: [Vector], [CH] (any), [Wave + Noise],[Select], and [Input]. Change the range with the RANGE keys.
Range Setting Procedure
For Manual range selection, press the / key of
the RANGE keys to select the desired range.
Current RangeVoltage Range
For Auto range selection, Press the key of the RANGEkeys.
Setting from the [Vector] Page of the Measurement Screen
Display the [Vector] page
Press the RANGE keys to select the range
Select the channel to change
Setting from the [CH] Pages of the Measurement Screen
Press the RANGE keys to select the range
Select the channel to change

4.2 Viewing Power Measurements, and Changing the Measurement Configuration
53
4
Chapter 4 V
iewing M
easurement V
alues
Setting from the [Wave + Noise] Page of the Measurement Screen
Display the [Wave + Noise] page
Select the channelto change
Press the RANGE keys to select therange
Select [U/I]*
* Press to display [CH]
for changing.
Setting from the [Select] Page of the Measurement Screen
Display the [Select] page
Select the channelto change
Press the RANGE keys to select the range

4.2 Viewing Power Measurements, and Changing the Measurement Configuration
54
Setting from the [Input] Page of the Setting Screen
When measuring multiple channels with a Wiring mode other than 1P2W, all channelsare forced to the same range. In this case, the range of each channel is set to matchthe channel set to the lowest range.
Display the [Input] page
Press the RANGE keys toselect the range(Changes the selected [U range] or [I range])
Select the channel to change
To change the [U range] or [I range], select it with the
cursor and press , , or to change
the range.
About [All CH Set], see "2.2 Basic Operations" (p. 18).

4.2 Viewing Power Measurements, and Changing the Measurement Configuration
55
4
Chapter 4 V
iewing M
easurement V
alues
This setting determines auto-ranging behavior, and can be specified for each wiring system. Select[Wide] if the range changes frequently due to large fluctuations.
Auto-Ranging Span
Narrow
• The measurement range increments by one when a Peak Over state occurs or whenany RMS value exceeds 105% f.s.
• The measurement range decrements by one when all RMS values fall below 40% f.s.(unless a Peak Over state would result in the lower range). This is the default setting.
Wide
• The measurement range increments by one when a Peak Over state occurs or whenany RMS value exceeds 110% f.s.
• he measurement range decrements by two when all RMS values fall below 10% f.s.(unless a Peak Over state would result in the lower range).
When Δ-Y transform is enabled (p. 114), the range-decrementing voltage is
(approximately 0.57735) f.s.
Setting Procedure
1 3⁄
Display the [Calc] page
Select with the F keys
Select [AutoRange type]
• If the range switches frequently even when the [Wide] setting for [AutoRange type]is selected, Manual range setting is recommended. See "4.2.2 Selecting Ranges" (p. 51)
• When integration starts, the range selected at that time becomes fixed, and auto-ranging is disabled.

4.2 Viewing Power Measurements, and Changing the Measurement Configuration
56
Select the source to determine the fundamental cycle (between zero crossings) on which various calcula-tions are to be based. As a general usage, for each wiring, select the voltage of the measurement channel for the channel mea-suring the alternating current, and 50 msDC for the channel measuring the direct current.When measuring distorted alternating waveforms with a lot of noise, such as PWM waveforms, accuratemeasurements can be achieved by suitably combining the settings in "Setting the Zero-Crossing Filter"(p. 57).
Select from the following 11 items for each Wiring mode. Press to make the setting on the Settingscreen.
The selected synchronization source is displayed as [Sync] on the Measurement screen.Use the [Ext] setting when performing pulse-based measurement during motor analysis or when measur-ing electrical angle.* Motor Testing is installed and CH B is set only for pulse input.
4.2.3 Selecting the Sync Source
U1 to U4 (Default setting), I1 to I4, DC 50 ms, DC 100 ms, Ext*
Sync Source Setting Procedure
• When measuring AC input with [DC 50 ms] and [DC 100 ms] settings, displayed val-ues fluctuate and proper measurement is not possible. Select any of [U1] to [U4] or[I1] to [I4].
• Voltage and current share the same sync source on each channel.• [DC 50 ms] is the fastest calculation interval for DC measurements. However, if input
interference (50/60-Hz power line noise) causes measurement values to fluctuate,select [DC 100 ms].
• When U or I is selected as a sync source, amplitude should remain at least 30% f.s.• Also when U or I is selected as a sync source, if a frequency is applied above 5 kHz
or below the minimum measurement frequency, the displayed frequency may differfrom the input frequency. For the sync source, select an input with a fundamental frequency of 0.5 Hz to 5 kHz,and specify the corresponding minimum measurement frequency.
• The measurement values may get unstable at the frequency around the lowest mea-surable frequency, because the synchronization is unlocked.
Select with the F keys
Select [Sync source] for the channel to be changed.
[All CH Set] and [Next]:See "2.2 Basic Operations" (p. 18)
Display the [Input] page
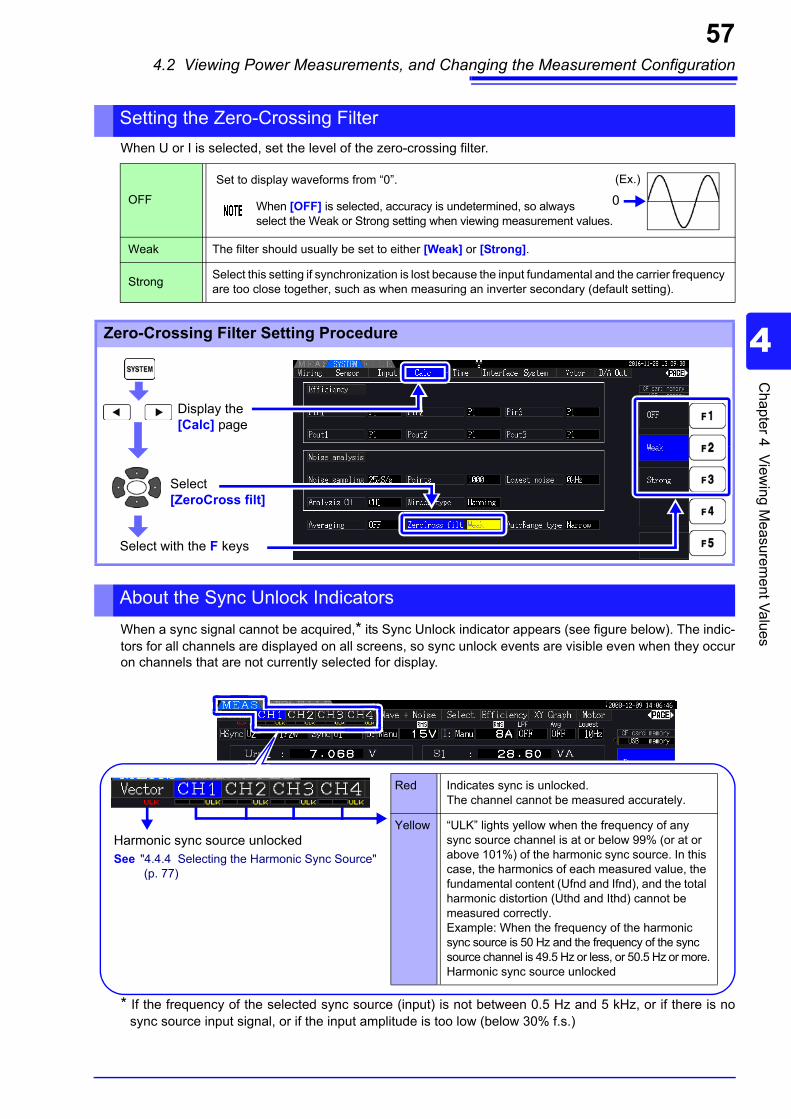
4.2 Viewing Power Measurements, and Changing the Measurement Configuration
57
4
Chapter 4 V
iewing M
easurement V
alues
When U or I is selected, set the level of the zero-crossing filter.
When a sync signal cannot be acquired,* its Sync Unlock indicator appears (see figure below). The indic-tors for all channels are displayed on all screens, so sync unlock events are visible even when they occuron channels that are not currently selected for display.
* If the frequency of the selected sync source (input) is not between 0.5 Hz and 5 kHz, or if there is nosync source input signal, or if the input amplitude is too low (below 30% f.s.)
Setting the Zero-Crossing Filter
OFF
Weak The filter should usually be set to either [Weak] or [Strong].
StrongSelect this setting if synchronization is lost because the input fundamental and the carrier frequency are too close together, such as when measuring an inverter secondary (default setting).
Zero-Crossing Filter Setting Procedure
(Ex.)Set to display waveforms from “0”.
When [OFF] is selected, accuracy is undetermined, so always select the Weak or Strong setting when viewing measurement values.
0
Display the [Calc] page
Select with the F keys
Select [ZeroCross filt]
About the Sync Unlock Indicators
Harmonic sync source unlockedSee "4.4.4 Selecting the Harmonic Sync Source"
(p. 77)
Red Indicates sync is unlocked.The channel cannot be measured accurately.
Yellow “ULK” lights yellow when the frequency of any sync source channel is at or below 99% (or at or above 101%) of the harmonic sync source. In this case, the harmonics of each measured value, the fundamental content (Ufnd and Ifnd), and the total harmonic distortion (Uthd and Ithd) cannot be measured correctly.Example: When the frequency of the harmonic sync source is 50 Hz and the frequency of the sync source channel is 49.5 Hz or less, or 50.5 Hz or more.Harmonic sync source unlocked

4.2 Viewing Power Measurements, and Changing the Measurement Configuration
58
By configuring U or I settings for each input channel, the instrument can simultaneously measure multiplefrequencies in different wiring systems.
• 0.5000 Hz → 9.9999 Hz → 10.000 Hz → 99.999 Hz → 100.00 Hz → 999.99 Hz → 1.0000 kHz → 5.0000 kHz
• 0.5000 Hz ← 9.8999 Hz ← 9.900 Hz ← 98.999 Hz ← 99.00 Hz ← 989.99 Hz ← 0.9900 kHz ← 5.0000 kHz
• For other measurement input frequencies (not between 0.5 Hz and 5 kHz): “0.0000 Hz” is displayed forfrequencies below 0.5 Hz, and “------ Hz” for 5 kHz and above.
Specify the lowest (limit) measurement frequency for frequency measurements. Set the lowest measurement frequency according to the input frequency. The setting is displayed as the [Lowest] value on the Measurement screen.
4.2.4 Frequency Measurement Settings
Frequency Measurement Display System
Frequency Measurement Source Setting Procedure
Display the [Input] page
Select [Freq measure]
Select with the F keys
About [All CH Set], see "2.2 Basic Operations" (p. 18).
Setting the lowest measurement frequency on the Measurement screen
This setting is available on all Measurement screen pages.
Press the LOW FREQ or
key to make the setting
Use this sides key. (LOW FREQ key)

4.2 Viewing Power Measurements, and Changing the Measurement Configuration
59
4
Chapter 4 V
iewing M
easurement V
alues
Setting the Lowest Measurement Frequency on the Setting Screen
Display the [Input] page
Select [Lowest freq]
Select with the F keys
• The frequency measurement range is 0.5 Hz to 5 kHz (within the sync frequencyrange). Input frequencies outside of this range cannot be measured.
• The guaranteed accuracy of frequency measurement stipulates sine wave input of atleast 30% of the measurement range of the frequency measurement source. Fre-quency measurement may not be possible with other input signals.
• For input signals of 45 Hz and below, the data update rate depends on the input fre-quency.
• If a frequency is applied above 5 kHz or below the minimum measurement frequency,the displayed frequency may differ from the input frequency.

4.2 Viewing Power Measurements, and Changing the Measurement Configuration
60
Select the voltage or current rectification method to be used for calculating apparent power, reactivepower, and power factor. Two rectification methods are selectable for each voltage and current input.Make this selection before measurement.
[MEAN] and [RMS] settings for each range are made on the [CH] pages.
4.2.5 Selecting the Rectification Method
RMS True root mean square value. Ordinarily, this setting should be used. (default setting)
MEANRectified mean value of RMS conversion.In general, select this only when measuring the line voltage of an inverter's secondary-side PWM waveform.
Setting Procedure
Select with the F keys
Display the [Input] page
About [All CH Set], see "2.2 Basic Operations" (p. 18).
Select a [U rect]and [I rect] for thechannel being set.

4.2 Viewing Power Measurements, and Changing the Measurement Configuration
61
4
Chapter 4 V
iewing M
easurement V
alues
Set the VT or CT ratio when using an external VT(PT) or CT. When a ratio has been set, [VT] or [CT] is displayed above each range setting on the [CH] pages.
The settable range is as follows.
4.2.6 Setting Scaling (when using VT(PT) or CT)
VT rateOFF/0.01 to 9999.99 (Setting is not available when VT × CT exceeds 1.0E+06.)
CT rateOFF/0.01 to 9999.99 (Setting is not available when VT × CT exceeds 1.0E+06.)
When [OFF] is selected, VT and CT ratios are both 1.00.
Setting Procedure
Select with the F keys
Select a [VT rate]and [CT rate] forthe channel beingset.
Display the [Input] page
About [All CH Set], see "2.2 Basic Operations" (p. 18).

4.2 Viewing Power Measurements, and Changing the Measurement Configuration
62
The instrument includes a low-pass filter function to limit the measurement frequency range.Enable the filter to remove harmonic components or extraneous noise when measuring.Filter cut-off frequency can be selected from the following four settings, and can be set differently for eachwiring system.
The low-pass filter setting appears below [LPF] on the Measurement screen.
4.2.7 Setting the Low-Pass Filter
OFF Specified accuracy applies only at 200 kHz and below. (Default setting)
100 kHzSpecified accuracy applies only at 20 kHz and below.except 10 kHz to 20 kHz, add ±1% rdg.
5 kHz Specified accuracy applies only at 500 kHz and below.
500 HzSpecified accuracy applies only at 60 kHz and below.add ±0.1% f.s.
The low pass filter rejects harmonic components and may impede accurate measurement ofpower, efficiency, and loss. It is recommended to set the low-pass filter to [OFF] to allow accu-rate measurement unless you wish to reject harmonic components.
Setting the Cut-Off Frequency on the Measurement Screen
The setting can be made from the [Vector], each [CH], [Wave + Noise], and [Select] page on the Measurement screen.
Display any of these pages
Press the LPF or
key to make the setting
Use this sides key. (LPF key)
Selecting the Cut-Off Frequency on the Setting screen.
Display the [Input] page
Select with the F keys
Select a [LPF] for the channel being set.
About [All CH Set], see "2.2 Basic Operations" (p. 18).

4.3 Integration Value Observation
63
4
Chapter 4 V
iewing M
easurement V
alues
Current (I) and active power (P) are integrated on all channels simultaneously. Positive, negative andtotal values are displayed.
4.3 Integration Value Observation
4.3.1 Displaying Integration Values
Displaying Integration Contents
Items that can be integrated depend on the selected wiring and integration mode.See "3.9 Selecting the Wiring Mode" (p. 34), "4.3.2 Setting the Integration Mode" (p. 66)These items can be selected and displayed on the Selection Display screen.
Press , select a channel [CH] with , then press .
RMS Voltage
RMS Current
Active Power
Power Factor
Integration Time Items
Frequency Measurement Source Frequency
* Displayed only for DC integration mode
Current Integration Values
Ih1+ CH1 positive current integration value*
Ih1- CH1 negative current integration value*
Ih1 CH1 total current integration value
Example: With 1P2W Wiring mode selected, and DC integration mode
WP1+ CH1 positive active power integration value
WP1- CH1 negative active power integration value
WP1 CH1 total active power integration value
Active Power Integration Values
Integration in progress
Integration stopped
Waiting for integration to start by real-time clock control

4.3 Integration Value Observation
64
These functions can be controlled by key operations or by communication commands.
Before Starting Integration
1. Verify that the clock is set correctly.See "Clock" (p. 119)
2. Select the integration mode.See 4.3.2 ( p.66)
3. Set the desired time control functions (interval, timer, and clock controls).See 4.3.4 ( p.69)Set "OFF" for time settings when integrating manually.
4. Make appropriate settings for saving to CF card, and when using the D/A output, as needed.See "7.3 Media Formatting" (p. 127), "8.3 Using Analog and Waveform D/A Output" (p. 152)
Starting, Stopping, and Resetting Integration
• Integration start, stop and value reset cannot be performed on the Setting or File Operationscreens. These functions are available only on the Measurement screen.
• Remote control by LAN communications can be performed using the same operations on theremote control from the Internet browser.See "9.2 Remote Control of the Instrument by Internet Browser" (p. 170)
Start integration: press onceStop integration*: press again
Resets integration: press
when integration is finished
Always reset the integration values when changing oth-er settings.
* When timer or clock control is enabled, integration stops automatically at the specified stop time.

4.3 Integration Value Observation
65
4
Chapter 4 V
iewing M
easurement V
alues
• Maximum integration time is 9999 hours, 59 minutes and 59 seconds, after which integrationautomatically stops.
• Integration start, stop and reset by the operating keys and external control act on all integra-tion items simultaneously.
• The following physical quantities can be measured by integration for each wiring system andDC integration mode.
• Calculation results for each channel are integrated at 20 times per second, so integration val-ues may differ for measurement devices with different response or sampling rates, and for dif-ferent calculation methods.
• When auto-ranging is enabled for any item, the actual measurement range becomes fixed atits current setting the moment integration starts, so set the range beforehand to avoid over-range input.
• For current integration, the DC mode integrates instantaneous current, and the RMS modeintegrates RMS current.
• For power integration, the DC mode integrates instantaneous power, and the RMS mode inte-grates active power.
• When integration is enabled (including “Wait” for clock control), settings cannot be changedother than switching screens and the Data and Peak Hold functions.
• When Data or Peak Hold is active, integration continues internally even when displayed val-ues are fixed. Even so, it is the displayed data that is output to CF card and D/A outputs.
• Integration display values are unaffected by the Peak Hold state.• If a power outage occurs during integration, integration restarts when power is restored.
Mode Name Physical Quantities
1P2W, DC Mode Ih+, AIh-, Ih, WP+, WP-, WP
1P2W Ih, WP+, WP-, WP
1P3W, 3P3W2M(using CH 1 and CH 2)
Ih1, Ih2, WP12+, WP12-, WP12
3P3W3M, 3P4W(using CH 1, CH 2 and CH 3)
Ih1, Ih2, Ih3, WP123+, WP123-, WP123

4.3 Integration Value Observation
66
Select the integration mode for each channel. Two choices are available for each wiring system.
4.3.2 Setting the Integration Mode
RMS Mode• Integrates RMS current and active power during every measurement interval (50 ms).• Each polarity is integrated only for active power.
DC Mode
• Integrates instantaneous current and power values for each polarity during every sam-pling interval (at 500 kHz sampling frequency)
• Only selectable for 1P2W wiring with AC/DC current sensors• Integration is performed simultaneously on three current values (Ih+, Ih-, and Ih) and
three active power values (WP+, WP-, and WP)
Setting Procedure
Display the [Input] page
Select with the F keys
Select the channel to change
About [All CH Set], see "2.2 Basic Operations" (p. 18).
Display of THD (total harmonic distortion) or RF (ripple factor) of the measurement value isdetermined according to the integration mode setting.When the RMS integration mode is selected, THD is displayed, and when the DC mode isselected, RF is displayed.

4.3 Integration Value Observation
67
4
Chapter 4 V
iewing M
easurement V
alues
This method starts and stops integration by manual operation.
4.3.3 Manual Integration Method
Procedure
Manual Integration Operations
Additional Integration Operation
Disable (set to [OFF]) the timer and clock timingcontrol settings.See "Integration Combined with Timing Control" (p. 69)
Press .
(The key lights green, and is displayed to indicate the operating state.)
Press key again.
(The key lights red, and is
displayed.)
Press again.
(The key lights green, and is
displayed to indicate the operating state.)
Press when finished integration.
Stop
Before starting integration
Start
Additional integration (resumes integration with the values acquired previously)
Reset the integration value
Reset
Retaining
Displayed Integration Value
Start
Time
Stop
Resume
Retaining
Displayed Integration Value
Start
Time
Stop
Additional
4.3 Integration Value Observation
68
During manual integration, integration values can be saved in combination with interval time.Measurement items selected as described in section "7.5.3 Selecting Measurement Items to Save" (p.134) can be saved to CF card at the specified interval.See Can be set in "Interface" page of setting screen.
Saving Integration Data at Each Interval
Procedure
• The maximum integration time is 9999 hours, 59 minutes, and 59 seconds.• When Data or Peak Hold is active, integration continues internally even when displayed val-
ues are fixed. Even so, it is the displayed data that is output to CF card and D/A outputs.
1. Select the integration data to be saved at each interval.See 7.5.3 ( p.134) (Press [Integ] to select the integration recording parameters to save.)
2. Set saving (ON/OFF), and specify the folder, if needed.See "7.5.2 Auto-Saving Measurement Data" (p. 131), "7.10.1 Creating Folders" (p. 140)
3. Select the interval time.See 5.1 ( p.105)
4. Press to start saving at the selected intervals. (Press again to stop.)

4.3 Integration Value Observation
69
4
Chapter 4 V
iewing M
easurement V
alues
After specifying timer and clock settings, press to cause integration to start and stop at the speci-
fied times. Integration can be controlled by the following three timing methods.
4.3.4 Integration Combined with Timing Control
When an interval time is enabled, activating Data or Peak Hold by pressing the HOLD keycauses the display to update at each interval. Also, when timer or clock control is enabled, the final measurement data is displayed at thespecified stop time.
Manually Controlled Integration
Press to start integration.
Press again to stop integration.
See "4.3.3 Manual Integration Method" (p. 67)
Reset
Retaining
Integrated value
Start
Time
Stop
Timer-Controlled Integration Timer Setting Value
Automatic stop
Press to start integration.
Integration stops automatically when the timer expires.See "Timer-Controlled Integration" (p. 70)
Start ResetStop
Retaining
Time
Integrated value
Clock-Controlled Integration
Press .
Integration starts and stops at thespecified times.See "Clock-Controlled Integration" (p. 71)
Stop Time
Wait Time Clock-Controlled Time
Start Time
Automatic start Automatic stop
Integrated value
Start Reset
Retaining
Time

4.3 Integration Value Observation
70
Integration is performed for the specified duration, and stops when the timer expires. Calculation resultsare held constant when the timer stops.If auto-saving is enabled, integration values are saved to CF card when integration starts and stops. If aninterval time is also specified, total integration values up to that point are saved at each interval.
See "7.5.2 Auto-Saving Measurement Data" (p. 131)
Timer-Controlled Integration
Setting Procedure
• Integration stops when the timer expires (or the clock stop time occurs). When this occursbefore the end of an interval, the last interval is ignored.
• Setting range is 10 seconds (“0 hour 0 min 10 sec”) to “9999 hour, 59 min 59 sec”.• If clock timing control is set longer than the timer setting, integration starts at the clock start
time and stops when the timer has expired (the clock stop time is ignored).
• Pressing before the timer expires during timer controlled integration stops integration
and retains the integration values. In this instance, pressing again resumes integration
and continues for the set timer duration (additional integration).
Display the [Time] page
to enable (set to [ON])
To interrupt integration:
Press again.
Use the F keys to set the timer
Press to start integration, which stops
automatically after the set time elapses.
Select [Timer mode]
Select a [Timer setting] digit
Lights green

4.3 Integration Value Observation
71
4
Chapter 4 V
iewing M
easurement V
alues
After pressing , the instrument waits until the specified clock start time. Integration then begins and
continues until the specified clock stop time. If auto-saving is enabled, integration values are saved to CF card at the specified start and stop times. Ifan interval time is also specified, total integration values up to that point are saved after each interval.
Clock-Controlled Integration
Setting Procedure
• Clock control settings are in 1-minute units.• Clock setting years are AD (Christian Era), and 24-hour time (e.g., December 6th 2017, 10:16
PM appears as 2017-12-06 22:16) • If a specified clock time has already passed, clock control is considered to be disabled (OFF).• When integration is interrupted during clock timing control, clock control is disabled (OFF).• If clock timing control is set longer than the timer setting, integration starts at the clock start
time and stops when the timer has expired (the clock stop time is ignored). • Integration stops after 9999 hours, 59 minutes, and 59 seconds if the time between clock start
and stop times is set longer than that.
Display the [Time] page
Select [Real time]
Select a [Start time]and [Stop time] digit
(automatically starts and stopsat the specified clock times)
To abort automatic control (while waiting):
Press again.
Use the F keys to set the timer
to enable (set to [ON])
During wait: lights yellowAt the start time: lights green

4.4 Viewing Harmonic Measurement Values
72
The results of harmonic analysis of voltage, current and active power on the same channel can be dis-played as a bar graph. Numerical data for the cursor-selected order is also displayed.
Press to display the Measurement screen.
Press to select the desired [CH] page, and press .
4.4 Viewing Harmonic Measurement Values
4.4.1 Displaying the Harmonic Bar Graph
HarmonicVoltage
HarmonicCurrent
HarmonicActivePower
Amplitude
Content (%)
Phase Angle
Harmonic Sync Source Frequency
Changing the Displayed Order
Change the selected order.
The green bar indicates the selected order.
These selections correspond to the orders on the Harmonic Vector screen.
Shows the measured values of thecursor-selected order.

4.4 Viewing Harmonic Measurement Values
73
4
Chapter 4 V
iewing M
easurement V
alues
Changing Display Settings
Select the item
Enter
Selects from the pull-downmenu
Cancel
Displays the pull-downmenu
Channels in the same wiring
Displayed item
Vertical axis display
Maximum harmonic order to display
Channel Changes channels in the same wiring system.(Example) In the 3P4W wiring
CH1, CH2, CH3, CH123
Display Contents
Changes the display contents
Amplitude, Content, Phase angle
• The phase angle of harmonic active power is equivalent to the harmonic voltage-current phase difference.
• The scale of the vertical axis is a percentage of the range of the selected amplitude.• This selection is the same as on the Harmonic List screen.
A gray bar may be displayed when phase angle is selected, indicating that the corre-sponding amplitude is very low (less than 0.01% f.s.).
Highest Order Display
Changes the highest order displayed
100th order, 50h order, 25th order
This selection is the same as on the Harmonic List screen.
Depending on the sync frequency used for measurement, the specified maximum ordermay not be displayable.See "Highest order analysis and window waveforms" (p. 182)
Vertical Axis Display Type
Changes the vertical axis display type.
Linear Linear display
Log Logarithmic display (allows easier viewing of small values)
When the display content is phase angle, the [Linear] setting is fixed and cannot bechanged.

4.4 Viewing Harmonic Measurement Values
74
The results of harmonic analysis of voltage, current and active power on the same channel can bedisplayed as a list.
Press to display the Measurement screen.
Press to select the desired [CH] page, and press .
See p. 73 for the procedures to change the display settings.
4.4.2 Displaying the Harmonic List
DisplayedItem
Display Contents
Highest DisplayedOrder
Changing Display Settings
Displayed Item
Changes item (physical quantity) to be displayed.(Example) In the 3P4W wiring
U1, I1, P1, U2, I2, P2, U3, I3, P3, P123
Display Contents
Changes the highest order displayed
Amplitude, content (%) and phase angle
• The phase angle of harmonic active power is equivalent to the harmonic voltage-current phase difference.
• This selection is the same as on the Harmonic Bar Graph screen.
Depending on the sync frequency used for measurement, the specified maximum ordermay not be displayable.See "Highest order analysis and window waveforms" (p. 182)
Highest Displayed Order
Changes the highest order displayed
100th order, 50h order, 25th order
This selection is the same as on the Harmonic Bar Graph screen.

4.4 Viewing Harmonic Measurement Values
75
4
Chapter 4 V
iewing M
easurement V
alues
The voltage, current, and phase angle of each harmonic order are displayed in a vector plot showing thephase relationship between voltage and current. Numerical values for the selected order are also displayed.
Press and then to select the [Vector] page.
4.4.3 Displaying Harmonic Vectors
Vector Plot
Measurement Channel Measurement Data Change vector display magnification
• Voltage and current for all channels are displayed on one screen.• Voltage-current phase angles are determined relative to the (0°) standard of the fundamental
waveform used as the harmonic sync source. • The phase angle of harmonic active power is equivalent to the harmonic voltage-current
phase difference of the same order on the same channel.
Changing the Displayed Order
Changes the order.
Displays the vectors for the selected order.
This selection is the same as on the Harmonic BarGraph screen.
Changes to the mea-surement values of the cursor order.

4.4 Viewing Harmonic Measurement Values
76
Measurement Channel
Change the channels to be displayed. Setting channels that are not used to[OFF] can simplify the display.
Changing Display Settings
Select the item (channel)
Enter
Selects from the pull-downmenu
Cancel
Displays the pull-downmenu
Measurement Channel
ON Vector and numerical values are displayed
OFF Vector and numerical values are not displayed

4.4 Viewing Harmonic Measurement Values
77
4
Chapter 4 V
iewing M
easurement V
alues
The [Harm sync src] has to be selected for harmonic analysis. Available selections depend on the inputsource.
• Using a measurement voltage or current input as the sync source
The frequency of the measurement voltage or current waveform is sampled for harmonic analysis syn-chronization.For all channels, the (0°) reference point for all phase angle measurements is the fundamental wave-form of the harmonic sync source.
• Using the instrument's internal fixed clock as the sync source
Waveforms are sampled in synchronization with the 50 ms timing used by the instrument for dataupdate and for harmonic analysis. Use this source when no input is stable enough for synchronization.When DC100 ms is selected, 50 Hz is measured as the fifth-order harmonic, and 60 Hz as the sixth-order harmonic.
• Using an external signal as the sync source (PW3390-03)
This setting is available only when Motor analysis function is installed and CH B is set for pulse input.Waveforms are sampled in synchronization with the rising edges of the pulses input on CH B to per-form harmonic analysis.See "4.8.1 Motor Input Settings" (p. 96)
4.4.4 Selecting the Harmonic Sync Source
U1 to U4, I1 to I4
DC50 ms, DC100 ms
Ext
• The same harmonic sync source is shared by all channels. Harmonic analysis cannot be per-formed correctly on channels with input frequency different from the selected harmonic syncsource.
• The harmonic sync source selected here is also used as the sync source for waveform dis-plays.
• Correct analysis is not possible in the following situations:1. If the sync source signal is very distorted2. If the sync source signal frequency is below the lower limit of the valid range3. If the sync source frequency is unstable
Display the [Input] page
Select with the F keys
About [Next],See "2.2 Basic Operations" (p. 18)
Select the item

4.4 Viewing Harmonic Measurement Values
78
Select whether to use THD-F or THD-R method to calculated total harmonic distortion. The selected cal-culation method is applicable to both harmonic voltage and current.
4.4.5 Selecting the THD Calculation Method
THD-FThe percentage of total harmonics relative to the fundamental waveformThis setting is generally used in testing that conforms to IEC and other standards. (Default setting)
THD-RThe percentage of total harmonics relative to the sum of the total harmonics and the funda-mental waveformThis setting will yield a lower value than THD-F for highly distorted waveforms.
Display the [Input] page
Select with the F keys
What is THD?THD is an abbreviation for total harmonic distortion: the total amount of signal distortion causeby all harmonics.
Select the item

4.5 Viewing Waveforms
79
4
Chapter 4 V
iewing M
easurement V
alues
Waveforms of voltage and current measured on up to four channels can be displayed separately accord-ing to voltage, current, or channel.Waveforms are sampled at 500 kS/s, with the displayed time span per screen determined by the timing ofthe harmonic sync source.The waveform span displayed on one screen is determined by the [Time scale] setting.
4.5 Viewing Waveforms
4.5.1 Displaying Waveforms
Displaying Voltage and Current Waveforms Separately
Display the [Wave + Noise] page
Select [U/I](Current/Voltage)
Displays four overlapping voltage waveforms
Displays four overlapping current waveforms
Negative Peak Value (pk-)
Positive Peak Value (pk+)
Waveform color appears when enabled (ON).
Waveform Display Enable/Disable (p. 81)
RMS (rms)

4.5 Viewing Waveforms
80
Displaying Separate Channel Waveforms
Select [CH](Separate Channel)
Voltage Scale(Positive-only display)
Current Scale(Negative-only display)
RMS (rms)
Waveform Display En-able/Disable (p. 81)
Negative Peak Value (pk-)
Positive Peak Value (pk+)
Waveform color ap-pears when enabled (ON).
• Waveforms and numerical measurement values displayed at the right are not synchronizedwith measurement timing.
• Displayed waveform values are not the calculated RMS and peak numerical values.• The vertical axis of the waveform is displayed as a percentage of the full-scale range of each
channel, so the amplitudes of different channels are not directly comparable.• To display waveforms starting from zero amplitude, see "Zero-Crossing Filter Setting Proce-
dure" (p. 57).• Pressing the HOLD key will trigger the HOLD state. However, display data updates will not
function for the waveform display. See "5.3.1 Data Hold Function" (p. 110).

4.5 Viewing Waveforms
81
4
Chapter 4 V
iewing M
easurement V
alues
Select whether to display or not display waveforms.Available settings are [U/I] and [CH].
Hiding and Displaying Waveforms
ON Display waveforms
OFF Do not display waveforms
Selects from the pull-down menu
Displays the pull-downmenu
Select the channel to change
Enter Cancel
The waveform displayed on the screen orthe waveform data saved in "SavingWaveform Data" (p. 136) always uses thePeak-Peak compressed waveform datasampled at 500 kS/s.Therefore, even if the sampling speed isset low, it will be an accurate waveformwith peak information of the waveformbefore compression. The data of saved waveform data islinked to the same number of points fornoise analysis, and for each point, themaximum value and minimum value inthe figure on the right are both saved.
Waveform data for 50 kS/s
Sampling value for 500 kS/s
Maximum value
Minimum value
Waveform for 50 kS/s
Maximum value
Minimum value
• To shorten the time it takes to renew the waveform display, decrease the number of pointsfor noise analysis. The quickest display renewal is 1000 points. See "4.6.2 Setting theSampling Frequency and Points" (p. 85)
• Changing the settings for waveform display and noise analysis do not affect the electricpower or the sampling for harmonic measurement.

4.5 Viewing Waveforms
82
Waveforms can be reduced and enlarged for convenient viewing, and to confirm details. Make this settingusing the cursor keys on the [Wave + Noise] page.See "4.5.1 Displaying Waveforms" (p. 79)
Voltage and current waveforms can be vertically resized (magnification is the same for all channels).
4.5.2 Resizing Waveforms
Changing Vertical Axis Magnification
Press or
Selects from thepull-down menu
Displays the pull-down menu
Enter Cancel
Select the desired magnifi-cation from 1/4× to 50×
Select U (voltage)or I (current) for resizing
Changing Horizontal Axis Magnification (Timebase)
Select [Time scale]
Selects from thepull-down menuSee Chart in below.
Displays the pull-down menu
Enter Cancel
• The waveform sampling rate is fixed at 500 kS/s.• Available timebase selections depend on the selected number of noise analysis points, as follows.
Selected No. of Points
Timebase Selections
1000 0.2 ms/div 0.4 ms/div 1 ms/div 2 ms/div 4 ms/div 10 ms/div5000 1 ms/div 2 ms/div 5 ms/div 10 ms/div 20 ms/div 50 ms/div
10000 2 ms/div 4 ms/div 10 ms/div 20 ms/div 40 ms/div 100 ms/div50000 10 ms/div 20 ms/div 50 ms/div 100 ms/div 200 ms/div 500 ms/div

4.6 Viewing Noise Measurement Values (FFT Function)
83
4
Chapter 4 V
iewing M
easurement V
alues
Perform FFT analysis on a selected channel's voltage and current to display noise up to 100 kHz as agraph and as numerical values. This function is convenient for monitoring an inverter's carrier frequency,harmonic noise ingress on commercial power lines, or DC power.
The numerical noise values can be saved to storage media.See "7.5.3 Selecting Measurement Items to Save" (p. 134)
(Select [Other] with the key and set the noise peak value.)
Noise voltage and current can be displayed in separate graphs along with numerical values. Numerical noise voltage and current values at ten frequencies are displayed in order of decreasing amplitude.
4.6 Viewing Noise Measurement Values (FFT Function)
4.6.1 Displaying Noise Voltage and Current
Horizontal Axis Linear frequency scale
Vertical Axis Logarithmic noise amplitude scale
Displaying Noise
Select [Noise]
Display the [Wave + Noise] page
Noise Voltage Graph
Noise Current Graph
Noise Voltage Numerical Value
Noise Current Numerical Value

4.6 Viewing Noise Measurement Values (FFT Function)
84
The waveform to be analyzed and it's noise analysis results can be displayed at the same time.
Displaying Waveforms and Noise
Pressing the HOLD key will trigger the HOLD state. However, display data updates will notfunction for the waveform display. See "5.3.1 Data Hold Function" (p. 110)
Select [Wave + Noise]
Display the [Wave + Noise] page
Voltage and Current Waveforms
Voltage and Current Noise Graphs
Noise Voltage Numerical Value
Waveform Colors
Voltage Yellow
Current Red
Noise Current Numerical Value

4.6 Viewing Noise Measurement Values (FFT Function)
85
4
Chapter 4 V
iewing M
easurement V
alues
Set the FFT sampling rate and number of points according to the frequency of the noise to be analyzed.These settings are on the [Calc] page of the Setting screen.
Sampling can be selected at the [Noise] setting on the [Wave + Noise] page of the Measurement screen.How to display, see "Displaying Noise" (p. 83).
4.6.2 Setting the Sampling Frequency and Points
Changing Sampling on the Measurement Screen
Select the item
Display the [Calc] page
Select with the F keys
See Screen display procedure:"Displaying Noise" (p. 83)
Select the item
Enter
Selects from the pull-downmenu
Cancel
Displays the pull-downmenu
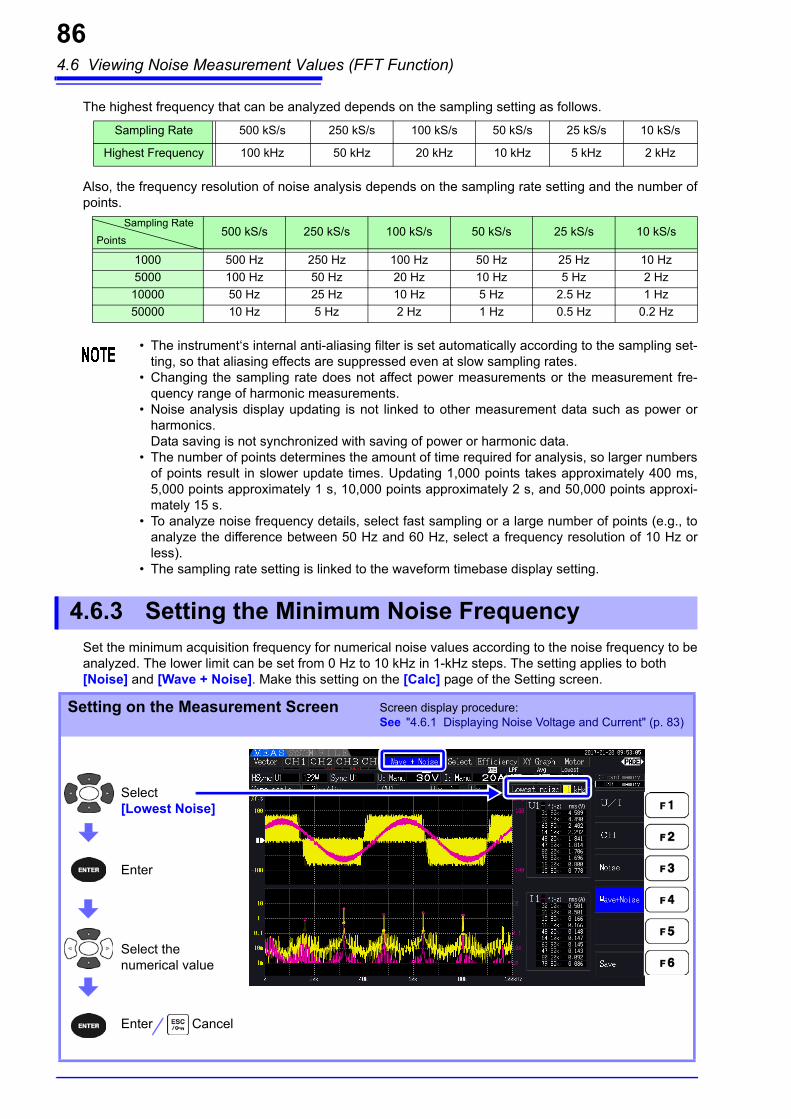
4.6 Viewing Noise Measurement Values (FFT Function)
86
The highest frequency that can be analyzed depends on the sampling setting as follows.
Also, the frequency resolution of noise analysis depends on the sampling rate setting and the number ofpoints.
Set the minimum acquisition frequency for numerical noise values according to the noise frequency to beanalyzed. The lower limit can be set from 0 Hz to 10 kHz in 1-kHz steps. The setting applies to both [Noise] and [Wave + Noise]. Make this setting on the [Calc] page of the Setting screen.
Sampling Rate 500 kS/s 250 kS/s 100 kS/s 50 kS/s 25 kS/s 10 kS/s
Highest Frequency 100 kHz 50 kHz 20 kHz 10 kHz 5 kHz 2 kHz
500 kS/s 250 kS/s 100 kS/s 50 kS/s 25 kS/s 10 kS/s
1000 500 Hz 250 Hz 100 Hz 50 Hz 25 Hz 10 Hz
5000 100 Hz 50 Hz 20 Hz 10 Hz 5 Hz 2 Hz
10000 50 Hz 25 Hz 10 Hz 5 Hz 2.5 Hz 1 Hz
50000 10 Hz 5 Hz 2 Hz 1 Hz 0.5 Hz 0.2 Hz
• The instrument‘s internal anti-aliasing filter is set automatically according to the sampling set-ting, so that aliasing effects are suppressed even at slow sampling rates.
• Changing the sampling rate does not affect power measurements or the measurement fre-quency range of harmonic measurements.
• Noise analysis display updating is not linked to other measurement data such as power orharmonics. Data saving is not synchronized with saving of power or harmonic data.
• The number of points determines the amount of time required for analysis, so larger numbersof points result in slower update times. Updating 1,000 points takes approximately 400 ms,5,000 points approximately 1 s, 10,000 points approximately 2 s, and 50,000 points approxi-mately 15 s.
• To analyze noise frequency details, select fast sampling or a large number of points (e.g., toanalyze the difference between 50 Hz and 60 Hz, select a frequency resolution of 10 Hz orless).
• The sampling rate setting is linked to the waveform timebase display setting.
Sampling Rate
Points
4.6.3 Setting the Minimum Noise Frequency
Setting on the Measurement Screen Screen display procedure:See "4.6.1 Displaying Noise Voltage and Current" (p. 83)
Select the numerical value
Enter
Select [Lowest Noise]
Enter Cancel

4.6 Viewing Noise Measurement Values (FFT Function)
87
4
Chapter 4 V
iewing M
easurement V
alues
A numerical noise value is recognized as a peak value when its amplitude is greater than the levels of thenext lower- and higher-frequency points in voltage and current FFT calculation results, and the ten high-est peak values are acquired. In this case, frequencies below the set minimum noise frequency are ignored.
Settings on the Setting Screen
The range of available settings for the minimum noise frequency depends on the noise sam-pling rate setting.
Select the item
Display the [Calc] page
Select with the F keys
Minimum Noise FrequencyFrequency
Level
Noise Sampling Rate 500 kS/s 250 kS/s 100 kS/s 50 kS/s 25 kS/s 10 kS/s
Minimum Noise Frequency
0 to 10 kHz 0 to 9 kHz 0 to 4 kHz 0 to 1 kHz

4.6 Viewing Noise Measurement Values (FFT Function)
88
Select the measurement channels and Window function for noise analysis calculations.
Measurement Ch Select the measurement channel for noise analysis calculations.
Window type Select a Window type.
4.6.4 Measurement Channel and Window Function Settings
Select with the F keys
Display the [Calc] page
Select [Analysis CH] or [Window type]
What is a Window type?Noise analysis is performed by applying FFT calculations to a specific interval of a waveformdefined by the specified number of points at the specified sampling rate. The processing of anextracted interval of a waveform is called "Window processing." The FFT calculation of thespecified waveform interval is supposed to be repeated periodically. On this instrument, the displayed waveform is shown with the defined window.
When the number of points specified for FFT calculation does not coincide with the measure-ment waveform period, the edges of the waveform within the window become discontinuous(called "leakage errors"), and non-existent noise is detected. The Window type provide means of suppressing leakage errors by smoothly connecting theedges of the waveforms.
Original Time Waveform Supposed Waveform for FFT
Time Waveform Set No. of PointsSet No. of PointsTime Waveform
CH1, CH2, CH3, CH4
RectangularThis type of window function is effective when the measurement wave-form period is an integer multiple of the FFT calculation interval.
HannThis type of window function is effective when the rectangular window is not, and when frequency resolution is the primary concern. (Default set-ting)
Flat-TopThis type of window function is effective when the rectangular window is not, and when amplitude resolution is the primary concern.

4.7 Viewing Efficiency and Loss Measurement Values
89
4
Chapter 4 V
iewing M
easurement V
alues
This instrument uses active power and motor power values to calculate and display efficiency (η [%]) andloss [W]. For example, inverter input-output efficiency and internal loss, and motor input-output efficientand loss, as well as total efficiency, can be calculated by a single instrument.
4.7 Viewing Efficiency and Loss Measure-ment Values
• Motor power (Pm) measurement can only be selected on models equipped with motor analy-sis functionality.
• Measurement values may be scattered when measuring severely fluctuating or transientloads. In that case, use the averaging function.
• On wiring systems with different power ranges, calculations use the data from the highestpower range.
• On wiring system with different sync sources, calculations use the most recent data at calcu-lation time.
• When either one of the output power is a direct current (DC), making the synchronizedsource setting for the channel to measure DC the same as the alternating current side cansuppress the unevenness of the efficient measurement value. E.g., in the following connec-tion example (p. 91) on "Measuring Efficiency and Loss of a Switching Power Supply" in gen-eral the CH1 synchronization source is set to U1, while the CH2 synchronization source is setto 50 msDC, but when the fluctuation is great and there is unevenness in the efficient mea-surement value, set the CH2 synchronization source to U1 same as CH1.
4.7.1 Displaying Efficiency and Loss
Press and then to select the [Efficiency] page.
Efficiency
Loss
• The display range for Efficiency (η [%]) is 0.00% to 200.00%.
• The display range for Loss [W] is 0% to ±120% of the power range.

4.7 Viewing Efficiency and Loss Measurement Values
90
Up to three formulas (η1 to η3, and Loss1 to Loss3) can be selected for Efficiency (η) and Loss calcula-tions. Select the calculation items from all Pin and Pout active power values to be applied to the followingformulas.
η = 100 × |Pout|/|Pin|Loss = |Pin| - |Pout|
4.7.2 Selecting the Calculation Formula
Display the [Calc] page
Select the item
Select with the F keys
[Pm] can be selected on models equipped with motor analysis functionality while using the fol-lowing settings:
CH A units mN• m, N• m, kN• m
CH B units r/min

4.7 Viewing Efficiency and Loss Measurement Values
91
4
Chapter 4 V
iewing M
easurement V
alues
Here is an efficiency and loss measurement example.Before measuring, perform the preparations in "Chapter 3 Measurement Preparations" (p. 25)), andmake the appropriate connections and settings.
Example: The input and output sides of the switching power supply are connected to CH 1 and CH 2 ofthe instrument, respectively.
4.7.3 Measurement Examples
Measuring Efficiency and Loss of a Switching Power Supply
Connection Example
Required items:• L9438-50 Voltage Cord ×2• 9272-05 Clamp On Sensor ×1
...................................................... input side• CT6841-05 AC/DC Current Probe ×1
......................................................output side
Input side Output side
SwitchingPower Supply
Wiring Mode Setting
Wiring Mode 1 [1P2W] × 4 systems
Calculation Formula Setting
Set Pin1 to P1, and Pout1 to P2
Calculation Formulaη1 = 100 × |P2|/|P1|Loss1 = |P1| - |P2|

4.7 Viewing Efficiency and Loss Measurement Values
92
Example: Inverter input is connected to CH 3, and the outputs are connected to CH 1 and CH 2 of theinstrument.
Measuring Efficiency and Loss of an Inverter
Connection Example
Required items:• L9438-50 Voltage Cord ×3• 9272-05 Clamp On Sensor ×1
......................................................input side• CT6843-05 AC/DC Current Probe ×2
......................................................output side
Input side Output side
Inverter
Wiring Mode Setting
Wiring Mode 3[3P3W2M] + [1P2W] × 2 systems
Calculation Formula Setting
Set Pin1 to P3, and Pout1 to P12
Calculation Formulaη1 = 100 × |P12|/|P3|Loss1 = |P3| - |P12|

4.7 Viewing Efficiency and Loss Measurement Values
93
4
Chapter 4 V
iewing M
easurement V
alues
Example: Inverter inputs are connected to CH 1 and CH 2, inverter outputs to CH 3 and CH 4 of theinstrument, analog output from the tachometer to rotation signal input CH B, and analog output from thetorque meter to torque signal input CH A.How to connect torque meter or tachometer, see 8.5 ( p.162).
Measuring Efficiency and Loss of an Inverter and Motor
Connection Example
Wiring Mode Setting
Calculation Formula Setting
Required items: Requires the PW3390-03 (model with motor analysis and D/A output).• L9438-50 Voltage Cord ×4• 9272-05 Clamp On Sensor ×2 ...............input side• CT6843-05 AC/DC Current Probe ×2 ....output side• Tachometer ×1 .....With pulse output capability• Torque Meter ×1• L9217 Connection Cord ×2
Input side Output side
Inverter Motor
Tachometer
Torque Meter
Wiring Mode 6[3P3W2M] × 2 systems
Set Pin1 to P12, and Pout1 to P34
Calculation FormulaInverter η1 = 100 × |P34|/|P12|, Loss1 = |P12| - |P34|Motor η2 = 100 × |Pm|/|P34|, Loss2 = |P34| - |Pm|Total η3 = 100 × |Pm|/|P12|, Loss3 = |P12| - |Pm|
Set Pin2 to P34, and Pout2 to Pm
Set Pin3 to P12, and Pout3 to Pm
The torque meter and tachometer should have the fastest possible output response time.

4.8 Viewing Motor Measurement Values (Model PW3390-03 only)
94
Motor analysis can be performed using the PW3390-03 (model with motor analysis and D/A output).When the motor analysis function is installed, the [Motor] page appears on the Measurement and Settingscreens.
The motor analysis function acquires signals from rotation-sensing devices such as a torque sensor androtary encoder and measures motor analysis items (torque, rotation rate, motor power and slip). Motor efficiency, total efficiency and loss can be calculated when combined with the "4.7 Viewing Effi-ciency and Loss Measurement Values" (p. 89) functions.
See Motor measurements can be displayed simultaneously with motor input voltage and current, power measure-ments and motor efficiency. "Selecting Measured Items for Display" (p. 46)
4.8 Viewing Motor Measurement Values (Model PW3390-03 only)
Setting the Motor Sync Source
Torque
Rotation Rate
Motor Power
Slip
Press and then to select the [Motor] page.
Motor Sync Source Setting CH A Range Setting CH B Range Setting
• When [CH A] measurement units are set to [V] and [Hz], or [CH B] units are set to other than[r/min], motor power [Pm] display is always disabled (“OFF”).
• When [CH B] measurement units are set to [V], slip cannot be calculated, and [- - - - - -] isdisplayed.

4.8 Viewing Motor Measurement Values (Model PW3390-03 only)
95
4
Chapter 4 V
iewing M
easurement V
alues
Execute zero adjustment to compensate for input signal bias before measuring analog DC voltage on CHA or CH B.
If a non-zero value is displayed for torque or rotation rate when no torque or rotation is occurring, executezero adjustment before applying any torque or rotation input.
Executing Zero Adjustment
• This particular zero adjustment function applies only to the motor analysis function, so theother input channels (CH 1 to CH 4) are unaffected. To execute zero adjustment on those chan-nels, see section "3.11 Attaching to the Lines to be Measured and Zero Adjustment" (p. 41).
• Zero adjustment is only applicable to analog DC input channels.• The maximum zero adjustment span is ±10% of the full-scale range, outside of which no
adjustment occurs.
Select
(a confirmation dialog box appears)
Enter Cancel
Display the [Motor] page

4.8 Viewing Motor Measurement Values (Model PW3390-03 only)
96
Set to suit the motor to be measured, or the connected torque sensor or tachometer.See "8.5 Using the Motor Testing" (p. 162)
Select the source of the signal that determines the period to serve as the basis for motor analysis calcu-lations. Motor analysis items are measured according to the period of the source selected here.
See "4.2.3 Selecting the Sync Source" (p. 56)The selected motor sync source is displayed as [Sync] on the Motor screen.
When CH A or CH B is set for Analog DC input, enable the filter to suppress harmonic noise. Measurements should normally be made with the filter disabled (OFF), but it should be enabled (ON)when measurement values are destabilized by the effects of external electrical noise.
4.8.1 Motor Input Settings
Basic Operating Procedure
Selecting the Motor Sync Source
Display the [Motor] page
Select with the F keys
Torque input setting
Revolution signal input setting
Motor Sync Source Low-Pass Filter Input Frequency Source
Select the item
U1 to U4, I1 to I4, DC50 ms (Default setting), DC100 ms, Ext
• All motor analysis items depend on the same sync source.• When measuring motor efficiency in combination with the functions of section "4.7 Viewing
Efficiency and Loss Measurement Values" (p. 89), select the same sync source as that of themotor voltage and current input channels. Optimum measurement accuracy is possible whenthe calculation periods are the same.
• [Ext] is only selectable when CH B is set for pulse input.
Low-Pass Filter (LPF) Settings
ON, OFF (Default setting)
• The LPF setting is the same for CH A and CH B. Independent setting is not available.• When CH A is set for frequency input and CH B is set for pulse input, the LPF setting has no
effect.

4.8 Viewing Motor Measurement Values (Model PW3390-03 only)
97
4
Chapter 4 V
iewing M
easurement V
alues
To calculate motor slip, select a reference source for measuring the motor input frequency.
See "4.2.4 Frequency Measurement Settings" (p. 58)
Select the type of input signal from the torque sensor connected to CH A.
CHA input
Available setting items depend on the state of the following settings.
Selecting the Input Frequency Reference Source
f1, f2, f3, f4
Slip Calculation Formula
CH B Measurement Units Calculation Formula
When [Hz]100 ×
When [r/min]100 ×
Input Frequency - |CH B Display Value|
Input Frequency
2 × 60 × Input Frequency - |CH B Display Value| × Set No. of Poles
2 × 60 × Input Frequency
• To calculate slip, set CH B to suit the rotation input signal.• As the input frequency, select the most stable signal from the voltage and current supplied to
the motor.
Setting Torque Input (CH A)
AnalogDC When the sensor outputs a DC voltage proportional to the torque
Freq When the sensor outputs a frequency proportional to the torque

4.8 Viewing Motor Measurement Values (Model PW3390-03 only)
98
When [CHA input] is set to [AnalogDC], set these three items to suit the sensor: [CHA range], [CHAscaling], and [CHA unit].
Example: When the rated torque is 500N• m and the torque sensor’s output range is ±10 V.
When [AnalogDC] is selected
CHA range 10 V
CHA scaling 50
CHA unit N•m
CHA range Select to suit the output voltage of the torque sensor.
1 V Range, 5 V Range, 10 V Range,
The CH A range can be selected with the voltage range keys from the Motor page of theMeasurement screen.
CHA scaling Settable from 0.01 to 9999.99. The measurement value displayed for CH A = CH A input voltage × CH A scaling value.Set [CHA unit] according to the torque value that corresponds to one volt of torquesensor output. (Scaling value = max. rated torque of sensor ÷ output scale voltage value)In this example, the scaling value is 50.(50 = 500 N• m ÷ 10)
CHA unit Set to suit the torque sensor.
V Select to display raw input voltage.
mN• m Select this for torque sensors rated at 1 mN• m to 999 mN• m per volt output.
N• m Select this for torque sensors rated at 1 N• m to 999 N• m per volt output.
kN• m Select this for torque sensors rated at 1 kN• m to 999 kN• m per volt output.
When CH A units are set to [V], motor power [Pm] is not displayed.

4.8 Viewing Motor Measurement Values (Model PW3390-03 only)
99
4
Chapter 4 V
iewing M
easurement V
alues
When [CHA input] is set to [Freq], make these four settings to suit the sensor: [CHA unit], [Ratedtorque], [Freq range fc], and [Freq range fd].
Example 1: Using a torque sensor rated at 500 N• m for an output span of 60 kHz ±20 kHz
Example 2: Using a torque sensor rated at 2 kN• m, with maximum positive rated torque providing 15 kHzoutput, and maximum negative rated torque providing 5 kHz output
When [Freq] is selected
CHA unit N• m
Rated torque 500
Freq range fc 60 kHz
Freq range fd 20 kHz
CHA unit kN• m
Rated torque 2
Freq range fc 10 kHz
Freq range fd 5 kHz
CHA unit Set to suit the connected torque sensor.
Hz, mN• m, N• m, kN• m
• When CH A units are set to [Hz], motor power (Pm) is not displayed.• Select fc+fd for frequencies below 100 kHz, and fc-fd for frequencies above 1 kHz.
Setting beyond the numerical value limits is not possible.
Rated torque Enter an integer from 1 to 999. Set the maximum rated torque of the torque sensor inthe corresponding CH A units.
Freq range fc Freq range fd
Set a value between 1 kHz to 100 kHz in 1 kHz steps.Set fc to the center frequency corresponding to zero torque, and set fd to the fre-quency corresponding to maximum rated torque.

4.8 Viewing Motor Measurement Values (Model PW3390-03 only)
100
Select the type of rotation signal to be applied to CH B
CHB input
Available setting items depend on the state of the following settings.
When [CHB input] is set to [AnalogDC], set these three items to suit the rotation signal: [CHB range],[CHB scaling], and [CHB unit].
When [CHB input] is set to [Pulses], make these five settings to suit the rotation signal: [CHB unit], [Max frequency], [No. of pulses], [Motor poles], and [CHZ].
Setting the Rotation Signal Input (CH B)
Analog DC For DC voltage proportional to the rotation rate
Pulse For pulse signals proportional to the rotation rate
When [Analog DC] is selected
CHB range Select to suit the applied rotation signal voltage input.
CHB scaling Settable from 0.01 to 9999.99. The measurement value displayed for CH B = CH Binput voltage × CH B scaling value. Set [CH B Units] according to the rotation ratethat corresponds to one volt of rotation signal.
CHB unit Always select r/min when measuring motor power (Pm).
1 V, 5 V, 10 V
V, Hz, r/min
• The CH B range can be selected with the current range keys from the Motor page ofthe Measurement screen.
• Set the number of motor poles when measuring the slip. (p. 101)
When [Pulses] is selected
CHB unit Always select [r/min] when measuring motor power (Pm).
Hz, r/min

4.8 Viewing Motor Measurement Values (Model PW3390-03 only)
101
4
Chapter 4 V
iewing M
easurement V
alues
The measurement range when CH B units are set to Hz is 0.5 Hz to 5 kHz.
Measurement values are calculated as
When the pulse signal input frequency is higher than the measurement range, set theappropriate pulse count.
No. of Poles × Pulse Input Frequency
2 × Pulse Count Setting
Max fre-quency
Determine the full-scale measurement value for CH B.For the digits displayed for rotation and motor power, the value calculated under thefrequency set here is determined as full-scale.Select a higher value closest to the maximum value of the voltage frequency inputtedin the motor. E.g., when a maximum voltage of 133 Hz inputs in the motor, select 500 Hz. (When CH B is set for D/A Output, this setting is the full-scale value.)
100 Hz, 500 Hz, 1 kHz, 5 kHz
Pulse Count Set the number of pulses per mechanical rotation, from 1 to 60,000.Available setting values are multiples of half the number of motor poles.(For a incremental type rotary encoder that provides 1000 pulses per rotation, set to 1000.)
+1/2 the number of motor poles, -1/2 the number of motor poles
Increment or decrement by 1/2 the number of motor poles.
+1/2 × 10 times the number of motor poles, -1/2 × 10 times the number of motor poles
Increment or decrement by 1/2 × 10 times the number of motor poles.
+1/2 × 100 times the number of motor poles, -1/2 × 100 times the number of motor poles
Increment or decrement by 1/2 × 100 times the number of motor poles.
No. of Motor Poles
Set the number of motor poles as an even number between 2 and 98. (The slip calculation and the rotation signal input as the frequency corresponding tothe mechanical rotation angle are converted to the frequency corresponding to theelectrical angle.)
+2, -2 Increment or decrement by 2.
+10, -10 Increment or decrement by 10.
The motor pole setting is enabled by pressing (Set). Be sure to press
(Set) after changing the setting.
CH Z Input Select the signal to input in CH Z
OFF Ignore CH Z (no connection to CH Z jack).
Z Phase Select this when inputting the original signal (generally known as Z Phase) pulse of the rotating angle.Used in "4.8.2 Measuring Motor Electrical Angle" and zero-clear the pulse counts of the CHB with this pulse when using multiple pulses of the CHB.
B Phase Select this when inputting the B Phase pulse of the rotary encoder. Used in "4.8.3 Detecting the Motor Rotation Direction"

4.8 Viewing Motor Measurement Values (Model PW3390-03 only)
102
If the [Harm sync src] is set to [Ext] when pulses are input to CH B for the rotation signal, voltage andcurrent phase shift based on the pulses can be seen.
Measuring Electrical Angle with Multiple Pulses• Use of the original signal (Z phase) is recommended. The original (Z phase) signal serves as a refer-
ence pulse for consistent phase measurements.• When multiple pulses are used as the rotation signal input without the original (Z phase) signal, the ref-
erence pulse is determined upon synchronization, so upon resynchronization after sync unlock occurs,a different pulse may become the reference standard.
4.8.2 Measuring Motor Electrical Angle
• Harmonic analysis by synchronization with the rotation signal input pulse requires that thepulse count be an integer multiple of the input frequency. For example, a 4-pole motorrequires a pulse count that is an integer multiple of two, and a 6-pole motor requires a pulsecount that is an integer multiple of three.
• When a motor with internal wiring is measured as a 3P3W3M wiring system, the voltage andcurrent phase angles can be measured using the Δ-Y transform function.
Single Pulses Multiple Pulses
Fundamental Frequency(U1)
Calculation Range Calculation Range
Fundamental Frequency(U1)
External Sync Signal External Sync Signal
Reference Reference Reference Reference
Phase difference

4.8 Viewing Motor Measurement Values (Model PW3390-03 only)
103
4
Chapter 4 V
iewing M
easurement V
alues
Press and then to correct (zero) any phase difference between the rotation signal input
pulse and U1 fundamental content.
Electrical Angle Measurement Example
Phase Zero Adjustment (PHASE ADJ)
• Phase zero adjustment is available only when CH B is set for pulse input and [Harm syncsrc] is set to [Ext]. Otherwise, performing this key operation has no effect.
• When harmonic synchronization is unlocked, this key operation has no effect.
• Press and then to clear the correction value.
1. Without providing current to a motor, rotate it from the load side while measuring the voltage inducedat its input terminals.
2. Perform phase zero adjustment. (Zero out any phase difference between the fundamental waveform of the induced voltage input asU1 and the pulse signal.)
3. Without providing current to a motor, rotate it from the load side while measuring the voltage inducedat its input terminals.Apply current to rotate the motor.(The voltage-current phase angle measured by the instrument is the electrical angle based on theinduced voltage phase.)
Phase difference is affected by the rotation input signal pulse waveform and the instrument’sinternal circuit delay, which cause measurement errors when measuring frequencies much dif-ferent from that at which phase zero adjustment was performed.
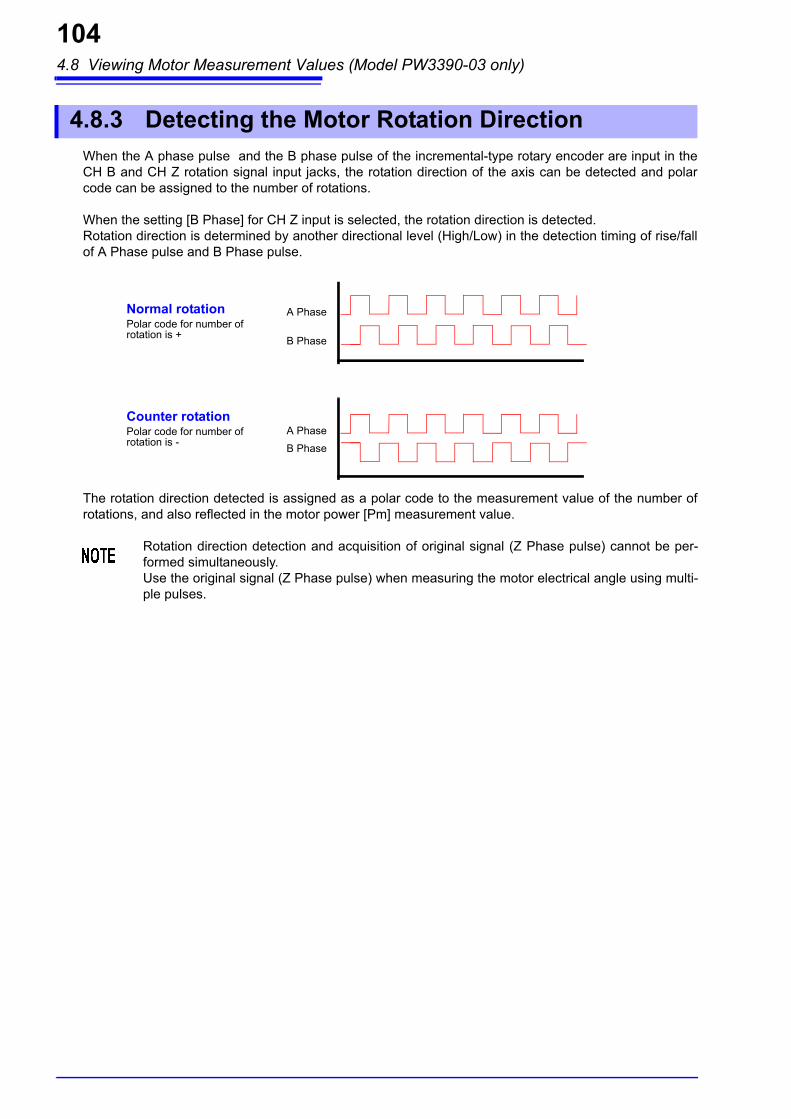
4.8 Viewing Motor Measurement Values (Model PW3390-03 only)
104
When the A phase pulse and the B phase pulse of the incremental-type rotary encoder are input in theCH B and CH Z rotation signal input jacks, the rotation direction of the axis can be detected and polarcode can be assigned to the number of rotations.
When the setting [B Phase] for CH Z input is selected, the rotation direction is detected.Rotation direction is determined by another directional level (High/Low) in the detection timing of rise/fallof A Phase pulse and B Phase pulse.
The rotation direction detected is assigned as a polar code to the measurement value of the number ofrotations, and also reflected in the motor power [Pm] measurement value.
4.8.3 Detecting the Motor Rotation Direction
Rotation direction detection and acquisition of original signal (Z Phase pulse) cannot be per-formed simultaneously.Use the original signal (Z Phase pulse) when measuring the motor electrical angle using multi-ple pulses.
A Phase
B Phase
Normal rotationPolar code for number of rotation is +
Counter rotationPolar code for number of rotation is -
A Phase
B Phase

5.1 Timing Control Functions
105
5
Chapter 5 O
perating Functions
Three types of timing controls are available: interval, count-down timer, and real-time clock settings. Tim-ing control can be applied to CF card saving and integration operations.See "4.3 Integration Value Observation" (p. 63), "7.5.2 Auto-Saving Measurement Data" (p. 131)
Operating Functions Chapter 5
5.1 Timing Control Functions
Interval timing control Controls repeating operations at a specific interval.
Timer timing controlControls operation for a specific count-down time. Combine with interval timing to specify the duration of interval timing operation.
Real-time clock timing control
Controls operation between specific real-time start and stop times. Combined with interval timing to specify when interval timing operation begins and ends.

5.1 Timing Control Functions
106
Before starting integration and saving using timing control functions • Before using automatic saving or integration, ensure that the real-time clock is correctly
set (p. 119).• The timing control cannot be set to CF card saving and integration independently.
• Integration is always active, so when a timing control function is active, appears on
the display. When timing control has stopped, press to reset integration and clear the
indicator.
• Even when a timing control function is enabled, you must press to begin operation.
About interval timing control• If the timer or clock control is not active, integration automatically stops at 9999 hours, 59
minutes, and 59 seconds. In this case, press to reset the integration value and
restart integration.• Interval timing is not available when the interval time setting is longer than the timer or
clock (start/stop) settings.• When the ending time of the timer or clock settings is different from the ending time of the
last interval, the timer or clock setting has priority. • When changing the interval setting, the number of recordable data items (p. 134) also
changes (longer intervals allow more data items to be recorded).
About timer timing control• When clock control settings define a time span longer than the timer setting, integration
starts at the specified clock start time, and stops when the timer setting has elapsed (anyclock control stop time is ignored).
• During integration and before the timer stops, pressing interrupts integration but
retains the integration value. In this case, pressing again resumes integration until
the timer stops ("additional integration").
About clock timing control• When clock control is enabled for a time span longer than the timer setting, integration
begins at the specified clock start time, and stops when the timer setting has elapsed (anyclock control stop time is ignored).
• When the set time has elapsed, real-time control is considered disabled [OFF].• When integration is interrupted during the clock control period, clock control is disabled
[OFF].See the graph in "4.3.4 Integration Combined with Timing Control" (p. 69) for integrationoperations.

5.1 Timing Control Functions
107
5
Chapter 5 O
perating Functions
Press and the keys to display the [Time] page.
Interval (The interval setting is also available on the [Interface] page.)
Timer mode/Real time
Timer setting Set the count-down timer. Settable range is 10 s to 9999 h 59 m 59 s.
Start timeStop time
Set start and stop times for clock timing. Select the year and the 24-hour time(e.g., 16 December, 2017 10:16 PM → [2017/12/06 22:16])
Setting Method
Interval control setting
Timer control setting
Clock control settings
1
2 Use F keys to set.
Select the item
Time↑/Time↓Select an interval time from 50, 100, 200, or 500 ms; or 1, 5, 10, 15, or 30 s; or 1, 5, 10, 15, 30, or 60 min.
OFF Interval time control is disabled.
ON Timer control/clock control is enabled.
OFF Timer control/clock control is disabled.
+1↑/-1↓ Increments/decrements by 1.
+10↑/-10↓ Increments/decrements by 10.
Digit←/Digit→ Moves to the [hour] digits.
+1↑/-1↓ Increments/decrements by 1.
+10↑/-10↓ Increments/decrements by 10.

5.2 Averaging Function
108
The averaging function averages measured values and displays the result. This function can be used toobtain more stable display values when measured values fluctuate and cause large variations in the dis-play.Performs averaging on all instantaneous measurement values, including harmonics and motor syncsource.
Averaging setting can be selected from the following.
* Period to be within the accuracy when the input changes from 0% to 100%f.s.
Averaging Method • Index averaging (applicable to 50 ms data update rate) • Averaging is applied to voltage (U), current (I), and power (P), before perform-
ing calculations.• For the harmonics, RMS values and percentage are calculated in average to
instantaneous values, and the phase angle is calculated in average of real partand imaginary part after FFT calculation.
• Phase differences, distortion ratios and unbalance ratios are calculated fromthe data averaged as above.
5.2 Averaging Function
OFF Averaging is disabled.
FAST Averaging is enabled. Response time* is 0.2 s.
MID Averaging is enabled. Response time is 1.0 s.
SLOW Averaging is enabled. Response time is 5 s.
SLOW2 Averaging is enabled. Response time is 25 s.
SLOW3 Averaging is enabled. Response time is 100 s.
• Peak, integration, and noise values are excluded.• When averaging is enabled, averaging is applied to all data being saved.

5.2 Averaging Function
109
5
Chapter 5 O
perating Functions
The averaging setting is displayed under [Avg] at the top of the Measurement screen.
Press and the keys to display the [Calc] page.
Configuring averaging on the Measurement screen
1
2 Press the key and then
use the and keysto select the desired setting. Press the keys repeatedly to vary the setting among the following values: OFF ↔ FAST ↔ MID ↔ SLOW ↔ SLOW2 ↔ SLOW3.
Configuring averaging on the Settings screen
Select the item1
2 Use F keys to set.

5.3 Data Hold and Peak Hold Functions
110
Pressing disables updating of all displayed measurement values and waveforms. In this state,
data on other screens can be viewed as it was when was pressed.
The data update of internal measurement values is not synchronized to the display update. The internalmeasurement values are updated in 50 ms (internal data update rate). The waveform and noise data isupdated at the calculation completion. However, the waveform and noise display is not updated.
While data hold is active, is displayed and the key lights red.
Display data update
After pressing , the display data is next updated at the end of the mea-
surement interval or when an external sync signal is received.
Output data When the display is HOLD, the HOLD value is keep on outputting for the D/Aoutput, CF card save and communication. However, the waveform output contin-ues to output the instantaneous data regardless to the HOLD status.
5.3 Data Hold and Peak Hold Functions
5.3.1 Data Hold Function
To cancel Data Hold:
Press , then press .
Indicates Data Hold is active
Measurements, calculations and averaging continue unaffected internally.
Each time this key is pressed, the values measured at that time are displayed.
Displayed value
Data Hold activated
Display update and Data Hold activated
Data Hold activated
Update UpdateData HoldData Hold
Displayed value
Time
Internal measure-
ment value
• Clock and integration times and Peak Over display are unaffected by the Data Hold func-tion.
• Data Hold and Peak Hold functions cannot be activated simultaneously.• Settings cannot be changed while Hold is active.
• When AUTO ranging is enabled, the range is fixed at that used when is pressed.
• key operation is recognized before and during use of the timer control functions.
When an interval time is set: the display updates at each interval, and display data is held for theduration of the interval.When the timer or clock control is set: the display updates and holds the values at the stop time.
• When auto-saving at a specified interval, data is saved immediately before displayupdate.
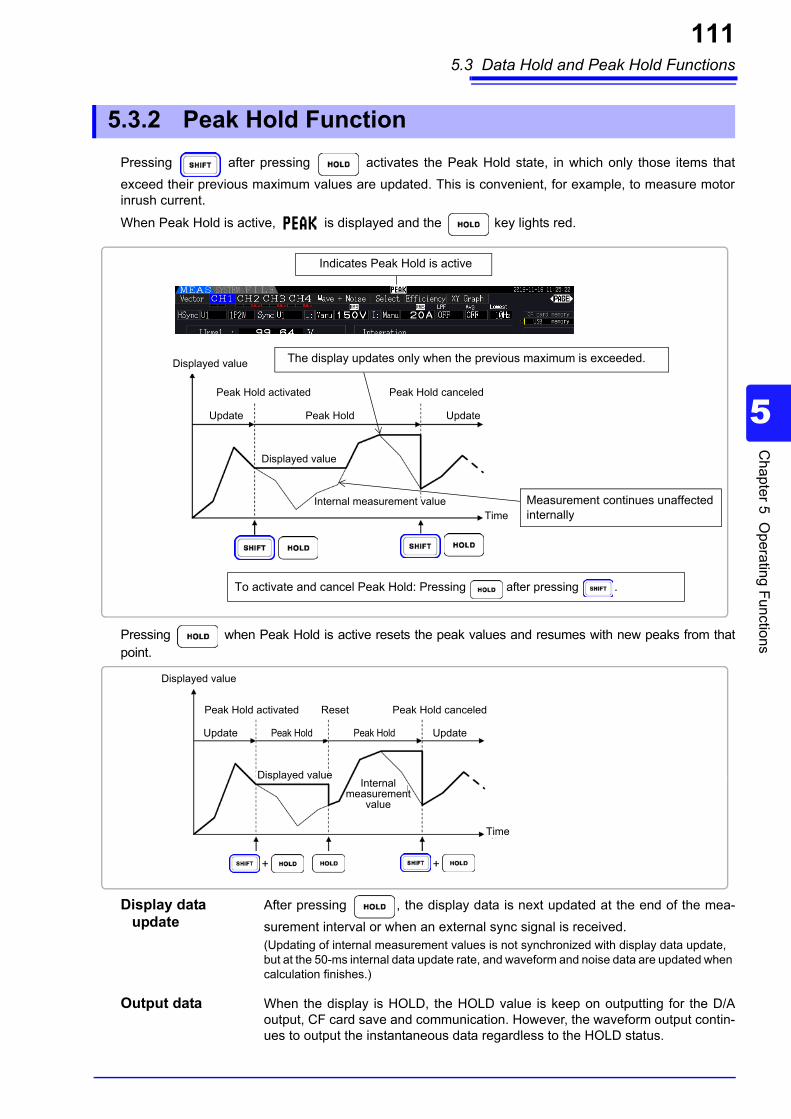
5.3 Data Hold and Peak Hold Functions
111
5
Chapter 5 O
perating Functions
Pressing after pressing activates the Peak Hold state, in which only those items that
exceed their previous maximum values are updated. This is convenient, for example, to measure motorinrush current.
When Peak Hold is active, is displayed and the key lights red.
Pressing when Peak Hold is active resets the peak values and resumes with new peaks from thatpoint.
Display data update
After pressing , the display data is next updated at the end of the mea-
surement interval or when an external sync signal is received.(Updating of internal measurement values is not synchronized with display data update, but at the 50-ms internal data update rate, and waveform and noise data are updated when calculation finishes.)
Output data When the display is HOLD, the HOLD value is keep on outputting for the D/Aoutput, CF card save and communication. However, the waveform output contin-ues to output the instantaneous data regardless to the HOLD status.
5.3.2 Peak Hold Function
To activate and cancel Peak Hold: Pressing after pressing .
Indicates Peak Hold is active
Measurement continues unaffected internally
The display updates only when the previous maximum is exceeded.Displayed value
Peak Hold activated
Update UpdatePeak Hold
Displayed value
Internal measurement valueTime
Peak Hold canceled
Displayed value
Peak Hold activated
Update UpdatePeak Hold
Peak Hold canceled
Peak Hold
Displayed value
Time
Reset
Internal measurement
value
+ +

5.3 Data Hold and Peak Hold Functions
112
When the interval timer is used, the maximum value within each interval is displayed.
When the timer or clock control is enabled, the maximum value between starting and stopping times isdisplayed (and held).
• Waveform displays and integration values are unaffected by Peak Hold.• When averaging is enabled, the maximum value is recognized only after measured values
have been averaged.• Data Hold and Peak Hold functions cannot be activated simultaneously.• The display shows [- - - - - -] for over-range values. In this case, temporarily cancel Peak
Hold and switch to the appropriate range. • Maximum values for Peak Hold are absolute values, so if -60 W is measured after +50 W,
the absolute value of -60 W is larger, and the display shows [-60W].• Settings cannot be changed while Peak Hold is active.• When auto-saving at a specified interval, data is saved immediately before the display
update.
Using Peak Hold with Timing Control Functions
Display Value
Peak Hold activated
Displayed value
Peak Hold canceled
Interval Time
Interval Time
Interval Time
Internal measurement
valueTime
Update
Starting Interval Ending Interval+ +
Display Value
Peak Hold activated
Peak Hold canceled
Update
Display Value
Time
Timer Start
Timer Stop
Timer StopMaximum measurement value acquired
Internal measurement
value
+ +
• The Peak Hold function can be enabled either before or during timing control operation.However, when timing control is active, the maximum value is obtained only after the timethe Peak Hold function is enabled.
• The time of maximum input occurrence is not displayed.• See "5.1 Timing Control Functions" (p. 105) for details about settings for the interval,
timer and clock timing controls.

5.4 X-Y Plot Function
113
5
Chapter 5 O
perating Functions
Select parameters for x and y (horizontal and vertical) axes in the basic measurement items to createsimple X-Y graphs. Plot screens can be saved and printed as screen capture images.
Press and key to display the [XY Graph] page.
X-Y graph plotting starts, and proceeds at the display update rate.
5.4 X-Y Plot Function
XY Graph Display
Press to clear
and restart plotting.
• Plotted data is not stored in memory, so it is lost when the screen is changed.• When the items with AUTO ranging is selected, the data is cleared when the internal
range is switched in AUTO ranging.
Display Setting Procedure
Enter
Select a parameter for display.
Cancel
Enter
(Displays the pull-down menu)
Displayed data is cleared, and plotting restarts.
Move the highlight cur-sor the display item (parameter) to change.
Display item (Parameter)One x-axis parameter and two y-axis parameters can be set.

5.5 Delta Star Transform Function
114
For 3P3W3M wiring systems (wiring mode 7 on p.37), Δ (Delta) wiring configuration values are converted toY (Wye) wiring values ('star' configuration) so that measured values are equivalent to those of 3P4W lines.
When this function is enabled, even when a motor has internal Wye wiring and the central (neutral) pointis inaccessible, it can be measured using phase voltage to emulate the Wye configuration.
Δ-Y transform analyzes voltage waveforms after performing vector conversion using a virtual neutral.Although voltage waveforms, voltage measurement values, and harmonic voltages are all input as linevoltages, they are calculated as phase voltages.
Illustration of Δ-Y transform
5.5 Delta Star Transform Function-Y( )
A
BC
A
BC
U1
U2
U3 U1
U2
U3

5.5 Delta Star Transform Function
115
5
Chapter 5 O
perating Functions
Setting Procedure
Display the [Input] page
Use F keys to select
Select [Δ -Y convert]
The Measurement screen appears as follows.
• Δ-Y transform is only selectable for 3P3W3M wiring.
• When Δ-Y transform is enabled, the vector diagram on the Wiring screen is the same asthat for 3P4W (instead of the 3P3W3M vector diagram).
• When auto-ranging voltage and Δ-Y transform are enabled, the range-switching level for the
next lower range is calculated to be times (approx. 0.57735 times) the full-scale rangevalue.See"Auto-Ranging Span" (p. 55)
1 3⁄

5.6 Selecting the Calculation Method
116
A function to change the calculation methods of apparent power and reactive power when the wiring is3P3W3M (refer to "Wiring Mode 7. 3-phase, 3-wire (3P3W3M) + single-phase, 2-wire (1P2W)" (p. 37).When measuring the PWM waveform using the setting for rectification method "MEAN", it can improvethe mutual compatibility with measurement values of other wattmeter.
There are two types of settings, TYPE1 and TYPE2, and both are only valid during 3P3W3M wiring.
5.6 Selecting the Calculation Method
TYPE 1 The standard 3P3W3M calculation method.
TYPE 2 Calculation method to improve the mutual compatibility with 3V3A wiring of otherpower meter.Under sine wave input, there is no difference from the calculation results of TYPE1,but when the PWM waveform is measured using the setting for rectification method"MEAN", the values of S123, Q123, φ 123, and λ 123 is closer to the power meter for3V3A wiring than TYPE1.
Setting Procedure
• Use TYPE1 for general use. Use TYPE2 when mutual compatibility is necessary, such aswhen changing from the device currently in use.
• All measurement values are not affected except for values of S123, Q123, φ123, and
λ123.
• When the Δ-Y transform function is ON, there is no difference between the calculationresults of TYPE1 and TYPE2 even with PWM waveform.
Display the [Input] page
Select [Operation]
Use F keys to select

117
6
Chapter 6 C
hanging System
Settings
On the [System] page, view the instrument's version information and change settings such as displaylanguage, beep sounds, and screen colors.
Changing System Settings Chapter 6
[System] Page Display
Press followed by to display the [System] page.
Enable/disable beep sounds. (p. 118)
Select screen colors.(p. 118)
Select the display language. (p. 118)
Set LCD backlighting.(p. 118)
View the instrument's firmware version number.
View the instrument's serial number.
Execute system reset. (p. 120)
Check the instrument’s MAC address.
Select the startup (initial) screen.(p. 119)
Configure zero suppression. (p. 119)
Set the system's real-time clock.(p. 119)
Set the CSV file format.
Check the instrument model.

118
Use the keys to select an item, and the F keys to change its setting.
Language Select the language for the display.
Color Select the screen color scheme.
Beep Set to enable or disable key-press beep sounds.
LCD back light The backlight can be set to turn off after a period of key inactivity.The screen reappears upon pressing any key.
Setting Item Descriptions
English English
Japanese Japanese
Chinese Chinese
Color1 Black
Color2 Green
Color3 Blue
Color4 Gray
Color5 Purple
ON Beeps are enabled.
OFF Beeps are disabled.
ON The screen backlight remains on.
1min/5min/10min/30min/60min
The screen blanks after the selected period of inactivity.

119
6
Chapter 6 C
hanging System
Settings
Start page Select the screen to appear when the instrument is turned on.
Zero suppress This setting establishes a level below which values are treated as zero for dataacquisition purposes.
Clock Sets the internal real-time clock. Data is saved and managed according to thissetting.
CSV file format Sets the CSV file format. This setting applies to measurement data saved manu-ally as well as all measurement data and waveform data saved automatically.
Wiring Initially display the wiring screen.
Last scrInitially displays the Measurement screen that was displayed when the instrument was turned off.
OFF Zero suppression is disabled. To display small values, disable zero suppression.
0.1% f.s./0.5% f.s. Measured values below the selected level are treated as zero.
+1↑/-1↓ Increments/decrements by 1.
+10↑/-10↓ Increments/decrements by 10.
Set Press to apply setting changes (resets seconds to 00).
CSV Use commas (“,”) as delimiters in measurement data. Use periods (“.”) as decimal points.
SSV Use semicolons (“;”) as delimiters in measurement data. Use commas (“,”) as decimal points.

6.1 Initializing the Instrument (System Reset)
120
If the instrument operates abnormally, see "Before returning for repair" (p. 208)“.If the cause cannot be determined, perform a system reset.
To return all instrument settings to their factory defaults, hold the key while turning the power on.
This is called a 'power-on reset'. All settings including the display language and communication settingsare initialized.
6.1 Initializing the Instrument (System Reset)
1
2 Press [Reset]. (A dialog box appears.)
3
Select the item
Enter Cancel
System reset returns all except the display language and communication settings to theirfactory defaults. All measurement data is erased from the screen and from internal memory.See "6.2 Factory Default Settings" (p. 121)
Power-On Reset
1 Turn off the instrument power.See "3.8 Turning the Power On and Off" (p. 33)
2 Press the key while turning the power on, and hold the key until the
message "BOOT-KEY-RESET READY. Please release the SHIFT key." appears.

6.2 Factory Default Settings
121
6
Chapter 6 C
hanging System
Settings
The factory default settings are as follows.
* Items not initialized by System Reset (initialized only by Power-On Reset, p.120).
6.2 Factory Default Settings
Setting Item Default Setting Setting Item Default Setting
Wiring Mode 1 (1P2W x 4) Folder PW3390
Phase correction OFF RS com speed* 38400 bps
Sync source U1, U2, U3, U4 IP address* 192.168.1.1
U range 600 V Subnet mask* 255.255.255.0
U rect RMS Default Gateway* 0.0.0.0
VT rate OFF Language* English
I range Sensor Rating Color Color1
I rect RMS Beep ON
CT rate OFF LCD back light ON
LPF (Input) OFF Start page Wiring
Integ mode RMS Zero suppress OFF
Freq measure U CSV file format CSV
Lowest freq 5 Hz Motor Sync DC 50 ms
Harm sync src U1 LPF (Motor analysis options)
OFF
THD calc THD-F Freq source f1
Δ-Y convert OFF CHA input AnalogDC
Calculation method TYPE1 CHA range 5 V
Efficiency Pin1 to Pin3 P1 CHA scaling 1.0
Pout1 to Pout3 P1 CHA unit N• m
Noise Sampling 250 kS/s Rated torque 1
Points 10000 Freq range fc 60 kHz
Lowest noise 1 kHz Freq range fd 30 kHz
Analysis CH CH1 CHB input Pulses
Window type Hanning CHB range 5 V
Averaging OFF CHB scaling 1.0
ZeroCross filt Strong CHB unit r/min
AutoRange type Narrow Max frequency 5 kHz
Interval 1 min No. of pulses 2
Timer mode OFF Motor poles 4
Timer setting 1 min CHZ OFF
Real time OFF Wave output ON
Sync control Master Freq f.s. 5 kHz
Sync event HOLD Integ f.s. 1/1
Media (Manual saving) CF Card Output range 2 V f.s.
Folder (Manual saving) PW3390 Output items CH1 to CH16
Urms1
Auto save OFF
Settings for measurement display and recording data are also initialized.

6.2 Factory Default Settings
122

123
89
7
Chapter 7 D
ata Saving and F
ile Operations
The instrument supports saving of setting configurations, measurement data, waveform data, and screenimages to CF card or USB flash drive (only setting configurations can be reloaded).
Data Saving and File Operations Chapter 7
Connector USB type A
Electrical specification USB2.0
Power supply 500 mA maximum
No. of ports 1
Compatible USB device USB Mass Storage Class
: supported −: not supported
Storable Content CF cardUSB flash drive
See
Manual save measurement data p. 129
Auto-save measurement data − p. 131
Save waveforms p. 136
Save screen image p. 136
Save setting configuration p. 137
Load setting configuration p. 137
Copy files and folders p. 141
• Use only PC Cards sold by Hioki.Compatibility and performance are not guar-anteed for PC cards made by other manu-facturers. You may be unable to read from orsave data to such cards.
Hioki optionsPC cards (CF card and adapter)9728 PC CARD 512M9729 PC CARD 1G9830 PC CARD 2G(adapter is not used with this Analyzer)
• Format new CF cards before use.See "7.3 Media Formatting" (p. 127)
Slot TYPE1 × 1
Supported card Compact Flash memory card (at least 32 MB)
Max. supported capacity Up to 2 GB
Data format MS-DOS (FAT16/FAT32) format
CF Card
Important
USB Flash Drive

7.1 Inserting and Removing Storage Media
124
Insert and remove CF cards and USB flash drives as follows.
7.1 Inserting and Removing Storage Media
CF card
To insert a CF cardOpen the CF card slot cover, and with the mark pointing toward the screen,insert the card in the direction shown by the arrow as far as it will go.
To remove a CF cardOpen the CF card slot cover, press the eject button so that it pops out, then press itagain to eject the CF card.
USB flash drive
Insert a USB flash drive in the USB port on the front of the instrument (and just pull itout to remove). • Do not insert any device other than a USB flash drive.• Not all commercially available USB flash drives are compatible.

7.1 Inserting and Removing Storage Media
125
89
7
Chapter 7 D
ata Saving and F
ile Operations
• Hioki cannot recover data from damaged or faulty storage media resulting fromabnormalities. We are also unable to provide compensation for such data loss,regardless of the contents or cause of the failure or damage. We recommend mak-ing backups of all important data.
• Avoid forcing insertion of storage media backwards or in the wrong orientation, asthis could damage the media or instrument.
• If the eject button is sticking out too far, push it in and then insert the CF card all theway into the slot. Inserting the CF card while the eject button is sticking out maydamage the instrument. If unable to insert the CF card all the way, do not force it.Instead, press the eject button so that the CF card is ejected. Then press the ejectbutton again and insert the CF card all the way into the slot.
• Exercise care when using such products because static electricity could damage theCF card or cause a malfunction of the instrument.
• The Media-Busy indicators (p. 19) light green when storage media is being accessed. Donot turn the instrument off while an indicator is lit. Also avoid removing storage media whileit is being accessed, as that may corrupt stored data.
• Remove the storage media when transporting the instrument. Otherwise, the instru-ment or media could be damaged.
• Do not move the instrument with a USB flash drive installed. Otherwise, the instru-ment or media could be damaged.
• Some USB flash drives are easily affected by static electricity. Be careful handlingthe USB flash drive to avoid damage to the drive or instrument malfunctions due tostatic electricity.
• Some USB flash drives may prevent the instrument from turning on when inserted.In this case, turn the instrument on before inserting the USB flash drive. We recom-mend testing a USB flash drive before use.
Storage media have a limited usable lifetime. After long-term use, data reading andwriting will fail, at which time the media must be replaced.

7.2 The File Operation Screen
126
The File Operation screen is described below.
The following file data types may be stored.
• In this table, 'nnn' and 'nn' indicate a serial number (000 to 999 or 00 to 99) within the same folder, and 'kk' is a serialnumber of a split file when the file size exceeds 100 MB. MMDD indicate month and day.
• Setting configuration files can be optionally assigned names (up to eight characters)
• From the root, press or the right cursor key to display the contents of the currently selected folder.
• Press the left cursor key to return to the root folder.• Folders within folders other than the root are not accessible.
7.2 The File Operation Screen
Indicates the current root position.This example shows the contents of the root (highest level)folder of a CF card.
Shows the list of files on the storage media.
When more filesand folders arepresent than canbe displayed atonce, the up/downcursor keys scrollthe list, with thecurrent displayposition indicatedby the white scrollbar.
Shows information about storage media
being accessed.
The File Operation screen is not available during auto-saving.
About File Types
Name Type (file extension) Description
M3390nnn.CSV CSV Manually saved measurement data
MMDDnnkk.CSV CSV Auto-saved measurement data
W3390nnn.CSV CSV Waveform data
H3390nnn.BMP BMP Screen capture image data
xxxxxxxx.SET SET Setting configuration data
xxxxxxxx Folder → Folder (no extension)
xxxxxxxx ??? Files cannot be used and saved on this unit.
Changing Folders, Selecting the Root Folder

7.3 Media Formatting
127
89
7
Chapter 7 D
ata Saving and F
ile Operations
Format a media if it is not already formatted (initialized). Insert the media to be formatted (p. 124), and start formatting.
This key is not used other than when upgrading the firmware.
7.3 Media Formatting
Formatting procedure
Formatting erases any data stored on the media so that it cannot be recovered. Exe-cute only after confirming that no important files will be lost. We recommend keeping abackup of any precious data stored on a media.
Upgrade
Display the page for the media you wish to format.
(The format confirmation dialog appears.)
To execute:
To cancel:
A dialog appears when formatting is finished.

7.4 Saving Operations
128
7.4 Saving Operations
Save destination CF cardUSB flash drive
Saving method Press .
PW3390(or any other folder)
M3390000.CSV
M3390001.CSV
An error will be displayed if the sequential file number in the folder reaches 1000. Set a new save location.
Up to 1,000 files
Manual Saving (p. 129)
M3390000.CSV• When the storage media is full, saving stops.
Storage me-dia root folder
Files are named M3390000 to M3390999.
A new file is cre-ated when any of the following are changed:Save destination folderWiring modeMeasurement objects to be saved
Save destination CF card
Saving method Automatically, according to timing control settings
PW3390(or any other folder)
11190000.CSV
11190100.CSV
Up to 100 files per day (the file name is changed each day, so continuous saving is supported)
Auto-saving (p. 131)
11190000.CSV
• When an auto-saved file exceeds 100 MB, a new file is created and saving continues.
• Up to 100 files per day can also be saved to the root folder.• When the storage media is full, saving stops.
Files are named MMDD0000 to MMDD9900.
CF card root
This example describes data that was automatically saved on November 19.
Save destination CF cardUSB flash drive
Saving method Press on the [Wave + Noise] page of the Measure-ment screen
PW3390(or any other folder)
W3390000.CSV
W3390001.CSV
Up to 1,000 files
Waveform Data Saving (p. 136)
W3390000.CSV
• When the storage media is full, saving stops.
Files are named W3390000 to W3390999.
Storage me-dia root folder
An error will be displayed if the sequential file number in the folder reaches 1000. Set a new save location.
Save destination CF cardUSB flash drive
Saving method Display the screen to
save, and press
and .
PW3390(or any other folder)
H3390000.BMP
H3390001.BMP
Up to 1,000 files
Screen Capture Image Saving (p. 136)
H3390000.BMP
• When the storage media is full, saving stops.
Files are named H3390000 to H3390999.
Storage me-dia root folder
An error will be displayed if the sequential file number in the folder reaches 1000. Set a new save location.
Save destination CF cardUSB flash drive
Saving method Move to a folder on the File Operations screen, and press
.
PW3390(or any other folder)
SETTING1.SET
SETTING2.SET
until the storage media is full
Saving Setting Configurations (p. 137)
• Files can also be saved to the root folder.• When the storage media is full, saving stops.
The user-specified file name may be up to 8 characters.
Storage me-dia root folder
The maximum number of files to save in the root for manual save, waveform andscreen copy is up to 512 files in FAT16 format.

7.5 Measurement Data Saving
129
89
7
Chapter 7 D
ata Saving and F
ile Operations
Measurement data can be saved either manually or automatically.All measurement values including harmonics and peak values of FFT functions can be selected for saving.Files are saved in CSV format.
Press to save values measured at the time the key is pressed.
Specify the items to save beforehand.
7.5 Measurement Data Saving
Both manual and auto-saving are disabled while accessing storage media (Media-Busy indicator lights green, (p. 19)).
7.5.1 Manually Saving Measurement Data
1. Select the measurement items to save.(See 7.5.3 (p.134))
2. Select the save destination media and folder.
3. Press when you want to save.(The specified folder is automatically created and data saved.)
Saving Procedure
Save destination: CF card or USB flash drive
File names: Auto-generated, with CSV extensions M3390nnn.CSV ('nnn' is a serial number from 000 to 999 in the same folder) Example: M3390000.CSV
Remarks: A new file is created the first time, after which data is added to the same file.However, when the save destination, wiring mode, or measurement items to save is changed, a new file is created and subsequent data saved to that.
• Saved CSV files are only intended to be reloaded.• The displayed data and saved data may not be equivalent due to the timing differ-
ence when saving the data by pressing the key. Use the HOLD function to
save the same data.
Selecting the Save Destination
Display the [Interface] page
Select with the F keys
Select [Media]

7.5 Measurement Data Saving
130
Dialog box setting items
Selecting the Destination Folder and Measurement Items to Save
Display the [Interface] page
(A dialog appears)
For manual saving: [Folder]For auto-saving:[Folder] (Can be set whenthe auto save modeis ON.)
Enter characters with the F keys
Enter:
Cancel:
keys to select characters
Input Enters the character at the cursor position.
(The same as .)
BS Deletes the character before the cursor position.
Del Deletes the character at the cursor position.
Pos←/Pos→ Moves the cursor position.
OK Accepts the entered folder name. After accepting, closes the dialog.
Folder names can be up to eight characters.

7.5 Measurement Data Saving
131
89
7
Chapter 7 D
ata Saving and F
ile Operations
Each measurement value can be automatically saved at the specified time. Items that have been specified beforehand are saved.
7.5.2 Auto-Saving Measurement Data
1. Select the measurement items to be saved.(See 7.5.3 (p.134))
2. Enable auto-saving and select the destination folder (as necessary).(See Setting Auto-Saving below, and "Selecting the Destination Folder and Measurement Items toSave" (p. 130).)
3. Set the save time.(See 5.1 (p.105))
4. Press to start auto-saving (and press again to stop).(The specified folder is automatically created, and data saved therein.)
Saving Procedure
Save destination: CF card
File names: Automatically generated from the starting date, with CSV extension.MMDDnnkk.CSV (MM: year, DD: day, nn: serial number from 00 to 99 in same folder, kk: con-secutive number of file division when file size exceeds 100 MB)Example: 11040000.CSV (for the first file saved on November 4)
• Interval-saved CSV files are only for reloading.• While auto-saving is enabled, manual saving and waveform saving are not available.• If the auto save is started while saving in manual, waveform, or screen copy, the sev-
eral data may be missed.
Setting Auto-Saving
Display the [Interface] page
Select [Auto save mode]
The data save destination can be specified only when auto-saving is enabled.
• The maximum number of data points that can be recorded (p. 134) depends in theinterval time (longer intervals allow recording more data points).
• When auto-saving is disabled ([OFF]), the [Folder] cannot be set.
• Folder names can be up to eight characters.
Remaining available recording timeWhen [Auto save mode] is enabled, the remaining available recording time on the selectedmedia is displayed. The displayed remaining time is an approximation calculated from the stor-age media capacity, number of recording items, and interval time.

7.5 Measurement Data Saving
132
Timing controls available for auto-saving are as follows.
Auto-Saving Operations
Interval Timing Control Save Save Save Save
Interval Interval Interval
Save
Timer Control Save Save
Timer Setting
Auto Stop
Real-Time Clock TimingControl
Save Save
Waiting Time Between Clock Start/Stop Settings
Auto StartSpecified Start Time
Auto StopSpecified Stop Time
Timer + Interval Timing Control
Save Save Save SaveSave
Timer Setting
Interval Interval Interval Interval
Auto Stop
Clock + Interval Timing Control
Save Save SaveSave
Waiting Interval Interval Interval
Auto StartSpecified Start Time
Auto StopSpecified Stop Time
Time Between Clock Start/Stop
Settings

7.5 Measurement Data Saving
133
89
7
Chapter 7 D
ata Saving and F
ile Operations
• Settings cannot be changed while timing controls are enabled. Also, when auto-ranging isenabled along with timing control, the range that is active when is pressedremains fixed.
• The all data is saved in the same file under timing control.When integration is reset, data is saved to a new file at the next start time.
• When the timer stop time and the interval ending time do not match, the timer stop timehas priority, and the last interval is truncated.
• When the clock control stop time and the interval ending time do not match, the clockcontrol stop time has priority, and the last interval is truncated.
• When the storage media becomes full during auto-saving, an error is displayed and sav-ing stops. In that case, auto-saving can be resumed (using an automatically named filewith the same name) by replacing the CF card with another (formatted) CF card.To OFF the interval, see (p. 107)

7.5 Measurement Data Saving
134
The items to be saved to storage media can be selected. The number of items that can be recorded depends on the interval timing setting.
*: Setting Contents
7.5.3 Selecting Measurement Items to Save
Interval 50ms 100ms 200ms 500ms 1s Other
Maximum recordable items
130 260 520 1300 2600 5000
Setting Procedure
Display the [Interface] page
Select measurement contents with the F keys.
Select [Items to save]
Set by F keys*
(Press to toggle
off/on.)
Select the items to be saved.
Press to select
Noise peak, CH A, CH B,
Pm, Slip and elapsed
time.
Press (or ) to return to the
previous page.
"O" indicates ON, blank indicates
OFF, and "−" indicates not selectable.
No. of items to recordIndicates the number of data items enabled (set to “ON”)
Maximum recording quantitydetermined by the interval setting
OFF Saving disabled
ON Saving enabled
All CH set Sets all channels ON or OFF (not displayed when [Others] is selected).See "Using [All CH Set]" (p. 18)
All OFF Sets all selected items OFF.
All ON Sets all selected items ON.

7.5 Measurement Data Saving
135
89
7
Chapter 7 D
ata Saving and F
ile Operations
When [Harmonic] is selected for measurement contents to be saved, the output, highest, and lowestorders can be selected in addition to the items to be saved.
Out order Select the orders for output.
Max order Set the highest order to be output. Settable range is 0 to 100.This setting must be higher than the lowest order setting.
Min order Set the lowest order to be output. Settable range is 0 to 100.This setting must be lower than the highest order setting.
Harm src This setting stores the measured frequency of the harmonic sync source.(Harmonic source)
When [Harmonic] is Selected
All Selects all harmonic orders.
Odd Selects only odd harmonic orders.
Even Selects only even harmonic orders.
Return Returns to previous page.
+1↑/-1↓ Increment or decrement by 1.
+10↑/-10↓ Increment or decrement by 10.
100th Sets to the 100th order.
+1↑/-1↓ Increment or decrement by 1.
+10↑/-10↓ Increment or decrement by 10.
0th Sets the zero order (DC component).

7.6 Saving Waveform Data
136
This operation saves the waveform displayed on the [Wave + Noise] page as a CSV file.
The currently displayed screen can be saved as a 256-color bmp bitmap file (BMP file name extension).
Press and to save a bitmap image of the current screen to the specified media.
7.6 Saving Waveform Data
Setting Procedure
Display the [Wave + Noise] page
(saves the waveform at this moment)
Save destination: CF card, USB flash drive(Save destination setting is the same as for Manual saving, (p. 129))
File names: Auto generated, with CSV extension W3390nnn.CSV ("nnn" is serial number 000 to 999 within the same folder) Example: W3390000.CSV
• Item where the screen display is OFF is not saved.• Waveform saving is not possible during auto saving.• Waveform data is saved as Peak-Peak compressed Max/Min data set.
See "4.5.1 Displaying Waveforms" (p. 79)
7.7 Saving Screen Capture Images
Save destination:CF card, USB flash drive(Save destination setting is the same as for Manual saving, (p. 129))
File names:Auto generated, with CSV extensionH3390nnn.BMP ("nnn" is serial number 000 to 999 within the same folder) Example: H3390000.BMP
You can also save screen capture images while auto-saving is in progress. However,auto-save operation takes precedence, and the screen capture operation will not be per-formed if the interval is 1 s or less.

7.8 Saving Setting Configurations
137
89
7
Chapter 7 D
ata Saving and F
ile Operations
Various instrument settings can be saved to storage media as settings files.
7.8 Saving Setting Configurations
Save Procedure (Example: saving to a CF card folder)
Display the [CF card] page
(A dialog appears.)
Enter characters with the F keys.
Enter:
Cancel:
keys to select a character
or to open a folder
keys to select a folder

7.8 Saving Setting Configurations
138
Dialog Box Setting Items
Input Enter the character at the cursor position.
(Same as )
BS Deletes the character to the left.
Del Deletes the character at the cursor position.
Pos ←/Pos→ Moves the cursor position.
OK Accepts the entered file name. The dialog closes when accepted.
Save destination: CF card, USB flash drive(Save destination setting is the same as for Manual saving, (p. 129))
File names: User-named (up to eight characters), file name extension is SETExample: SETTING1.SET
• Language and communications settings are not saved.
• Setting configuration saving is not available during auto-saving.
• Folders within folders cannot be selected.

7.9 Reloading Setting Configurations
139
89
7
Chapter 7 D
ata Saving and F
ile Operations
Previously saved settings can be reloaded from setting configuration files.
7.9 Reloading Setting Configurations
Loading Procedure (Example: loading a setting configuration file from a CF card folder)
Display the [CF card] page
or to open a folder
keys to select a setting configuration file
(or )
(A dialog appears.)
Enter: .
Cancel: .
keys to select a folder
In order to restore settings, the instrument model and sensor setup must be thesame. Otherwise, the settings will not be restored. For example, the settings file for a PW3390-01 cannot be loaded by a PW3390-02.

7.10 File and Folder Operations
140
Both auto-saving and manual saving require that a save destination folder be created.Insert storage media before creating folders. (p. 124)
Dialog Box Setting Items
7.10 File and Folder Operations
7.10.1 Creating Folders
Creation Procedure
Display the [CF card] page
(A dialog appears.)
Enter characters with the F keys.
Enter:
Cancel:
keys to select a character
Input Enter the character at the cursor position.
(Same as )
BS Deletes the character to the left.
Del Deletes the character at the cursor position.
Pos ←/Pos→ Moves the cursor position.
OK Accepts the entered folder name.The dialog closes when accepted.
• Folder names may be up to eight characters.
• Folders can only be created in the root folder.

7.10 File and Folder Operations
141
89
7
Chapter 7 D
ata Saving and F
ile Operations
Files can be copied between a CF card and USB flash drive. Insert the CF card and USB flash drive before copying. (p. 124)
7.10.2 Copying Files and Folders
File Copying Procedure (Example: copying the root files from a CF card to a folder on a USB flash drive)
• Files can be copied from folders on the source storage media.
• Files and folders can be copied to the root folder on the destination storage media.
• If a duplicate file exists at the destination, an error is displayed. Change the foldername and try again.See "7.10.4 Renaming Files and Folders" (p. 144)
Display the [CF card] page
(The USB flash drive root folder contents appear in the dialog)
Press to accept
Copy:
Cancel Copy: (or )
(A dialog appears when copying is finished.)
or to open a folder
keys to select the file
If a duplicate file name exists:A dialog appears to confirm overwriting.
To overwrite:
To cancel copying:
However, cannot overwrite the read only files.
keys to select the folder to copy

7.10 File and Folder Operations
142
Folder Copying Procedure (Example: copying a folder from a CF card to a USB flash drive)
Display the [CF card] page
(A dialog appears.)
Copy:
Cancel Copy: (A dialog appears when copying is finished.)
If a duplicate folder exists :
If a duplicate folder exists at the destination, an error is displayed. Change the folder name and try again.See "7.10.4 Renaming Files and Folders" (p. 144)
keys to select the folder
Folders can only be copied to the root folder.

7.10 File and Folder Operations
143
89
7
Chapter 7 D
ata Saving and F
ile Operations
Files can be deleted from storage media.Insert the storage media before deleting files. (p. 124)
7.10.3 Deleting Files and Folders
Deleting Procedure (Example: deleting a file (or folder) from a CF card)
Display the
[CF card] page
Delete:
Cancel Deletion:
(The selected file or folder is deleted. Delet-ing a folder also deletes any files within it.)
keys to selectthe file/folder todelete
(A dialog appears.)
To delete a file within a folder, open the folder and select the file.See "Changing Folders, Selecting the Root Folder" (p. 126)

7.10 File and Folder Operations
144
Files on storage media can be renamed.Insert the storage media before renaming a file. (p. 124)
Dialog Box Setting Items
7.10.4 Renaming Files and Folders
Renaming Procedure (Example: renaming a file (or folder) in the CF card)
Display the
[CF card] page
(A dialog appears)
Enter characters with theF keys.
Enter:
Cancel:
keys to select a character
keys to select thefile or folder torename
Input Enter the character at the cursor position.
(Same as )
BS Deletes the character to the left.
Del Deletes the character at the cursor position.
Pos ←/Pos→ Moves the cursor position.
OK Accepts the entered file/folder name.The dialog closes when accepted.
• Folder names may be up to eight characters.
• To rename a file within a folder, open the folder and select the file.See "Changing Folders, Selecting the Root Folder" (p. 126)

8.1 Connecting Multiple PW3390 (Synchronized Measurements)
145
8
Chapter 8 C
onnecting External D
evices
Up to eight PW3390 can be connected with optional Hioki 9683 Connection Cable (for synchronous measure-ments).When so connected, one PW3390 operates as master over the others set as slaves, providing multi-instrument synchronous measurements. The maximum delay of synchronization is 5 μs/connection and is 5 μs+50 ms for synchronization event.The timing control functions can be applied to synchronous measurements.See "5.1 Timing Control Functions" (p. 105)
The slave PW3390s are synchronized by the master PW3390 for the following operations.• Clock and data update timing (slaves match clock and data update timing)
• Timing control, integration start/stop and data reset (the and keys on the master also
control the slaves)• Events (select from data hold, data saving, or screen capture)
Connecting External Devices Chapter 8
8.1 Connecting Multiple PW3390 (Synchronized Measurements)
• To avoid damaging the instrument, do not insert or remove connectors while thepower is on.
• Establish a one-point common earth ground point for all instruments in the measure-ment system. Different grounding points could allow dangerous potential differencesbetween the GND terminals of the master and slaves. If sync cables are connectedunder such conditions, malfunctions or damage could occur.
Display the MEAS screen on both master and slave units, when executing time control,integration start/stop, data reset, and HOLDing event.

8.1 Connecting Multiple PW3390 (Synchronized Measurements)
146
This description uses an example of three PW3390. Required items: Three PW3390s, two Model 9683 Connection Cables
Connecting Multiple PW3390 with Sync Cables
• As a single measurement system, settings are made only on the master.• During synchronous control, the 9683 Connection Cable conduct control signals.
Never disconnect a sync cable during synchronous control, as the control signalswould be interrupted.
• The IN and OUT ends of the 9683 Connection Cable are different. Do not applyexcessive insertion force.
• Turning slaves on first may result in synchronization errors.
9683 Connection Cable (for synchronization)
IN
OUT
IN jack
Master Slave 1 Slave 2
Sync interface OUT jackFerrite core
Procedure 1. Verify that all PW3390s are turned off.
2. As shown below, connect the sync cables between the OUT and IN terminals of the masterand each slave.
3. Turn each instrument on in the following order: master, slave 1, slave 2 (turn the instru-ments off in the reverse order).
See (p. 148) for sync cable con-nectors and pin-outs.

8.1 Connecting Multiple PW3390 (Synchronized Measurements)
147
8
Chapter 8 C
onnecting External D
evices
Set each instrument to be either the master or a slave. These settings are made on the [Interface] page of the Setting screen.
Sync event Select the events to be synchronized(master settings are reflected on the slaves)
Instrument Settings for Synchronous Measurement
Setting Procedure
Display the [Interface] page
Select with the F keys
Select [Sync event]
Select with the F keys
Reboot the instrument when changing from master to slave.
Select [Sync control]
HOLD Pressing on the master activates Data Hold on all instruments.
SAVE Pressing on the master executes manual saving on all instruments.
COPY Pressing + on the master captures the screen image on all instruments.
• The RTC clock time, timer, and clock control start and stop times cannot be set on theslave instruments.
• Selecting [SAVE] or [COPY] as a synchronized event sets the manual save destina-tion folder appropriately and records data on each PW3390.See "7.5.1 Manually Saving Measurement Data" (p. 129), "7.7 Saving Screen Capture Images" (p.
136)• To save measurement data to storage media with an interval time control combina-
tion, set the same interval setting on the master and all slaves, and enable auto-sav-ing (set to ON). In this case, selecting [SAVE] as a synchronous event has no effect.See "5.1 Timing Control Functions" (p. 105), "7.5.2 Auto-Saving Measurement Data" (p. 131)
• Confirm no error display on the slave unit's screen when executing the synchroniza-tion event.
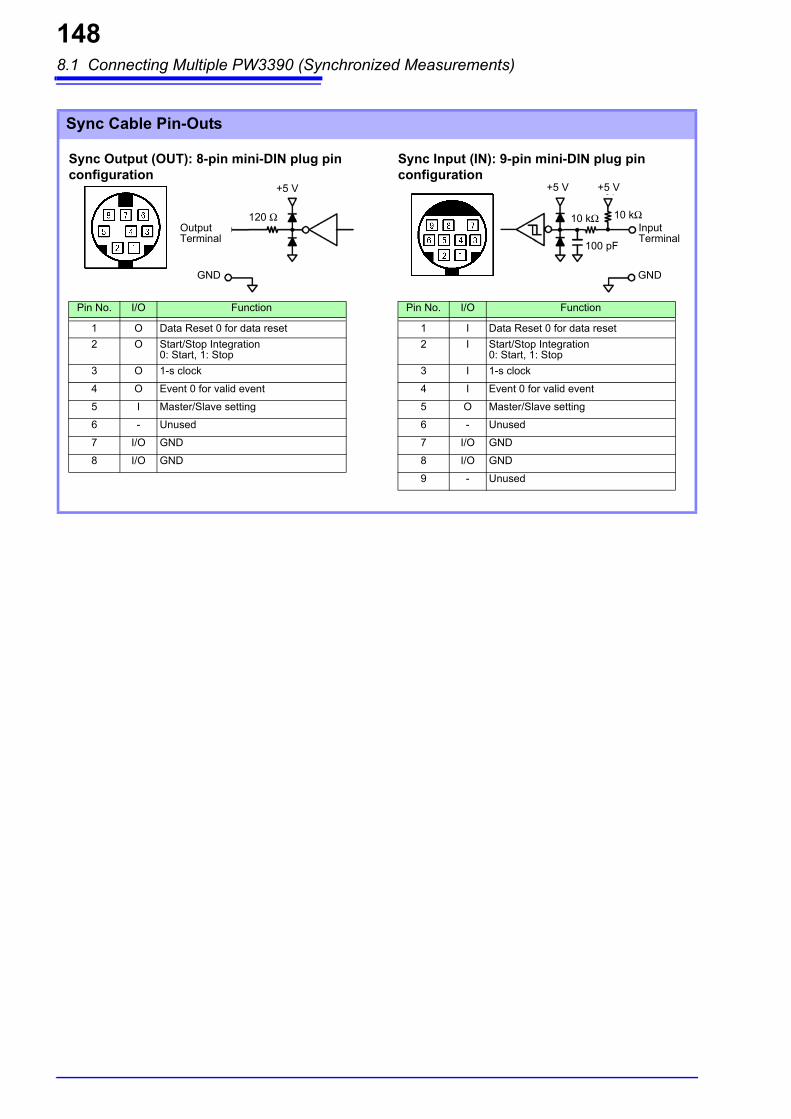
8.1 Connecting Multiple PW3390 (Synchronized Measurements)
148
Sync Cable Pin-Outs
Pin No. I/O Function
1 O Data Reset 0 for data reset
2 O Start/Stop Integration0: Start, 1: Stop
3 O 1-s clock
4 O Event 0 for valid event
5 I Master/Slave setting
6 - Unused
7 I/O GND
8 I/O GND
Pin No. I/O Function
1 I Data Reset 0 for data reset
2 I Start/Stop Integration0: Start, 1: Stop
3 I 1-s clock
4 I Event 0 for valid event
5 O Master/Slave setting
6 - Unused
7 I/O GND
8 I/O GND
9 - Unused
Sync Output (OUT): 8-pin mini-DIN plug pin configuration
Sync Input (IN): 9-pin mini-DIN plug pin configuration
Output Terminal
GND GND
120 Ω
+5 V +5 V +5 V
10 kΩ10 kΩ
100 pF
Input Terminal

8.2 Controlling Integration with External Signals
149
8
Chapter 8 C
onnecting External D
evices
The synchronization interface provided by the instrument’s SYNC IN terminal can be used to start, stop,reset integration, and event via 0 V/5 V logic signals or short/open contact signals.
8.2 Controlling Integration with External Signals
Synchronization input (IN) 9-pin round connector pin layout and internal circuitdiagram
• Pin 5 (wire color: green) carries an output signal. Never short it with the other pins.• Be sure to leave all unused pins open.• Use this functionality with the instrument’s synchronization control setting set to
“Master.”• To start or stop integration, reset integration data, or perform event hold operation,
display the Measurement screen. These operations cannot be performed on the Set-tings screen or the File Operation screen.
Provide a device that allocates functionality to pin numbers as follows to control the instrument. To connect the device to the instrument, cut off the 9683 Connection Cable’s OUT connector andconnect its internal wires to the control device, referring to their colors.
Pin number Wire color Functionality
1 BrownData resetThe integration value is reset when this pin is low for an interval of at least 40 ms. This operation is valid only while integration is stopped.
2 RedIntegration start/stopIntegration starts when this pin changes from high (5 V or open) to low (0V or shorted). Integration stops when this pin changes from low to high.
3 Orange Unused
4 Yellow
EventWhen this pin is kept low for an interval of at least 40 ms, it operates in the same manner as the event set as the synchronization control function’s synchronization event. See "Instrument Settings for Synchronous Measurement" (p. 147)
5 Green Unused
6 Blue Unused
7 Purple Connect to ground (GND).
8 Gray Connect to ground (GND).
9 - Not present
Output terminal GND
10 kΩ
+5 V
100 pF
Input terminal
+5 V
10 kΩ

8.2 Controlling Integration with External Signals
150
Required items: 9683 Connection Cable and external device that will be used to control the instrumentConnect the cable to the SYNC IN terminal on the right side of the instrument. The end of the cable withthe ferrite clamp is the IN end.
External control signals are detected at the intervals shown in the timing charts below.
This signal controls when integration starts and stops. It has the same effect as pressing the START/STOP key on the instrument’s control panel.
Connecting the cable
Control signal timing
Integration start/stop (pin No. 2)
9683 Connection Cable (For synchronization)
IN
OUTIN terminal
OUT terminal
Ferrite clamp
For more information about the connection cable’s connector and pin layout, see p. 148.
SYNC interface
5 V (open)
0 V (short)
250 ms or greater (*1)250 ms or greater (*1)
Integration start Integration stop Addition start
*1: When auto-saving is on, 1 s or more.
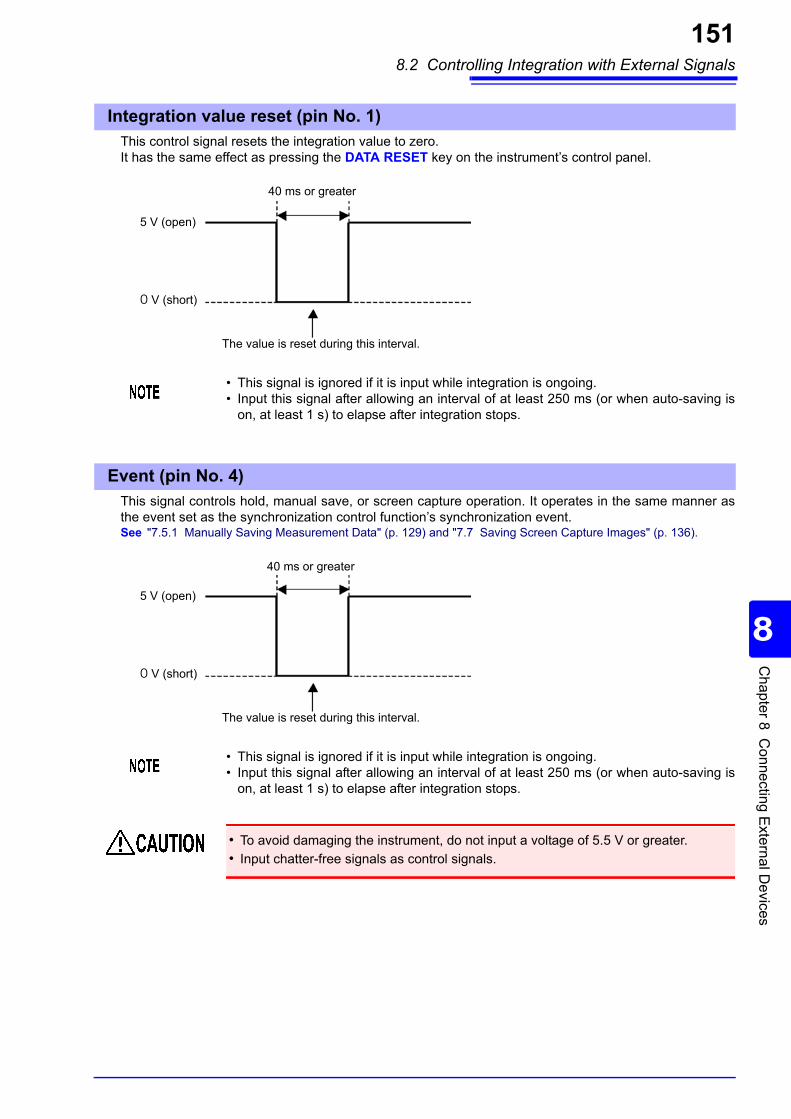
8.2 Controlling Integration with External Signals
151
8
Chapter 8 C
onnecting External D
evices
This control signal resets the integration value to zero. It has the same effect as pressing the DATA RESET key on the instrument’s control panel.
This signal controls hold, manual save, or screen capture operation. It operates in the same manner asthe event set as the synchronization control function’s synchronization event.See "7.5.1 Manually Saving Measurement Data" (p. 129) and "7.7 Saving Screen Capture Images" (p. 136).
Integration value reset (pin No. 1)
• This signal is ignored if it is input while integration is ongoing. • Input this signal after allowing an interval of at least 250 ms (or when auto-saving is
on, at least 1 s) to elapse after integration stops.
5 V (open)
0 V (short)
40 ms or greater
The value is reset during this interval.
Event (pin No. 4)
• This signal is ignored if it is input while integration is ongoing. • Input this signal after allowing an interval of at least 250 ms (or when auto-saving is
on, at least 1 s) to elapse after integration stops.
• To avoid damaging the instrument, do not input a voltage of 5.5 V or greater.
• Input chatter-free signals as control signals.
5 V (open)
0 V (short)
40 ms or greater
The value is reset during this interval.

8.3 Using Analog and Waveform D/A Output
152
Analog (p. 155) or waveform output (p. 156) is possible for PW3390-02 and PW3390-03.• PW3390-02 Model with D/A output• PW3390-03 Model with motor analysis and D/A outputBoth D/A output provides 16 output channels, and is selectable from the basic measurement items.
Use a mating D-sub connector to connect the D/A outputs to the desired device (oscilloscope, datalogger/recorder).To be safe, always turn off the instrument and devices before making connections. Turn the instrumentand devices on after confirming the connections.
8.3 Using Analog and Waveform D/A Output
To avoid electric shock and short circuits, turn the instrument and measurementline power off before connecting or disconnecting D/A outputs.
• To avoid damage to the instrument, do not short-circuit or apply voltage between outputs.
• The outputs are not isolated from one another.
8.3.1 Connecting Application-Specific Devices to the Instrument
Output Circuit
GND
Output Terminal
100 Ω
+12 V
-12 V
The impedance of each output is approximately 100 Ω, so the inputs of the recording,DMM or other device to be connected should be high impedance (at least 1 MΩ).See "Chapter 10 Specifications" (p. 177)

8.3 Using Analog and Waveform D/A Output
153
8
Chapter 8 C
onnecting External D
evices
User the supplied connector (DB-25P-NR, D819678-2R Japan Aviation Electronics Industry, Ltd.) or equivalent connector to connect to the D/A output terminal.
D/A Output Connector Pin-Out
Pin No.Output
( ) waveform output content
Pin No. Output
1 GND 14 GND
2 D/A1 (U1) 15 D/A9
3 D/A2 (I1) 16 D/A10
4 D/A3 (U2) 17 D/A11
5 D/A4 (I2) 18 D/A12
6 D/A5 (U3) 19 D/A13
7 D/A6 (I3) 20 D/A14
8 D/A7 (U4) 21 D/A15
9 D/A8 (I4) 22 D/A16
10 GND 23 GND
11 GND 24 GND
12 GND 25 GND
13 GND
Instrument Rear Panel
How to connect D/A output terminals
• Solder the cord securely.• Fix the connector and connector cover by the supplied screws (M2.6 × 6).• Hold the connector cover when connecting or disconnecting the connector.• Use the shielded cable for D/A output.• Connect to the connector cover or cable fixture if the cable's shield is not grounded.
Soldering
Cord
Connector cover
Cable fixture
Shielded cable
Screw
Rear panel

8.3 Using Analog and Waveform D/A Output
154
Select the items for D/A output. Up to 16 items can be selected.Make the settings on the [D/A Out] page of the Setting screen.
Freq f.s. Set this to output frequency in the analog output.
For models equipped with motor analysis functionality, this is the same as the maximum motor measurement frequency setting. ("Max frequency" (p. 101))
Integ f.s. Set for analog outputs. ("About Full-Scale Integration" (p. 155))
Output Ranges Set the output voltage value for full scale input when waveform is output.
8.3.2 Output Item Selection
Setting Procedure
(the pull-down menu appears)
Display the [D/A Out] page
Select [Wave output]
ON: Enable waveform outputOFF: Disable waveform out-
put
Select a channel to be set.
Select parameter items(sub parameter last)
Enter: or
Cancel: or
Main parameter Sub parameter
Pull-Down MenuSelect the main and sub parameter.
Select with the F keys
100 Hz, 500 Hz, 1 kHz, 5 kHz
1/10, 1/2, 1/1, 5, 10, 50, 100, 500, 1000, 5000, 10000
1 V f.s., 2 V f.s.

8.3 Using Analog and Waveform D/A Output
155
8
Chapter 8 C
onnecting External D
evices
• Instrument measurement values are output as level-converted DC voltages.• Voltage and current (sensor) inputs are isolated from the outputs.• Select a basic measurement item for each of up to 16 outputs, or for up to eight waveform outputs.• Long-term trend recording is available by connecting a data logger or recorder.
The full-scale value is set for the analog output in integration. For example, when the integration value is less than the full scale value, the time for the integration valueto reach full-scale is long, so D/A output voltage changes slowly. Conversely, when the integration value is larger than the full-scale value, the time to reaching the full-scale value becomes short, and D/A output voltage changes quickly.The full scale value of integrated power can be changed for the D/A output by setting the integration fullscale.
• Waveform output can be selected only for channels 1 through 8 (D/A1 to D/A8).Channels 9 through 16 (D/A9 to D/A16) are for analog output only.
• The output parameters for LR8410 Link-compatible loggers are the same as the out-put parameters for channels 9 through 16 (D/A9 to D/A16).See "8.4 Connecting the Instrument to a LR8410 Link-compatible Logger" (p. 160)
• Items selected on the MEAS, SYSTEM or FILE screen are always output.
About Analog Outputs
Specifications
Output voltage ±5 V DC (approx. ±12 V max. See "Output Level" (p. 157) for the output ratings of each item)
Output impedance 100 Ω ±5 ΩOutput update rate 50 ms (depending on data update rate of selected item)
Full-scale frequency 100 Hz, 500 Hz, 1 kHz, 5 kHz (same as the maximum motor measurement frequency setting)
Full-scale integration (1/10, 1/2, 1/1, 5, 10, 50, 100, 500, 1000, 5000, 10000) × range
• Positive and negative over-range voltages are approximately +6 and -6 V, respectively. (Forvoltage and current peaks are about 5.3 V.)
• Maximum output voltage that can possibly be output from malfunction, etc. is approximately±12 V.
• When using VT or CT ratio, the output is ±5 V DC at the "VT/CT ratio × range".• When HOLDing, peak HOLDing or averaging, the output value is the result of these functions.• During data hold when an interval time is set, outputs are updated at each interval after start-
ing integration.• When auto-ranging is enabled, the analog output levels change with auto-ranging. Be careful
to avoid range conversion mistakes when measuring rapidly fluctuating values. Such mis-takes can be avoided by using a fixed, manually selected range.
• Harmonic analysis data other than the basic measurement items is not available for output.
About Full-Scale Integration

8.3 Using Analog and Waveform D/A Output
156
• Output signals are waveforms of the instantaneous values of input voltages and currents.• Voltage inputs and current sensor inputs are mutually isolated.• Combine with an oscilloscope to observe waveforms of phenomena such as device inrush current.
About Waveform Outputs
Specifications
Output voltage Select from either ±1 V or ±2 V, crest Factor 2.5 or higher
Output impedance 100 Ω ±5 ΩOutput update rate 500 kHz
• D/A1: U1, D/A2: I1, D/A3: U2, D/A4: I2, D/A5: U3, D/A6: I3, D/A7: U4, D/A8: I4• Waveform clipping occurs at approximately ±7 V.• Maximum output voltage that can possibly be output from malfunction, etc. is approximately
±12 V.• When using VT or CT ratio, the instrument outputs a voltage that is obtained by multiplying
the range by the VT or CT ratio.• Waveform output consists of uninterrupted instantaneous values, regardless of data hold,
peak hold, or averaging operations.• When auto-ranging is enabled, the analog output levels change with auto-ranging. Be careful
to avoid range conversion mistakes when measuring rapidly fluctuating values. Such mis-takes can be avoided by using a fixed range. It is recommended to use a fixed range for thistype of measurement.

8.3 Using Analog and Waveform D/A Output
157
8
Chapter 8 C
onnecting External D
evices
Full-scale D/A output span is ±5 V DC. This corresponds to the full-scale measurement input spans asfollows.
8.3.3 Output Level
Selected Output Item Full Scale
Voltage and current of each channel, Sum of voltage and current(dc, pk+ and pk- for each U1 to U4, I1 to I4, U12, U34, U123, I12, I34, or I123)Motor analysis options (CH A, CH B, Pm, Slip)
Measurement range (with polarity)D/A output value-100% f.s. to 0 to +100% f.s. → -5 V to 0 to +5 V
Voltage and current of each channel, Sum of voltage and current(rms, mn, ac and fnd of each U1 to U4, I1 to I4, U12, U34, U123, U12, I34 or I123)
Measurement range (with polarity)D/A output value0 to +100% f.s. → 0 to +5 V
Active, reactive, and apparent power on each channel (P1 to P4, Q1 to Q4, S1 to S4)Apparent power has no polarity
(voltage range) × (current range) For example, measuring in the 300 V and 10 A ranges supports 3 kW full-scale active power measurements.Active power D/A output value-3 kW to 0 to +3 kW → -5 V to 0 to +5 VApparent power D/A output value0 to +3 kVA → 0 to +5 V
Sum of active power, reactive power and apparent power in the 1P3W, 3P3W2M or 3P3W3M measurement.(P12, P34, Q12, Q34, S12, S34, P123, Q123, S123)Apparent power has no polarity
(voltage range) × (current range) ×2For example, measuring in the 300 V and 10 A ranges supports 6 kW full-scale active power measurement.Active power D/A output value-6 kW to 0 to +6 kW → -5 V to 0 to +5 VApparent power D/A output value0 to +6 kVA → 0 to +5 V
Sum of active power, reactive power and apparent power in the 3P4W measurement.(P123, Q123, S123)Power factor has no polarity
(voltage range) × (current range)×3For example, measuring in the 300 V and 10 A ranges supports 9 kW full-scale active power measurement.Active power D/A output value-9 kW to 0 to +9 kW → -5 V to 0 to +5 VApparent power D/A output value0 to +9 kVA → 0 to +5 V
Power factor (λ) Power factor D/A output value-1 to 0 to +1 → -5 V to 0 to +5 V
Power phase angle (φ) Power phase angle D/A output value-180° to 0 to +180° → -5 V to 0 to +5 V
Efficiency (η) Efficiency D/A output value0 to 200% → 0 to +5 V
Current integration (Ih) (current range) × (full-scale integration)For example, integrating for one hour in the 10 A range supports 10 Ah full-scale current integration measurement.Current integration D/A output value-10 Ah to 0 to +10 Ah → -5 V to 0 to +5 V
Active power integration (WP) in 1P2W (voltage range) × (current range) × (full-scale integration)For example, integrating for one hour in the 300 V and 10 A ranges supports 3 kW full-scale active power integration measurements.Active power integration D/A output value-3 kWh to 0 to +3 kWh → -5V to 0 to +5 V
Active power integration (WP) in 1P3W, 3P3W2M, and 3P3W3M (voltage range) × (current range) × (full-scale integration) ×2For example, integrating for one hour in the 300 V and 10 A ranges supports 6 kWh full-scale active power integration measurements.Active power integration D/A output value-6 kWh to 0 to +6 kWh → -5 V to 0 to +5 V
Active power integration (WP) in 3P4W (voltage range) × (current range) × (full-scale integration) ×3For example, integrating for one hour in the 300 V and 10 A ranges supports 9 kWh full-scale active power integration measurements.Active power integration D/A output value-9 kWh to 0 to +9 kWh → -5 V to 0 to +5 V
Frequency (f1 to f4) Full-scale frequency is full scale.
Refer to Section 10.5 “1. Basic Measurement Items” for items not listed in the above.

8.3 Using Analog and Waveform D/A Output
158
8.3.4 D/A Output Examples
Voltage and current (dc, pk+, pk-), active power, reactive power
Voltage and current (rms, mn, ac, fnd, thd), apparent power
Power factorPower phase angle
Frequency
Outputs 0 V when the frequency is less than themeasurement lower limit frequency (the display willindicate 0.0000 Hz).

8.3 Using Analog and Waveform D/A Output
159
8
Chapter 8 C
onnecting External D
evices
(1) Analog output changes when integration starts, and is held constant after integration stops.(2) When the integration value exceeds ±5 V, analog output becomes 0 V and changes proceed from there.(3) When the data hold is activated during integration, analog output is held constant. However, when
data hold is canceled, analog output returns to the actual integration value.(4) The integration value is reset, and analog output becomes 0 V.
Output retaining
Stop Integration
IntegrationReset
Data Hold
Start Integration Resume Integration Resume Integration Data HoldCancel
Start Integration
Updated at each interval
Output retaining
Data Hold
Time
Output retaining
Stop Integration Stop Integration

8.4 Connecting the Instrument to a LR8410 Link-compatible Logger
160
The instrument can be connected to Hioki model LR8410 Link-compatible logger (LR8410 Wireless Log-
ging Station or LR8416 Wireless Heat Flow Logger) via Bluetooth®, enabling it to send measured valuesfor D/A output parameters wirelessly to the logger (D/A9 to D/A16, up to 8 parameters). Establishing sucha connection will enable the LR8410 Link-compatible logger to observe and record measured values fromthe instrument along with measurement targets such as voltage, temperature, and humidity across multi-ple channels.
To connect the instrument to an LR8410-compatible logger, you will need the following Bluetooth® serialconversion adapter and power adapter:
• Bluetooth® serial conversion adapter: Parani-SD1000 (from Sena Technologies Inc.)
Bluetooth® Class 1• AC/DC power adapter: OPA-G01 (from Sena Technologies Inc.)
Operating precautions• To ensure safety, be sure to turn off the instrument before connecting it to the adapter. Turn on the
instrument after connecting the adapter.
• Refer to the Parani-SD1000 operating precautions for more information about Bluetooth® use.• Because values are displayed at the resolution of the logger being used, they will differ slightly from the
measured values that are displayed by the instrument. To record values that are closer to the instru-ment’s measured values, choose a range that is appropriate for the input.
8.4 Connecting the Instrument to a LR8410 Link-compatible Logger

8.4 Connecting the Instrument to a LR8410 Link-compatible Logger
161
8
Chapter 8 C
onnecting External D
evices
1. Set the Bluetooth® serial conversion adapter’s communications speed.The speed is set with DIP switches.
2. Affix the Bluetooth® serial conversion adapter to the instrument’s D-sub 9-pin connector.
8.4.1 Configuring and Connecting the Adapter
Setting procedure
Display the [Interface] page
Select [RS com speed]
Choose the same com-munications speed as was set with the adapt-er’s DIP switches.
Select with the F keys
Select [Adapter conf.]
Initialize the adapter (see chart below).Perform this step when connecting the adapter for the first time after purchase.
Device name PW3390#nnnnnnnnn:HIOKI(where n indicates the 9-digit serial number)
Operation mode Mode3(Causes the adapter to stand by for connections from all Bluetooth® devices.)
Pin code 0000
Response Unused
Escape sequence characters Not permitted
• For more information about how to configure Hioki LR8410 Link-compatible loggers such asthe LR8410, see the instruction manual for the logger with which you wish to use the instru-ment.
• Changing the instrument’s measurement range while its measured values are being automat-ically saved by an LR8410 Link-compatible logger will prevent the logger from saving the val-ues properly. Set the measurement range on the instrument with the manual range settingbefore initiating auto-saving. When auto-saving is started, the auto-range settings for all chan-nels will turn off.
• The output parameters for LR8410 Link-compatible loggers are the same as the outputparameters for D/A output channels 9 through 16 (D/A9 to D/A16). See "8.3.2 Output Item Selection" (p. 154).

8.5 Using the Motor Testing
162
Motor analysis can be performed for PW3390-03.
Use the motor analysis function to measure torque, rotation rate, motor power and slip by acquiring sig-nals from a tachometer, torque sensor or (incremental) revolution encoder.
When the motor analysis function is installed, apply torque signals to the CH A jack, and rotary encodersignals to CH B and CH Z jacks (isolated BNC jacks are on the rear of the instrument).CH A, CH B and CH Z jacks are isolated to support torque meters and tachometers with different groundpotentials.
Required items: Hioki L9217 Connection Cords (as needed), input devices
8.5 Using the Motor Testing
Connecting a Torque Meter and Tachometer
CH A torque signal input BNC jack
CH B rotation signal input BNC jacks
CH Z rotation signal input BNC jacks
Rear
To avoid electric shock and damage to the instrument, observe the followingwhen connecting to the CH A torque signal input BNC jack and the CH B andCH Z rotary signal input BNC jacks.
• Before connecting, turn off the instrument and any devices to be connected.
• Do not exceed the maximum input signal ratings.
• A serious accident could result if a plug falls out and contacts another conduc-tor during operation. Ensure that all connections are secure.
When disconnecting a BNCplug, always grip the plug andrelease the lock before pullingit out. Attempting to pull out aplug without releasing the lock,or pulling hard on the cable,will damage the connectors. Lock
Notches on BNC plugGuide pins on instrument jack
Connect the instrument and input devicesusing Hioki L9217 Connection Cords.
1. Confirm the that instrument and input devices are turned off.
2. As shown in the examples on the next page, connect the output jacks on the inputdevices to the instrument using the connection cords.
3. Turn the instrument on.
4. Turn the connected devices on.
Procedure

8.5 Using the Motor Testing
163
8
Chapter 8 C
onnecting External D
evices
See section "4.8 Viewing Motor Measurement Values (Model PW3390-03 only)" (p. 94) for measurementdisplays and instrument setting procedures.
Example 1: Connecting a torque meter that provides analog torque values androtation signals
CH A
CH B
CH Z
L9217 Connection Cord
-10 V to 0 V to +10 V
-10 V to 0 V to +10 V
Torque value
Analog voltage output
Rotation signal
Analog voltage output
Torque Meter
Example 2: Connecting a torque meter that provides torque values as frequencyand rotation signals as pulses
Example 3: Connecting the torque meter that provides torque values and the incre-mental rotary encoder
CH A
CH B
CH Z
L9217 Connection Cord
Torque value
Frequency output
Rotation signal
Pulse output
Torque meter
CH A
CH B
CH Z
L9217 Connection Cord
A-phase pulse output
Z-phase pulse output orB-phase pulse output
Torque valueFrequency output orAnalog voltage output
Incremental Rotary Encoder
Torque meter
• CHPulse measurement is not available with CH Z only. Always use pulse input to CH B incombination with CH Z.
• When using CH Z (original position signal or Z-phase), apply a train of at least four pulses to CH B.
Motor Analysis Settings on the Instrument, Displaying Measured Values

8.5 Using the Motor Testing
164

165
89
Chapter 9 O
peration with a C
omputer
The instrument includes standard USB and Ethernet interfaces to connect a computer for remote control.The instrument can be controlled by communication commands, and measurement data can be trans-ferred to the computer using the dedicated application program.
Operating precautions:Use only one interface at a time (USB, LAN, or RS-232C). Attempting to use multiple interfaces at thesame time will cause the instrument to malfunction, for example by interrupting communications.
•Control the instrument remotely by internet browser. (p. 170)
•Control the instrument remotely with communication commands (by creating a program and connecting to the TCP/IP communication command port)
•Set the instrument using the dedicated application program to transfer measurement data to thecomputer.
•Set the instrument using the dedicated application program to transfer measurement data to thecomputer(the program's USB driver must be installed on the computer).
•Controlling the instrument with communication commands.
•Configuring the instrument’s settings and sending measurement data to a computer with a dedi-cated application.
Operation with a Computer Chapter 9
Ethernet ("LAN") Connection Capabilities
USB Connection Capabilities
RS-232C Connection Capabilities
The dedicated application, USB driver, and the Communication Command InstructionManual can be downloaded from our website (http://www.hioki.com).

9.1 Control and Measurement via Ethernet ("LAN") Interface
166
Remote control is available by internet browser. Measurement data is transferred to the computer byusing the dedicated software.
Before communicating, configure the instrument's LAN settings for the network environment, and connectthe instrument to a computer with the Ethernet cable.
Configure the Instrument's LAN Settings
9.1 Control and Measurement via Ethernet ("LAN") Interface
• See the application program's operating manual for operating procedures.
• See the Communication Command Instruction Manual for command communicationprocedures.(Both are downloadable from http://www.hioki.com).
9.1.1 LAN Settings and Network Environment Configuration
• Make these settings before connecting to a network. Changing settings while con-nected can duplicate IP addresses of other network devices, and incorrect addressinformation may otherwise be presented to the network.
• The instrument does not support DHCP (automatic IP address assignment) on a net-work.
Making Network Settings
Display the [Interface] page
Select with the F keys
Reboot the instrument when changing the network settings.
select a setting item
+1↑/-1↓ Increment/decrement by 1
+10↑/-10↓ Increment/decrement by 10
+100↑/-100↓ Increment/decrement by 100

9.1 Control and Measurement via Ethernet ("LAN") Interface
167
89
Chapter 9 O
peration with a C
omputer
IP address Identifies each device connected on a network. Each network device must be set to a unique address. The instrument supports IP version 4, with IP addresses indicated as four deci-mal octets, e.g., "192.168.0.1".
Subnet mask This setting is used to distinguish the address of the network from the addressesof individual network devices.The normal value for this setting is the four decimal octets "255.255.255.0”.
Default Gateway When the computer and instrument are on different but overlapping networks(subnets), this IP address specifies the device to serve as the gateway betweenthe networks.If the computer and instrument are connected one-to-one, no gateway is used,and the instrument's default setting "0.0.0.0" can be kept as is.
Network Environment Configuration
Setting Items
Example 1: Connecting the instrument to an existing network
To connect to an existing network, the network system administrator (IT department) has to assign settingsbeforehand.Some network device settings must not be duplicated.Obtain the administrator's assignments for the following items, and write them down.
IP Address ___.___.___.___Subnet Mask ___.___.___.___Default Gateway ___.___.___.___
Example 2: Connecting multiple instruments to a single computer using a hub
When building a local network with no outside connection, the following private IP addresses are recom-mended.
Configure the network using addresses 192.168.1.0 to 192.168.1.24IP Address ........................... Computer:192.168.1.1
Power Analyzers: assign to each instrument in order 192.168.1.2,192.168.1.3, 192.168.1.4, ...
Subnet Mask........................ 255.255.255.0Default Gateway .................. 0.0.0.0
Example 3: Connecting one instrument to a single computer using the 9642 LANCable
The 9642 LAN Cable can be used with its supplied connection adapter to connect one instrument to onecomputer, in which case the IP address is freely settable. Use the recommended private IP addresses.
IP Address ........................... Computer:192.168.1.1Power Analyzers:192.168.1.2 (Set to a different IP address than the com-puter.)
Subnet Mask........................ 255.255.255.0Default Gateway .................. 0.0.0.0

9.1 Control and Measurement via Ethernet ("LAN") Interface
168
Connect the instrument to the computer using an Ethernet LAN cable.
Required items: When connecting the instrument to an existing network(prepare any of the following):• Straight-through Cat 5, 100BASE-TX-compliant Ethernet cable (up to 100 m,
commercially available). For 10BASE communication, a 10BASE-T-compliantcable may also be used.
• Hioki 9642 LAN Cable (option)
When connecting one instrument to a single computer(prepare one of the following):• 100BASE-TX-compliant cross-over cable (up to 100 m) • 100BASE-TX-compliant straight-through cable with cross-over adapter (up to 100
m) • Hioki 9642 LAN Cable (option)
The Ethernet interface jack is on the right side.
9.1.2 Instrument Connection
Instrument Ethernet ("LAN") interface
RX/TX LED LINK LED
The RX/TX LED blinks when sending and receiving data, and the LINK LED lights when linked to the destination network device.
Ethernet Interface Jack

9.1 Control and Measurement via Ethernet ("LAN") Interface
169
89
Chapter 9 O
peration with a C
omputer
Connect by the following procedure.
When the Ethernet connection is established, the LAN indicator appears at the top of the screen, asshown below.
Connecting the Instrument to a Computer with an Ethernet ("LAN") Cable
When connecting the instrument to an existing network (connect the instrument to a hub)
Connect to the Ethernet jack on the instrument.
Connect to a 100BASE-TX hub.
1
2
When connecting the instrument to a single computer (connect the instrument to the computer)
Ethernet Interface Jack
Cross-Over Adapter
Use the Hioki 9642 LAN Cable and cross-over adapter (9642 accessory)
1 Connect the Ethernet cable to the cross-over adapter.
Connect the cross-over adapter to the Ethernet interface jack on the instrument.
2
Connect the other end of the Ethernet ca-ble to the 100BASE-TX Ethernet jack on the computer.
3

9.2 Remote Control of the Instrument by Internet Browser
170
The instrument includes a standard HTTP server function that supports remote control by an internetbrowser on a computer. The instrument’s display screen and control panel keys are emulated in thebrowser. Operating procedures are the same as on the instrument.
Launch the Internet browser, and enter "http://" followed by the IP address assigned to the instrument inthe browser's address bar. For example, if the instrument's IP address is 192.168.0.1, enter as follows.
When the Main page appears as illustrated, the connection to the instrument has been established.Click the [Remote control] link to jump to the Remote Control page.
9.2 Remote Control of the Instrument by Internet Browser
• Internet browser security level should be set to Medium or Medium-high.
• Unintended operations may occur if remote control is attempted from multiple computerssimultaneously. Use one computer at a time for remote control.
9.2.1 Connecting to the Instrument
Enter "http://IP Address/". Click
What if the Main Page does not display?
• Check the network settings on the instrument and the IP address of the computer.See "9.1.1 LAN Settings and Network Environment Configuration" (p. 166)
• Check that the LINK LED in the Ethernet internet jack is lit, and that (the LAN indicator)is displayed on the instrument’s screen.See "9.1.2 Instrument Connection" (p. 168)

9.2 Remote Control of the Instrument by Internet Browser
171
89
Chapter 9 O
peration with a C
omputer
The instrument's screen and control panel emulations appear in the browser. Click on the control panel keys to perform the same operations as the instrument keys.To enable automatic browser screen updating, set the Update Time in the Auto Update menu.
Auto Display Update Settings
The instrument screen emulation updates at the specified interval.
9.2.2 Operating Procedure
Instrument Screen Emulation
Control Panel Emulation
Auto Display Update
OFF, 0.5s, 1s, 2s, 5s, 10s

9.3 Control and Measurement via USB Interface
172
The instrument can be set and measurement data transferred to a computer using a standard USB con-nection.
The USB indicator is displayed when the connection to the computer is established.
Install the USB driver on the computer before running the dedicated application program.
9.3 Control and Measurement via USB Interface
• Install the dedicated software to a computer before connecting this instrument to a com-puter.
• See the application program’s manual for operating procedures.• To connect the instrument to a computer, a dedicated USB driver must be installed.
The dedicated USB driver is attached to the dedicated software.(Compatible to the Windows 7 (32-bit, 64-bit), Windows 8 (32-bit, 64-bit), Windows 10(32-bit, 64-bit).)The dedicated application and USB driver can be downloaded from our website (http://www.hioki.com).
9.3.1 Connecting to the Instrument
• To avoid faults, do not disconnect or reconnect the USB cable during instrument oper-ation.
• Connect the instrument and the computer to a common earth ground. Using differentgrounds could result in potential difference between the instrument and the computer.Potential difference on the USB cable can result in malfunctions and faults.
USB port
USB port on computer
USB cable (supplied with the instrument)
Connect the instrument to the computer with a USB cable. Noinstrument settings are necessary to establish the USB connection.
If both the instrument and computer are turned off the power while connected by the USBcable, turn on the power of the computer first. It is not able to communicate if the instru-ment is turned on the power first.
9.3.2 After Connecting

9.4 Control and Measurement via RS-232C Interface
173
89
Chapter 9 O
peration with a C
omputer
The instrument ships standard with a RS-232C interface, which makes it possible to control the instru-ment and send measurement data to a computer using communication commands after connecting theinstrument to a computer with an RS-232C cable.
Recommended cable: 9637 RS-232C Cable (9pin-9pin/1.8 m, crossing cable)
9.4 Control and Measurement via RS-232C Interface
Use only one interface at a time (LAN, USB, or RS-232C). Using multiple interfaces at thesame time will cause the instrument to malfunction, for example by interrupting communi-cations.
• See the application program's operating manual for operating procedures.• See the Communication Command Instruction Manual for command communication
procedures. (Both are downloadable from http://www.hioki.com).
9.4.1 Connecting to the Instrument
D-sub9 pin connector
D-sub9 pin connector of the computer
RS-232C Cable(9pin-9pin/1.8 m, crossing cable)
Connect the instrument to a computer with a RS-232C cable.• Be sure to secure the connector in place with screws.

9.4 Control and Measurement via RS-232C Interface
174
Setting the PC's communications speedUse the same communications protocol settings as are being used by the instrument.• Asynchronous• Communications speed: 9600/19200/38400 bps (use same setting as instrument)• Stop bits: 1• Data length: 8 bits• Parity check: None• Flow control: None
9.4.2 Setting the RS-232C Communications Speed
Select with the F keys
Select a setting item[RS com speed]
Display the [Interface] page
Reboot the instrument when changing the settings.
• When connecting the instrument to a controller (DTE), provide a cross cable that satis-fies the specifications of both the instrument’s connector and the controller’s connector.
• If using a USB-serial cable, you may need a gender changer or straight/cross converter.Provide a gender changer or straight/cross converter that satisfies the specifications ofboth the instrument’s connector and the USB/serial cable’s connector.
The instrument’s I/O connectors implement terminal (DTE) specifications. The instrument uses pin numbers 2, 3, 5, 7, and 8. Other pins are unused.
Pin number
Compatible connection circuit nameCCIT circuit
numberEIA code JIS code
Common code
1 Data channel receiveCarrier detect
Carrier Detect 109 CF CD DCD
2 Receive data Receive Data 104 BB RD RxD
3 Transmit data Send Data 103 BA SD TxD
4 Data terminal ready Data Terminal Ready
108/2 CD ER DTR
5 Signal ground Signal Ground 102 AB SG GND
6 Data set ready Data Set Ready 107 CC DR DSR
7 Request to send Request to Send 105 CA RS RTS
8 Clear to send Clear to Send 106 CB CS CTS
9 Ring indicator Ring Indicator 125 CE CI RI

9.4 Control and Measurement via RS-232C Interface
175
89
Chapter 9 O
peration with a C
omputer
Cross wiring
D-sub 9pin, femalePW3390 side
D-sub 9pin, femalePC side

9.4 Control and Measurement via RS-232C Interface
176

10.1 General Specifications
177
1010
Chapter 10 S
pecifications
Specifications Chapter 1010.1 General Specifications
Operating environment Indoors, Pollution Degree 2, altitude up to 2000 m (6562 ft.)
Operating temperature and humidity
0°C to 40°C (32°F to 104°F), 80% RH or less (no condensation)
Storage temperature and humidity -10°C to 50°C (14°F to 122°F), 80% RH or less (no condensation)
Dustproof and waterproof IP30 (EN60529)With CF card cover open: IP20
Applicable standards Safety: EN61010 EMC: EN61326 Class A
Power supply Rated supply voltage: 100 V to 240 V AC (Voltage fluctuations of ±10% for the rated supply voltage are taken into account.)Rated supply frequency: 50 Hz/60 HzAnticipated transient overvoltage: 2500 VMaximum rated power: 140 VA
Backup battery life Clock, settings and integration values for backup (Lithium battery), Approx. 10 years (at 23°C, as a referential)
Interface USB (function), USB memory, LAN, CF card, RS-232C, Synchronous control
Dimensions Approx. 340 W ×170 H ×156 D mm (13.39" W ×6.69" H ×6.14" D) (excluding protrusions)
Mass Approx. 4.6 kg (162.3 oz.) when PW3390-03
Product warranty period 1 year
Accessories See "Confirming Package Contents"( p.2)
Options See "Options"( p.3)
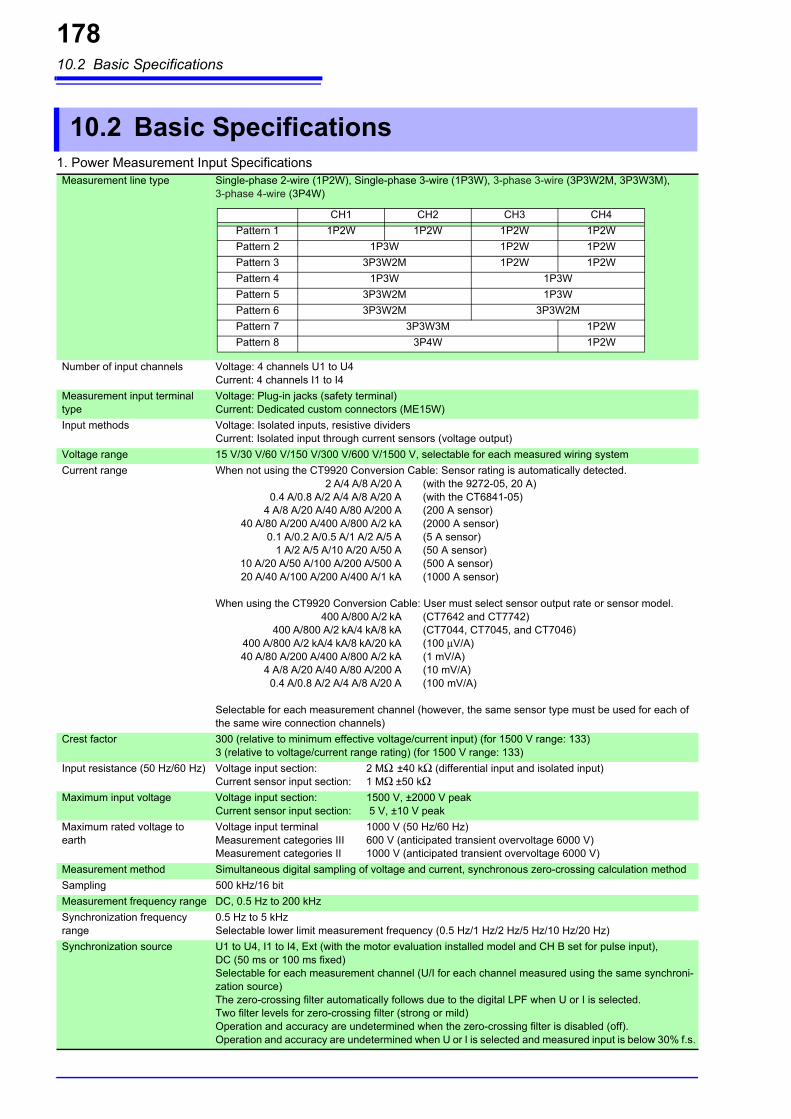
10.2 Basic Specifications
178
10.2 Basic Specifications1. Power Measurement Input SpecificationsMeasurement line type Single-phase 2-wire (1P2W), Single-phase 3-wire (1P3W), 3-phase 3-wire (3P3W2M, 3P3W3M),
3-phase 4-wire (3P4W)
Number of input channels Voltage: 4 channels U1 to U4Current: 4 channels I1 to I4
Measurement input terminal type
Voltage: Plug-in jacks (safety terminal)Current: Dedicated custom connectors (ME15W)
Input methods Voltage: Isolated inputs, resistive dividersCurrent: Isolated input through current sensors (voltage output)
Voltage range 15 V/30 V/60 V/150 V/300 V/600 V/1500 V, selectable for each measured wiring system
Current range When not using the CT9920 Conversion Cable: Sensor rating is automatically detected.2 A/4 A/8 A/20 A (with the 9272-05, 20 A)
0.4 A/0.8 A/2 A/4 A/8 A/20 A (with the CT6841-05)4 A/8 A/20 A/40 A/80 A/200 A (200 A sensor)
40 A/80 A/200 A/400 A/800 A/2 kA (2000 A sensor)0.1 A/0.2 A/0.5 A/1 A/2 A/5 A (5 A sensor)
1 A/2 A/5 A/10 A/20 A/50 A (50 A sensor)10 A/20 A/50 A/100 A/200 A/500 A (500 A sensor)20 A/40 A/100 A/200 A/400 A/1 kA (1000 A sensor)
When using the CT9920 Conversion Cable: User must select sensor output rate or sensor model.400 A/800 A/2 kA (CT7642 and CT7742)
400 A/800 A/2 kA/4 kA/8 kA (CT7044, CT7045, and CT7046)400 A/800 A/2 kA/4 kA/8 kA/20 kA (100 μV/A)40 A/80 A/200 A/400 A/800 A/2 kA (1 mV/A)
4 A/8 A/20 A/40 A/80 A/200 A (10 mV/A)0.4 A/0.8 A/2 A/4 A/8 A/20 A (100 mV/A)
Selectable for each measurement channel (however, the same sensor type must be used for each of the same wire connection channels)
Crest factor 300 (relative to minimum effective voltage/current input) (for 1500 V range: 133)3 (relative to voltage/current range rating) (for 1500 V range: 133)
Input resistance (50 Hz/60 Hz) Voltage input section: 2 MΩ ±40 kΩ (differential input and isolated input) Current sensor input section: 1 MΩ ±50 kΩ
Maximum input voltage Voltage input section: 1500 V, ±2000 V peakCurrent sensor input section: 5 V, ±10 V peak
Maximum rated voltage to earth
Voltage input terminal 1000 V (50 Hz/60 Hz) Measurement categories III 600 V (anticipated transient overvoltage 6000 V)Measurement categories II 1000 V (anticipated transient overvoltage 6000 V)
Measurement method Simultaneous digital sampling of voltage and current, synchronous zero-crossing calculation method
Sampling 500 kHz/16 bit
Measurement frequency range DC, 0.5 Hz to 200 kHz
Synchronization frequency range
0.5 Hz to 5 kHzSelectable lower limit measurement frequency (0.5 Hz/1 Hz/2 Hz/5 Hz/10 Hz/20 Hz)
Synchronization source U1 to U4, I1 to I4, Ext (with the motor evaluation installed model and CH B set for pulse input), DC (50 ms or 100 ms fixed)Selectable for each measurement channel (U/I for each channel measured using the same synchroni-zation source)The zero-crossing filter automatically follows due to the digital LPF when U or I is selected.Two filter levels for zero-crossing filter (strong or mild)Operation and accuracy are undetermined when the zero-crossing filter is disabled (off).Operation and accuracy are undetermined when U or I is selected and measured input is below 30% f.s.
CH1 CH2 CH3 CH4
Pattern 1 1P2W 1P2W 1P2W 1P2W
Pattern 2 1P3W 1P2W 1P2W
Pattern 3 3P3W2M 1P2W 1P2W
Pattern 4 1P3W 1P3W
Pattern 5 3P3W2M 1P3W
Pattern 6 3P3W2M 3P3W2M
Pattern 7 3P3W3M 1P2W
Pattern 8 3P4W 1P2W

10.2 Basic Specifications
179
1010
Chapter 10 S
pecifications
Data update interval 50 ms
LPF OFF/500 Hz/5 kHz/100 kHz (selectable for each wiring system)500 Hz Accuracy defined under 60 Hz, add ±0.1% f.s.5 kHz Accuracy defined under 500 Hz100 kHz Accuracy defined under 20 kHz, add 1% rdg. from 10 kHz to 20 kHz
Polarity discrimination Voltage/current zero-crossing timing comparison methodZero-crossing filter provided by digital LPF
Measurement items Voltage (U), Current (I), active power (P), apparent power (S), reactive power (Q), power factor (λ), phase angle (φ), frequency (f), efficiency (η), loss (Loss), voltage ripple factor (Urf), current ripple factor (Irf), current integration (Ih), power integration (WP), peak voltage (Upk), peak current (Ipk)
1. Power Measurement Input Specifications

10.2 Basic Specifications
180
Accuracy
Values of f in above tables are given in kHz.Accuracy figures for DC voltage and current are defined for Udc and Idc, while accuracy figures for fre-quencies other than DC are defined for Urms and Irms.Accuracy figures for phase difference values are defined for full-scale input with a power factor of zero and the LPF disabled.Accuracy figures for voltage, current, and active power values in the frequency range of 0.5 Hz to 10 Hz are provided as reference values. Accuracy figures for voltage and active power values in excess of 220 V in the frequency range of 10 Hz to 16 Hz are provided as reference values. Accuracy figures for voltage and active power values in excess of 750 V in the frequency range of 30 kHz to 100 kHz are provided as reference values. Accuracy figures for voltage and active power values in excess of (22000/f [kHz]) V in the frequency range of 100 kHz to 200 kHz are provided as reference values.Accuracy figures for voltage and active power values in excess of 1000 V are provided as reference val-ues. Accuracy figures for phase difference values outside the frequency range of 45 Hz to 66 Hz are provided as reference values.For voltages in excess of 600 V, add the following to the phase difference accuracy:
500 Hz < f ≤ 5 kHz: ±0.3°5 kHz < f ≤ 20 kHz: ±0.5°20 kHz < f ≤ 200 kHz: ±1°
Add ±20 μV to the DC current and active power accuracy (at 2 V f.s.)
Add the current sensor accuracy to the above accuracy figures for current, active power, and phase dif-ference.However, the combined accuracy is defined separately for the current measurement options listed be-low.
Combined accuracy when used with current measurement options PW9100-03 or PW9100-04 (with PW3390 range as f.s.)
Add ±0.12% f.s. (f.s. = PW3390 range) when using 1 A or 2 A range.
Combined accuracy when used with any of the following current measurement options: special-order high-accuracy 9709-05, high-accuracy CT6862-05, or high-accuracy CT6863-05 (with PW3390 range as f.s.)
Apply LPF accuracy definitions to the above accuracy figures when using the LPF.
1. Power Measurement Input Specifications
Voltage (U) Current (I)
DC ±0.05% rdg.±0.07% f.s. ±0.05% rdg.±0.07% f.s.
0.5 Hz ≤ f <30 Hz ±0.05% rdg.±0.1% f.s. ±0.05% rdg.±0.1% f.s.
30 Hz ≤ f <45 Hz ±0.05% rdg.±0.1% f.s. ±0.05% rdg.±0.1% f.s.
45 Hz ≤ f ≤66 Hz ±0.04% rdg.±0.05% f.s. ±0.04% rdg.±0.05% f.s.
66 Hz < f ≤1 kHz ±0.1% rdg.±0.1% f.s. ±0.1% rdg.±0.1% f.s.
1 kHz < f ≤10 kHz ±0.2% rdg.±0.1% f.s. ±0.2% rdg.±0.1% f.s.
10 kHz < f ≤50 kHz ±0.3% rdg.±0.2% f.s. ±0.3% rdg.±0.2% f.s.
50 kHz < f ≤100 kHz ±1.0% rdg.±0.3% f.s. ±1.0% rdg.±0.3% f.s.
100 kHz < f ≤200 kHz ±20% f.s. ±20% f.s.
Active power (P) Phase difference
DC ±0.05% rdg.±0.07% f.s. −0.5 Hz ≤ f <30 Hz ±0.05% rdg.±0.1% f.s. ±0.08°
30 Hz ≤ f <45 Hz ±0.05% rdg.±0.1% f.s. ±0.08°
45 Hz ≤ f ≤66 Hz ±0.04% rdg.±0.05% f.s. ±0.08°
66 Hz < f ≤1 kHz ±0.1% rdg.±0.1% f.s. ±0.08°
1 kHz < f ≤10 kHz ±0.2% rdg.±0.1% f.s. ±(0.06*f+0.02)°
10 kHz < f ≤50 kHz ±0.4% rdg.±0.3% f.s. ±0.62°
50 kHz < f ≤100 kHz ±1.5% rdg.±0.5% f.s. ±(0.005*f+0.4)°
100 kHz < f ≤200 kHz ±20% f.s. ±(0.022*f-1.3)°
Current (I) Active power (P)
DC ±0.07% rdg.±0.077% f.s. ±0.07% rdg.±0.077% f.s.
45 Hz ≤ f ≤66 Hz ±0.06% rdg.±0.055% f.s. ±0.06% rdg.±0.055% f.s.
Current (I) Active power (P)
DC ±0.095% rdg.±0.08% f.s. ±0.095% rdg.±0.08% f.s.
45 Hz ≤ f ≤66 Hz ±0.085% rdg.±0.06% f.s. ±0.085 rdg.±0.06% f.s.

10.2 Basic Specifications
181
1010
Chapter 10 S
pecifications
Guaranteed accuracy period 6 months (and 1.25 times specified accuracy for one year)
Conditions of guaranteed accuracy
Temperature and humidity for guaranteed accuracy: 23°C±3°C, 80% RH or lessWarm-up time: 30 minutes or moreInput: Sine wave input, power factor of one, or DC input, zero ground voltage, within effective measure-ment range after zero-adjustment and within the specified range in which the fundamental wave satisfies the synchronization source conditions.
Temperature coefficient ±0.01% f.s./°C (for DC, add ±0.01% f.s./°C)
Effect of common mode voltage
±0.01% f.s. or less (with 1000 V (50 Hz/60 Hz) applied between voltage measurement jacks and chassis)
Magnetic field interference ±1% f.s. or less (in 400 A/m magnetic field, DC and 50 Hz/60 Hz)
Power factor influence Other than φ = ±90° ±(1-cos (φ+Phase difference accuracy)/cos(φ)) ×100% rdg.When φ = ±90°±cos (φ+Phase difference accuracy) ×100% f.s.
Effect of conducted radio-frequency electromagnetic field
@3 V, current and active power not more than ±6% f.s., where f.s. current is the rated primary-side cur-rent of the current sensorf.s. active power equals the voltage range × the rated primary-side current of the current sensor
Effect of radiated radio-frequency electromagnetic field
@10 V/m, current and active power not more than ±6% f.s., where f.s. current is the rated primary-side current of the current sensor, and f.s. active power equals the voltage range × the rated primary-side current of the current sensor
Effective measuring range Voltage, Current, Power: 1% to 110% of the range
Total display area Voltage, Current, Power: Voltage, current and power: from zero-suppression range setting to 120%
Zero-suppression ranges Selectable OFF, 0.1 or 0.5% f.s.When OFF, non-zero values may be displayed even with no measurement input
Zero adjustment Voltage: Zero-adjustment compensation of internal offset at or below ±10% f.s.Current: Zero-adjustment compensation of input offset at or below ±10% f.s. ±4 mV
Waveform peak measurement range
Within ±300% of each voltage and current range
Waveform peak measurement accuracy
Within ±2% f.s. of voltage and current display accuracy
1. Power Measurement Input Specifications
2. Frequency Measurement SpecificationsMeasurement channels Four (f1 to f4)
Measurement source Select U/I for each measurement channel
Measurement method Reciprocal method + zero-crossing sample value correction
Measuring range Synchronous range from 0.5 Hz to 5 kHz (with “0.0000 Hz” or "----- Hz" unmeasurable time)Selectable lower limit measurement frequency (0.5 Hz/1 Hz/2 Hz/5 Hz/10 Hz/20 Hz)
Data update interval 50 ms (measurement-frequency-dependent at 45 Hz and below)
Accuracy ±0.01 Hz (during voltage frequency measurement, with sine wave input of at least 30% of the voltage measurement range and while measuring within the range of 45 Hz to 66 Hz)Under other conditions, ±0.05% rdg. ±1 dgt. (with sine wave of at least 30% of the measurement source’s measurement range)
Numerical display format 0.5000 Hz to 9.9999 Hz, 9.900 Hz to 99.999 Hz, 99.00 Hz to 999.99 Hz, 0.9900 kHz to 5.0000 kHz
3. Integration Measurement SpecificationsMeasurement mode Selectable RMS or DC for each wiring mode (DC is selectable only for 1P2W wiring and AC/DC sen-
sors)
Measurement items Current integration (Ih+, Ih-, and Ih), active power integration (WP+, WP-, and WP)Ih+ and Ih- only for DC mode measurements, and lh only for RMS mode measurements
Measurement method Digital calculation from each current and active power phase (when averaging, calculates with pre-vious average value)In DC mode: calculates current value at every sample, and integrates instantaneous power indepen-dent of polarityIn RMS mode: Integrates current effective values between measurement intervals, and polarity-in-dependent active power value
Measurement interval 50 ms data update interval
Display resolution 999999 (6 digits + decimal) , starting from resolution at which 1% of each range constitutes f.s.
Measuring range 0 to ±9999.99 TAh/TWh (however, with integration time of no greater than 9999 hours and 59 minutes)Integration stops when either maximum integration value or time is exceeded.
Integration time accuracy ±50ppm±1dgt. (0°C to 40°C)
Integration accuracy ± (current and active power accuracy) ± integration time accuracy
Backup function Integration automatically resumes after power outages.

10.2 Basic Specifications
182
4. Harmonic Measurement SpecificationsNumber of measurement channels 4 Channels
Harmonic measurements not available for multiple systems with different frequencies.
Measurement items Harmonic rms voltage, harmonic voltage percentage, harmonic voltage phase angle, harmonic rms current, harmonic current percentage, harmonic current phase angle, harmonic active power, har-monic power percentage, harmonic voltage-current phase difference, total harmonic voltage distor-tion, total harmonic current distortion, voltage imbalance, current imbalance
Measurement method Zero-crossing synchronous calculation (all channels in same window), with gapFixed 500 kS/s sampling, after digital anti-aliasing filterEqual thinning between zero crossings (with interpolation calculation)
Synchronization source U1 to U4, I1 to I4, External (with motor analysis and CH B set for pulse input), DC selectable (50 ms or 100 ms)
FFT calculation word length 32 bits
Anti-aliasing filter Digital filter (automatically set based on synchronization frequency)
Windows Rectangular
Synchronization frequency range As specified for power measurements
Data update interval 50 ms (measurement-frequency-dependent at 45 Hz and below)
Phase zero adjustment Provided by key operation or external control command (only with external sync source)
Highest order analysis and window waveforms
Accuracy
Not specified for sync frequencies of 4.3 kHz and higherAdd the LPF accuracy to the above when using LPF.
Synchronization frequency range Window waveforms Analysis order
0.5 Hz ≤ f <40 Hz 1 100th
40 Hz ≤ f <80 Hz 1 100th
80 Hz ≤ f <160 Hz 2 80th
160 Hz ≤ f <320 Hz 4 40th
320 Hz ≤ f <640 Hz 8 20th
640 Hz ≤ f <1.2 kHz 16 10th
1.2 kHz ≤ f <2.5 kHz 32 5th
2.5 kHz ≤ f <5.0 kHz 64 3th
Frequency Voltage(U), Current(I), Active Power(P)
0.5 Hz ≤ f <30 Hz ±0.4% rdg.±0.2% f.s.
30 Hz ≤ f ≤400 Hz ±0.3% rdg.±0.1% f.s.
400 Hz < f ≤1 kHz ±0.4% rdg.±0.2% f.s.
1 kHz < f ≤5 kHz ±1.0% rdg.±0.5% f.s.
5 kHz < f ≤10 kHz ±2.0% rdg.±1.0% f.s.
10 kHz < f ≤13 kHz ±5.0% rdg.±1.0% f.s.

10.2 Basic Specifications
183
1010
Chapter 10 S
pecifications
5. Noise Measurement SpecificationsCalculation channels 1(Select one from CH1 to CH4)
Calculation parameters Voltage/Current
Calculation type RMS spectrum
Calculation method Fixed 500 kS/s sampling, thinning after digital anti-aliasing filter
FFT calculation word length 32 bits
FFT data points 1,000/5,000/10,000/50,000 (according to displayed waveform recording length)
Anti-aliasing filter Automatic digital filter (varies with maximum analysis frequency)
Windows Rectangular, Hanning, flat-top
Data update interval Determined by FFT points within approx. 400 ms, 1s, 2s, or 15 s, with gap
Highest analysis frequency 100 kHz/50 kHz/20 kHz/10 kHz/5 kHz/2 kHz
Frequency resolution 0.2 Hz to 500 Hz (Determined by FFT points and maximum analysis frequency)
Noise amplitude measurement Calculates the ten highest level and frequency voltage and current FFT peak values (local maxima).In FFT calculation results, peak values are recognized when data levels on either side are lower. The lower noise frequency limit can be specified.
6. Motor Analysis Specifications (Model PW3390-03 only)Number of input channels 3 channels
CH A: Analog DC input, Frequency inputCH B: Analog DC input, Pulse inputCH Z: Pulse input
Measurement input jacks Insulated BNC jacks
Input impedance (DC) 1 MΩ ±100 kΩInput methods Isolated and differential inputs (not isolated between channels B and Z)
Measurement parameters Voltage, torque, rotation rate, frequency, slip, and motor power
Maximum input voltage ±20 V (during analog, frequency, and pulse input)
Maximum rated voltage to earth 50 V (50 Hz/60 Hz)
Period of guaranteed accuracy 6 months (and 1.25 times specified accuracy for one year)
Conditions of guaranteed accuracy
Temperature and humidity for guaranteed accuracy: 23°C±3°C (73°F±5°F), 80% RH or lessWarm-up time: 30 minutes or moreInput: With 0 V to ground, after zero adjustment
(1) Analog DC Input (CH A/CH B)Measurement range ±1 V, ±5 V, ±10 V (when inputting analog DC)
Valid input range 1% to 110% f.s.
Sampling 10 kHz/16bits
Response time 1 ms (measuring zero to full scale, with LPF off)
Measurement method Simultaneous digital sampling and zero-crossing synchronous calculation system (cumulative aver-age of intervals between zero crossings)
Synchronization source Same as power measurement input specification (common to CH A and CH B)
Measurement accuracy ±0.08% rdg. ±0.1% f.s.
Temperature coefficient ±0.03% f.s./°C
Effect of common mode voltage Not more than ±0.01% f.s. (with 50 V [DC or 50 Hz/60 Hz] between measurement jacks and PW3390 chassis)
Effect of external magnetic field Not more than ±0.1% f.s. (at 400 A/m DC and 50 Hz/60 Hz magnetic fields)
LPF OFF/ON (OFF: 4 kHz, ON: 1 kHz)
Total display area Zero-suppression range setting ±120%
Zero adjustment Zero-corrected input offset of voltage ±10% f.s. or less
(2) Frequency Input (CH A only)Valid amplitude range ±5 V peak (5 V symmetrical, equivalent to RS-422 complementary signal)
Max. measurement frequency 100 kHz
Measurement range 1 kHz to 100 kHz
Synchronization source Same as power measurement input specification
Data output interval According to synchronization source
Measurement accuracy ±0.05% rdg. ±3 dgt.
Total display area 1.000 kHz to 99.999 kHz

10.2 Basic Specifications
184
(3) Pulse Input (CH B only)Detection level Low: 0.5 V or less, High: 2.0 V or more
Measurement range 1 Hz to 200 kHz (at 50% duty)
Division setting range 1 to 60000
Measurement frequency range 0.5 Hz to 5.0 kHz (limited to measured pulse frequency divided by selected no. of divisions)
Minimum detectable pulse width 2.5 µs or better
Measurement accuracy ±0.05% rdg. ±3 dgt.
(4) Pulse Input (CH Z only) Detection level Low: 0.5 V or less, High: 2.0 V or more
Measurement range 0.1 Hz to 200 kHz (at 50% duty)
Minimum detectable pulse width 2.5 μs or better
Settings OFF/Z Phase/B Phase (clear counts of CHB in rising edge during Z Phase, detect polar code for number of rotations during B Phase)
7. D/A Output Option Specifications (Models PW3390-02 and PW3390-03)Number of output channels 16 channels
Output contents Selectable waveform/analog outputs (from basic measurement parameters)Waveform output only on Channels 1 to 8
Output connector One 25-pin female D-sub
D/A conversion resolution 16 bits (polarity + 15 bits)
Output accuracy Analog output: Measurement accuracy ±0.2% f.s. (DC level) Waveform output: Measurement accuracy ±0.5% f.s. (at ±2 V f.s.), ±1.0% f.s. (at ±1 V f.s.)(rms level within synchronous frequency range)
Output update interval Analog output: 50 ms (according to input data update interval of selected parameter)Waveform output: 500 kHz
Output voltage Analog output: ±5 V DC nom. (approx. ±12 V DC max.) Waveform output: ±2 V/±1 V switchable, crest factor of 2.5 or greaterSetting applies to all channels.
Output impedance 100 Ω ±5 ΩPeriod of guaranteed accuracy 6 months (For 1 year accuracy, calculate the specified accuracy for 6 months ×1.25)
Conditions of guaranteed accura-cy
Temperature and humidity: 23°C±3°C (73°F±5°F), 80% RH or lessWarm-up time: 30 minutes or more, After zero adjustment of the PW3390
Temperature coefficient ±0.05% f.s./°C
Pinout 13 12 11 10 9 8 7 6 5 4 3 2 1
25 24 23 22 21 20 19 18 17 16 15 14
Pin No. Output (Waveform) Pin No. Output
1 GND 14 GND
2 D/A1 (U1) 15 D/A9
3 D/A2 (I1) 16 D/A10
4 D/A3 (U2) 17 D/A11
5 D/A4 (I2) 18 D/A12
6 D/A5 (U3) 19 D/A13
7 D/A6 (I3) 20 D/A14
8 D/A7 (U4) 21 D/A15
9 D/A8 (I4) 22 D/A16
10 GND 23 GND
11 GND 24 GND
12 GND 25 GND
13 GND − −

10.2 Basic Specifications
185
1010
Chapter 10 S
pecifications
9. External Interface Specifications
8. Display SpecificationsLanguages Japanese, English, Simplified Chinese
Display type 9-inch TFT color LCD (800×480 dots)
Dot pitch 0.246(V) mm ×0.246(H) mm
LCD backlight Always ON, Auto OFF (after 1/5/10/30/60 minutes)
Display numerical resolution 99999 counts (other than the integrated value) 999999 counts (Integrated value)
Display refresh interval Measurement values: 200 ms (independent of internal data update interval) Waveforms, FFT: Screen-dependent
Screens Measurement, Setting, and File Operation screens
(1) USB Interface (Functions)Connector Mini-B receptacle
Compliance standard USB2.0 (Full Speed/High Speed)
No. of ports 1
Class Individual (USB488h)
Connection destination Computer Windows 7 (32bit, 64bit)/Windows 8 (32bit, 64bit)/Windows 10 (32bit, 64bit)
Function Data transfer and command controlNot for simultaneous use with Ethernet: USB has priority when both interfaces used
(2) USB Memory InterfaceConnector USB type A connector
Compliance standard USB2.0
USB power supply 500 mA maximum
No. of ports 1
USB storage device support USB Mass Storage Class
Recordable content Save and load settings filesSave measurement values (CSV format)Copy measurement values and recorded data (from CF card)Save waveform dataSave screen captures
(3) LAN InterfaceConnector RJ-45 connector × 1Compliance standard IEEE802.3 compliant
Transmission method 10BASE-T/100BASE-TX Auto detected
Protocol TCP/IP
Function HTTP server (remote operation), Dedicated port (data transfer and command control)Not for simultaneous use with USB (functions): USB has priority when both interfaces used
(4) CF Card InterfaceSlot One Type 1
Compatible card Compact Flash memory card (32 MB or higher)
Supported memory capacity Up to 2 GB
Data format MS-DOS format (FAT16/FAT32)
Recordable content Save and load settings filesSave measurement voltage and auto-recorded data (CSV format) Copy measurements/recorded data (from USB storage)Save waveform dataSave screen captures

10.2 Basic Specifications
186
(5) RS-232C InterfaceMethod RS-232C
[EIA RS-232D], [CCITT V.24], [JIS X5101] compliant
Connector D-sub9 pin connector ×1
Connection destination PC (simultaneous use of USB and LAN not supported; order of precedence with simultaneous con-nection: USB > LAN > RS-232C.)
Communication format Full duplex, start-stop synchronization, 8-bit data, no parity, one stop bit, hardware flow control, CR+LF delimiter
Communication speeds 9600 bps, 19200 bps, 38400 bps
Function Command control, Bluetooth® logger connectivity (simultaneous use not supported)
(6) Synchronization Control InterfaceSignal contents One-second clock, integration START/STOP, DATA RESET, EVENT
Connector types IN: 9-pin round connector ×1OUT: 8-pin round connector ×1
Signal 5 V CMOS
Max. input ±20 V
Max. signal delay 2 μs (rising edge)
(7) External Control InterfaceConnector types 9-pin round connector ×1 ; also used as synchronization control interface
Pin assignments Pin 1: Data resetPin 2: Integration start/stopPin 4: EventPin 7: Ground
Electrical specifications 0 V/5 V (2.5 V to 5 V) logic signal, or contact signal with contacts shorted/open
Function Data reset: Same operation as the DATA RESET key on the control panelIntegration start/stop: Same operation as the START/STOP key on the control panelEvent: Same operation as the event set as the synchronization control function’s synchronization event (Cannot be used at the same time as synchronization control.)

10.3 Functions Specifications
187
1010
Chapter 10 S
pecifications
1.AUTO range Function
2.Timing Control Functions
3.Hold Functions
10.3 Functions Specifications
Function Automatically selects voltage and current ranges according to measured amplitude on each phase.
Operating states Selectable on or off for each phase system
Auto-ranging span Wide/Narrow (common to all wiring systems)Wide: When a phase system’s peak-over or rms value is above 110% f.s., increments one
range, and, when all rms values within the phase system are below 10% f.s., decrements two ranges (except when peak-over occurs in the lower range, in which case no range decrementing occurs).
Narrow: When a wiring system peak over or rms value is above 105% f.s., increments one range, and, when all rms values within the wiring system are below 40% f.s., decrements one range (except when peak-over occurs in the lower range, in which case no range decre-menting occurs).
1 3⁄When Δ-Y transform is enabled, the range-decrementing voltage is (approximately 0.57735) f.s.
Interval OFF/50 ms/100 ms/200 ms/500 ms/1 s/5 s/10 s/15 s/30 s/1 min/5 min/10 min/15 min/30 min/60 minSetting determines the maximum data-saving capacity
Timing controls OFF /Timer /RTC Timer: 10 s to 9999:59:59 [h:m:s] (in seconds)Real-Time Clock: Start and stop times (in minutes)
(1) HoldFunction Stops all updating of displayed measurement values and waveforms, and holds display.
However, the clock and peak-over display continue to be updated.Disabled when the peak-hold function is enabled.
Data updating The next display data update occurs when the HOLD key is pressed again, at the end of the mea-surement interval, or when an external sync signal is detected. Internal data is updated every 50 ms (independent of the display data update interval). Waveform and noise data are updated when calculation finishes.
Output data Held values are present at D/A output and are saved to CF card (although waveform output contin-ues). With auto-saving enabled, data is saved immediately before it is updated.
Display The HOLD indicator appears when Hold is active.
Backup Not applicable (the function is deactivated upon recovery from power outages.)
(2) Peak HoldFunction All measurement values are updated to display the maximum value for each measurement.
However, displayed waveforms and integration values continue to be updated with instantaneous values.When averaging is enabled, maximum values are displayed after averaging. Cannot be used together with the display-hold function.Signed items are compared for absolute values.
Data updating Displayed data is cleared when the HOLD key is pressed again, at the end of the measurement in-terval, or when an external sync signal is detected.Internal data is updated every 50 ms (independent of the display refresh interval).
Output data Held values are present at D/A output and are saved to CF card (although waveform output contin-ues).With auto-saving enabled, data is saved immediately before it is updated.
Display The PEAK HOLD indicator appears when Peak Hold is active.
Backup Not applicable (the function is deactivated upon recovery from power outages.)

10.3 Functions Specifications
188
4.Calculation Functions (1) Rectification SystemFunction Select which voltage and current values to used for calculating apparent and reactive power, and
power factor
Method rms/mean (voltage and current in each phase system)
(2) ScalingVT (PT) ratio OFF/0.01 to 9999.99 (Settings for which VT×CT exceeds 1.0E+06 are disallowed.)
CT ratio OFF/0.01 to 9999.99 (Settings for which VT×CT exceeds 1.0E+06 are disallowed.)
Display VT or CT indicator is displayed when scaling.
(3) AverageFunction Averages all instantaneous measurement values including harmonics (but not peak, integration, or
FFT noise values). When averaging is enabled, the averaged data is saved.
Method Indexed average (applied at 50 ms data update intervals) Averaged voltage (U), current (I), and power (P) values are used for calculations.rms values are averaged for harmonic amplitude, and instantaneous values are averaged for relative harmonic content. Phase angle is calculated from the average real and imaginary components after FFT.Phase difference, distortion and imbalance are calculated from the above data after averaging.Ripple factor is calculated from averaging the differences in peak values.
Response speed OFF/FAST/MID/SLOW/SLOW2/SLOW3(time remains within specified accuracy when input changes from 0 to 100% f.s.) Corresponding response times are 0.2 s/1.0 s/5 s/25 s/100 s
Display The AVG indicator is displayed when averaging is enabled.
(4) Efficiency and Loss CalculationsFunction Efficiency η [%] and Loss [W] are calculated from active power values measured on each phase and
system.
Calculation items Active power (P) of each phase and systemMotor power (Pm) when motor evaluation model PW3390-03 is installed
Calculation accuracy Measurements applied to formulas are handled as 32-bit floating point values.When calculating parameters between wiring systems with different power ranges, the higher range is used.
Calculation rate At every 50 ms data update intervalWhen calculating between wiring systems having different sync sources, the most recent data is used at calculation time.
Maximum no. of simultaneous calculations
Efficiency and loss, by three formulas
Calculation method Parameters specified for Pin and Pout are applied as followsη = 100 × |Pout|/|Pin|, Loss = |Pin| - |Pout|
(5) Δ - Y CalculationFunction For 3P3W3M systems, converts between line-to-line voltage and phase voltage waveforms using a
virtual center point. All voltage parameters including harmonics such as true rms voltage are calcu-lated as phase voltage waveforms.
Calculation method U1s = (U1s-U3s)/3, U2s = (U2s-U1s)/3, U3s =U3s-U2s)/3
(6) Selecting the Calculation MethodFunction Select the calculation method used to calculate the apparent power and reactive power during
3P3W3M wiring.Only affect measurement values S123, Q123, φ123, λ123
Calculation method TYPE1/TYPE 2 (only valid when wiring is 3P3W3M)
(7) Current sensor phase correction calculationsFunction Compensation by calculating the current sensor’s harmonic phase characteristics
Operating modes OFF/ON (set separately for each wiring mode)
Configuration of corrected values Correction points are set using frequency and phase difference (set separately for each wiring mode).Frequency: 0.001 kHz to 999.999 kHz (in 0.001 kHz increments)Phase difference: 0.00 deg. to ±90.00 deg. (in 0.01 deg. increments)However, the time difference calculated from the frequency phase difference is limited to a maximum of 200 μs in 5 ns increments.

10.3 Functions Specifications
189
1010
Chapter 10 S
pecifications
5. Display Functions
6. Graph Display Functions
7. Auto-Save Functions
(1) Wiring Check screenFunction The wiring diagram and voltage/current vectors are displayed for the selected wiring system(s). The
correct range for the wiring system is shown on the vector display, to confirm proper measurement cable connections.
Start-up mode The Wiring Check screen can be set to always appear upon start-up (Start-Up Screen setting).
Basic settings Selects auto-ranging for voltage and current on each wiring system, and sets each value to its de-fault. Not available when integration or the Hold function is enabled.
(2) Independent wiring system display modeFunction Displays power and harmonic measurement values for channels 1 to 4.
A composite measurement line pattern is displayed for each system.
DMM Basic, voltage, current, and power measurement parameter screens
Harmonics Bar Graph, List or Vector screen
(3) Display SelectionsFunction Select to display any 4, 8, 16, or 32 of the basic measurement parameters.
Display layout 4, 8, 16, or 32 parameters, Independently set for each screen
(4) Efficiency and Loss ScreenFunction The efficiency and loss obtained by the specified calculation formulas are displayed numerically.
Display layout Three efficiency and three loss values.
(5) Waveform & Noise ScreenFunction Voltage and current waveforms sampled at 500 kHz and noise measurements are displayed com-
pressed on one screen.
Trigger Synchronized with the harmonic sync source
Recording length 1000/5000/10000/50000 × All voltage and current channels
Compression ratio 1/1, 1/2, 1/5, 1/10, 1/20, 1/50 (peak-to-peak compression) Also, peak-to-peak compression enables drawing 500-dot (vertical) screen images
Noise sampling 500 kS/s, 250 kS/s, 100 kS/s, 50 kS/s, 25 kS/s, 10 kS/s (according to compression ratio)
Recording timeSampling
Recording length
1000 5000 10000 50000
500 kS/s 2 ms 10 ms 20 ms 100 ms
250 kS/s 4 ms 20 ms 40 ms 200 ms
100 kS/s 10 ms 50 ms 100 ms 500 ms
50 kS/s 20 ms 100 ms 200 ms 1000 ms
25 kS/s 40 ms 200 ms 400 ms 2000 ms
10 kS/s 100 ms 500 ms 1000 ms 5000 ms
(1) X-Y Plot ScreenFunction Select horizontal and vertical axes from the basic measurement items to display on the X-Y graphs.
Dots are plotted at the data update interval, and is not saved. Drawing data can be cleared.
Horizontal axis 1 data item (gauge display available)
Vertical axis 2 data items (gauge display available)
Function Each value is stored to CF card during every measurement interval.Can be controlled by timer or real-time clock
Save destinations Off, CF card (not available for USB storage) The destination folder can be specified.
Saved items Any measured values including harmonics and noise value data of the FFT function
Max. no. of saved items Interval-setting-dependent
Data format CSV file format (with read-only attribute)With functionality for switching the delimiter based on the selected file formatCSV: Comma (“,”) as measurement data delimiter and period (“.”) as decimal pointSSV: Semicolon (“;”) as measurement data delimiter and comma (“,”) as decimal point
File name Automatically generated using starting date and time, with CSV extension

10.3 Functions Specifications
190
8. Manual Saving Functions (1) Measurement DataFunction Pressing the SAVE key saves each measurement value at that moment to the save destination.
A new file is created the first time data is saved, and subsequent saves are made to that file.
Save destinations USB memory/CF cardAble to specify the folder to save.
Saving items Saved items: any measured values including harmonics and noise value data of the FFT function
Screen capture CSV file format (with read-only attribute)With functionality for switching the delimiter based on the selected file formatCSV: Comma (“,”) as measurement data delimiter and period (“.”) as decimal pointSSV: Semicolon (“;”) as measurement data delimiter and comma (“,”) as decimal point
File name Automatically created with CSV extension
(2) Screen CaptureFunction The COPY key (SHIFT+SAVE) captures and saves a bitmap image of the display to the save des-
tination
Save destinations USB memory/CF cardAble to specify the folder to save.
Data format Compressed BMP format (256-color)
File name Automatically created with BMP file name extension
Constraints Function available while auto-save operation is in progress, but auto-save operation takes prece-dence.Unavailable if interval is less than 5 s.
(3) Settings DataFunction Settings specified on the FILE screen are saved as a file on the save destination. Saved settings
files can then be reloaded to restore a previous setting configuration (except for language and com-munications settings).
Save destinations USB memory/CF cardAble to specify the folder to save.
File name Automatically created with SET file name extension
(4) Waveform DataFunction Saves the waveform being displayed by means of [Wave/Noise] display.
Save destinations USB memory/CF cardAble to specify the folder to save.
Data format CSV file format (with read-only attribute)With functionality for switching the delimiter based on the selected file formatCSV: Comma (“,”) as measurement data delimiter and period (“.”) as decimal pointSSV: Semicolon (“;”) as measurement data delimiter and comma (“,”) as decimal point
File name Automatically generated; extension: CSV
Constraints Cannot be saved while auto-save operation is in progress.
9. Synchronous Control FunctionFunction Synchronous measurements are available by using sync cables to connect one Model PW3390 as
a master and one or more as slaves.Clocks and data updates are synchronized when the slave instrument is turned on.Afterwards, resynchronization is performed at each second of the clock (disabled when the slave is started while the master is off).When internal settings match, auto-save is available while synchronized.
Synchronized items Clock, data update interval (except for FFT calculations), integration START/STOP, DATA RESET, certain events
Event items Hold, manual save, screen capture
Synchronization timing Clock, data update interval: within 10 s after power-on by a slave PW3390
START/STOP, DATA RESET, event: Upon key-press and communications operations on the master PW3390
Synchronization delay Maximum 5 μs per connection. Maximum synchronization delay of an event is +50 ms

10.3 Functions Specifications
191
1010
Chapter 10 S
pecifications
10. Bluetooth® logger connectivityFunction Sends measured values wirelessly to logger by using a Bluetooth® serial conversion adapter.
Supported devices Hioki LR8410 Link-compatible loggers (LR8410, LR8416)
Sent data Measured values assigned to the D/A CH9 to CH16 analog output parameters
11. Other functionsReal-time clock function Auto-calendar, leap-year correcting 24-hour clock
RTC accuracy ±3 s per day (25°C)
Sensor recognition Current sensors are automatically recognized when connectedSensor range and connection state are detected, and warning indicators displayed as neededExcluding the CT7000 series sensors
Warning indicators When peak over occurs on voltage and current measurement channelsWhen no sync source is detected Warning indicators for all channels are displayed on all pages of the MEAS screen.
Key-lock Toggles on/off by holding the ESC key for three seconds. A key-lock indicator is displayed when the keys are locked.
System reset Returns all settings to factory defaultsHowever, language and communications settings are unaffected.
Power-on reset Holding the SHIFT key when turning the power on returns all settings including language and com-munications settings, to factory defaults.
File operations Media content list display, format media, create folders, delete files and folders, copy between stor-age media

10.4 Setting Specifications
192
10.4 Setting Specifications
1. Input SettingsWiring modes
Synchronization source U1 to U4, I1 to I4, Ext (when channel B is set for pulse input with a model with motor analysis)DC (50 ms/100 ms) @Selectable on all wiring systems
Voltage range AUTO/1500 V/600 V/300 V/150 V/60 V/30 V/15 V
Voltage rectification method RMS/MEAN (voltage value used to calculate apparent and reactive power, and power factor)
Current range When not using the CT9920 Conversion Cable:AUTO/20 A/8 A/4 A/2 A (20 A with model 9272-05)
AUTO/20 A/8 A/4 A/2 A/0.8 A/0.4 A (with CT6841-05)AUTO/200 A/80 A/40 A/20 A/8 A/4 A (with 200 A sensor)
AUTO/2 kA/800 A/400 A/200 A/80 A/40 A (with 2000 A sensor)AUTO/5 A/2 A/1 A/0.5 A/0.2 A/0.1 A (with 5 A sensor)
AUTO/50 A/20 A/10 A/5 A/2 A/1 A (with 50 A sensor)AUTO/500 A/200 A/100 A/50 A/20 A/10 A (with 500 A sensor)AUTO/1 kA/400 A/200 A/100 A/40 A/20 A (with 1000 A sensor)
When using the CT9920 conversion cable: Depends on selected sensor output rate or sensor model.
AUTO/2 kA/800 A/400 A (with models CT7642 and CT7742)AUTO/8 kA/4 kA/2 kA/800 A/400 A (with models CT7044, CT7045, and CT7046)
AUTO/20 kA/8 kA/4 kA/2 kA/800 A/400 A (100 μV/A)AUTO/2 kA/800 A/400 A/200 A/80 A/40 A (1 mV/A)
AUTO/200 A/80 A/40 A/20 A/8 A/4 A (10 mV/A)AUTO/20 A/8 A/4 A/2 A/0.8 A/0.4 A (100 mV/A)
Current rectification method RMS/MEAN (current value used to calculate apparent and reactive power, and power factor)
VT(PT) ratio OFF/0.01 to 9999.99 (setting not available if VT×CT ratio exceeds 1.0E+06)
CT ratio OFF/0.01 to 9999.99 (setting not available if VT×CT ratio exceeds 1.0E+06)
LPF OFF, 500 Hz, 5 kHz, 100 kHz
Lower limit measurement frequency 0.5 Hz, 1 Hz, 2 Hz, 5 Hz, 10 Hz, 20 Hz
Frequency measurement Select U or I for f1, f2, f3, and f4
Integration mode RMS/DC
CH1 CH2 CH3 CH4
Pattern 1 1P2W 1P2W 1P2W 1P2W
Pattern 2 1P3W 1P2W 1P2W
Pattern 3 3P3W2M 1P2W 1P2W
Pattern 4 1P3W 1P3W
Pattern 5 3P3W2M 1P3W
Pattern 6 3P3W2M 3P3W2M
Pattern 7 3P3W3M 1P2W
Pattern 8 3P4W 1P2W
2. Current sensor phase correction settingsOperating states OFF/ON
Frequency 0.001 kHz to 999.999 kHz
Phase difference 0.00 deg. to ±90.00 deg.

10.4 Setting Specifications
193
1010
Chapter 10 S
pecifications
3. Calculation and Recording SettingsAverage OFF/FAST/MID/SLOW/SLOW2/SLOW3
Interval OFF, 50 ms, 100 ms, 200 ms, 500 ms, 1 s, 5 s, 10 s, 15 s, 30 s, 1 min, 5 min, 10 min, 15 min, 30 min, 60 min
Timer control Elapsed time/Real-time clockTimer: OFF, 10 s to 9999:59:59 [hhhh:mm:ss] (in 1 s units)Real-time clock: OFF, start and stop times (YMD-hms, in 1 min units)
Zero suppression OFF, 0.1% f.s./0.5% f.s.
Zero-crossing filter OFF, mild or strong
Auto-ranging span Wide or narrow
Efficiency calculations Three items (select from all active power values) η=100 × |Pout|/|Pin|
Loss calculations Three items (select from all active power values) Loss=|Pin| - |Pout|
Δ-Y transform OFF/ON
Calculation method TYPE1/TYPE2
4. Harmonic SettingsHarmonic U1 to U4, I1 to I4, Ext (when channel B is set for pulse input with a model with motor analysis)
DC (50 ms/100 ms) Settings common to all channels
TTHD calculation THD-F/THD-R
5. Noise Analysis SettingsMeasurement channels Select one of channels 1 to 4
Windows Rectangular, Hanning, flat-top
Lower limit noise frequency 0 kHz to 10 kHz
6. D/A Output Settings (with D/A output option model) Waveform output OFF/ON
Output items Select one basic measurement item for each output channel.Only selectable for channels 9 to 16 when waveform output is enabled [ON](Channels 1 to 8 provide waveform output only)
Full-scale frequency 100 Hz, 500 Hz, 1 kHz, 5 kHz (same as max. measurement frequency setting for motor)
Full-scale integration 1/10, 1/2, 1/1, 5, 10, 50, 100, 500, 1000, 5000, 10000 × range
7. Motor Measurement Settings (with motor evaluation model)Synchronization source U1 to U4, I1 to I4, Ext (with channel B set for pulse input), DC (50 ms/100 ms)
Common to channels A and B
CHA input Analog DC or frequency
CHA range ±1 V, ±5 V, ±10 V (for analog DC only)
Frequency range Select fc and fd for frequency range fc ± fd [Hz] (frequency measurement only)1 kHz to 98 kHz in 1 kHz units, where fc + fd <100 kHz and fc – fd >1 kHz)
CHA scaling 0.01 to 9999.99 (for analog DC only)
Rated torque 1 to 999 (frequency measurement only)
CHA unit Analog DC: V, N• m, mN• m, kN• mFrequency: Hz, N• m, mN• m, kN• m
CHB input Analog DC or pulse
CHB range ±1 V, ± 5V, ±10 V (for analog DC only)
Motor poles 2 to 98
Max. measurement frequency 100 Hz, 500 Hz, 1 kHz, 5 kHz (pulse input only) Same as full-scale D/A output frequency setting
CHB scaling 0.01 to 9999.99 (for analog DC only)
Pulse count Integer multiple of half the number of motor poles, from 1 to 60000 (pulse input only)
CHB Analog DC: V, Hz, r/min Pulse: Hz, r/min
CHZ OFF/Z-phase/B-phase (pulse input only)
Measurement frequency source f1 to f4 (for slip calculations)
LPF OFF/ON

10.4 Setting Specifications
194
8. Interface SettingsSynchronization control Master/slave
Synchronous event items HOLD, SAVE, COPY
Saving data Select the items to record (Max. number of items is limited according to the interval setting.)
Auto-save OFF/ON (CF card)
Data save destination Destination folder
Manual save destination USB memory, CF card (Specify the folder to save.)
RS-232C communications speed 9600bps/19200bps/38400bps
Adapter configuration Initialization of Bluetooth® serial conversion adapter
IP address Four 3-digit octets (0 to 255)
Subnet mask Four 3-digit octets (0 to 255)
Default gateway Four 3-digit octets (0 to 255)
9. System SettingsDisplay language JAPANESE/ENGLISH/CHINESE
Beep sound OFF/ON
Screen color schemes COLOR1/COLOR2/COLOR3/COLOR4/COLOR5
Start-up screen selection Wiring or Last-displayed screen (Measurement screens only)
LCD backlight ON/1 min/5 min/10 min/30 min/60 min
Clock setting Year, month, day, hour and minute setting, and zero-second adjustment
CSV file format CSV/SSV
System reset Reset
Model number indication Displayed
Serial number indication Displayed
Version indication Software version displayed
MAC address Displays the MAC address.

10.5 Measurement Item Details
195
1010
Chapter 10 S
pecifications
1. Basic Measurement Items
*1. DC integration mode*2. Models with motor analysis only*3. Can be changed with unit selection. No zero suppression when the frequency or pulse is set.*4. Forward, reverse and combined values should be same range, and are displayed with the number of digits available for any
maximum value*5. THD when the integration mode is RMS, and rf when the integration mode is DC,
zero indicates zero-suppression setting, and values less than zero are zero suppressedFor the P range, see 4. Power range configuration. In the Pm range, calculated by entering the rated torque as the torque and the rated RPM as the RPM in the motor powercalculation formula.Range A when CH A measures frequency at rated torque setting valueRange B when CH B measures pulses at maximum measurement frequency setting value [Hz]
10.5 Measurement Item Details
Measurement items Symbol UnitPattern 1
1P2W+1P2W+1P2W+1P2W
Pattern 2,31P3W/3P3W2M+1P2W+1P2W
Pattern 4,5,61P3W/3P3W2M+1P3W/3P3W2M
Pattern 7,83P3W3M/3P4W
+1P2WDisplay range
Polarity(+/-)
Frequency f Hz 1, 2, 3, 4 1, 2, 3, 4 1, 2, 3, 4 1, 2, 3, 4 0.5000 to 5.0000k
Voltage
RMS Urms V 1, 2, 3, 4 1, 2, 3, 4, 12 1, 2, 3, 4, 12, 34 1, 2, 3, 4, 123 U Range zero to 120%
Voltage MEAN Umn V 1, 2, 3, 4 1, 2, 3, 4, 12 1, 2, 3, 4, 12, 34 1, 2, 3, 4, 123 ↓ zero to 120%
AC component Uac V 1, 2, 3, 4 1, 2, 3, 4 1, 2, 3, 4 1, 2, 3, 4 ↓ zero to 120%
Simple average Udc V 1, 2, 3, 4 1, 2, 3, 4 1, 2, 3, 4 1, 2, 3, 4 ↓ zero to 120%
Fundamental wave component
Ufnd V 1, 2, 3, 4 1, 2, 3, 4 1, 2, 3, 4 1, 2, 3, 4 ↓ zero to 120%
Wave peak + Upk+ V 1, 2, 3, 4 1, 2, 3, 4 1, 2, 3, 4 1, 2, 3, 4 ↓ zero to 300%
Wave peak - Upk- V 1, 2, 3, 4 1, 2, 3, 4 1, 2, 3, 4 1, 2, 3, 4 ↓ zero to 300%
THD/ripple rate*5UthdUrf
% 1, 2, 3, 4 1, 2, 3, 4 1, 2, 3, 4 1, 2, 3, 4 0.00 to 500.00
Unbalance factor Uunb % 123 0.00 to 100.00
Current
RMS Irms A 1, 2, 3, 4 1, 2, 3, 4, 12 1, 2, 3, 4, 12, 34 1, 2, 3, 4, 123 I Range zero to 120%
Current MEAN Imn A 1, 2, 3, 4 1, 2, 3, 4, 12 1, 2, 3, 4, 12, 34 1, 2, 3, 4, 123 ↓ zero to 120%
AC component Iac A 1, 2, 3, 4 1, 2, 3, 4 1, 2, 3, 4 1, 2, 3, 4 ↓ zero to 120%
Simple average Idc A 1, 2, 3, 4 1, 2, 3, 4 1, 2, 3, 4 1, 2, 3, 4 ↓ zero to 120%
Fundamental wave component
Ifnd A 1, 2, 3, 4 1, 2, 3, 4 1, 2, 3, 4 1, 2, 3, 4 ↓ zero to 120%
Wave peak+ Ipk+ A 1, 2, 3, 4 1, 2, 3, 4 1, 2, 3, 4 1, 2, 3, 4 ↓ zero to 300%
Wave peak- Ipk- A 1, 2, 3, 4 1, 2, 3, 4 1, 2, 3, 4 1, 2, 3, 4 ↓ zero to 300%
THD/ripple rate*5IthdIrf
% 1, 2, 3, 4 1, 2, 3, 4 1, 2, 3, 4 1, 2, 3, 4 0.00 to 500.00
Unbalance factor Iunb % 123 0.00 to 100.00
Effective power P W 1, 2, 3, 4 1, 2, 3, 4, 12 1, 2, 3, 4, 12, 34 1, 2, 3, 4, 123 P Range zero to 120%
Apparent power S VA 1, 2, 3, 4 1, 2, 3, 4, 12 1, 2, 3, 4, 12, 34 1, 2, 3, 4, 123 ↓ zero to 120%
Reactive power Q var 1, 2, 3, 4 1, 2, 3, 4, 12 1, 2, 3, 4, 12, 34 1, 2, 3, 4, 123 ↓ zero to 120%
Power factor λ 1, 2, 3, 4 1, 2, 3, 4, 12 1, 2, 3, 4, 12, 34 1, 2, 3, 4, 123 0.0000 to 1.0000
Phase angle
Voltage phase angle θU ° 1, 2, 3, 4 1, 2, 3, 4 1, 2, 3, 4 1, 2, 3, 4 0.00 to180.00
Current phase angle θI ° 1, 2, 3, 4 1, 2, 3, 4 1, 2, 3, 4 1, 2, 3, 4 0.00 to180.00
Power phase angle φ ° 1, 2, 3, 4 1, 2, 3, 4, 12 1, 2, 3, 4, 12, 34 1, 2, 3, 4, 123 0.00 to 180.00
Integration
Integ. current in positive direction*1
Ih+ Ah 1, 2, 3, 4 3, 4 4 I Range zero to 1% to *4
Integ. current in negative direction*1
Ih- Ah 1, 2, 3, 4 3, 4 4 ↓ zero to 1% to *4
Sum of integ. current
Ih Ah 1, 2, 3, 4 1, 2, 3, 4 1, 2, 3, 4 1, 2, 3, 4 ↓ zero to 1% to *4
Energy in positive direction
WP+ Wh 1, 2, 3, 4 3, 4, 12 12, 34 4, 123 P Range zero to 1% to *4
Energy in negative direction
WP- Wh 1, 2, 3, 4 3, 4, 12 12, 34 4, 123 ↓ zero to 1% to *4
Sum of energy WP Wh 1, 2, 3, 4 3, 4, 12 12, 34 4, 123 ↓ zero to 1% to *4
Efficiency η % 1, 2, 3 1, 2, 3 1, 2, 3 1, 2, 3 0.00 to 200.00
Loss Loss W 1, 2, 3 1, 2, 3 1, 2, 3 1, 2, 3 P Range zero to 120%
Motor*2
Torque CH A *3 − − − − A Range zero to 120%
Rotation speed CH B *3 − − − − B Range zero to 120%
Motor power Pm W − − − − Pm Range zero to 120%
Slip Slip % − − − − 0.00 to 100.00

10.5 Measurement Item Details
196
2. Harmonic Measurement Items
3.Noise Measurement Items
4.Power Range Configurations(1) With 20 A sensors
Active power (P) units are [W], apparent power (S) units are [VA], and reactive power (Q) units are [VAR]Multiply the range configurations in this table by a factor of 10 when using a 200 A sensor, by a factor of 100 when using a2 kA sensor, or by a factor of 1000 when using a 20 kA sensor.
Measurement items Symbol UnitPattern 1
1P2W+1P2W+1P2W+1P2W
Pattern 2,31P3W/3P3W2M+1P2W+1P2W
Pattern 4,5,61P3W/3P3W2M+1P3W/3P3W2M
Pattern 7,83P3W3M/3P4W
+1P2WDisplay range
Polarity(+/-)
Harmonic voltage Uk V 1, 2, 3, 4 1, 2, 3, 4 1, 2, 3, 4 1, 2, 3, 4 U Range 0 to 120%
Harmonic voltage phase angle
θUk ° 1, 2, 3, 4 1, 2, 3, 4 1, 2, 3, 4 1, 2, 3, 4 0.00 to 180.00
Harmonic current Ik A 1, 2, 3, 4 1, 2, 3, 4 1, 2, 3, 4 1, 2, 3, 4 I Range 0 to 120%
Harmonic current phase angle θIk ° 1, 2, 3, 4 1, 2, 3, 4 1, 2, 3, 4 1, 2, 3, 4 0.00 to 180.00
Harmonic active power Pk W 1, 2, 3, 4 1, 2, 3, 4, 12 1, 2, 3, 4, 12, 34 1, 2, 3, 4, 123 P Range 0 to 120%
Phase difference of harmonic voltage and harmonic current
θk ° 1, 2, 3, 4 1, 2, 3, 4, 12 1, 2, 3, 4, 12, 34 1, 2, 3, 4, 123 0.00 to 180.00
Harmonic voltage content HDUk % 1, 2, 3, 4 1, 2, 3, 4 1, 2, 3, 4 1, 2, 3, 4 0.00 to 500.00
Harmonic current content HDIk % 1, 2, 3, 4 1, 2, 3, 4 1, 2, 3, 4 1, 2, 3, 4 0.00 to 500.00
Harmonic power content HDPk % 1, 2, 3, 4 1, 2, 3, 4, 12 1, 2, 3, 4, 12, 34 1, 2, 3, 4, 123 0.00 to 500.00
Measurement items Symbol Unit Display range
Voltage noiseUNf Hz 0 to Maximum frequency setting
Ten measurements in descending order of UNUN V 0 to 120% of U range
Current noiseINf Hz 0 to Maximum frequency setting
Ten measurements in descending order of ININ A 0 to 120% of I range
Current/Phase (Wiring) System/Voltage
15.000 V 30.000 V 60.000 V 150.00 V 300.00 V 600.00 V 1.5000 kV
1P2W 6.0000 12.000 24.000 60.000 120.00 240.00 600.00
1P3W3P3W(2M/3M)
12.000 24.000 48.000 120.00 240.00 480.00 1.2000k
3P4W 18.000 36.000 72.000 180.00 360.00 720.00 1.8000k
1P2W 12.000 24.000 48.000 120.00 240.00 480.00 1.2000k
1P3W3P3W(2M/3M)
24.000 48.000 96.00 240.00 480.00 0.9600k 2.4000k
3P4W 36.000 72.000 144.00 360.00 720.00 1.4400k 3.6000k
1P2W 30.000 60.000 120.00 300.00 600.00 1.2000k 3.0000k
1P3W3P3W(2M/3M)
60.000 120.00 240.00 600.00 1.2000k 2.4000k 6.0000k
3P4W 90.00 180.00 360.00 0.9000k 1.8000k 3.6000k 9.000k
1P2W 60.000 120.00 240.00 600.00 1.2000k 2.4000k 6.0000k
1P3W3P3W(2M/3M)
120.00 240.00 480.00 1.2000k 2.4000k 4.8000k 12.000k
3P4W 180.00 360.00 720.00 1.8000k 3.6000k 7.2000k 18.000k
1P2W 120.00 240.00 480.00 1.2000k 2.4000k 4.8000k 12.000k
1P3W3P3W(2M/3M)
240.00 480.00 0.9600k 2.4000k 4.8000k 9.600k 24.000k
3P4W 360.00 720.00 1.4400k 3.6000k 7.2000k 14.400k 36.000k
1P2W 300.00 600.00 1.2000k 3.0000k 6.0000k 12.000k 30.000k
1P3W3P3W(2M/3M)
600.00 1.2000k 2.4000k 6.0000k 12.000k 24.000k 60.000k
3P4W 0.9000k 1.8000k 3.6000k 9.000k 18.000k 36.000k 90.00k
400
.00
mA
80
0.0
0 m
A2
.00
00
A4
.00
00
A8.
000
0 A
20
.00
0 A

10.5 Measurement Item Details
197
1010
Chapter 10 S
pecifications
(2) With 50 A sensors
Active power (P) units are [W], apparent power (S) units are [VA], and reactive power (Q) units are [VAR] Multiply the range configurations in this table by a factor of 1/10 when using a 5 A sensor or by a factor of 10 when using a500 A sensor.
(3) With 1000 A sensors
Active power (P) units are [W], apparent power (S) units are [VA], and reactive power (Q) units are [VAR]
Current/Phase (Wiring) System/Voltage
15.000 V 30.000 V 60.000 V 150.00 V 300.00 V 600.00 V 1.5000 kV
1P2W 15.000 30.000 60.000 150.00 300.00 600.00 1.5000k
1P3W3P3W(2M/3M)
30.000 60.000 120.00 300.00 600.00 1.2000k 3.0000k
3P4W 45.000 90.00 180.00 450.00 0.9000k 1.8000k 4.5000k
1P2W 30.000 60.000 120.00 300.00 600.00 1.2000k 3.0000k
1P3W3P3W(2M/3M)
60.000 120.00 240.00 600.00 1.2000k 2.4000k 6.0000k
3P4W 90.00 180.00 360.00 0.9000k 1.8000k 3.6000k 9.000k
1P2W 75.000 150.00 300.00 750.00 1.5000k 3.0000k 7.5000k
1P3W3P3W(2M/3M)
150.00 300.00 600.00 1.5000k 3.0000k 6.0000k 15.000k
3P4W 225.00 450.00 0.9000k 2.2500k 4.5000k 9.000k 22.500k
1P2W 150.00 300.00 600.00 1.5000k 3.0000k 6.0000k 15.000k
1P3W3P3W(2M/3M)
300.00 600.00 1.2000k 3.0000k 6.0000k 12.000k 30.000k
3P4W 450.00 0.9000k 1.8000k 4.5000k 9.000k 18.000k 45.000k
1P2W 300.00 600.00 1.2000k 3.0000k 6.0000k 12.000k 30.000k
1P3W3P3W(2M/3M)
600.00 1.2000k 2.4000k 6.0000k 12.000k 24.000k 60.000k
3P4W 0.9000k 1.8000k 3.6000k 9.000k 18.000k 36.000k 90.00k
1P2W 750.00 1.5000k 3.0000k 7.5000k 15.000k 30.000k 75.000k
1P3W3P3W(2M/3M)
1.5000k 3.0000k 6.0000k 15.000k 30.000k 60.000k 150.00k
3P4W 2.2500k 4.5000k 9.000k 22.500k 45.000k 90.00k 225.00k
1.0
00
0 A
2.0
000
A5.
000
0 A
10
.00
0 A
20.
000
A50
.00
0 A
Current/Phase (Wiring) System/Voltage
15.000 V 30.000 V 60.000 V 150.00 V 300.00 V 600.00 V 1.5000 kV
20.
000
A
1P2W 300.00 600.00 1.2000k 3.0000k 6.0000k 12.000k 30.000k
1P3W3P3W (2M/3M)
600.00 1.2000k 2.4000k 6.0000k 12.000k 24.000k 60.000k
3P4W 0.9000k 1.8000k 3.6000k 9.000k 18.000k 36.000k 90.00k
40
.00
0 A
1P2W 600.00 1.2000k 2.4000k 6.0000k 12.000k 24.000k 60.000k
1P3W3P3W (2M/3M)
1.2000k 2.4000k 4.8000k 12.000k 24.000k 48.000k 120.00k
3P4W 1.8000k 3.6000k 7.2000k 18.000k 36.000k 72.000k 180.00k
10
0.0
0 A
1P2W 1.5000k 3.0000k 6.0000k 15.000k 30.000k 60.000k 150.00k
1P3W3P3W (2M/3M)
3.0000k 6.0000k 12.000k 30.000k 60.000k 120.00k 300.00k
3P4W 4.5000k 9.000k 18.000k 45.000k 90.00k 180.00k 450.00k
200
.00
A
1P2W 3.0000k 6.0000k 12.000k 30.000k 60.000k 120.00k 300.00k
1P3W3P3W (2M/3M)
6.0000k 12.000k 24.000k 60.000k 120.00k 240.00k 600.00k
3P4W 9.000k 18.000k 36.000k 90.00k 180.00k 360.00k 0.9000M
40
0.0
0 A
1P2W 6.0000k 12.000k 24.000k 60.000k 120.00k 240.00k 600.00k
1P3W3P3W (2M/3M)
12.000k 24.000k 48.000k 120.00k 240.00k 480.00k 1.2000M
3P4W 18.000k 36.000k 72.000k 180.00k 360.00k 720.00k 1.8000M
1.0
000
kA 1P2W 15.000k 30.000k 60.000k 150.00k 300.00k 600.00k 1.5000M
1P3W3P3W (2M/3M)
30.000k 60.000k 120.00k 300.00k 600.00k 1.2000M 3.0000M
3P4W 45.000k 90.00k 180.00k 450.00k 0.9000M 2.4000M 4.5000M

10.6 Calculation Formula Specifications
198
1. Calculation Formulas for Basic Measurement Items
(i) : Measurement channelM : Number of synchronous sampless : Sample (data point) number
10.6 Calculation Formula Specifications
1P2W 1P3W 3P3W2M 3P3W3M 3P4W
Voltage RMS
Voltage MEAN
Voltage AC component
Voltage simple average
Voltage fundamental wave
componentHarmonic voltage U1(i) for harmonic calculation formulas
Peak voltage
THD Voltage Percentage
Uthd(i) in harmonic calculation formulas
Voltage ripple rate
Voltage unbalance factor
− − −
Items
Phase System
Urms i( )1M----- U i( )s( )2
S 0=
M 1–
∑=
Urms1212--- Urms1 Urms2+( )=
Urms3412--- Urms3 Urms4+( )=
Urms12313--- Urms1 Urms2 Urms3+ +( )=
Umn i( )π
2 2---------- 1
M----- U i( )s
S 0=
M 1–
∑=Umn12
12--- Umn1 Umn2+( )=
Umn3412--- Umn3 Umn4+( )=
Umn12313--- Umn1 Umn2 Umn3+ +( )=
Uac i( ) Urms i( )( )2 Udc i( )( )2–=
Udc i( ) 1M----- U i( )s
s 0=
M 1–
∑=
Maximum M value pk sU (i) U(i)+ =
Minimum M value pk sU (i) U(i)− =
( )100
(2 ( ) )pk pk
dc
U (i) U (i)U i
+ − −×
×
Uunb1231 3 6β––1 3 6β–+----------------------------- 100×=
βU12
4 U234 U31
4+ +
U122 U23
2 U312+ +( )
2-------------------------------------------------=
U12, U23, and U31 are fundamental rms volt-ages (between lines) obtained from harmonic calculations. For 3P4W systems, voltage bal-ance is detected from phase voltage, but is converted to voltage between lines for calcu-lations.

10.6 Calculation Formula Specifications
199
1010
Chapter 10 S
pecifications
(i) : Measurement channelM : Number of synchronous sampless : Sample (data point) number
1P2W 1P3W 3P3W2M 3P3W3M 3P4W
Current RMS
Current MEAN
Current AC component
Current simple average
Current fundamental wave
componentHarmonic current I1(i) in harmonic calculation formulas
Peak current
THD Current Percentage
Ithd(i) in harmonic calculation formulas
Current ripple rate
Current unbalance factor
− − −
Items
Phase System
Irms i( )1M----- I i( )s( )2
S 0=
M 1–
∑=Irms12
12--- Irms1 Irms2+( )=
Irms3412--- Irms3 Irms4+( )=
Irms12313--- Irms1 Irms2 Irms3+ +( )=
Imn i( )π
2 2---------- 1
M----- I i( )s
S 0=
M 1–
∑=Imn12
12--- Imn1 Imn2+( )=
Imn3412--- Imn3 Imn4+( )=
Imn12313--- Imn1 Imn2 Imn3+ +( )=
Iac i( ) Irms i( )( )2 Idc i( )( )2–=
Idc i( )1M----- I i( )s
s 0=
M 1–
∑=
Maximum M value pk sI (i) I(i)+ =
Minimum M value pk sI (i) I(i)− =
( )100
(2 ( ) )pk pk
dc
I (i) I (i)I i
+ − −×
×
Iunb1231 3 6β––1 3 6β–+----------------------------- 100×=
βI12
4 I234 I31
4+ +
I122 I23
2 I312+ +( )
2------------------------------------------=
I12, I23, and I31 are fundamental rms currents (between lines) obtain from harmonic calcu-lations. For 3P3W3M and 3P4W systems, these are converted to current between lines for calculations.

10.6 Calculation Formula Specifications
200
(i) : Measurement channelM : Number of synchronous sampless : Sample (data point) number
1P2W 1P3W 3P3W2M 3P3W3M 3P4W
Active power
• For 3P3W3M and 3P4W systems, phase voltage is used for waveform voltage U(i)s.(3P3W3M:U1s=(U1s-U3s)/3, U2s=(U2s-U1s)/3, U3s=(U3s-U2s)/3)
• The polarity sign for active power indicates power flow direction: positive (+P) for forward power (consumption), and nega-tive (-P) for reverse power (regeneration), and indicates net current flow for power.
Apparent power
When calculation method TYPE1 is selected
When calculation method TYPE2 is selected
• Select U(i) and i(i) from rms/mn.
• Use phase voltage for voltage U(i) during 3P3W3M and 3P4W wirings for calculation method TYPE1.
Reactive power
When calculation method TYPE1 is selected
When calculation method TYPE2 is selected
• The polarity sign (si) for reactive power (Q) is indicated by [no sign] for lag or [–] for lead.
• The polarity sign (si(i)) for each channel (i) is acquired from lag or lead of the voltage waveform U(i)s and current wave-form I(i)s. Use phase voltage for voltage waveform U(i)s during 3P3W3M and 3P4W wirings for calculation method TYPE1.(3P3W3M:U1s=(U1s-U3s)/3, U2s=(U2s-U1s)/3, U3s=(U3s-U2s)/3)
• Use calculation method TYPE2's S123 for S123 under 3P3W3M wiring for calculation method TYPE2, and obtain thepolarity sign si123 from the sign for Q123 of calculation method TYPE1.
Power factor
• The polarity (si) for power factor (λ) is indicated by [no sign] for lag or [–] for lead.
• The polarity sign (si(i)) for each channel (i) is acquired from lag or lead of the voltage waveform U(i)s and current waveformI(i)s. Polarities si12, si34, and si123 are acquired from reactive power values Q12, Q34, and Q123, respectively.
Power phase angle
• The polarity sign (si(i)) for each channel (i) is acquired from lag or lead of the voltage waveform U(i)s and current wave-
form I(i)s. Polarities si12, si34, and si123 are acquired from reactive power values Q12, Q34, and Q123, respectively.
• In the formula, cos-1|λ| is used when P ≥0. When P <0, |180 - cos-1|λ|| is used.
Items
Phase System
P i( )1M----- U i( )s I i( )s×( )
s 0=
M 1–
∑=P12 P1 P2+=
P34 P3 P4+=P123 P1 P2 P3+ +=
S i( ) U i( ) I i( )×=
S12 S1 S2+=
S34 S3 S4+=
S123
2------- S1 S2+( )=
S343
2------- S3 S4+( )=
S123 S1 S2 S3+ +=
S1233
3------- U1 I1 U2 I3 U3 I2×+×+×( )=
S123 S1 S2 S3+ +=
Q i( ) si i( ) S i( )2 P i( )
2–=Q12 Q1 Q2+=
Q34 Q3 Q4+=
Q123 Q1 Q2 Q3+ +=
Q123 Si123 S1232
P1232
–=
Q123 Q1 Q2 Q3+ +=
λ i( ) si i( )P i( )
S i( )--------=
λ12 si12P12
S12--------=
λ34 si34P34
S34--------=
λ123 si123P123
S123----------=
φ i( ) si i( ) λ i( )1–cos=
φ12 si12 λ121–cos=
φ34 si34 λ341–cos=
φ123 si123 λ1231–cos=

10.6 Calculation Formula Specifications
201
1010
Chapter 10 S
pecifications
2. Motor analysis measurement items calculation formulasItems Setting Units Calculation Formulas
CH A
V (DC Voltage)
N• m, mN• m, or kN• m common to all mea-surements (torque)
For Analog DC A [V] × CH A scaling setting
For Frequency
M :Number of synchronous samples, S :Sample (data point) number
CH B
V (DC Voltage)
Hz (Frequency)
For Analog DC B [V] × CH B scaling setting
Pulse input
r/min (rotation rate)
For Analog DC B [V] × CH B scaling setting
Pulse input
Pm
N• m (CH A units)
mN• m (CH A units)
kN• m (CH A units)
Calculation is disabled when CH A units are not those specified above, and when CH B units are set to other than r/min.
Slip
Hz (CH B units)
r/min (CH B units)
Select an input frequency (f1 to f4)
1M----- As
s 0=
M 1–
∑
(Measurement freq. – fc setting value) × rated torque setting value)
fd setting value
1M----- Bs
s 0=
M 1–
∑
set no. of poles × pulse frequency
2 × set no. of pulses*1
si
Polarity sign si is obtained from the rise/fall edge and logic level (High/Low) of A Phase pulse and B Phase pulse.
2 × 60 × frequency [Hz] (calculated from above Pulse Input value *1)
set no. of poles
2 × π ×(CH B display value)
60(CH A display value) ×
2 × π ×(CH B display value)
60 × 1000(CH A display value) ×
2 × π ×(CH B display value)× 1000
60(CH A display value) ×
Input frequency - |CH B display value|
Input frequency100 ×
2 × 60 × Input frequency - |CH B display value|× set no. of poles
2 × 60 × Input frequency100 ×

10.6 Calculation Formula Specifications
202
3. Harmonic Measurement Calculation Formulas
(i) : Measurement channelk : Order of analysisr : Real part of complex result of FFTi : Imaginary part of complex result of FFT
Harmonic voltage phase angle and harmonic current phase angle are corrected to the fundamental waveform of the harmonic sync source that serves as a phase reference point of 0° (except when an external harmonic sync source is used).
1P2W 1P3W 3P3W2M 3P3W3M 3P4W
Harmonic voltage
Harmonic voltage
Phase angle
Harmonic current
Harmonic current
Phase angle
Harmonic effective power
Same as 1P2W
−
Harmonic reactive power
(only used internally)
Same as 1P2W
−
Harmonic voltage
Current phase angle −
Items
Phase System
Uk i( ) Ukr i( )( )2 Uki i( )( )2+=
θUk i( )Ukr i( )
Uki i( )–----------------⎝ ⎠⎛ ⎞
1–tan=
Ik i( ) Ikr i( )( )2 Iki i( )( )2+=
θIk i( )Ikr i( )
Iki i( )–--------------⎝ ⎠⎛ ⎞
1–tan=
Pk i( ) Ukr i( ) Ikr i( ) Uki i( ) Iki i( )×+×=
Pk113--- Ukr1 Ukr3–( ) Ikr1
13---+× Uki1 Uki3–( ) Iki1×=
Pk213--- Ukr2 Ukr1–( ) Ikr2
13---+× Uki2 Uki1–( ) Iki2×=
Pk313--- Ukr3 Ukr2–( ) Ikr3
13---+× Uki3 Uki2–( ) Iki3×=
Pk4 Ukr4 Ikr4 Uki4 Iki4×+×=
Pk12 Pk1 Pk2+=
Pk34 Pk3 Pk4+=Pk123 Pk1 Pk2 Pk3+ +=
Qk i( ) Ukr i( ) Iki i( ) Uki i( ) Ikr i( )×–×=
Qk113--- Ukr1 Ukr3–( ) Iki1
13---–× Uki1 Uki3–( ) Ikr1×=
Qk213--- Ukr2 Ukr1–( ) Iki2
13---–× Uki2 Uki1–( ) Ikr2×=
Qk313--- Ukr3 Ukr2–( ) Iki3
13---–× Uki3 Uki2–( ) Ikr3×=
Qk4 Ukr4 Iki4 Uki4 Ikr4×–×=
Qk12 Qk1 Qk2+=
Qk34 Qk3 Qk4+=Qk123 Qk1 Qk2 Qk3+ +=
θk i( ) θIk i( ) θUk i( )–=
θk12Qk12
Pk12-----------⎝ ⎠⎛ ⎞
1–tan=
θk34Qk34
Pk34-----------⎝ ⎠⎛ ⎞
1–tan=
θk123Qk123
Pk123--------------⎝ ⎠⎛ ⎞
1–tan=

10.6 Calculation Formula Specifications
203
1010
Chapter 10 S
pecifications
(i) : Measurement channelk : Order of analysisK : Maximum analysis order (depending on sync frequency)
1P2W 1P3W 3P3W2M 3P3W3M 3P4W
Harmonic voltage content
Harmonic current content
Harmonic power content
THD Voltage Percentage
THD Current Percentage
Items
Phase System
Uhdk i( )Uk
U1------ 100×=
Ihdk i( )Ik
I1---- 100×=
Phdk i( )Pk
P1------ 100×=
Uthd i( )
Uk( )2
k 2=
K
∑
U1----------------------------- 100×= (with THD-F setting), or (with THD-R setting)
Uk( )2
k 2=
K
∑
Uk( )2
k 1=
K
∑
----------------------------- 100×
Ithd i( )
Ik( )2
k 2=
K
∑
I1--------------------------- 100×= (with THD-F setting), or (with THD-R setting)
Ik( )2
k 2=
K
∑
Ik( )2
k 1=
K
∑
--------------------------- 100×
I
III, IV
II
-90°
+90°
0°
+180°
0°
Ukr i( )
Uki i( )–----------------⎝ ⎠⎛ ⎞
1–tan 180°+
Ukr i( )
Uki i( )–----------------⎝ ⎠⎛ ⎞
1–tan
Ukr i( )
Uki i( )–----------------⎝ ⎠⎛ ⎞
1–tan 180°–
Uki i( ) 0 Ukr i( ) 0<,=
Uki i( ) 0 Ukr i( ) 0>,=
Uki i( ) 0 Ukr i( ),< 0=
Uki i( ) 0 Ukr i( ),> 0=
Uki i( ) 0 Ukr i( ), 0= =
Phase reference
Image

10.6 Calculation Formula Specifications
204
4. Noise measurement parameter calculation formulas
r : Post-FFT real parti : Post-FFT imaginary part
Items Calculation Formulas
Voltage noise
Current noise
Un Ukr( )2 Uki( )2+=
In Ikr( )2 Iki( )2+=

10.7 Wiring System Diagram Specifications
205
1010
Chapter 10 S
pecifications
Single Phase 2-wire (1P2W)
Single Phase 3-wire (1P3W)
3-Phase 3-Wire 2-Measurement (3P3W2M)
10.7 Wiring System Diagram Specifications
Each channels
CH1/CH3CH2/CH4
CH1/CH3CH2/CH4

10.7 Wiring System Diagram Specifications
206
3-Phase 3-Wire 3-Measurement (3P3W3M)
3-Phase 4-Wire (3P4W)
CH1CH2CH3
CH1CH2CH3

11.1 Cleaning
207C
hapter 11 Maintenance and S
ervice
11
Before requesting instrument repair or inspection, please read "Before returning for repair" (p. 208) andSection "11.3 Error Indication" (p. 210).
Inspection and repair
Transporting the instrumentPack the instrument so that it will not sustain damage during shipping, and include a description of exist-ing damage. We do not take any responsibility for damage incurred during shipping.
Maintenance and Service Chapter 11
11.1 Cleaning
• To clean the instrument, wipe it gently with a soft cloth moistened with water or milddetergent. Never use solvents such as benzene, alcohol, acetone, ether, ketones,thinners or gasoline, as they can deform and discolor the case.
• Wipe the LCD gently with a soft, dry cloth.
11.2 Trouble Shooting
Touching any of the high-voltage points inside the instrument is very dangerous.Do not attempt to modify, disassemble or repair the instrument; as fire, electricshock and injury could result.
If the protective functions of the instrument are damaged, either remove it from serviceor mark it clearly so that others do not use it inadvertently. The instrument contains abuilt-in backup lithium battery, which offers a service life of about ten years. If the dateand time deviate substantially when the instrument is switched on, it is the time toreplace that battery. Contact your authorized Hioki distributor or reseller.
• If damage is suspected, check the "Before returning for repair" (p. 208) sectionbefore contacting your authorized Hioki distributor or reseller.However, in the following cases, immediately stop using the instrument, unplug thepower cord and contact your authorized Hioki distributor or reseller.• When the nature of the damage is clearly evident
• When measurement is impossible
• After long-term storage in adverse conditions such as high temperature or humidity
• After being subject to severe shock during transport
• After severe exposure to water, oil, or dust (internal insulation can be degraded byoil or water, causing increase hazard of electric shock or fire)
• If measurement settings cannot be saved, contact Hioki for repair.

11.2 Trouble Shooting
208
Replaceable parts and useful lifeCertain parts require replacement periodically and at the end of their useful life: (Useful life depends onthe operating environment and frequency of use. Operation cannot be guaranteed beyond the followingperiods)
Before returning for repair
Part Useful Life Remarks
Electrolytic Capacitors
Approx. 10 yearsThe useful life of electrolytic capacitors depends on the operating envi-ronment. The board(s) on which these components are mounted must be replaced.
Lithium battery Approx. 10 years
The instrument contains a built-in backup lithium battery, which offers a service life of about ten years. If the date and time deviate substantially when the instrument is switched on, or backup error is returned in self-test, it is the time to replace that battery. Contact your authorized Hioki distributor or reseller.
Fan motor Approx. 6 years Assuming 24 hours of use per day
LCD backlight (to half brightness) Approx. 8 years Assuming 24 hours of use per day
Symptom Check Item, or Cause Remedy and Reference
The display does not appear when you turn the power on.
Is the power cord unplugged? Is it properly connected?
Confirm that the power cord is properly con-nected.See "3.4 Connecting the Power Cord" (p. 29)
Keys do not work. Are the keys locked?Hold for three seconds to disable the key-lock function.
The MENU key is lit, but the screen is blank
The LCD backlight is set to turn off after a speci-fied interval.
Press any key.See "LCD back light" (p. 118)
Voltage or current measurement values are not displayed
Are the voltage measurement and current sensor cables connected properly?
Check connections and wiring.See "3.6 Connecting the Voltage Measure-
ment Cables" (p. 30), "3.12 Verifying Correct Wiring (Connection Check)" (p. 43)
Is the proper input channel displayed (e.g., when measuring input on CH1, is the [CH1] page dis-played)?
Press to change the input channel page.See "4.2 Viewing Power Measurements,
and Changing the Measurement Con-figuration" (p. 49)
Effective power is not displayed.
Are the settings for voltage range/current range, and zero-suppression correct?
Set appropriate values for voltage range/current range. When the input is too small in relation to the range, set the zero-suppression to 0.1% or OFF.See "4.2.2 Selecting Ranges" (p. 51)See "Chapter 6 Changing System Set-
tings" (p. 117)
Frequency mea-surement is impos-sible, measured values are unstable
Is the input frequency within the range 0.5 Hz to 5 kHz?
Verify the input frequency using the noise measurement function.See "4.6 Viewing Noise Measurement Val-
ues (FFT Function)" (p. 83)
Is the input frequency below the lower limit set-ting?
Set the lower limit frequency for measure-ment.See "4.2.4 Frequency Measurement Set-
tings" (p. 58)
Is the sync source input correct?Is the range of the sync source input too high?
Check the sync source settings.See "4.2.3 Selecting the Sync Source" (p. 56),
"4.2.2 Selecting Ranges" (p. 51)
Is the measurement target a largely distorted waveform such as PWM?
Set the zero-crossing filter to "Strong".See 4.2.3 "Setting the Zero-Crossing Fil-
ter" (p. 57)
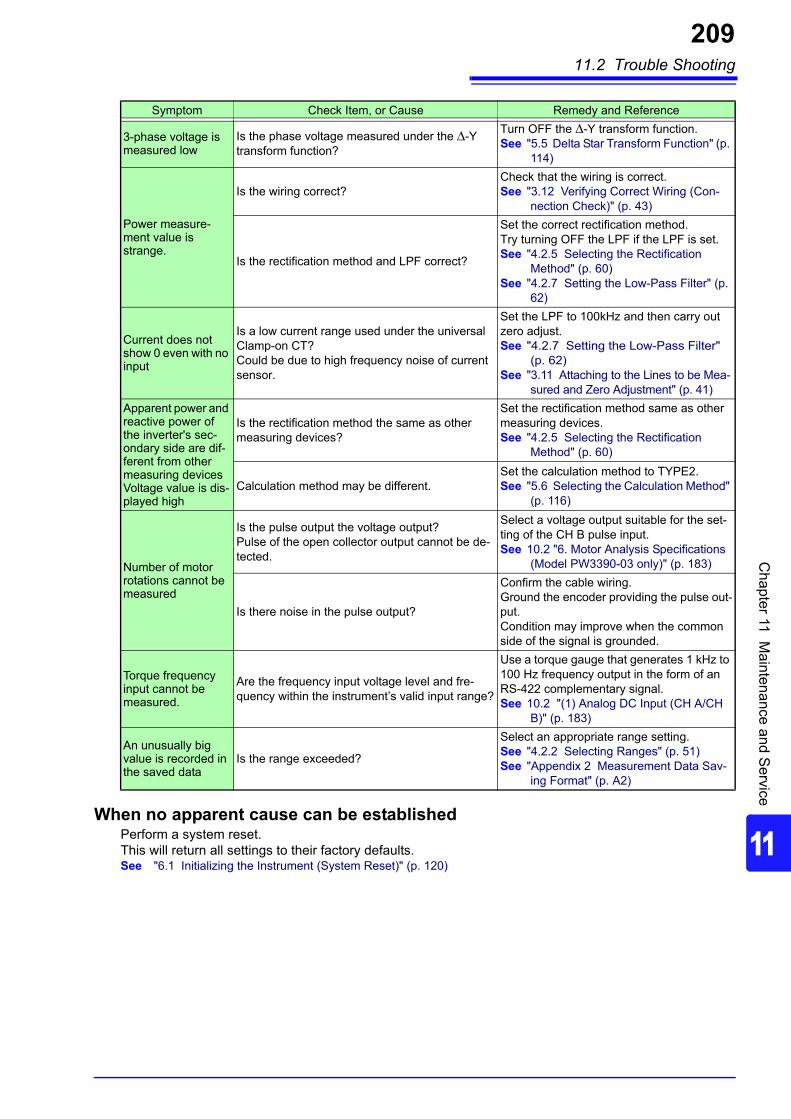
11.2 Trouble Shooting
209C
hapter 11 Maintenance and S
ervice
11
When no apparent cause can be establishedPerform a system reset.This will return all settings to their factory defaults.See "6.1 Initializing the Instrument (System Reset)" (p. 120)
3-phase voltage is measured low
Is the phase voltage measured under the Δ-Y transform function?
Turn OFF the Δ-Y transform function. See "5.5 Delta Star Transform Function" (p.
114)
Power measure-ment value is strange.
Is the wiring correct?Check that the wiring is correct.See "3.12 Verifying Correct Wiring (Con-
nection Check)" (p. 43)
Is the rectification method and LPF correct?
Set the correct rectification method.Try turning OFF the LPF if the LPF is set.See "4.2.5 Selecting the Rectification
Method" (p. 60)See "4.2.7 Setting the Low-Pass Filter" (p.
62)
Current does not show 0 even with no input
Is a low current range used under the universal Clamp-on CT?Could be due to high frequency noise of current sensor.
Set the LPF to 100kHz and then carry out zero adjust.See "4.2.7 Setting the Low-Pass Filter"
(p. 62)See "3.11 Attaching to the Lines to be Mea-
sured and Zero Adjustment" (p. 41)
Apparent power and reactive power of the inverter's sec-ondary side are dif-ferent from other measuring devicesVoltage value is dis-played high
Is the rectification method the same as other measuring devices?
Set the rectification method same as other measuring devices.See "4.2.5 Selecting the Rectification
Method" (p. 60)
Calculation method may be different.Set the calculation method to TYPE2.See "5.6 Selecting the Calculation Method"
(p. 116)
Number of motor rotations cannot be measured
Is the pulse output the voltage output?Pulse of the open collector output cannot be de-tected.
Select a voltage output suitable for the set-ting of the CH B pulse input. See 10.2 "6. Motor Analysis Specifications
(Model PW3390-03 only)" (p. 183)
Is there noise in the pulse output?
Confirm the cable wiring.Ground the encoder providing the pulse out-put.Condition may improve when the common side of the signal is grounded.
Torque frequency input cannot be measured.
Are the frequency input voltage level and fre-quency within the instrument’s valid input range?
Use a torque gauge that generates 1 kHz to 100 Hz frequency output in the form of an RS-422 complementary signal. See 10.2 "(1) Analog DC Input (CH A/CH
B)" (p. 183)
An unusually big value is recorded in the saved data
Is the range exceeded?
Select an appropriate range setting.See "4.2.2 Selecting Ranges" (p. 51)See "Appendix 2 Measurement Data Sav-
ing Format" (p. A2)
Symptom Check Item, or Cause Remedy and Reference

11.3 Error Indication
210
An error indicator appears when an error occurs. Refer to the corresponding countermeasure for each
case. Press to clear the error indicator.
11.3 Error Indication
Error display Cause Remedy
FPGA initializing error FPGA boot error.
Repair is required.Contact your authorized Hioki distributor or reseller.
Sub CPU initializing error. Sub CPU boot error.
DRAM error. DRAM error.
SRAM error. SRAM error.
Invalid FLASH SUM. Firmware checksum error.
Invalid Adjustment SUM. Adjusted value checksum error.
Invalid Backuped values. Backed up system variable invalid.
Sub CPU DRAM error. Sub CPU DRAM error.
Integrating.Attempted to change settings while inte-grating. Stop integration, and change the setting after
resetting the integration value.See "4.3 Integration Value Observation" (p. 63)Waiting or halting for integra-
tion.Attempted to change settings while await-ing (or stopping) integration.
Holding. Attempted to change settings during Data Hold.
Change the setting after canceling Data or Peak Hold.See "5.3 Data Hold and Peak Hold Functions"
(p. 110)Peak holding. Attempted to change settings during Peak Hold.
This operation is effective in [MEAS] tab only.
Attempted to start/stop integration or sav-ing, perform data reset, or activate Data or Peak Hold from the Setting or File Operation screen.
Change to the Measurement screen, and try again.
Failed to load the program. Firmware update file not found, or bad checksum.
The firmware update file may be corrupted. Obtain another copy of the file, and try again.
Cannot change wiring.Different current sensors are in same system.
Wiring mode selection is inhibited by incorrect sensor combination.
Check current sensor connections.See "3.9 Selecting the Wiring Mode" (p. 34)
Some CH could not be changed in one lump.
Channel setting changes inhibited in the [All Ch] batch setting.
Select the current range, VT ratio, CT ratio and integration mode for each channel.
Cannot change the VT value.VT × CT exceeds the full scale (1.0E+06).
Attempted VT ratio setting would cause over-range VT× CT value. Set values that do not exceed the VT× CT limit
(1.0E+06).See "4.2.6 Setting Scaling (when using
VT(PT) or CT)" (p. 61)Cannot change the CT value.VT × CT exceeds the full scale (1.0E+06).
Attempted CT ratio setting would cause over-range VT× CT value.
Cannot add any recording item.Exceeding the maximum number of recording items.
Too many items selected for recording within the selected interval setting.
Set a longer interval.See "5.1 Timing Control Functions" (p. 105)Cannot change the output
orders.Exceeding the maximum number of orders.
Harmonic orders selected for output (including highest and lowest order set-tings) would produce too many items.
Cannot change the interval.Too many recording items are selected. Reduce the items to change interval.
Attempted to set the interval too short for the currently selected recording items.
Select fewer recording items.See "7.5.3 Selecting Measurement Items to
Save" (p. 134)

11.3 Error Indication
211C
hapter 11 Maintenance and S
ervice
11
Cannot change the lowest noise frequency.Change the noise sampling speed.
Attempted to set the minimum noise fre-quency at or above the maximum fre-quency (determined by the noise sampling rate).
Increase the noise sampling rate setting, or set the minimum noise frequency setting below the maximum frequency.See "4.6.2 Setting the Sampling Frequency
and Points" (p. 85)"4.6.3 Setting the Minimum Noise Fre-quency" (p. 86)
Cannot change the noise sampling speed.Change the lowest noise fre-quency.
Attempted to set the maximum frequency (determined by the noise sampling rate) below the minimum noise frequency.
Decrease the minimum noise frequency set-ting.See "4.6.3 Setting the Minimum Noise Fre-
quency" (p. 86)
Cannot change the setting under slave mode.
Attempted to set the clock, timer or clock control settings with Slave mode enabled.
Clock, timer, and clock start/stop settings can-not be changed while Slave mode is enabled.See "8.1 Connecting Multiple PW3390 (Syn-
chronized Measurements)" (p. 145)
Cannot change the setting in 3-phase measurement.
Attempted to select DC integration on a non-1P2W channel.
DC integration is only available with 1P2W wir-ing systems with an AC/DC current sensor connected. See "4.3.2 Setting the Integration Mode" (p. 66)
Cannot set DC when AC sen-sor is connected.
Attempted to select DC integration on a channel with an AC current sensor.
Not enough free capacity in CF card. Not enough space on CF card.
Delete unneeded files, or replace storage media (new CF card must be formatted).Not enough free capacity in
USB memory stick. Not enough space on USB drive.
Cannot create a file or folder.Too many files or folders in root.
Possibly too many file or folders in the root folder.
Delete unneeded files and folders, or specify another folder as the file copy destination.See "7.4 Saving Operations" (p. 128)
"7.10 File and Folder Operations" (p. 140)
CF card is not inserted.Press the ENTER key to reload.
CF card not found. Check that a CF card or USB drive is inserted.If so, press the ENTER key to reload.See "7.1 Inserting and Removing Storage
Media" (p. 124)USB memory stick is not con-nected. Press the ENTER key to reload.
USB drive not found.
invalid character is used in the folder name.
Attempted an operation with folder name contains an invalid character, entered by computer or malfunction.
Try again from the computer.
invalid character is used in the file name.
Attempted an operation with file name contains an invalid character, entered by computer or malfunction.
Skip copying file named with the invalid character.
A file name within the folder contains an invalid character.
File(s) not copied.Perform the copy operation from the computer.
Failed to access to the folder. Cannot access non-existent folder. -
Failed to access to the file. Cannot access non-existent file. -
Cannot create a file name automaticaly.
Automatic file name creation stopped.
Specify a different destination folder, or create a new folder for saving, or delete unneeded files, or replace storage media (new CF card must be formatted).See "7.10 File and Folder Operations" (p.
140)
Skip copying file named with the invalid character.
Attempted to open a computer-created folder that is not within the root folder. Try again from the computer.
Skip copying folder not under the root folder.
During folder copy, attempted to copy a folder containing another folder.
File(s) not copied.Perform the copy operation from the computer.
Cannot create a folder not under the root folder.
Attempted to create a folder not in the root folder.
Create a folder directly in the root folder.See "7.10.1 Creating Folders" (p. 140)
Error display Cause Remedy

11.3 Error Indication
212
Cannot copy a folder not under the root folder.
Attempted to copy a folder within a non-root folder.
Try again from the computer.Cannot delete a folder not under the root folder.
Attempted to delete a non-root folder.
Cannot delete a folder having another folder.
Attempted to delete a folder containing another folder.
Skip copying a file having invalid character and folder not under the root folder.
During folder copy, attempted to copy a file or folder with an invalid name.
File or folder not copied.Perform the copy operation from the computer.
Input the name. No file or folder name has been specified.Enter a file or folder name.See "Chapter 7 Data Saving and File Opera-
tions" (p. 123)
Invalid setteing file.
"Load Setting File" attempted without a valid setting configuration file selected (wrong file type, or corrupted or incompat-ible content).
Select a valid setting configuration file.Settings cannot be loaded unless instrument options and save settings are the same as when saved.See "7.9 Reloading Setting Configurations"
(p. 139)
Cannot find the firmware update file in the root.
Attempted firmware update without an update file.
Copy the update file to the root folder of the storage media, and try again.
Cannot find either CF card or USB memory stick.
CF card or USB drive not found when copying files and folders.
Confirm that the storage media is inserted.See "7.1 Inserting and Removing Storage
Media" (p. 124)
Cannot copy the folder.Same file name already exists.
When copying a folder, a duplicate file name was found on the destination.
Select a different name for the file or folder.See "7.10.4 Renaming Files and Folders" (p.
144)
Cannot delete the file having invalid character file name in this folder.
Attempted to delete a folder containing a file with an invalid character in its name, entered by computer or malfunction.
Try again from the computer.
Cannot copy the file.Same folder name already exists.
The name of a file to be copied or created as a setting configuration file duplicates an existing folder name.
Select a different name for the file or folder.See "7.10.4 Renaming Files and Folders" (p.
144)
Copy after changing the folder name.Same folder name already exists.
The name of a folder to be copied dupli-cates an existing folder name in the root folder of the storage media.
Select a different folder name.See "7.10.4 Renaming Files and Folders" (p.
144)
CF card is not ready.Failed to save. Cannot save because CF card not found.
Check that a CF card or USB drive is inserted.See "7.1 Inserting and Removing Storage
Media" (p. 124)USB memory stick is not ready.Failed to save.
Cannot save because USB drive not found.
Cannot move to [FILE] TAB during auto saving.
Attempted to open the File Operation screen during auto-saving.
The File Operation screen cannot be opened during auto-saving. Wait until auto-saving is finished.
Cannot execute during auto saving.
Attempted manual saving and waveform saving during auto-saving.
Manual saving and waveform saving are not available during auto-saving.Wait until auto-saving is finished.
Screenshots are not avail-able due to automatic save operation when the interval is 1 s or less.
Attempted to save a screen capture while auto-save operation with an interval of 1 s or less is being used.
Save the screen capture after auto-save oper-ation is complete. To use this feature while auto-save operation is in progress, set the interval to at least 5 s.
Failed to copy.Or, there is a file cannot be copied.
A problem occurred while copying. Try again from the computer.
Error display Cause Remedy

11.3 Error Indication
213C
hapter 11 Maintenance and S
ervice
11
Contact your authorized Hioki distributor or reseller, if a repair should become necessary.
Different sensors! Cannot change the wiring in the set-ting file.
Attempted to load an incompatible setting configuration file.
Settings cannot be loaded unless instrument options and saved items are the same as those installed and selected when saved.See "7.9 Reloading Setting Configurations"
(p. 139)
D/A output function is differ-ent.
Attempted to load an incompatible setting configuration file.
Motor analyzing function is different.
Attempted to load an incompatible setting configuration file.
Inconsistent items to saveAttempted to load an incompatible setting configuration file.
CF card error!This card is not supprted.
Incompatible CF card found.Use a Hioki CF card option.See "Chapter 7 Data Saving and File Opera-
tions" (p. 123)
USB memory stick error!This memory stick is not sup-prted.
Incompatible CF card found.Use a Hioki CF card option.See "Chapter 7 Data Saving and File Opera-
tions" (p. 123)
Failed to write. Writing to storage media failed.Try again.
Failed to read. Reading from storage media failed.
Failed to save while calculat-ing the waveform data
Attempted to save a waveform while it is being created.
Try again after the waveform is created (when the timer mark disappears).
Failed to create a file. File creation failed for unknown reason.Try again.
Failed to create a folder. Folder creation failed for unknown reason.
Synchronized signals cannot be detected.
Synchronized signals cannot be detected from the master when setting the slave.
Confirm that the master is connected with syn-chronized cable and that the master is turned ON.See "8.1 Connecting Multiple PW3390 (Syn-
chronized Measurements)" (p. 145)When not using the synchronization function, set the synchronization control setting to [Mas-ter].
Unknown error! An unknown error has occurred.Clear this error by pressing any key except
or once. If the error recurs, contact your
authorized Hioki distributor or reseller.
Error display Cause Remedy
If the measurement lines are energized when the instrument is turned on, the instru-ment may be damaged or an error message may appear, so before energizing thelines, turn the instrument on and confirm that no error message is displayed.

11.4 Disposing of the Instrument
214
When disposing of this instrument, remove the lithium battery and dispose of battery and instrument inaccordance with local regulations.Dispose the other options appropriately.
11.4 Disposing of the Instrument
• To avoid electric shock, turn off the power switch and disconnect the powercord and measurement cables before removing the lithium battery.
• Battery may explode if mistreated. Do not short-circuit, recharge, disassembleor dispose of in fire.
• Keep batteries away from children to prevent accidental swallowing.
Tools required: One No. 2 Phillips screw-driver, tweezers
1. Turn the instrument's power switch off.
2. Disconnect the power cord and all cables.
3. Remove the six Phillips head screws in therear cover, and remove the cover by sliding itback.
4. Remove the six Phillips head screws aroundthe front panel, and remove the panel.
5. Insert the tweezers between the battery andits holder on the internal board, and lift thebattery to remove it.
CALIFORNIA, USA ONLYThis product contains a CR Coin Lithium Batterywhich contains Perchlorate Material - special han-dling may apply.See www.dtsc.ca.gov/hazardouswaste/perchlorate
Lithium Battery Removal

Appendix 1 Block Diagram
A1Appendix
Appendix
Appendix 1 Block Diagram
Voltage Input Circuit High-Speed Power Analysis Engine
USB Port(Storage)
Current Sensor Input Circuit
9-inch WVGALCD
Key
CF Card
Motor Analysis Input Circuit (Option)
Channel A Input Circuit
Channel B Input Circuit
USB Port (Remote Con-
trol Functions)
Sync Control
D/A Output Circuit (Option)
Range
Isolation
Range
Isolation
Isolation
Range
Zero-Crossing Detection
Zero-Crossing Detection
Range
Zero-Crossing Detection
CHZ Input circuit
Ω
Ω
Ω
Ω
Ω
Ω
Ω
Ω
Ω
Ω

Appendix 2 Measurement Data Saving Format
A2
Header StructureHeaders (item names saved at the head of the file) when measurement data is saved by manual or auto-saving are as follows.• Selected items are output in order from the top of the table, and from left to right.• Measurement data is output after the last line of the header, in the same sequence as the header.• The first three items (Data, Time, and Status) are always output regardless of selected items.
Appendix 2 Measurement Data Saving Format
Output Item Header Item and Alignment
Year, Month, and Day Date
Time Time
Status Status
Elapsed Time Laptime
Elapsed Time (ms) Laptime (ms)
Voltage
RMS Urms1 to Urms4 Urms12 Urms34 Urms123
Voltage MEAN Umn1 to Umn4 Umn12 Umn34 Umn123
AC component Uac1 to Uac4
Simple average Udc1 to Udc4
Fundamental wave component
Ufnd1 to Ufnd4
wave peak + PUpk1 to PUpk4
wave peak - MUpk1 to MUpk4
THD/ripple rate Uthd1 to Uthd4/Urf1 to Urf4
Unbalance factor Uunb123
Current
RMS Irms1 to Irms4 Irms12 Irms34 Irms123
Current MEAN Imn1 to Imn4 Imn12 Imn34 Imn123
AC component Iac1 to Iac4
Simple average Idc1 to Idc4
Fundamental wave component
Ifnd1 to Ifnd4
wave peak + PIpk1 to PIpk4
wave peak - MIpk1 to MIpk4
THD/ripple rate Ithd1 to Ithd4/Irf1 to Irf4
Unbalance factor Iunb123
Effective power P1 to P4 P12 P34 P123
Apparent power S1 to S4 S12 S34 S123
Reactive power Q1 to Q4 Q12 Q34 Q123
Power factor PF1 to PF4 PF12 PF34 PF123
Phase angle DEG1 to DEG4 DEG12 DEG34 DEG123
Frequency FREQ1 to FREQ4
Integra-tion
Integ. current in positive di-rection
PIH1 to PIH4
Integ. current in negative direction
MIH1 to MIH4
Sum of integ. Current IH1 to IH4
Energy in positive direction PWP1 to PWP4 PWP12 PWP34 PWP123
Energy in negative direction
MWP1 to MWP4 MWP12 MWP34 MWP123
Sum of energy WP1 to WP4 WP12 WP34 WP123
Efficiency Eff1 to Eff3
Loss Loss1 to Loss3
Motor ExtA ExtB Pm Slip

Appendix 2 Measurement Data Saving Format
A3Appendix
Harmonic Measurement Items
Harmonic Frequency HFREQ
(n=0)
nth order voltage
Level HU1Ln
(n: order)
Content HU1Dn
Phase angle HU1Pn
... to
Level HU4Ln
Content HU4Dn
Phase angle HU4Pn
nth order current
Level HI1Ln
Content HI1Dn
Phase angle HI1Pn
... to
Level HI4Ln
Content HI4Dn
Phase angle HI4Pn
nth order power
Level HP1Ln
Content HP1Dn
Phase angle HP1Pn
... to
Level HP4Ln
Content HP4Dn
Phase angle HP4Pn
Level HP12Ln
Content HP12Dn
Phase angle HP12Pn
Level HP34Ln
Content HP34Dn
Phase angle HP34Pn
Level HP123Ln
Content HP123Dn
Phase angle HP123Pn
(n=1 to 100) ... ... ... (n: order)
Noise Measurement Items
NoiseVoltage UNf01 UN01 to UNf10 UN10
Current INf01 IN01 to INf10 IN10

Appendix 2 Measurement Data Saving Format
A4
About Status DataThe status data indicates the measurement state when the data was saved, and is displayed as a 32-bithexadecimal digit, as follows.
HMx : Invalid harmonic parameter (no harmonic sync)MRx : Motor analysis options A and/or B over rangeMPx : Motor analysis options A and/or B peak overULM : Motor analysis options A and/or B sync unlockedUDP: Display impossible (for example, when the measurement data is clearly invalid immediately after the range ischanged)UCU : Calculation Impossible (e.g., measurement data is invalid immediately after changing ranges)HUL : Harmonic sync unlockedULx : Channel x sync unlockedRIx : Channel x current over rangeRUx : Channel x voltage over rangePIx : Channel x current peak overPUx : Channel x voltage peak over(x is a channel number)
Measurement Value Data Format
bit 31 bit 30 bit 29 bit 28 bit 27 bit 26 bit 25 bit 24
HM4 HM3 HM2 HM1 MRB MRA MPB MPA
bit 23 bit 22 bit 21 bit 20 bit 19 bit 18 bit 17 bit 16
ULM UDP UCU HUL UL4 UL3 UL2 UL1
bit 15 bit 14 bit 13 bit 12 bit 11 bit 10 bit 9 bit 8
RI4 RI3 RI2 RI1 RU4 RU3 RU2 RU1
bit 7 bit 6 bit 5 bit 4 bit 3 bit 2 bit 1 bit 0
PI4 PI3 PI2 PI1 PU4 PU3 PU2 PU1
General Measurement Values
± E±6-digit decimal mantissa and 2-digit exponent ("+" sign and leading zero are omitted for mantissa.)
Integration Value± E±7-digit decimal mantissa and 2-digit exponent ("+" sign and leading zero are omitted for mantissa.)
Time
YYYY/MM/DD / /HH:MM:SS : : Elapsed Time : :Elapsed Time (ms)
Error state Input out of range +9999.9E+99

Appendix 3 Physical Illustration
A5Appendix
Appendix 3 Physical Illustration
156±2340±2
(380.5)
(Unit: mm)
170±
2(228
.5)
(10)

Appendix 4 Rack Mounting
A6
The illustrated rack mounting brackets are available. For more information, contact your authorized Hiokidistributor or reseller.
Appendix 4 Rack Mounting
Rear ViewFront View

Index iInde
A
Active Power ...............................49, 63, 66, 72, 74All CH Set ...........................................................18Analog DC ...................................................97, 100Phase Zero Adjustment ....................................103Analog output ............................................155, 156Apparent Power ............................................49, 60Auto display update settings .............................171AUTO range ........................................................51Auto-Saving ..............................................131, 132Averaging ..........................................................109
B
Before Connecting ..............................................10Block Diagram .................................................... A1Bluetooth ...........................................................160
C
Calculation Formula Specifications ...........198, 205CF card .....................................................123, 124CH A ...................................................................97
input ................................................................97range ...............................................................98scaling .............................................................98unit ..................................................................99
CH B .................................................................100input ..............................................................100range .............................................................100scaling ...........................................................100unit ................................................................100
CH Z ..................................................................162Cleaning ............................................................207Clock .....................................69, 71, 110, 112, 119Clock control .................................................65, 71Color .................................................................118Connection Check ...............................................43Content .........................................................73, 74Conversion cable ................................................31CSV file format ..................................................119CT .......................................................................61Current sensor
Connecting ......................................................30Labels .............................................................26Options ..............................................................3Setting .............................................................38
D
D/A output ........................................................ 154Output examples .......................................... 158
Data format ...................................................... 123Data Hold ......................................................... 147Data Saving ...................................................... 128DC
100 ms ............................................... 56, 77, 9650 ms ................................................. 56, 77, 96
DC Integration Mode .......................................... 66Dedicated application program ........................ 165Default Gateway ............................................... 167Delta-star transfer function ............................... 114Display Contents (Harmonic) ............................. 74Displayed Item ................................................... 74Displayed item (Harmonic) ................................. 73Disposing ......................................................... 214Distortion ratios ................................................ 108
E
Easy set ............................................................. 42Efficiency ...................................................... 89, 90Electrical Angle ........................................ 102, 103Error Indication ................................................. 210Ethernet
connection .................................................... 169Interface ....................................................... 168LAN cable ............................................. 168, 169
Ext .......................................... 56, 77, 96, 102, 103External controlling ........................................... 149External signal as the sync source ..................... 77
F
Factory Default Settings ................................... 121FAST ................................................................ 108File ..................... 23, 123, 126, 140, 141, 143, 144FILE key ............................................................. 16Flat-Top .............................................................. 88Folder ....................................... 140, 141, 142, 143Formatting ........................................................ 127Freq range fc ...................................................... 99Frequency Measurement Source ....................... 58Full-scale frequency ................................. 155, 193Full-scale integration ........................................ 155Fundamental Current Content ............................ 50Fundamental Voltage Content ........................... 50
Index
x

Index ii
索引
Fundamental wave component ........................ 195
G
Grounding .......................................................... 29
H
Handle ................................................................ 15Hann ................................................................... 88Harmonic Bar Graph .......................................... 72Harmonic List ..................................................... 74Harmonic Sync Source ...................... 77, 102, 103Harmonic Vectors ............................................... 75Header Structure ................................................ A2Hiding and Displaying Waveforms ..................... 81Highest Displayed Order .................................... 74Highest order .................................................... 135HOLD ................................................................. 19Hold .................................................................. 110Horizontal Axis Magnification (Waveform) ......... 82HTTP server ..................................................... 170
I
Incremental rotary encoder .............................. 163Index averaging ................................................ 108Initializing ......................................................... 120Input Cable Labels ............................................... 2Input Frequency Source ..................................... 96Inspection ......................................................... 207Instantaneous values ............................... 110, 156Integration Value ................................ 63, 187, 188Interface ............................................................. 19Internal fixed clock ............................................. 77Interval ....................................... 68, 105, 132, 134Interval timing control ....................................... 105IP address ........................................................ 167Items to save .................................................... 134
K
Key-Lock ............................................................ 19
L
Labels ................................................................. 26LAN Interface ........................................... 166, 185Language ......................................................... 118LCD back light .................................................. 118Linear ................................................................. 73Log ............................................................... 73, 83Loss ........................................................ 89, 90, 89LOW FREQ key ................................................. 58Lower measurement limit ....................... 20, 58, 59Lowest order .................................................... 135Low-pass filter .............................................. 20, 62
Motor .............................................................. 96
M
Main page ......................................................... 170Manual Integration ........................................ 67, 68MANUAL range ............................................ 51, 52Manual Save ............................ 123, 126, 128, 129Master .............................................................. 145Max frequency (Motor) ..................................... 100Maximum recordable items .............................. 134MEAN ................................................................. 60MEAS key ........................................................... 16Measured Items for Display ................................ 46Measurement Ch (Noise analysis) ..................... 88Measurement Channel (Harmonic) .................... 75Measurement Configuration ............................... 49Measurement Screen ......................................... 20MID ................................................................... 108Minimum Noise Frequency ................................. 86Motor
Poles ............................................................ 100Sync source .................................................... 96Zero adjustment ............................................. 95
Motor Power ................................... 89, 94, 99, 162
N
No. of pulses .................................................... 100Noise .................................................................. 83Noise sampling ................................................... 87
O
Output Level ..................................................... 157Output order ..................................................... 135
P
Peak Hold ........................................... 19, 111, 112Peak Over .......................................................... 48PHASE ADJ ..................................................... 103Phase angle ..................................................... 158Phase correction ................................................ 39Physical Illustration .............................................A5Pm ........................................................ 94, 99, 100Points ..................................................... 82, 86, 88Power Factor ................................................ 49, 63Power-On Reset ............................................... 120PT ....................................................................... 61Pulse count ....................................................... 102
R
Rated torque ................................................. 98, 99Reactive Power ............................................ 49, 60Real time .................... 71, 107, 121, 187, 191, 193

Index iiiIndex
Realtime ................................14, 63, 64, 67, 69, 70Real-Time Clock ...............................................132Real-time clock timing control ...........................105Rectangular .........................................................88Rectification Method ...........................................60Remaining available recording time ..................131Repair ...............................................................207Replaceable parts and useful life ......................208Resetting Integration ...........................................64Response time ..................................................108RF .......................................................................66Ripple factor ........................................................66RMS ....................................................................60RMS Integration Mode ........................................66Rotation rate ...............................................94, 100rotation rate .........................................................94Rotation Signal Input .........................................100RS-232C
Connection ....................................................165Interface ........................................................173
RTC clock .........................................................147RUN mark ...........................................................19
S
Sampling Frequency .....................................66, 85Saving Operations ............................................128Saving Screen Capture Images ........................136Scale of the vertical axis .....................................73Scaling ................................................................61Self test ...............................................................28Settings file ...............................................137, 139SHIFT key ...........................................................16Slave .................................................................145Slip ................................................................94, 97SLOW ...............................................................108Specifications ....................................................192Start page .........................................................119START/STOP key ...............................................16Starting, Stopping, and Resetting Integration .....64STOP mark .........................................................19Subnet mask .....................................................167Sync cable ........................................................146Sync event ........................................................147Sync Source ..................................................56, 77Sync Unlock ........................................................57Synchronized Measurement .............................145SYSTEM .............................................................22SYSTEM key .......................................................16System reset .............................................120, 209
T
THD .....................................................................78THD Voltage Percentage ..............................50, 78THD-F .................................................................78
THD-R ................................................................ 78Timer .......................................................... 70, 132Timer timing control .......................................... 105Timing Control Functions ................. 105, 106, 112Timing control functions
Interval timing control ................................... 105Real-time clock timing control ...................... 105Timer timing control ...................................... 105
Torque .......................................................... 94, 97Torque meter ................................................ 163
U
Unbalance ratios .............................................. 108Upgrade ........................................................... 127USB
Connection ................................................... 165flash drive ............................................. 123, 124Interface ....................................................... 172
Uunb ................................................................... 50
V
Vector ............................................. 43, 52, 75, 114VT(PT) ................................................................ 61
W
Warm-up ............................................................ 41Wave + Noise ....................................... 53, 79, 136Waveform ........................................... 86, 183, 187Waveform display ....................................... 77, 112Waveform outputs ............................................ 155Waveform saving ............................................. 136Window Function ................................................ 88Wiring Mode ....................................................... 34
X
X-Y graphs ....................................................... 113X-Y Plot ............................................................ 113
Z
Zero Adjustment ........................... 41, 95, 103, 183Motor .............................................................. 95
Zero suppress .................................................. 119Zero-Crossing Filter ........................................... 57
Symbol
φ ....................................................................... 157η ................................................................ 89, 157θ ...................................................................... 195

Index iv
索
引


