pw: portfolio watcher. key features works with redi+, esignal, thinkorswim & obsidian handles...
Post on 21-Dec-2015
220 views
TRANSCRIPT

PW: Portfolio Watcher

Key Features
Works with REDI+, eSignal, ThinkOrSwim & Obsidian
Handles pairs, mergers and single stocks
Batch-import pairs, add one by one, import from another PW
Built-in accounting to track trades
Portfolio statistics based on entered trades
Visual and audio spread-price alerts (Buy, Sell, Stop)
Visual indicators
Spreadhistory & External Data connectivityAutoIT, Dividends page, Settings page

PW: Compatibility
Expand DDE-links Columns

DDE Links

PW: Easy pair management
Expand Pair-Information Columns

PW: Easy pair management
1) Color-coded:
Green color means that a column/cell may be edited
Gray cells represent system columns
3) Options for importing pairs & layers into PW
2) Fill out these columns to batch-import pairs and click “Create Sheets”
4) Add pairs one by one
5) Select one or more pairs to delete

PW: Fast accounting
Double-click on a pair-name to go to Accounting sheet for that pair

How to add a new layer:1)Click [Add Layer] button2)Layer number and today’s date & time recorded automatically3)Fill out entry prices for each stock & double-check quantitiesDone. New layer will now be reflected on the main PW sheet
PW: Adding a layer

How to take a layer off:1)Fill out exit prices for each stock & double-check quantities2)Enter “d” into Exit Date cell. This “d” will be automatically replace with Date/Time3)Delete or adjust the layer number to close or move this layer
PW: Taking off a layer

PW: Staying informed
Zoom-in on the portfolio dashboard

PW: Portfolio Stats

PW: Stats per pair
Expand PW Stats Columns

PW: Stats per pair

PW: Don’t miss a trade
If you enter ‘m’ into the alert cell, the following alert message will be displayed once a target is reached
Color alerts are enabled by default

Alerts: Voice & Message box
If you enter ‘vm’ or ‘mv’ into the alert cell, a voice alert will sound and this message alert will be displayed once the target is reached
If your Excel supports text-to-speech, you can enter ‘v’ into the Alert field for voice alerts

PW: Visual indicators
Expand Grid Columns

PW: Visual indicators
Visual indicators for LEAD stock:
E: EarningsD: Ex-DividendY: 52-wk Hi/LoT: Today’s Hi/Lo
Same indicators for Second stock
Grid – visual representation of a price in a range.
Range can be set manually or calculated based on intra-day Hi/Lo of the spread-price

PW: Keeping track of Hi&Lo
Expand Grid-Timer Columns

Grid timer
Timer-based Hi/Lo calculator

External Data: Spreadhistory
Expand Spreadhistory Columns
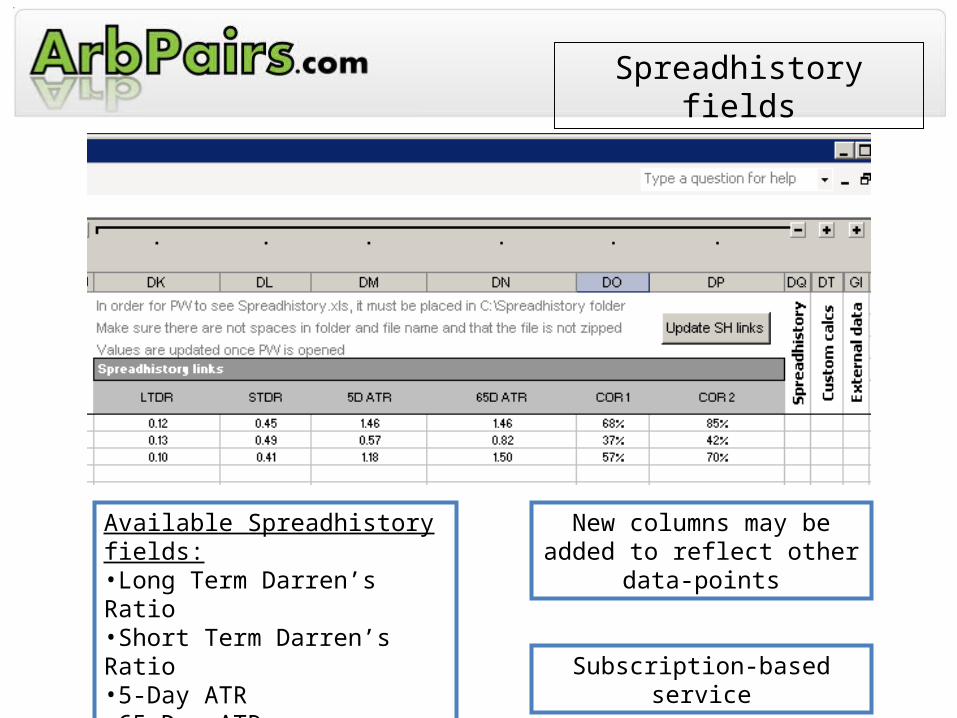
Spreadhistory fields
Available Spreadhistory fields:•Long Term Darren’s Ratio•Short Term Darren’s Ratio•5-Day ATR•65-Day ATR•Correlation 1 & 2
New columns may be added to reflect other data-points
Subscription-based service

External Data from ArbPairs.com
Expand External Data Columns

External Data: available sections
Subscription-based service

ArbPairs.com data
Select rows under a green cell and click “Get data..”
Data is calculated on the server and brought into PW on demand

ArbPairs.com data
Indicates how many days are included in a calculation
Pivot Point, Support & Resistance levels as well as Open, Hi, Lo, Close & Range for previous day

ArbPairs.com data
Over 60 data-points of fundamental & statistical data
New columns may be added to collect more data
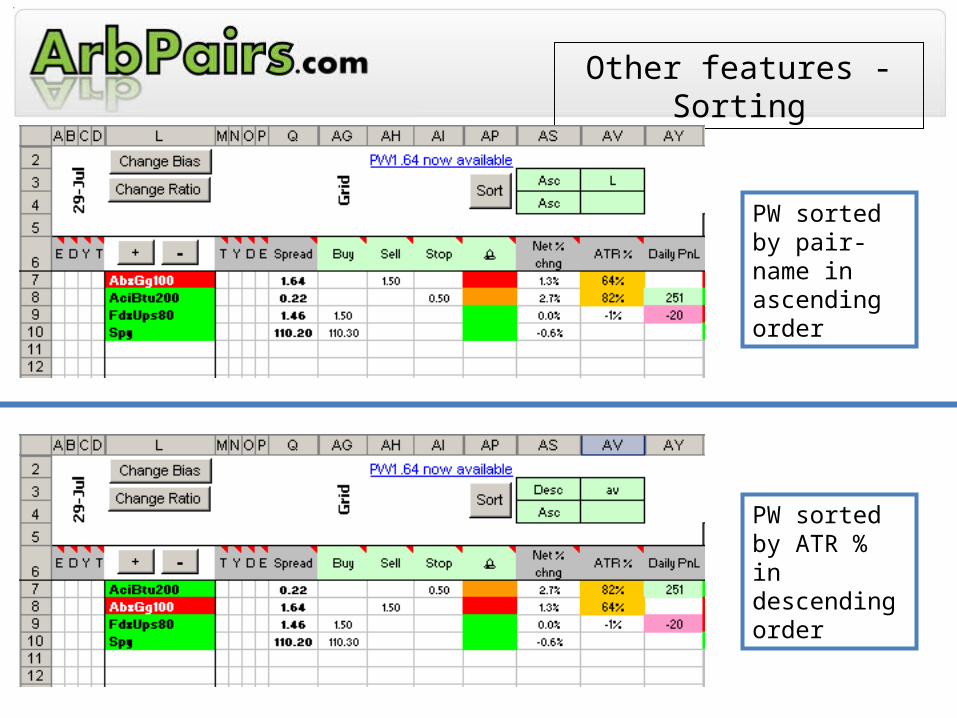
Other features - Sorting
PW sorted by pair-name in ascending order
PW sorted by ATR % in descending order

Other features
Update notifications
Handy ratio calculator on the Settings Sheet

PW: Other features
•Run more the one instance of PW on each computer
•Not resource-intensive
•Highly customizable interface & accounting book:
Insert new columns with custom formulas
Modify accounting template
•VBA code is not locked and is accessible for custom macros
•AutoIT is integrated:
Link to eSignal charts
Link to REDI+ montages

Dividend plays
Div-plays is another subsection of PW

PW: Dividend-play finder

PWA: Automated Portfolio Watcher
Pair Automation

PWA: Key features
Auto-trade pairs or single stocks:•Paper-trade or real-trade modes•Alert-based (unattended) or manual execution•Automatic re-arming for next trade based on ATR•Automatic book-keeping (layers are added and taken off automatically)•Business rules for pairs & stocks•Illegal sell prevention, stale capital locator, correct share amt checker•Stop & Go-With options, trade log, easy upgrades, advanced statistics

PWA: Business Rules

Thank you for your attention
Feel free to contact me for any questions or additional info:
Yahoo messenger & Skype: aetchein
Emails: [email protected] or [email protected]