pvg a sset managementpvgassetmanagement.com/pdf/global_macro_marketing_deck.pdfinvestment objective...
TRANSCRIPT
P V G A S S E T M A N A G E M E N T
L O S S AV E R S E I N V E S T I N G
W W W . P V G A S S E T M A N A G E M E N T . C O M
GLOBAL MACRO STRATEGY

The hypothetical chart below shows how PVG establishes different hedging techniques depending on the
current market cycle. During peaks of the market, PVG will become more cautious and take a market
neutral approach to protect assets during sustained or unforeseen market pullbacks. At the bottom of the
cycle PVG will become more of a long/short as we find a bottom in the market. As momentum in the
market picks up, the strategy will become more like a long only strategy.
PVG has coined the phrase, “Loss Averse Investing” to best describe the approach of preserving capital
during negative markets. Our belief is that by capturing the least amount of downside helps apply an
investment stance that operates with far less overall risk, yet captures greater returns over the long term
market cycle.
The major risk to portfolios is the systemic risk or market risk, and there are times that the systematic risk
of owning either stocks or bonds or both must be taken out of the portfolio.
There are managers who control portfolios that can replace traditional asset classes or sub-categories that
do not have the same systemic or market risk as traditional managers. These management firms specialize
in managing stocks, bonds, or a combination of both in a tactical manner, which reduce or eliminate the
systemic risk, and can also be known as, absolute return managers.
MARKET CYCLE OVERVIEW
2
CURRENT PORTFOLIO RISK SPECTRUM
Risk Averse
Risk Seeking
As of 12/31/2016
Current Risk
Market Neutral Market Neutral
Mar
ket
Val
ue
vs. P
VG
Val
ue
Time
Long/Short
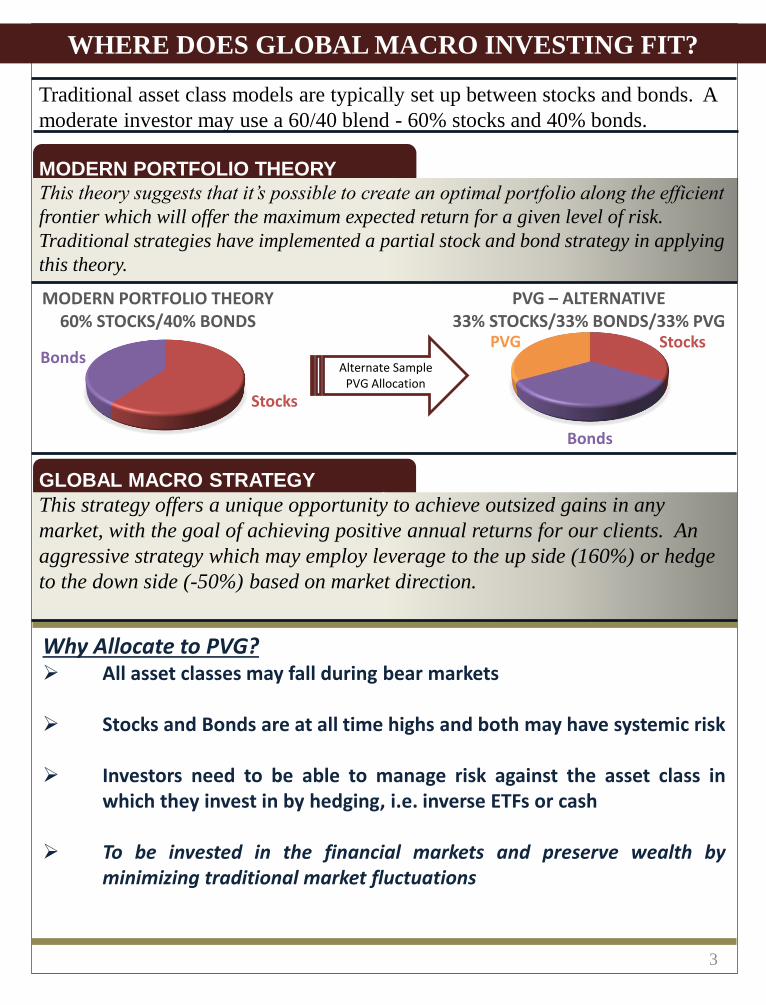
Traditional asset class models are typically set up between stocks and bonds. A
moderate investor may use a 60/40 blend - 60% stocks and 40% bonds.
MODERN PORTFOLIO THEORY
This theory suggests that it’s possible to create an optimal portfolio along the efficient
frontier which will offer the maximum expected return for a given level of risk.
Traditional strategies have implemented a partial stock and bond strategy in applying
this theory.
GLOBAL MACRO STRATEGY
This strategy offers a unique opportunity to achieve outsized gains in any
market, with the goal of achieving positive annual returns for our clients. An
aggressive strategy which may employ leverage to the up side (160%) or hedge
to the down side (-50%) based on market direction.
3
WHERE DOES GLOBAL MACRO INVESTING FIT?
Why Allocate to PVG? All asset classes may fall during bear markets
Stocks and Bonds are at all time highs and both may have systemic risk
Investors need to be able to manage risk against the asset class inwhich they invest in by hedging, i.e. inverse ETFs or cash
To be invested in the financial markets and preserve wealth byminimizing traditional market fluctuations
Stocks
Bonds
PVG
PVG – ALTERNATIVE 33% STOCKS/33% BONDS/33% PVG
Stocks
Bonds
MODERN PORTFOLIO THEORY 60% STOCKS/40% BONDS
Alternate Sample PVG Allocation
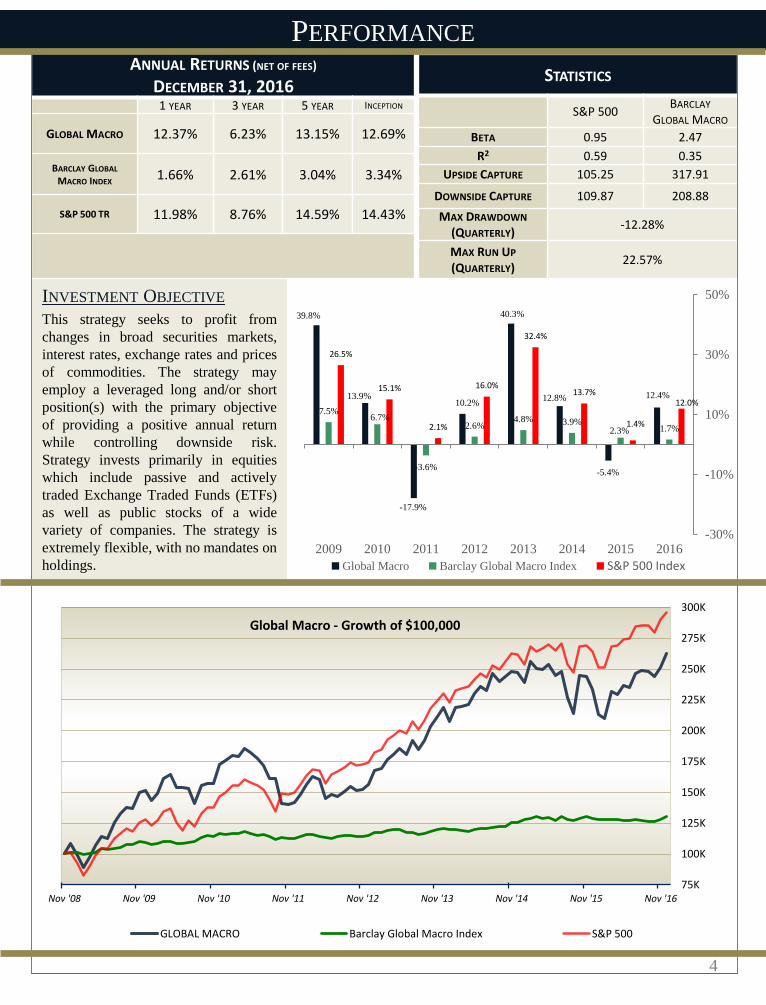
INVESTMENT OBJECTIVE
This strategy seeks to profit from
changes in broad securities markets,
interest rates, exchange rates and prices
of commodities. The strategy may
employ a leveraged long and/or short
position(s) with the primary objective
of providing a positive annual return
while controlling downside risk.
Strategy invests primarily in equities
which include passive and actively
traded Exchange Traded Funds (ETFs)
as well as public stocks of a wide
variety of companies. The strategy is
extremely flexible, with no mandates on
holdings.
STATISTICS
S&P 500BARCLAY
GLOBAL MACRO
BETA 0.95 2.47
R2 0.59 0.35
UPSIDE CAPTURE 105.25 317.91
DOWNSIDE CAPTURE 109.87 208.88
MAX DRAWDOWN
(QUARTERLY)-12.28%
MAX RUN UP
(QUARTERLY)22.57%
ANNUAL RETURNS (NET OF FEES)
DECEMBER 31, 20161 YEAR 3 YEAR 5 YEAR INCEPTION
GLOBAL MACRO 12.37% 6.23% 13.15% 12.69%
BARCLAY GLOBAL
MACRO INDEX1.66% 2.61% 3.04% 3.34%
S&P 500 TR 11.98% 8.76% 14.59% 14.43%
PERFORMANCE
4
75K
100K
125K
150K
175K
200K
225K
250K
275K
300K
Nov '08 Nov '09 Nov '10 Nov '11 Nov '12 Nov '13 Nov '14 Nov '15 Nov '16
Global Macro - Growth of $100,000
GLOBAL MACRO Barclay Global Macro Index S&P 500
39.8%
13.9%
-17.9%
10.2%
40.3%
12.8%
-5.4%
12.4%
7.5%6.7%
-3.6%
2.6%4.8% 3.9%
2.3% 1.7%
26.5%
15.1%
2.1%
16.0%
32.4%
13.7%
1.4%
12.0%
-30%
-10%
10%
30%
50%
2009 2010 2011 2012 2013 2014 2015 2016
Global Macro Barclay Global Macro Index S&P 500 Index

QTR 1 QTR 2 QTR 3 QTR4 ANNUAL BARCLAY
GLOBAL
MACRO
INDEX
S&P 500
GROSS NET GROSS NET GROSS NET GROSS NET GROSS NET
2016 -0.73 -1.05 1.87 1.54 6.04 5.71 6.12 5.79 13.79 12.37 1.66 11.98
2015 1.50 1.25 -1.98 -2.29 -12.28 -12.55 9.74 9.37 -4.23 -5.37 2.29 1.38
2014 0.61 0.28 7.93 7.57 1.78 1.45 3.38 3.04 14.27 12.77 3.91 13.70
2013 13.69 13.30 2.42 2.07 6.73 6.37 14.45 14.06 42.25 40.33 4.81 32.44
2012 15.22 14.85 -8.37 -8.68 4.57 4.22 1.20 0.85 11.74 10.24 2.59 16.00
2011 4.12 3.72 -0.46 -0.80 -8.96 -9.26 -11.81 -12.08 -16.78 -17.92 -3.62 2.11
2010 6.61 6.20 -4.20 -4.52 1.41 1.08 11.45 11.06 15.43 13.85 6.74 15.06
2009 -9.95 -10.29 15.93 15.53 22.59 22.17 10.78 10.42 41.78 39.82 7.47 26.46
2008 8.45 8.45 8.45 8.45 1.60 1.06
EQUITY INCOME COMPOSITE RETURNS
5*Performance disclosures for the Global Macro strategy can be found on page 8.

PORTFOLIO HOLDINGS
AS OF QUARTER END – DECEMBER 31, 2016*
Portfolio Allocation Weight
ProShares Ultra S&P 500 (sso) 55.90
Effective Equity Holdings 111.80%
Effective Hedge (Inverse ETF’s) 0%
Cash 44.10%
Effective Net Long/Short 111.8%
GLOBAL MACRO HOLDINGS
6
Cash & Hedge
Cash 44.10%
Common Stock Holdings %
Proshares Ultra S&P 500 (sso) 55.90%
Total 55.90%
44.155.9
Portfolio Allocation
Cash Equities
*Portfolio Holdings may not reflect the current holdings of the Equity Income strategy.
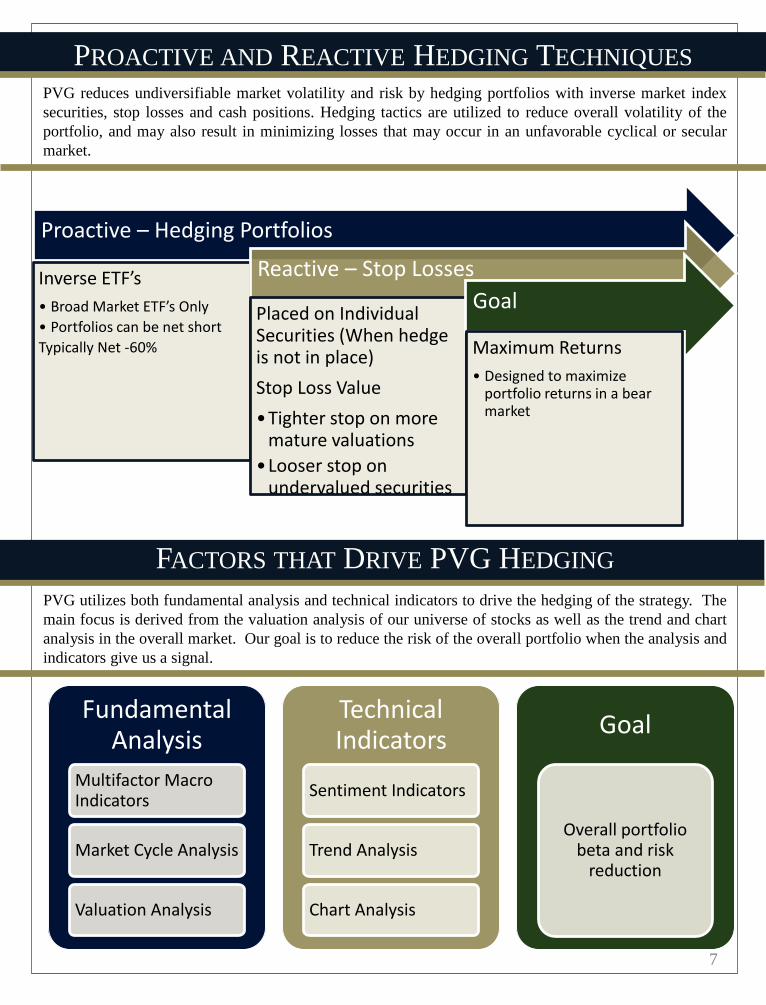
PROACTIVE AND REACTIVE HEDGING TECHNIQUES
7
Proactive – Hedging Portfolios
Inverse ETF’s
• Broad Market ETF’s Only
• Portfolios can be net short
Typically Net -60%
Reactive – Stop Losses
Placed on Individual Securities (When hedge is not in place)
Stop Loss Value
•Tighter stop on more mature valuations
•Looser stop on undervalued securities
Goal
Maximum Returns
• Designed to maximize portfolio returns in a bear market
Fundamental Analysis
Multifactor Macro Indicators
Market Cycle Analysis
Valuation Analysis
Technical Indicators
Sentiment Indicators
Trend Analysis
Chart Analysis
Goal
Overall portfolio beta and risk
reduction
FACTORS THAT DRIVE PVG HEDGING
PVG reduces undiversifiable market volatility and risk by hedging portfolios with inverse market index
securities, stop losses and cash positions. Hedging tactics are utilized to reduce overall volatility of the
portfolio, and may also result in minimizing losses that may occur in an unfavorable cyclical or secular
market.
PVG utilizes both fundamental analysis and technical indicators to drive the hedging of the strategy. The
main focus is derived from the valuation analysis of our universe of stocks as well as the trend and chart
analysis in the overall market. Our goal is to reduce the risk of the overall portfolio when the analysis and
indicators give us a signal.
6898 S. University Blvd. | Centennial, CO 80122 | 800-777-0818
Investing with an
Capital Preservationemphasis on
P V G A S S E T M A N A G E M E N T
L O S S AV E R S E I N V E S T I N G
WWW.PVGASSETMANAGEMENT.COM
Are Not FDIC Insured Are Not Bank Guaranteed May Lose Value
Investment Products:
Performance results are presented in U.S. dollars and are net-of-actual-management fees and trading expenses of the composite and reflect the reinvestment of dividends
and capital gains. Actual fees may vary based on, among other factors, account size and custodial relationship. *Annual returns are compounded over the specified
period. The current dividend yield is calculated gross of fees as of quarter end date and is the expected forward yield. No current or prospective client should assume
future performance of any specific investment strategy will be profitable or equal to past performance levels. All investment strategies have the potential for profit or
loss. Changes in investment strategies, contributions or withdrawals may cause the performance results of your portfolio to differ materially from the reported composite
performance. Different types of investments involve varying degrees of risk, and there can be no assurance that any specific investment will either be suitable or
profitable for a client's investment portfolio. PVG’s Portfolio Risk Spectrum is based off a number of factors including portfolio structure, holdings, weighting and risk
measures. It is not meant to define the client’s risk profile or appetite when investing with PVG. The Portfolio Risk Spectrum may change from the current position at any
time depending on the factors stated for measurement. Historical performance results for market indices generally do not reflect the deduction of transaction and/or
custodial charges or the deduction of an investment-management fee, the incurrence of which would have the effect of decreasing historical performance results.
Economic factors, market conditions, and investment strategies will affect the performance of any portfolio and there are no assurances that it will match or outperform
any particular benchmark. Portfolios in the composite utilize levered index products. Leveraged ETFs are considered risky. The use of leverage strategies by a fund
increases the risk to the fund and magnifies gains or losses on the investment. You could incur significant losses even if the long-term performance of the underlying
index showed a gain. Most leveraged ETFs “reset” daily. Due to the effect of compounding, their performance over longer periods of time can differ significantly from
the performance of their underlying index or benchmark during the same period of time. Exchange traded funds (ETFs) are offered by prospectus only. Investors should
consider a fund’s investment objective, risks, charges, and expenses carefully before investing. The prospectus, which contains this and other important information, is
available from your Financial Advisor and should be read carefully before investing. The investment return and principal value of an investment will fluctuate, so that an
investor’s shares, when redeemed, may be worth more or less than their original cost. ETFs trade like stocks and may trade for less than their net asset value. The
S&P500 Total Return Index is the total return version of the S&P 500 Index which includes the effects of reinvested dividends. The S&P 500 Index is a capitalization-
weighted index of 500 stocks designed to measure performance of the broad domestic economy through changes in the aggregate market value of 500 stocks representing
all major industries. Global Macro managers carry long and short positions in any of the world's major capital or derivative markets. These positions reflect their views
on overall market direction as influenced by major economic trends and or events. The portfolios of these funds can include stocks, bonds, currencies, and commodities
in the form of cash or derivatives instruments. Most funds invest globally in both developed and emerging markets. The investment strategy and types of securities held by
the comparison indices may be substantially different from the investment strategy and the types of securities held by the PVG Global Macro strategy. PVG Asset
Management (“PVG”) is a registered investment advisor with the United States Securities Exchange Commission (the “SEC”). SEC registration does not constitute an
endorsement of the firm by the Commission nor does it indicate that the advisor has attained a particular level of skill or ability. Inception for the Global Macro strategy
is 11/28/2008. Composite, which PVG believes was managed with the same investment goals. Composite performance represents the results of the PVG management
team, which has changed over time due to retirements and new staff. Additional information is available upon request.