pvc - center for health, environment & justicechej.org/wp-content/uploads/pvc - bad news comes...
TRANSCRIPT
PVCBad News Comes in s
The Poison Plastic, Health Hazards and the Looming Waste Crisis
CENTER FOR HEALTH, ENVIRONMENT AND JUSTICE
ENVIRONMENTAL HEALTH STRATEGY CENTER
D E C E M B E R 2 0 0 4


PVCBad News Comes in s
The Poison Plastic, Health Hazards and the Looming Waste Crisis
Authors: Michael Belliveau, Environmental Health Strategy Center (EHSC)Stephen Lester, Center for Health, Environment and Justice (CHEJ)
Editorial Direction: Lois Gibbs, Anne Rabe and Monica Rohde Buckhorn, CHEJ
Research Interns: Austin Saylor, Alicia Fraser and Jessica Mackow, CHEJ
Editing: Margaret Stemper
Layout and Design: Kieran Daly, KDaddy Design and Barbara Sullivan, CHEJ
© 2 0 0 4 , C H E J
The Center for Health, Environment and Justicewas founded in 1981 by Lois Gibbs, the communityleader at Love Canal. CHEJ empowers local groupsto be active, ongoing, democratic forces working toprotect people and the environment from health-threatening contaminants. We provide one-on-oneorganizing and technical assistance, and coordinatenationwide issue-focused campaigns that strengthenand broaden the movement.
www.besafenet.org ● www.chej.org
P.O. Box 6806Falls Church, Virginia 22040
703-237-2249
The Environmental Health Strategy Center is a public health organization that exists toprotect human health from exposure to toxicchemicals. The Center promotes safe alternativesand clean industry and builds partnerships thatfocus on environmental solutions as a publichealth priority. The Center conducts strategicissue campaigns that help set the pace for nationalchemicals policy reform.
www.preventharm.org
One Pleasant Street, Fourth FloorPortland, Maine 04101
207-772-2181
ACKNOWLEDGEMENTS
The authors of this report wish to gratefully acknowl-edge all those who contributed by defining its scope,providing information, and reviewing the report drafts.Without them, it would not have been as comprehen-sive, grounded or as useful a tool. We especially appre-ciate the leadership of Hans Schoepflin and the PantaRhea Foundation, which generously funded theresearch and publication of this report.
The release of this report is sponsored by the BE SAFECampaign, a nationwide initiative of the Center forHealth, Environment and Justice (CHEJ) to buildsupport for the precautionary approach to preventpollution and environmental destruction before ithappens. CHEJ greatly appreciates the support of theBauman Foundation, Beldon Fund, Bush Foundation,Homeland Foundation, Mitchell Kapor Foundation,Alida R. Messinger Charitable Lead Trust, ParkFoundation, Patagonia, Inc., Underdog Fund and AlkiFund of the Tides Foundation, and the TurnerFoundation, for its work to promote precaution andprevention.
The Environmental Health Strategy Center greatlyappreciates the support of the John Merck Fund,Beldon Fund, Alida R. Messenger Charitable LeadTrust and the Proteus Fund for its work to promotesafer alternatives and the leadership of health-affectedpeople and health professionals in preventing harmfrom persistent toxic chemicals.
Several reviewers provided helpful comments on thedraft of this report. Their feedback strengthened thefinal publication. We thank the following reviewers fortheir thoughtful efforts and assistance: *
Frank Ackerman, Tufts University Global Development& Environment Institute; Peter Anderson, RecycleWorlds Consulting; Nina Bellucci, Northern CaliforniaRecycling Association; Pat Costner, Greenpeace;Monique Harden, Advocates for Environmental
Human Rights; Rachel Massey, Tufts University GlobalDevelopment & Environment Institute; Anne Rabe, BESAFE, Center for Health, Environment & Justice;Judith Robinson, Environmental Health Fund; BillSheehan, Product Policy Project; Brandie Smith,Washington Toxics Coalition; Joe Thornton, Universityof Oregon; Beverly Thorpe, Clean Production Action;and Monica Wilson, GAIA (Global Alliance forIncinerator Alternatives).
We are also thankful for additional early input on thePVC problem and its solutions provided by: PaulBogart, Healthy Building Network; Mary Beth Doyle,Ecology Center; Jackie Elliot, Citizens Leading forEnvironmental Action & Responsibility; AlexandraGorman, Women's Voices for the Earth; Toral Jha,Grassroots Recycling Network; Tom Lent, HealthyBuilding Network; Stacy Malkan, Health Care WithoutHarm; Shawna Larson, Alaska Community Action onToxics; Mark Rossi, Clean Production Action; MikeSchade, Citizens' Environmental Coalition; LaurieValeriano, Washington Toxics Coalition; Bill Walsh,Healthy Building Network; and Janet Zeller, Blue RidgeEnvironmental Defense League.*
We owe special thanks to Lois Gibbs for vision andinspiration, Monica Rohde Buckhorn for developing theoriginal report concept, Anne Rabe for coordinationand project management, and Gary Cohen for develop-ing funder support.
The conclusions and recommendations in this reportare those of the authors and do not necessarily reflectthe views or opinions of the funders or reviewers. Theauthors retain full responsibility for the content of thereport.
*Organizations listed for identification purposes.
Dear Friends,
This report provides the facts and a plan of action for one of the most important changes society can make to pro-tect the public's health and the environment.
PVC is a poison plastic. It has earned the title after decades of harming our health and environment. PVC'sdestructive toxic life begins with manufacturing, continues during product use, and then creates devastating pollu-tion problems when it is disposed. I cannot think of another product that is so destructive throughout its entire lifecycle as PVC.
In Louisiana, families gather to talk about how growing health problems in their neighborhood are connected tothe local plastic chemical plant's emissions. In Massachusetts, families meet to discuss the rising cancer rates intheir valley and the nearby incinerators burning large amounts of PVC and releasing dioxin into the air.
I have traveled across the nation visiting neighborhoods that confront the hazards from manufacturing or disposingof PVC plastics every day. These American families find their homes are suddenly worthless and they are trappedin a nightmare of frustration—trying to prove the pollution from the plant or incinerator has caused the damage totheir health. Many of these community stories are briefly described in this report.
Our country's fire fighters and first responders are worried about exposures to PVC's toxic fumes every time theyencounter a fire. Consumers are concerned about vinyl plastic tablecloths or shower curtains that release toxicfumes, often referred to as "that new smell." Parents are worried about the leaching of toxic chemicals from PVCtoys that their children used in the past.
The sad truth behind the destruction and harm caused by PVC, is that in most cases it is not needed. There areplenty of alternatives that are readily available on the market today. On store shelves, consumers can chooseshampoo with a PVC bottle (marked with a #3 or V in the recycle symbol triangle) or a safer PVC-free plastic bot-tle. A growing number of responsible corporations have decided to stop using PVC. Irresponsible corporations, onthe other hand, have refused to move to safer plastics.
An important part of this report is the well-documented fact that there is no "away" for PVC. There is no way toget rid of the product once manufactured. It is with us forever—a legacy left to the next generation. You can'tburn it—it just changes to dioxin, another very toxic pollutant. You can't bury it—chemicals leak out into the sur-rounding soil and groundwater. You can't recycle it—it contaminates the recycling process.
Keeping the American Promise:Achieve Safer and Healthier Future
By Eliminating PVC, The Poison Plastic

This report gives us hope by outlining how we as a society can phase out PVC in the future, with clear models tobegin that phase out now. You'll learn in this document about the many safer, affordable alternatives to PVC thatare available today.
We need to begin a nationwide conversation, community by community, on how to phase out PVC. As consumerswe need to send a strong message to corporations who are resisting the effort to eliminate PVC and let them knowwe will not purchase their products. We need to encourage companies to use their entrepreneurial ingenuity todevelop new products without PVC, the poison plastic. And, we need to enlist all levels of government to passstrong policies to phase-out PVC.
We must move quickly. Generating as much as seven billion pounds of PVC waste each year cannot continue. Wecan't bury it, burn it or recycle it. PVC wastes will live beyond the lifetime of everybody on this planet—a terriblelegacy to leave for future generations.
A road map for how society can eliminate PVC is included in this report. If everyone takes a step down this roadwe can achieve a phase-out and begin to safeguard public health and the environment. I hope you will join us andhelp to leave our children a healthier, more sustainable world.
Lois Marie GibbsExecutive DirectorCenter for Health, Environment and Justice

EXECUTIVE SUMMARY ...............................................................................................................................1
Chapter 1 INTRODUCTION: PVC — The Poison Plastic ...........................................................................5
Chapter 2 THE PVC GENERATION: Large and Growing Amounts of PVC Waste ......................................9
Chapter 3 TROUBLE FROM THE START: The Production and Use of PVC ................................................15
Chapter 4 THE DEADLY CONNECTION: PVC, Chlorine and Dioxin ..........................................................23
Chapter 5 DON'T BURN IT: The Hazards of Burning PVC Waste ............................................................27
Chapter 6 NO PLACE LEFT: Problems with PVC in Landfills ....................................................................35
Chapter 7 RECYCLING MENACE: PVC Undermines Recycling Efforts ......................................................41
Chapter 8 DON'T BUY IT: Safer Alternatives to PVC are Available, Effective and Affordable ..................47
Chapter 9 TAKE ACTION: Preventing Harm from PVC Use and Disposal ...............................................55
APPENDIX A Common Household Products and Packaging That May Contain PVC ..................................69
APPENDIX B Amount of PVC Generated, Incinerated and Landfilled in Each State ...................................71
REFERENCES ............................................................................................................................................73
TABLE OF CONTENTS
LIST of TABLES Table 1 Annual PVC Waste Production in the U.S. .............................................................................10 Table 2 PVC Products Disposed in U.S. Municipal Solid Waste (MSW) in 2001 .................................12Table 3 PVC Increases the Toxicity of Municipal Solid Waste (MSW) ..................................................14Table 4 Overview of Hazards Associated with PVC Production, Use and Disposal ..............................17Table 5 Common Additives Found in PVC .........................................................................................20Table 6 Dioxin Emissions in the U.S. from Sources that Include PVC .................................................25Table 7 States with the Heaviest Reliance on Municipal Waste Incineration ......................................28Table 8 Estimated Amounts of PVC Discarded in Landfills According
to States that Landfill the Most Municipal Solid Waste (MSW) .............................................36Table 9 Typical Composition of PVC Products and Materials ............................................................42Table 10 PVC Contaminates the Recycling of Many Materials and Products ........................................43Table 11 PVC-Free Alternatives to Common Materials ........................................................................50Table 12 The Cost of Replacing PVC ...................................................................................................52Table 13 National Priorities for Solid Waste Management ...................................................................56Table 14 The State of Maine's Waste Management Policy Favors Incineration Over Landfill Disposal ...56Table 15 Proposed Priorities for PVC Waste Management ...................................................................57Table 16 A PVC-Free Policy Action Agenda .........................................................................................63
LIST of FIGURESFigure 1 Uses of PVC in the U.S. and Canada (2002) ...........................................................................5Figure 2 The Life Cycle of PVC Plastic .................................................................................................16Figure 3 Current State Regulations on Backyard Burning of Household Waste in the U.S. ..................33Figure 4 A Plastics Pyramid ................................................................................................................48
LIST OF CASE STUDIES & SIDEBARS Mossville, Louisiana: PVC Production in the New "Cancer Alley" ..................................................................19Illiopolis, Illinois: PVC Plant Explodes .........................................................................................................22Montreal, Canada: PVC Fire and Firefighter Exposure .................................................................................22Detroit, Michigan: Henry Ford Hospital Medical Waste Incinerator .............................................................30Oakland, California: IES Medical Waste Incinerator ....................................................................................31Gila River Indian Reservation, Arizona: Stericycle Medical Waste Incinerator ...............................................31Maine Bans Backyard Burning; Warns Public About PVC Hazards ...............................................................32Side Bar: The Impact of a PVC Phase-Out on Jobs ......................................................................................53Intimate Brands Responds to 6,000 Consumers and Stops Using PVC ........................................................59Side Bar: PVC Identified as Household Hazardous Waste ...........................................................................64San Francisco Bay Area Adopts Dioxin-Free Purchasing Policies ..................................................................64Side Bar: U.S. Companies Stop Using PVC in Products ..............................................................................65Side Bar: Health Care Institutions Move to Phase Out PVC .........................................................................66Model Policy Action Taken to Phase Out PBTs and PVC ...............................................................................66
“Billions of pounds of PVC, the
‘poison plastic,’ are being thrown
‘away’ in the U.S.— but there is no
away for the health threatening
chemicals associated with PVC.”
The disposal of polyvinyl chloride (PVC) plastic threatens
public health and the environment. Although
problematic throughout its lifecycle – from production
through final use – the discarding of PVC as waste poses
perpetual hazards. PVC is widely used in plastic pipes,
building materials (e.g., vinyl siding, windows), consumer
products, disposable packaging and many everyday
products. We can prevent harm from PVC by replacing it
with safer, cost-effective alternatives that are available,
and by diverting PVC waste away from incineration and
open burning. This report summarizes data on PVC
production, use and disposal in the United States, though
its conclusions about the environmental health hazards of
PVC are applicable to every country.
How much PVC do we use?Billions of Pounds of PVCare Discarded Each YearLarge and growing amounts of PVC are discarded dailyin the U.S. As much as 7 billion pounds of PVC is dis-carded every year in municipal solid waste, medicalwaste, and construction and demolition debris. PVC dis-posal is the largest source of dioxin-forming chlorine andhazardous phthalates in solid waste, as well as a majorsource of lead, cadmium and organotins. Dioxins are afamily of highly toxic chemicals that are known to causecancer, reproductive, developmental and immune prob-lems. More than 2 billion pounds per year of nondurable(short-lived) PVC products are discarded with U.S.household trash, including blister packs and other pack-aging, plastic bottles and containers, plastic wrap andbags, and more. In fact, nondurable products accountfor more than 70% of the PVC disposed of in U.S.municipal solid waste. Worldwide, an estimated 300 bil-lion pounds of PVC, which was installed in the last 30 to40 years in construction and other long lasting uses, willsoon reach the end of its useful life and require disposal.
What’s so badabout PVC plastic?PVC: A Truly “Poison” PlasticUnlike the many plastics made without chlorine, PVC
PV
C:
B
ad
N
ew
s
Co
me
s
In
T
hr
ee
s
1
EXECUTIVESUMMARY

poses serious environmental health threats from thestart. The production of PVC requires the manufactureof raw chemicals, including highly polluting chlorine,and cancer-causing vinyl chloride monomer (VCM)and ethylene dichloride (EDC). Communities sur-rounding U.S. vinyl chloride chemical facilities, half ofwhich are in Louisiana, suffer from serious toxic chemi-cal pollution of their groundwater supplies, surfacewaters and air. Residents of the town of Mossville,Louisiana had dioxin levels in their blood that werethree times higher than normal. PVC plastic alsorequires large amounts of toxic additives to make it sta-ble and usable. These additives are released during theuse (and disposal) of PVC products, resulting in elevat-ed human exposures to phthalates, lead, cadmium, tinand other toxic chemicals. Dioxin emissions from PVCcombustion occur regularly due to the 1 million annualfires that burn buildings and vehicles, two sectors thatuse substantial amounts of PVC.
What are the options fordisposing of used PVC?PVC Products + Waste Incinerators orOpen Burning = Dioxin EmissionsDioxin formation is the Achilles heel of PVC. BurningPVC plastic, which contains 57% chlorine when pure,forms dioxins, a highly toxic group of chemicals thatbuild up in the food chain. PVC is the major contribu-tor of chlorine to four combustion sources—municipalsolid waste incinerators, backyard burn barrels, medicalwaste incinerators and secondary copper smelters—thataccount for a significant portion of dioxin air emissions.In the most recent USEPA Inventory of Sources ofDioxin in the United States, these four sourcesaccounted for more than 80% of dioxin emissions to airbased on data collected in 1995. Since then, the clo-sure of many incinerators and tighter regulations havereduced dioxin air emissions from waste incineration,while increasing the proportion of dioxin disposed of inlandfills with incinerator ash. The PVC content in thewaste steam fed to incinerators has been linked to ele-vated levels of dioxins in stack air emissions and incin-erator ash.
Incineration and open burning of PVC-laden wasteseriously impacts public health and the environment.More than 100 municipal waste incinerators in the U.S.burn 500 to 600 million pounds of PVC each year,forming highly toxic dioxins that are released to the airand disposed of on land as ash. The biggest PVC-burn-ing states include Massachusetts, Connecticut,
Maine—which all burn more than half of their waste—Florida, New York, Virginia, Pennsylvania, Maryland,Minnesota, Michigan, New Jersey, Indiana andWashington. The incineration of medical waste, whichhas the highest PVC content of any waste stream, isfinally being replaced across the U.S. by cleaner non-burn technologies after years of community activismand leadership by environmentally-minded hospitals.Backyard burning of PVC-containing household trash isnot regulated at the federal level and is poorly regulatedby the states. There are no restrictions on backyardburning in Michigan and Pennsylvania. It is partiallyrestricted in 30 states, and banned in 18 states.
PVC Products + Landfill Disposal =Groundwater ContaminationLand disposal of PVC is also problematic. DumpingPVC in landfills poses significant long-term environ-mental threats due to leaching of toxic additives intogroundwater, dioxin-forming landfill fires, and therelease of toxic emissions in landfill gases. Land dis-posal is the final fate of between 2 billion and 4 bil-lion pounds of PVC that are discarded every year atsome 1,800 municipal waste landfills in the U.S.Most PVC in construction and demolition debris endsup in landfills, many of which are unlined and cannotcapture any contaminants that leak out. An averageof 8,400 landfill fires are reported every year in theU.S., contributing further to PVC waste combustionand dioxin pollution.
PVC Products + Recycling =Contamination of the EntirePlastics Recycling ProcessUnfortunately, PVC recycling is not the answer. Theamount of PVC products that are recycled is negligible,with estimates ranging from only 0.1% to 3%. PVC isvery difficult to recycle because of the many differentformulations used to make PVC products. Its composi-tion varies because of the many additives used to makePVC products. When these different formulations ofPVC are mixed together, they cannot readily be sepa-rated which is necessary to recycle the PVC into itsoriginal formulation. It’s also virtually impossible tocreate a formulation that can be used for a specificapplication. PVC can never be truly recycled into thesame quality material—it usually ends up being madeinto lower quality products with less stringent require-ments such as park benches or speed bumps.
When PVC products are mixed in with the recycling ofnon-chlorinated plastics, such as in the “all-bottle”recycling programs favored by the plastics industry, theycontaminate the entire recycling process. Although
EX
EC
UT
IV
ES
UM
MA
RY
2
other types of non-chlorine plastics make up more than95% of all plastic bottles, introducing only one PVCbottle into the recycling process can contaminate100,000 bottles, rendering the entire stock unusable formaking new bottles or products of similar quality. PVCalso increases the toxic impacts of other discarded prod-ucts such as computers, automobiles and corrugatedcardboard during the recycling process.
Safer alternatives areavailable to replace PVCSafer alternatives to PVC are widely available andeffective for almost all major uses in building materials,medical products, packaging, office supplies, toys andconsumer goods. PVC is the most environmentallyharmful plastic. Many other plastic resins can substi-tute more safely for PVC when natural materials arenot available.
PVC alternatives are affordable and already competitivein the market place. In many cases, the alternatives areonly slightly more costly than PVC, and in some casesthe costs of the alternative materials are comparable toPVC when measured over the useful life of the product.Phasing out PVC in favor of safer alternatives is eco-nomically achievable. A PVC phase-out will likelyrequire the same total employment as PVC production.The current jobs associated with U.S. PVC production(an estimated 9,000 in VCM and PVC resin produc-tion, and 126,000 in PVC fabrication) would simply betranslated into production of the same products fromsafer plastic resins.
How can we get rid of PVC?To end the myriad of problems created by PVC disposal,we recommend the following policies and activities.● Policymakers at the local, state and federal level
should enact and implement laws that steadilyreduce the impacts of PVC disposal and lead to acomplete phase-out of PVC use and waste inciner-ation within ten years (see box below).
● A new materials policy for PVC that embracesaggressive source reduction of PVC should be adopt-ed to steadily reduce the use of PVC over time.
● Federal and state waste management prioritiesshould be changed to make incineration of PVCwaste the least preferable option.
● In the interim, any PVC waste generated should bediverted away from incineration to hazardous wastelandfills.
● Consumers should take personal action to buy PVC-free alternatives and to remove PVC from their trashfor management as household hazardous waste.
● Communities should continue to organize againstPVC-related dioxin sources such as waste incinera-tors while working to promote safer alternatives. E
XE
CU
TI
VE
SU
MM
AR
Y
3
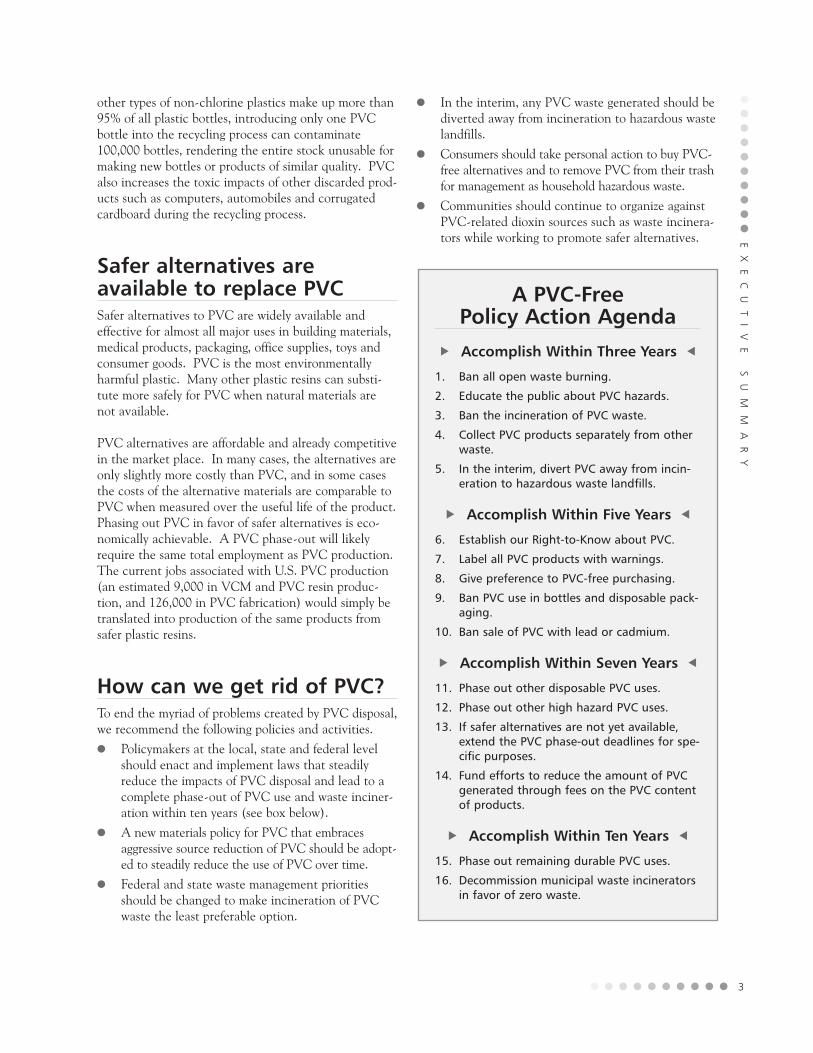
A PVC-Free Policy Action Agenda
� Accomplish Within Three Years �
1. Ban all open waste burning.
2. Educate the public about PVC hazards.
3. Ban the incineration of PVC waste.
4. Collect PVC products separately from otherwaste.
5. In the interim, divert PVC away from incin-eration to hazardous waste landfills.
� Accomplish Within Five Years �
6. Establish our Right-to-Know about PVC.
7. Label all PVC products with warnings.
8. Give preference to PVC-free purchasing.
9. Ban PVC use in bottles and disposable pack-aging.
10. Ban sale of PVC with lead or cadmium.
� Accomplish Within Seven Years �
11. Phase out other disposable PVC uses.
12. Phase out other high hazard PVC uses.
13. If safer alternatives are not yet available,extend the PVC phase-out deadlines for spe-cific purposes.
14. Fund efforts to reduce the amount of PVCgenerated through fees on the PVC contentof products.
� Accomplish Within Ten Years �
15. Phase out remaining durable PVC uses.
16. Decommission municipal waste incineratorsin favor of zero waste.


Polyvinyl chloride, commonly referred to as “PVC” or
“vinyl,” is the second largest commodity plastic in produc-
tion in the world today. An estimated 59 billion pounds
were produced worldwide in 2002 (CEH 2003). Over 14
billion pounds are produced annually in the U.S. (VI
2004). PVC is used in a wide range of products including
pipes and tubing, construction materials, packaging, elec-
trical wiring and thousands of consumer goods (Ackerman
2003). The diverse and widespread use of PVC plastic in
disposable and durable goods leads to the many immedi-
ate and long-term disposal chal-
lenges reviewed in this report.
Figure 1 provides a general break-down of the many uses of PVC.Because of its low cost and aggres-sive marketing, PVC is found inhundreds of consumer productsthat are used everyday, includingchildren’s toys, credit cards, cloth-ing, carpeting, furniture, flooring,automotive seats, garden hoses, cel-lular phones, computer parts, officesupplies, siding on our homes, roof-ing and other building materials. A
partial listing of common household products made ofPVC can be found in Appendix A.
Plastic pipes and construction uses account for 75% ofall PVC consumption in North America. Constructionis also the fastest growing PVC sector, with a projectedannual average growth rate of 3.5% between 2002 and2007. Within the construction sector, the fastest grow-ing PVC products are special applications, such as gut-ters, fencing and decking (growing at 8.1% per year),windows and doors (6.1%), vinyl siding (4.5%) andpipes and tubing (2.5%). PVC use in electrical equip-ment and electronics is increasing at 2.5% per year.Disposable PVC packaging and transportation-related
PV
C:
B
ad
N
ew
s
Co
me
s
In
T
hr
ee
s
5
IINTRODUCTIONPVC—The Poison Plastic
Figure 1. Uses of PVC in U.S. and Canada (2002)
Consumer Goods, 8.5%
Packaging, 5.8%
Other 5.4%
Electrical/electronic 5.5%
Construction, 29.8%
Pipes, 45.0%
Source: Ackerman 2003, CEH 2003

PVC uses will grow by 2.0% every year over the samefive-year period (CEH 2003).
This report reviews the many hazards associated withthe disposal of PVC in the United States. Althoughthe report relies primarily on U.S. data on PVC produc-tion, use and disposal, the information on the environ-mental health impacts of PVC are applicable to everycountry. This report is not intended to be a compre-hensive review of all the health and environmentalrisks posed during the lifecycle of PVC throughout itsproduction, use, and disposal. The key impacts of PVCproduction and use are summarized in order to providecontext for assessing the impacts of the disposal of PVCwaste.
Throughout the text we have included a number ofcase studies that illustrate the impact that PVC has onpeople. In addition, there are a number of sidebars thathighlight actions that some organizations have taken toaddress the public health or environmental impacts ofPVC. The following is a brief summary of the report’sfindings listed by chapter.
Chapter 2, The PVC Generation: Large andGrowing Amounts of PVC Waste, provides an overview of the amount of PVC waste gen-erated in the U.S. each year and estimates how muchends up in different waste streams. This chapter alsoaddresses how PVC increases the toxicity of these wastestreams.
Chapter 3, Trouble From The Start:The Production and Use of PVC,reviews the production and processing of PVC, whichinvolves chlorine and an array of additives that haveserious consequences for public health and the environ-ment during PVC use and disposal. The toxic hazardsof PVC additives, including phthalates, heavy metalsand flame retardants, are described in this chapter.
Chapter 4, The Deadly Connection: PVC,Chlorine and Dioxin, reviews the relationship between PVC, chlorine anddioxin, which is especially troubling. Dioxin, one of themost toxic chemicals ever tested, is generated when anyform of burning is used as a disposal option for PVC.
Chapter 5, Don’t Burn It:The Hazards of Burning PVC Waste,provides a detailed description of the specific hazards ofPVC incineration. Open burning of PVC waste inbackyard burn barrels or waste piles is especially trou-bling because of the large amount of dioxins generated.
Chapter 6, No Place Left: Problems withPVC in Landfills,reviews the specific toxic hazards associated with theland disposal of PVC. Many PVC additives, includingphthalates, heavy metals such as lead and cadmium andorganotins, slowly leach out of PVC over time whenplaced in a landfill, eventually contaminating ground-water and surface water. PVC also worsens the impactsof landfill fires and landfill gases that are generated asmaterials in the landfill decay.
Chapter 7, Recycling Menace: PVCUndermines Recycling Efforts,reviews efforts to recycle PVC and details its impacts onplastic recycling programs due to its incompatibilitywith other commonly recyclable plastics. PVC isextremely hard to recycle because of the numerousadditives that are used to make a wide range of PVCproducts. The toxic by-products of PVC also signifi-cantly undermine the recycling of other products.
Chapter 8, Don’t Buy It:Safer Alternatives to PVC are Available,Effective and Affordable,looks at the widespread availability of safer alternativesto PVC and provides a summary of an economic analy-sis conducted by the Global Development andEnvironment Institute at Tufts University in Medford,MA. This analysis found that cost-competitive alterna-tives do exist for most uses of PVC. This chapterincludes information on resources that can be used toidentify alternatives to PVC.
Chapter 9, Take Action: Preventing Harmfrom PVC Use and Disposal, describes actions that can be taken by individuals, localgrassroots community-based organizations, statewideorganizations, and as part of national efforts to preventharm from the use and disposal of PVC.
CH
AP
TE
R1
:P
VC
—T
HE
P
OIS
ON
P
LA
ST
IC
6

In researching this report, we identified a number ofimportant references that we used, and in some casesrelied on heavily in writing this report. We appreciatethe pioneering work on PVC’s hazards and alternativesachieved by the researchers, analysts and authorsresponsible for these publications. We are especially indebt to these colleagues. We encourage you to consultthese resources for more detailed documentation anduseful information on the hazards and alternatives toPVC. These and other references are listed at the endof this document.
● Ackerman (2003) F. and R. Massey. “TheEconomics of Phasing Out PVC,” GlobalDevelopment and Environment Institute, TuftsUniversity, Medford, MA, December. Available athttp://www.ase.tufts.edu/gdae/Pubs/rp/Economics_of_PVC.pdf.
● Anderson (2004) P. Message in a Bottle: TheImpacts of PVC on Plastics Recycling. A Report tothe GrassRoots Recycling Network from RecycleWorlds Consulting, June. Available athttp://www.grrn.org/assets/pdfs/pvc/PVCBottleRecyclingReport06162004.pdf.
● Chem-Info Services (1997) “A Technical andSocio-Economic Comparison of Options toProducts Derived from the Chlor-alkali Industry,”Environment Canada, Burlington, Ontario.
● Commission of the European Communities (CEC2000) Green Paper: Environmental Issues of PVC.COM (2000) 469 final, Brussels, July 26. Availableat http://www.europa.eu.int/comm/environment/waste/pvc/en.pdf/green_paper_pvc.thtm.
● Costner (2001) P. “Chlorine, Combustion andDioxins: Does Reducing Chlorine in WastesDecrease Dioxin Formation in Waste Incinerators?”Greenpeace International, September 10.
● Greenpeace (2004) “PVC Alternatives DatabaseBuilding the Future.” Greenpeace. Available athttp://archive.greenpeace.org/toxics/pvcdatabase.
● Greenpeace (2001) “PVC-Free Future: A Reviewof Restrictions and PVC Free Policies Worldwide.”Greenpeace International, Inc. The Netherlands,August. Available at http://archive.greenpeace.org/toxics/reports/restrictions.pdf.
● Healthy Building Network (HBN 2004) “PVCAlternatives.” A fact sheet available athttp://www.healthybuilding.net/pvc/alternatives.html.
● Hickling Corporation (HC 1994) “EconomicInstruments for the Virtual Elimination ofPersistent Toxic Substances in the Great LakesBasin.” Report to the International JointCommission, Windsor, Ontario.
● Steingraber (2004) S. “Update on theEnvironmental Health Impacts of PolyvinylChloride (PVC) as a Building Material: Evidencefrom 2000-2004.” A commentary for the U.S.Green Building Council, on behalf of HealthyBuilding Network, April 2. Available athttp://www.healthybuilding.net/pvc/steingraber.pdf.
● Sustainable Hospital Project (SHP 2000) “Here arefour ways to find alternative products.” LowellCenter for Sustainable Production, Lowell, MA.Available at http://www.sustainablehospitals.org/cgi-bin/DB_Index.cgi.
● Thornton (2002) J. “Environmental Impacts ofPolyvinyl Chloride Building Materials – A HealthyBuilding Network Report.” Healthy BuildingNetwork, Washington, DC, 2002. Available athttp://www.healthybuilding.net/pvc/Thornton_Enviro_Impacts_of_PVC.pdf.
● Thornton (2000) J. Pandora’s Poison: Chlorine,Health, and a New Environmental Strategy.Cambridge, Massachusetts: MIT Press.
CH
AP
TE
R1
:P
VC
—T
HE
P
OIS
ON
P
LA
ST
IC
7

MAJOR FINDINGS● As much as 7 billion pounds of PVC are dis-
carded every year in the U.S. in municipalsolid waste, medical waste and constructionand demolition debris.
● PVC disposal is the largest source of dioxin-forming chlorine and phthalates in solidwaste, as well as a major source of lead,cadmium and organotins.
● More than 2 billion pounds per year of non-durable (short-lived) PVC products are dis-carded in U.S. household trash, including blis-ter packs and other packaging, plastic bottlesand containers and plastic wrap and bags.
● Non-durable (short-lived) products accountfor more than 70% of PVC disposed inmunicipal solid waste in the U.S.
● Worldwide, an estimated 300 billion poundsof longer-lasting PVC products, such as con-struction materials that last 30 to 40 years,will soon reach the end of their useful lifeand require replacement and disposal.
Every day, PVC plastic becomes the problem waste thatnobody wants to talk about. Why? Because it entersthe waste stream in large amounts as the least recycla-ble and most environmentally harmful plastic. If therewere an honest national dialogue about PVC and diox-in pollution prevention, support for waste incinerationwould crumble and the government would phase outPVC production and use. Landfills can’t contain thetoxic components of PVC. PVC contaminates therecycling of so many products that could otherwise besafely reprocessed into useful materials. PVC wasteadds daily to a looming waste crisis as more and morelong-lasting products made of PVC, such as buildingmaterials, are removed from use. And perhaps most ofall, because powerful elements of the chemical industryare wedded to promoting PVC use and the chlorineindustry involved in its production.
We should care about PVC disposal because that’s whenthe toxic components and by-products of this seeminglybenign and ubiquitous plastic are discarded and dis-persed throughout the environment. Not everyone livesnext to the chemical plant that emits the dangerous rawmaterials of PVC production. Not everyone experiencesthe vinyl building fire, the dioxin-spewing burn barrel,or the medical procedure that leaches dangerous chemi-cals from the intravenous (IV) tubing made of PVC.
Yet all of us generate PVC waste even if we try to avoiddoing so. By learning about the harm posed by PVCdisposal, we can spur political, business, and consumer
PV
C:
B
ad
N
ew
s
Co
me
s
In
T
hr
ee
s
9
IITHE PVC GENERATIONLarge and Growing Amounts
of PVC Waste

action to break the cycle of dependence on this incredi-bly toxic and problematic material. If we don’t burn it,we can reduce the worst impacts of PVC. And if wedon’t buy it, we can avoid all of the problems associatedwith PVC production, use, and disposal.
The Quantity of PVCin the Waste StreamThe useful life of a PVC product may come to an endminutes after a purchase in the case of disposable pack-
aging, or a few decades later when PVC building materi-als must be replaced. Given the widespread use of PVCand its highly variable lifespan across many types ofproducts, it is no wonder that huge amounts of PVCwaste are generated on a daily basis in every community.
Table 1 summarizes available information on the PVC con-tent of solid waste in the U.S. The five major wastestreams shown in Table 1 account for almost all post-indus-trial PVC waste: (1) municipal solid waste (MSW); (2)medical waste; (3) construction and demolition (C&D)debris; (4) discarded products collected for recycling; and(5) industrial solid waste generated during manufacturing.
CH
AP
TE
R
2:
T
HE
P
VC
G
EN
ER
AT
ION
:
La
rg
e
an
d
Gr
ow
ing
A
mo
un
ts
o
f
PV
C
Wa
st
e
10
Waste StreamTotal Quantity Generated
Municipal Solid Waste (MSW)229 million1 - 369 million2 tons
Medical Waste(Biomedical/Infectious)3.4 million tons3
Construction & Demolition(C&D) Debris136 million tons6
Discarded Products Collectedfor RecyclingUnknown amount
Manufacturing WasteUnknown amount
Description of PVC Portion of Waste Stream
Packaging and other disposablevinyl products
Mostly medical tubing andbags with some vinyl gloves andsupplies
Vinyl pipes only5 and vinyl pipesand siding6 (Does not account forother types of PVC C&D debris)
PVC-contaminated plastics frombottles, electronics, automobiles,scrap wood, cardboard, etc.
Complete range of PVC productsincluding manufactured homesand plastics fabrication
Percent
0.62%1
5% to 15% 4
0.18%5 to 0.63%6
Varies
Varies
Amount (tons)
1,420,0001 to 2,290,0002*
170,000 to 510,000
245,000 to 856,000
Unknown
Unknown
Sources and Notes: 1 - USEPA 2003; 2 - Kaufman 2004; 3 - USEPA 1994; 4 - Marrack 1988, Hasselriis 1993, DTI 1995, USOTA 1988; 5 - Cascadia2003; and 6 - FA 1998. *These two estimates of total PVC content in MSW are derived using USEPA (2003) and Kaufman (2004) data to generate thelow and high estimates, respectively. Note: There are many inherent uncertainties in any estimate of the amount of MSW generated. This is reflected inthe 140 million ton difference between the USEPA estimate of 229 million tons and the Kaufman estimate of 369 million tons of MSW generated. Part ofthe reason for this difference is due to the methods used to derive the estimates. The USEPA relied on economic and population data to estimate MSWgenerated on a per capita basis. Kaufman used a survey sent to state management agencies to collect data on solid waste. The EPA estimate only includ-ed household garbage, while Kaufman collected data on a number of solid waste categories and then calculated the MSW portion, which included resi-dential and commercial waste, organics, tires, and "other." In both cases, the MSW estimates included primarily household garbage. A third estimate, notused in this report, was made by the Environmental Research and Education Foundation (EREF 2001) which estimated that 545 million tons of MSW weregenerated in the U.S. in 1999. This estimate was generated from a survey distributed to both public and private waste disposal companies and includedall non-hazardous waste sent off-site for final disposal including household waste, commercial and institutional waste, special waste, C&D waste, regulat-ed medical waste, yard waste, sludge and scrap tires. This estimate clearly includes a much broader universal of waste targeted for recycling or disposal.
PVC Content of Waste Stream
TOTAL Amount of PVC Discarded Annuallyin MSW, Medical Waste and C&D Debris
1.8 to 3.6 million tons(3.7 to 7.2 billion pounds)
Average = 2.75 million tons (Average = 5.5 billion pounds)
● ● ● ● ● Table 1 ● ● ● ● ●
Annual PVC Waste Production in the U.S.

Table 1 shows that three of the five major wastestreams—municipal solid waste, biomedical/infectiousmedical waste and construction and demolitiondebris—account for on average about 5.5 billionpounds of PVC discarded every year in the U.S. Anestimated 7.2 billion pounds are generated annually inthe European Union (EU) (AEA 2000). In the U.S.,63% to 77% of the total amount of PVC waste knownto be discarded each year ends up in the municipal solidwaste stream. Medical waste has the highest PVC con-tent due to the high reliance of hospitals on vinyl med-ical bags and tubing. PVC also makes up as much as18% of non-infectious hospital waste (Hasselriis 1993),which is typically disposed of as municipal solid waste.The PVC content of C&D waste is similar to that ofMSW but is expected to grow significantly—mirroringthe growth in PVC building materials used in the lastthirty years as they are replaced because of aging (CEC2000). Each of these five major waste streams aredescribed in the subsections that follow.
Although PVC generally contributes only a modestamount to the total volume of a waste stream, as shownin Table 1, there are exceptions such as hospital waste(Marrack 1988, Hasselriis 1993, DTI 1995, USOTA1988) and consumer electronics waste (MCTC 1996)that have particularly high PVC content. Furthermore,the amount of PVC waste generated which requires dis-posal appears to be growing due to the expiration ofproducts placed in use 20 to 30 years ago when PVCmaterials were introduced (CEC 2000). This adds toconcerns about the toxic impacts of PVC disposal due todioxin formation when burned (see Chapter 5) and theleaching of lead, cadmium, tin, and other toxic additivesfrom the plastic when landfilled (see Chapter 6).
PVC in MunicipalSolid WasteIn the U.S., about 79% of PVC inthe municipal solid waste (MSW),or about 2.2 billion pounds of PVC,ends up in landfills every year(USEPA 2003). About 21% orabout 600 million pounds of PVC inMSW is incinerated every year,leading to the formation of dioxinsin air emissions and ash. EPA esti-mated that a “negligible” amount ofPVC is collected for municipal solidwaste recycling. MSW includes solid
waste generated by householdsas well as commercial
and institutional sources. These figures are based on2001 data (USEPA 2003).
Non-durable goods (materials with a relatively shortuseful life) make up 71% of the PVC found in munici-pal solid waste as shown in Table 2. Over one milliontons (2 billion pounds) of these materials were discard-ed in the U.S. in 2001 (USEPA 2003). The largest por-tion of these materials was PVC Blister packs (hardplastic packaging often used for toys or computer sup-plies) and other vinyl packaging that accounted formore than 250,000 tons (500 million pounds). About500,000 tons (one billion pounds) of these short-livedPVC products are tossed in household trash every yearfrom disposable plastic blister packs, other packaging,film wrap, bags, bottles and other containers. Evenmore PVC is discarded annually as other non-durablegoods, such as shower curtains, beach balls, credit cardsand checkbook covers.
The third major category of PVC waste in householdtrash is durable goods, accounting for 411,000 tons(822 million pounds) per year. “Durable” trash con-taining PVC could include building materials such aspiping, siding, windows and flooring, and consumerelectronics and appliances.
PVC in Medical WasteUntil recently, the majority of medical waste was incin-erated and much of that was burned on-site at hospi-tals. By 1990, about 60% to 70% of all medical wastewas incinerated (USEPA 1994, USOTA 1990). Thisincluded biomedical waste produced by hospitals, labs,
CH
AP
TE
R
2:
T
HE
P
VC
G
EN
ER
AT
ION
:
La
rg
e
an
d
Gr
ow
ing
A
mo
un
ts
o
f
PV
C
Wa
st
e
11
Waste versus Discards
This report often refers to PVC in the waste stream. In fact, whatwe often call ‘waste’ is actually discarded products that we end upwasting. When products reach the end of their useful life, theyshould be collected to be taken apart and recycled back into theiroriginal materials. This is the concept of ‘Zero Waste’, which maxi-mizes recycling, minimizes waste, reduces consumption and ensuresthat products are made to be reused, repaired or recycled back intonature or the marketplace (GRRN 2004). Unfortunately, PVC is verydifficult to recycle and when present in discarded products tends tocontaminate the recycling process. Therefore, almost all PVC pro-ducts are wasted sooner or later.

clinics, physician offices and other sources. Since then,the amount of medical waste burned and the number ofoperating incinerators have dramatically declined dueto overwhelming evidence of enormous dioxin emis-sions, leading to government regulation and powerfulcommunity opposition.
As the health care industry continues its transition tonon-incineration methods for disinfecting medicalwaste, the problems caused by vinyl medical products inthe waste stream may not be solved. For example, untilrecently almost all of the medical waste generated inthe state of Maine was sent to an out-of-state commer-cial incinerator. After local community opposition, thisregional incinerator was closed and Maine’s medicalwaste was shipped to a microwave disinfection treat-ment facility. However, the disinfected residue aftertreatment is now sent to a municipal solid waste incin-erator in Massachusetts. The Maine HospitalAssociation (MHA) is in the process of siting an auto-clave facility in the state to disinfect medical waste (seeChapter 5). Due to concerns raised about dioxin emis-sions, the MHA has pledged to dispose of disinfectedPVC-rich residue in a landfill rather than a municipalwaste incinerator (Belliveau 2002, Huang 2004).
In states like Maine that are highly dependent on incin-eration to handle municipal waste, the closure of med-ical waste facilities may not prevent PVC medical wastefrom being burned elsewhere, releasing toxic additives
and by-products to the environ-ment. Efforts to phase out PVCby the health care industry willprevent such a dilemma.
PVC inConstructionand DemolitionDebrisMore PVC ends up in construc-tion and demolition (C&D)waste each year than in medicalwaste (See Table 1). About850,000 tons (1.7 billion pounds)of PVC is disposed of every yearin nearly 2,000 C&D landfillsacross the U.S. (Kaufman 2004).Very little C&D waste is inciner-ated, except for a portion thatenters municipal solid waste
when generated by households or small businesses.However, many if not most C&D landfills are unlinedor poorly lined compared to municipal solid waste land-fills. Thus, there are even fewer barriers to keep chemi-cals from leaking out than those provided by MSWlandfills. This is a serious problem that will likely resultin more contaminants from PVC entering the environ-ment.
The amount of PVC in C&D waste may be seriouslyunderestimated. The available waste characterizationdata included in Table 1 only accounts for PVC pipes(Cascadia 2003) or pipes and vinyl siding (FA 1998).There are many other applications of PVC in buildingmaterials and furnishings that may become C&D waste,including vinyl window frames, flooring, roofing foilsand carpet backing (Thornton 2002).
Also, the growth in the installation of durable PVCbuilding products over the last twenty to thirty yearshas built up a stockpile of PVC still in use. As thesematerials reach the end of their useful life, the amountof PVC in the construction and demolition debris willinevitably and rapidly increase in content and amount.An estimated 300 million pounds of PVC materials willrequire disposal worldwide in the coming years (van derNaald 1998).
CH
AP
TE
R
2:
T
HE
P
VC
G
EN
ER
AT
ION
:
La
rg
e
an
d
Gr
ow
ing
A
mo
un
ts
o
f
PV
C
Wa
st
e
12
● ● ● ● ● Table 2 ● ● ● ● ●
PVC Products Disposed in U.S. Municipal Solid Waste(MSW) in 2001
Blister packs and other packaging
Plastic bottles and containers
Plastic wrap and bags
Other nondurable goods
SUBTOTAL - Nondurables
SUBTOTAL - Durables
255,000
147,000
68,000
539,000
1,009,000
411,000
1,420,000
18%
10%
5%
38%
71%
29%
100%
Source: USEPA 2003
Amount of PVC(tons) (%)Type of PVC Product
Non-durable Goods(Short useful life)
Durable Goods
TOTAL Amount of PVC in MSW (tons)
PVC as a Contaminant in theRecycling of Other ProductsAnother poorly quantified PVC waste stream is the dis-carded products and materials that are collected forrecycling. PVC is very difficult to recycle because ofthe many different formulations used to make PVCproducts. Its composition varies widely due to themany additives used to make PVC products. Whenthese different formulations are mixed together, theycannot readily be separated which is necessary to recy-cle the PVC into its original formulation. It is also vir-tually impossible to create a formulation that can beused for any application. At best, only about 3% ofPVC products and materials are recycled in the U.S.
Two additional problems are created by the presence ofPVC in the waste stream targeted for recycling. Thefirst is the difficulty in separating PVC from other plas-tics, such as PET bottles or nylon carpet facing. Thismakes it extremely difficult, if not impossible, to recyclethese otherwise recyclable materials. Second, the pres-ence of PVC impedes the successful recycling of othervaluable commodities such as copper from wiring andcable used in electronics such as computers, steel fromscrapped automobiles and corrugated cardboard con-tainers sealed with PVC tape. PVC increases the toxicimpacts of recycling these materials. Each of theseproblems is discussed in more detail in Chapter 7.
PVC as a ManufacturingWasteIn addition to the health care industry, other industrial,commercial and institutional facilities generate PVCwaste. Two manufacturing industries are known users oflarge volumes of PVC—plastics fabricators where PVCconsumer products are manufactured from PVC resin(see Chapter 3) and makers of pre-manufactured homes.Fabricators blend PVC resin with additives to form a vari-ety of rigid and flexible PVC products. Manufacturers ofmodular and pre-made homes use a large proportion ofPVC building materials and furnishings. Some amount ofpre-consumer PVC waste should be recycled by theseindustries. Recycling rates for PVC waste from thesetypes of industries are not readily available.
PVC Increases theToxicity of Solid WastePVC contributes a disproportionate share of toxic con-
taminants to solid waste relative to its modest weightand volume in the waste stream. The different compo-nents of PVC add significantly to the hazardous con-stituents of solid waste as shown in Table 3. The Tableshows that PVC contributes from 38 to 67% of thetotal chlorine found in solid waste, from 90 to 98% ofphthalates, from 1 to 28% of the lead and about 10% ofthe cadmium. Phthalates, lead and cadmium are alladded to the PVC resin to achieve different productfeatures. The toxicity of these and other additives isdiscussed in Chapter 3.
Chlorine is the primary component of PVC making up57% by weight of the raw material used to make thepure PVC resin (VI 2004). There have been severalefforts to estimate the contribution of PVC to totalchlorine found in municipal solid waste (MSW). InMSW, at least 80% of the organically bound chlorine,which is thought to be more conducive to dioxin forma-tion than inorganic chlorine, is from PVC (Thornton2000). In medical waste, PVC’s contribution of chlo-rine is even higher, accounting for more than 90% oforganic chlorine and more than 80% of total chlorine(Thornton 2000, Green 1993). Based on these esti-mates, PVC could reasonably account for as much as50% of all chlorine found in MSW.
About 90% of all phthalates consumed in the U.S. areused in PVC products (Thornton 2000). In England,an estimated 98% of phthalates are used in PVC prod-ucts (OECD 2004). Thus, the disposal of PVC in land-fills can be expected to account for a substantial por-tion of the phthalates found in landfills. Phthalates area group of chemicals used as plasticizers to make theotherwise brittle PVC resin soft and flexible. The pro-portion of phthalates leaching from PVC in medicalwaste could be even higher given the prevalence of pli-able vinyl medical products, such as tubing and bags,that are disposed of as infectious medical waste (seeChapter 5).
PVC disposal contributes several toxic metals to thesolid waste stream, including compounds of lead, cad-mium and tin. These metals are added to PVC as stabi-lizers to help inhibit the plastic’s tendency to degrade inthe presence of sunlight or heat. Lead is still commonlyused in the plastic vinyl sheathing of wires and cables.Older vinyl mini-blinds also contain lead. Estimates ofthe amount of lead in solid waste attributable to PVCranges widely from a low of 1% to a high of 28% (CEC2000). One study found that 10% of the lead stabilizerfrom one type of flexible PVC cable containing a mix-ture of additives was released from the PVC(Mersiowski 1999). Lead in rigid PVC is expected to
CH
AP
TE
R
2:
T
HE
P
VC
G
EN
ER
AT
ION
:
La
rg
e
an
d
Gr
ow
ing
A
mo
un
ts
o
f
PV
C
Wa
st
e
13

stay encapsulated in the PVC waste (CEC 2000).Various organotin additives have replaced some use oflead and cadmium as a stabilizer in PVC. Organotinstabilizers are added to rigid packaging film, bottles,roofing and clear rigid construction sheeting andaccount for 9.3% of the stabilizers on the market (CEC2000). These estimates are based on European formu-lations of PVC that may differ slightly from those usedin the U.S.
Certain flexible PVC products are a source of the toxicmetal antimony in solid waste. Antimony trioxide(ATO) is added to PVC used in flexible electricalcables and roofing foils (an alternative to roofing felt onflat roofs) to inhibit the formation and spread of flamesduring a fire (UBA 2001, DEPA 1999). Antimony fromPVC would show up in electronic waste (cables) andconstruction and demolition debris (foils).
Other toxic and persistent organochlorine flame retar-dants are present in solid waste as a result of their usein PVC. These include chlorinated flame retardantssuch as chloroparaffins and phosphate esters, which areorganic phosphorus compounds that may also containchlorine in their chemical structure (UBA 2001).Chlorinated paraffins and antimony are added as aflame retardant formulation for some PVC textile fibersthat are resistant to soaking and weather (UBA 2001).
CH
AP
TE
R
2:
T
HE
P
VC
G
EN
ER
AT
ION
:
La
rg
e
an
d
Gr
ow
ing
A
mo
un
ts
o
f
PV
C
Wa
st
e
14
Toxic Substance Present in PVC
Chlorine
Phthalates
Lead
Cadmium
Tin (organotins)5
Antimony6
Organochlorines6
Use in PVC
Part of polymer; pure PVC is 57% chlorine
Added as plasticizer to make PVC soft and flexible
Added as a heat stabilizer to slow degradation
Added as a heat stabilizer to slow degradation
Added as a heat stabilizer to slow degradation
Added to enhance flame retardant effect ofchlorine in PVC
Added as a flame retardant to reduce risk ofignition and retard combustion
PVC's Contribution ofToxic Chemicals in MSW
38% - 67% of totalchlorine1,2 and at least 80%
of organic chlorine2
From 90 to 98%3
1% - 28%1
About 10%4
Unknown
Unknown
Unknown
Sources and Notes: 1 - CEC 2000; 2 - Thornton 2000 reports PVC makes up 50% to 67% of total chlorine and at least 80% of organically bound chlorine;3 - Thornton 2002, OECD 2004; since from 90 to 98% of phthalates consumed are used in PVC products, we assume an equal amount will end up in thewaste stream; 4 - Bertin 2000; 5 - Organotin compounds represent about 9.3% of European consumption of stabilizers (CEC 2000); and 6 - UBA 2001.
● ● ● ● ● Table 3 ● ● ● ● ●
PVC Increases the Toxicity of Municipal Solid Waste (MSW)

MAJOR FINDINGS
● The production of PVC poses serious envi-ronmental health threats due to the manu-facture of raw chemicals, including chlorine,cancer-causing vinyl chloride monomer(VCM) and ethylene dichloride (EDC).
● U.S. communities surrounding vinyl chloridechemical facilities, half of which are inLouisiana, suffer from serious toxic chemicalpollution of their groundwater supplies, sur-face waters and air. Residents of the townof Mossville, LA had dioxin levels in theirblood that were three times higher thannormal.
● PVC includes high amounts of toxic addi-tives, which are released during the use(and disposal) of the product, resulting inelevated human exposures to phthalates,lead, cadmium, tin and other chemicals.
● The use of PVC results in dioxin emissionsfrom PVC combustion which occurs regular-ly in the U.S due to 1 million annual firesthat burn buildings and vehicles—two sec-tors that consume large amounts of PVC inconstruction materials.
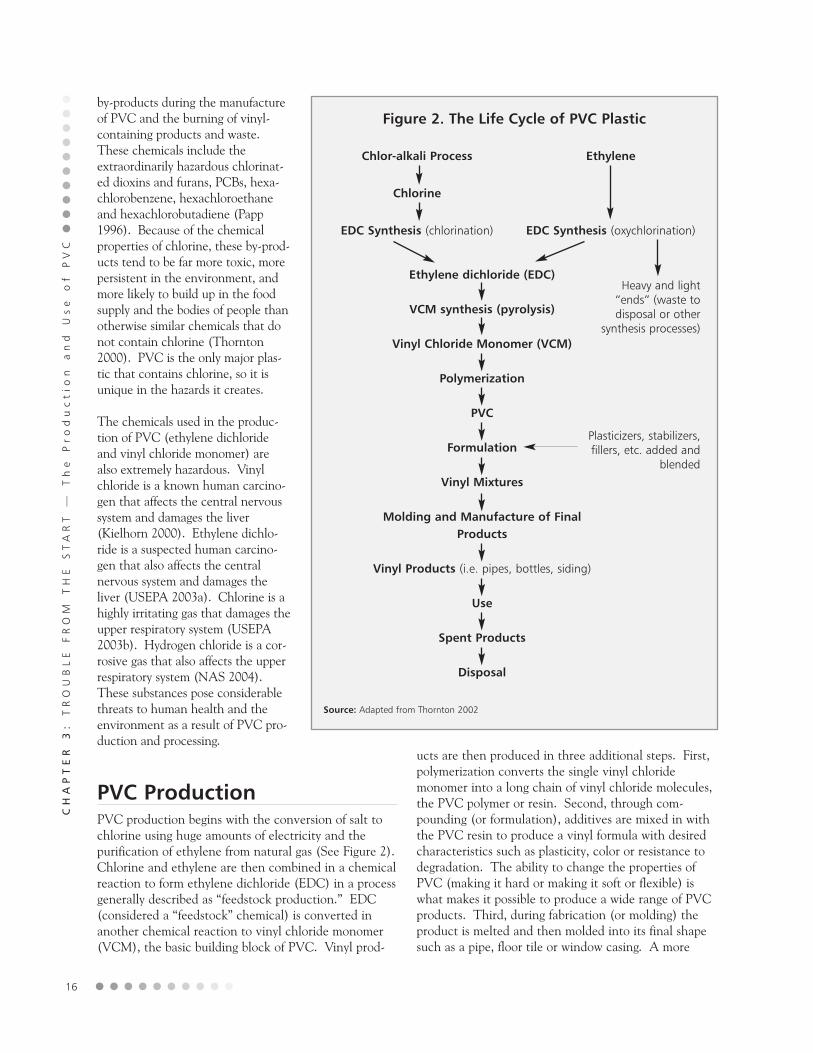
The Life Cycle of PVC The ‘life cycle’ of a product describes the stages that amaterial goes through from production to disposal. Thegeneral life cycle for PVC is shown in Figure 2.
PVC poses environmental and health threatsthroughout its life cycle, from the production of feed-stock chemicals to the final disposal of PVC products.Though some PVC products can pose direct healthrisks to consumers, most of the hazards associatedwith PVC occur during production and disposal. Anoverview of the hazards associated with PVC produc-tion, use, and disposal is shown in Table 4.
The major reason why PVC poses so many environmen-tal and health threats throughout its life cycle is becauseit contains large amounts of chlorine (Thornton 2000).Chlorine is a highly reactive substance that readily com-bines with carbon molecules, the building block of life inpeople and animals. Carbon is the most important ele-ment in living things because it combines with oxygen,nitrogen and hydrogen to produce stable molecules suchas DNA, proteins, hormones, sugars, starches and fatsthat are essential for life. Chlorine reacts readily withcarbon, altering the original molecules and their func-tions (Thornton 2000).
The chlorine in PVC and its feedstocks (ethylenedichloride and vinyl chloride monomer) results in thegeneration of very large amounts of chlorine-containing
PV
C:
B
ad
N
ew
s
Co
me
s
In
T
hr
ee
s
15
IIITROUBLE FROMTHE START
The Production and Use of PVC
by-products during the manufactureof PVC and the burning of vinyl-containing products and waste.These chemicals include theextraordinarily hazardous chlorinat-ed dioxins and furans, PCBs, hexa-chlorobenzene, hexachloroethaneand hexachlorobutadiene (Papp1996). Because of the chemicalproperties of chlorine, these by-prod-ucts tend to be far more toxic, morepersistent in the environment, andmore likely to build up in the foodsupply and the bodies of people thanotherwise similar chemicals that donot contain chlorine (Thornton2000). PVC is the only major plas-tic that contains chlorine, so it isunique in the hazards it creates.
The chemicals used in the produc-tion of PVC (ethylene dichlorideand vinyl chloride monomer) arealso extremely hazardous. Vinylchloride is a known human carcino-gen that affects the central nervoussystem and damages the liver(Kielhorn 2000). Ethylene dichlo-ride is a suspected human carcino-gen that also affects the centralnervous system and damages theliver (USEPA 2003a). Chlorine is ahighly irritating gas that damages theupper respiratory system (USEPA2003b). Hydrogen chloride is a cor-rosive gas that also affects the upperrespiratory system (NAS 2004).These substances pose considerablethreats to human health and theenvironment as a result of PVC pro-duction and processing.
PVC ProductionPVC production begins with the conversion of salt tochlorine using huge amounts of electricity and thepurification of ethylene from natural gas (See Figure 2).Chlorine and ethylene are then combined in a chemicalreaction to form ethylene dichloride (EDC) in a processgenerally described as “feedstock production.” EDC(considered a “feedstock” chemical) is converted inanother chemical reaction to vinyl chloride monomer(VCM), the basic building block of PVC. Vinyl prod-
ucts are then produced in three additional steps. First,polymerization converts the single vinyl chloridemonomer into a long chain of vinyl chloride molecules,the PVC polymer or resin. Second, through com-pounding (or formulation), additives are mixed in withthe PVC resin to produce a vinyl formula with desiredcharacteristics such as plasticity, color or resistance todegradation. The ability to change the properties ofPVC (making it hard or making it soft or flexible) iswhat makes it possible to produce a wide range of PVCproducts. Third, during fabrication (or molding) theproduct is melted and then molded into its final shapesuch as a pipe, floor tile or window casing. A more
CH
AP
TE
R
3:
T
RO
UB
LE
FR
OM
TH
ES
TA
RT
—
T
he
P
ro
du
ct
ion
a
nd
U
se
o
f
PV
C
16
Figure 2. The Life Cycle of PVC Plastic
Ethylene dichloride (EDC)
VCM synthesis (pyrolysis)
Vinyl Chloride Monomer (VCM)
Polymerization
PVC
Formulation
Vinyl Mixtures
Molding and Manufacture of FinalProducts
Vinyl Products (i.e. pipes, bottles, siding)
Use
Spent Products
Disposal
Chlor-alkali Process
Chlorine
EDC Synthesis (chlorination)
Ethylene
EDC Synthesis (oxychlorination)
Source: Adapted from Thornton 2002
Heavy and light“ends” (waste todisposal or other
synthesis processes)
Plasticizers, stabilizers,fillers, etc. added and
blended

detailed description of the production and manufactur-ing process for PVC can been found in numerous refer-ences (Thornton 2002, Thornton 2000).
In 2000, there were 12 facilities in the U.S. that pro-duced VCM (CEH 2000). Seven of these plants alsoproduced PVC. As of 2003, there were 24 facilitiesoperated by 12 companies that produced PVC resin inthe U.S. (CEH 2003) and an estimated 2,332 PVC fab-ricating facilities (ARCC 2003). These PVC produc-tion facilities released 811,000 pounds of VCM and
670,000 pounds of EDC into the environment in 2002(USEPA 2004). In addition, 6.5 million pounds ofVCM and 2.5 million pounds of EDC were sent off-siteto sewage treatment plants or waste treatment facilities(USEPA 2004). It should be noted that these are self-reported numbers that represent an absolute minimum.The actual releases are likely to be greater.
During production, most vinyl chloride releases are tothe air since it is a volatile gas. A smaller amount ofvinyl chloride monomer is released into groundwater or
CH
AP
TE
R
3:
T
RO
UB
LE
FR
OM
TH
ES
TA
RT
—
T
he
P
ro
du
ct
ion
a
nd
U
se
o
f
PV
C
17
Production
● Dioxin and mercury emissions and asbestos waste from chlorine production.
● Air emissions and wastewater releases from Ethylene Dichloride/Vinyl Chloride Monomer (VCM) production facilities.
● Dioxins and other organochlorines released as by-products of Ethylene Dichloride/Vinyl Chloride Monomer (VCM)production.
● Worker exposures to VCM.
● Incineration of production wastes.
Use
● Additives leach and otherwise migrate from PVC products (plasticizers/metal stabilizers).
● Accidental structure and vehicle fires release dioxins.
Disposal
Landfill
● Accidental landfill fires release dioxins.
● Additives, heavy metals and dioxins leach into groundwater.
● Gaseous emissions from additives.
Incineration
● Dioxins form when PVC is burned.
● Hydrochloric acid, toxic metals and dioxins are emitted to air.
● Ash, later stored in landfills, contains high levels of heavy metals and dioxins.
Recycling
● Diversity of additives prevents effective recycling of mixed PVC products and materials resulting in poor qualityproducts (downcycling).
● Low recycling rates (currently <1%).
● Contaminates other plastics during recycling as well as other valuable commodities that are targeted for recycling.
● Does not reduce the overall demand for raw materials to make plastics (virgin resin) and has no effect on theamount of vinyl produced each year.
● ● ● ● ● Table 4 ● ● ● ● ●
Overview of Hazards Associated with PVC Production, Use and Disposal

into wastewater discharged to nearby rivers andstreams. The wastes and emissions from productionfacilities are not limited to vinyl chloride. Dioxins areformed during the oxychlorination process, where chlo-rine is combined with ethylene gas (or ethylene, oxygenand hydrochloric acid) to form ethylene dichloride(EDC), the primary building block of the vinyl chloridemonomer (Evers 1989). Dioxins are also formed whenproduction wastes are incinerated. Incinerators, boilersand acid furnaces burn waste from the oxychlorinationprocess (especially relevant are wastes such as “heavyends” and distillation tars) and are responsible for thegreatest proportion of dioxin releases during PVC pro-duction (Thornton 2002). Using data provided by theVinyl Institute, the USEPA estimates that PVC-onlyproduction facilities were a documented source of diox-in air emissions (see Table 6) (USEPA 2001).
Mercury is used in the oldest and most energy intensiveprocess for producing chlorine (Thornton 2002). Thereare nine chlor-alkali facilities in the U.S. that still usemercury in their process, a 50-year-old technology(Steingraber 2004). Most of this mercury is reused atthe plant, but there are still significant air emissions,waste water releases and waste sludge generated(Thornton 2000). Only about 10% of chlorine produc-tion in the U.S. still uses mercury, though very little ofthe mercury-produced chlorine goes to the productionof ethylene dichloride or vinyl chloride monomer. Thechlorine industry is the largest consumer of mercury inthe country (Thornton 2000).
Mercury emissions at these plants are another environ-mental and public health concern (Steingraber 2004,USEPA 2003c) as mercury causes reproductive andneurological damage (NAS 2000). Mercury is a potentneurotoxin that accumulates primarily as methyl mer-cury, in aquatic food chains. The highest levels arefound in large predatory fish, such as tuna and sword-fish. Air emissions of mercury are transported throughthe atmosphere and eventually settle on land or surfacewater where natural bacterial processes transform someof the mercury into methyl mercury. Ingestion of mer-cury-contaminated fish is the primary route of exposureto methyl mercury. Neurodevelopmental toxicity canresult from the exposure of pregnant women and youngchildren to mercury, leading to learning disabilities inchildren (USEPA 2003c, NAS 2000).
Plants that manufacture ethylene dichloride and vinylchloride monomer are a risk to workers and residents ofsurrounding areas. In the early 1970’s, plants that man-ufactured vinyl chloride were found to be exposingworkers to levels of the chemical high enough to put
them at risk of developing a rare form of liver cancer—angiosarcoma. In 1974, the industry finally admittedthat workers exposed to vinyl chloride did develop thisrare form of liver cancer (Creech 1974). Residents ofcommunities near vinyl chloride production plants arealso affected by plant emissions. These plants dischargepollutants into nearby communities, contaminatingdrinking water and releasing dioxins into the air fromon-site incinerators. Besides cancer, workers and resi-dents alike are vulnerable to a range of ailments associ-ated with vinyl chloride exposure, including damage tothe liver, lungs, blood, nervous system, immune system,cardiovascular system, skin, bones and reproductive sys-tem (Kielhorn 2000, ATSDR 1997). More detailedanalyses of the human health and environmentalimpact of PVC production processes can be found innumerous references (Steingraber 2004, USEPA 2002,Kielhorn 2000, ATSDR 1997).
Although the levels of vinyl chloride and ethylenedichloride released from these facilities are lower todaythan in the past, exposure to these substances is still aconcern. There appears to be no safe level of exposurefor these substances, especially vinyl chloride. Both ofthese substances are considered to be “genotoxic”meaning that they cause irreversible damage to DNA(Kielhorn 2000). A generally accepted scientific theoryis that mutation in a single cell can result in cancer(Pitot 1991). Similarly, exposure to a genotoxic sub-stance can lead to DNA damage. This means there isno safe level of exposure to these substances and anyexposure increases the risk of developing cancer, a birthdefect or a genetic disorder. Thus, lower emissions fromvinyl chloride and ethylene dichloride facilities reduce,but do not eliminate, health and environmental risks.
The production and disposal of PVC poses dangers rele-vant to everyone, but often, particular groups of peopleare especially at risk. Plants that manufacture the eth-ylene dichloride and vinyl chloride monomer are oftenlocated in low-income areas or communities of color, asare incinerators that burn PVC waste and landfills thatstore PVC waste (Thornton 1997). These types of sitespose a threat. Community-based groups understandthe threat these facilities pose to their communities.The urgency of their opposition to these facilitiesspeaks to the intensity of the danger that they feel thesefacilities pose.
CH
AP
TE
R
3:
T
RO
UB
LE
FR
OM
TH
ES
TA
RT
—
T
he
P
ro
du
ct
ion
a
nd
U
se
o
f
PV
C
18
PVC UsePVC plastic used in consumer products is not a purematerial. By the time a product containing PVC reach-es your home, a wide range of chemicals have beenadded in order to change its properties to meet a widerange of product needs. These additives include stabiliz-
ers, plasticizers and fillers that are mixed in with, but arenot chemically bound to the PVC. A list of commonadditives found in PVC products is shown in Table 5.
The most important of these chemical additives are theplasticizers known as phthalates (pronounced ‘thal -eights’) and the metal stabilizers. Plasticizers are added
CH
AP
TE
R
3:
T
RO
UB
LE
FR
OM
TH
ES
TA
RT
—
T
he
P
ro
du
ct
ion
a
nd
U
se
o
f
PV
C
19
C A S E S T U D Y
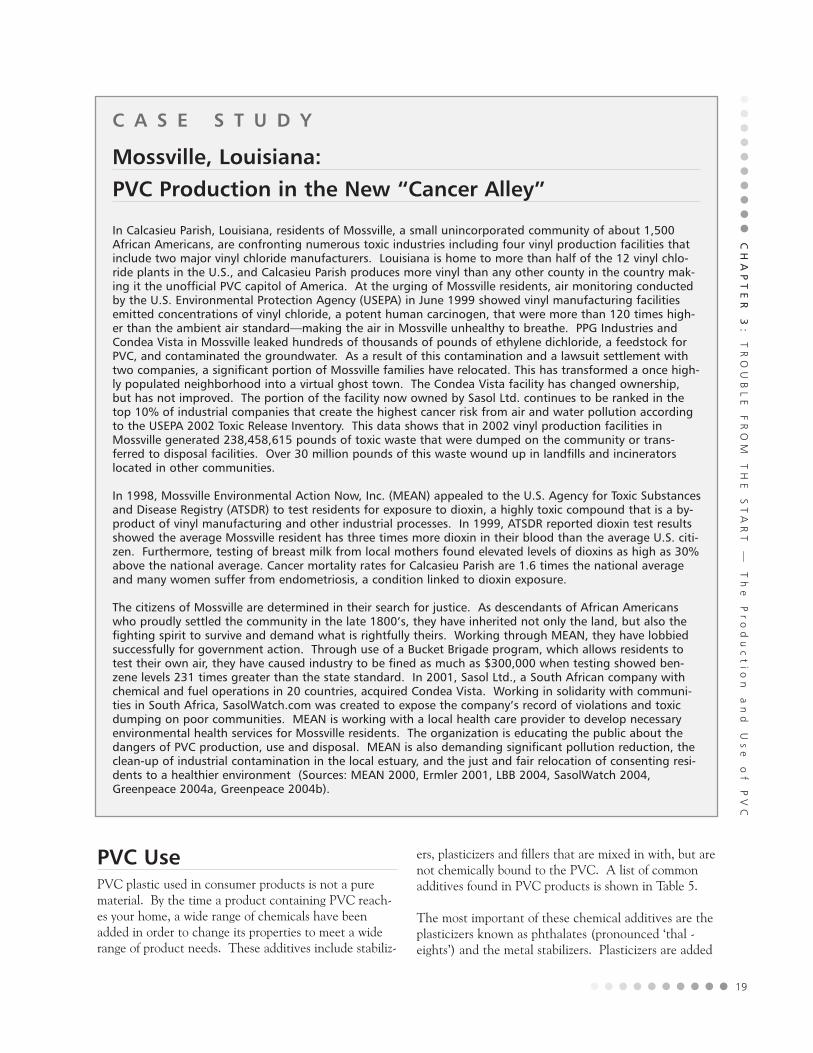
Mossville, Louisiana: PVC Production in the New “Cancer Alley”
In Calcasieu Parish, Louisiana, residents of Mossville, a small unincorporated community of about 1,500African Americans, are confronting numerous toxic industries including four vinyl production facilities thatinclude two major vinyl chloride manufacturers. Louisiana is home to more than half of the 12 vinyl chlo-ride plants in the U.S., and Calcasieu Parish produces more vinyl than any other county in the country mak-ing it the unofficial PVC capitol of America. At the urging of Mossville residents, air monitoring conductedby the U.S. Environmental Protection Agency (USEPA) in June 1999 showed vinyl manufacturing facilitiesemitted concentrations of vinyl chloride, a potent human carcinogen, that were more than 120 times high-er than the ambient air standard—making the air in Mossville unhealthy to breathe. PPG Industries andCondea Vista in Mossville leaked hundreds of thousands of pounds of ethylene dichloride, a feedstock forPVC, and contaminated the groundwater. As a result of this contamination and a lawsuit settlement withtwo companies, a significant portion of Mossville families have relocated. This has transformed a once high-ly populated neighborhood into a virtual ghost town. The Condea Vista facility has changed ownership,but has not improved. The portion of the facility now owned by Sasol Ltd. continues to be ranked in thetop 10% of industrial companies that create the highest cancer risk from air and water pollution accordingto the USEPA 2002 Toxic Release Inventory. This data shows that in 2002 vinyl production facilities inMossville generated 238,458,615 pounds of toxic waste that were dumped on the community or trans-ferred to disposal facilities. Over 30 million pounds of this waste wound up in landfills and incineratorslocated in other communities.
In 1998, Mossville Environmental Action Now, Inc. (MEAN) appealed to the U.S. Agency for Toxic Substancesand Disease Registry (ATSDR) to test residents for exposure to dioxin, a highly toxic compound that is a by-product of vinyl manufacturing and other industrial processes. In 1999, ATSDR reported dioxin test resultsshowed the average Mossville resident has three times more dioxin in their blood than the average U.S. citi-zen. Furthermore, testing of breast milk from local mothers found elevated levels of dioxins as high as 30%above the national average. Cancer mortality rates for Calcasieu Parish are 1.6 times the national averageand many women suffer from endometriosis, a condition linked to dioxin exposure.
The citizens of Mossville are determined in their search for justice. As descendants of African Americanswho proudly settled the community in the late 1800’s, they have inherited not only the land, but also thefighting spirit to survive and demand what is rightfully theirs. Working through MEAN, they have lobbiedsuccessfully for government action. Through use of a Bucket Brigade program, which allows residents totest their own air, they have caused industry to be fined as much as $300,000 when testing showed ben-zene levels 231 times greater than the state standard. In 2001, Sasol Ltd., a South African company withchemical and fuel operations in 20 countries, acquired Condea Vista. Working in solidarity with communi-ties in South Africa, SasolWatch.com was created to expose the company’s record of violations and toxicdumping on poor communities. MEAN is working with a local health care provider to develop necessaryenvironmental health services for Mossville residents. The organization is educating the public about thedangers of PVC production, use and disposal. MEAN is also demanding significant pollution reduction, theclean-up of industrial contamination in the local estuary, and the just and fair relocation of consenting resi-dents to a healthier environment (Sources: MEAN 2000, Ermler 2001, LBB 2004, SasolWatch 2004,Greenpeace 2004a, Greenpeace 2004b).

to PVC to “soften” the plastic and make it pliable forcertain applications. About 90% of all phthalates con-sumed in the U.S. (and about 98% in England) are usedin PVC products (Thornton 2002, OECD 2004).These plasticizers can make up a large portion, in somecases up to 60% by weight, of the vinyl product (DTI1995). Because these additives are not chemicallybound to the PVC, they will leach out over time(Thornton 2002).
Studies have shown plasticizers such as diethyl-hexylphthalate (DEHP) and diisononylphthalate(DINP) have migrated out of PVC containers used tostore food (CR 1998, DTI 1995); IV bags used to holdblood (Pearson 1993, Tickner 1999); toys (NET 1999,Stringer 1997); and numerous other products, expos-ing people to these toxic additives (DEPA 2001,Harmon 2001, HCWH 2002).
In some cases, these additives will evaporate or “off-gas” from PVC materials like flooring, wall covering orcarpeting, contaminating indoor air (CARB 1999,Rudell 2000, Uhde 2001). A study by the CaliforniaAir Resources Board measured forty target compoundsoff-gassing from PVC flooring. Phenol was found inthe air off-gassing from all the vinyl sheets evaluated.Tetrahydofuran, cyclohexanone, toluene and n-tride-cane were also found (CARB 1999). Another studyfound the degradation of plasticizers from PVC flooringwas likely responsible for an increase in adult asthmaas well as eye and skin symptoms in workers. Theprevalence of these symptoms decreased when thePVC flooring was removed (Tuomainen 2003). ASwedish study estimated that 42,000 tons of phthalatesare released from PVC products worldwide each year(DTI 1995). The familiar “new car” smell or the odorfrom a newly opened shower curtain represents therelease of phthalates evaporating from a PVC product(Thornton 2000).
Components of PVC have alsobeen found to leach from PVCpipes. Vinyl chloride has beenfound to leach from PVC pipesmade prior to 1977 (Yaw 1999).PVC pipes made prior to thistime had a high residue of vinylchloride that failed to bond whenthe vinyl chloride monomer waspolymerized into polyvinyl chlo-ride. In a study of unplasticizedPVC pipe, vinyl chloride wasdetected in water after 30 days at2.5 parts per billion (ppb), a levelthat exceeds the USEPA drinking
water standard of 1 ppb (Al-Malack 2000). Smallerpipe size, longer line length, and warm temperatures allincrease the likelihood of vinyl chloride leaching fromPVC pipes. Additional studies have found organotinstabilizers also leach from PVC pipes (Sadiki 1999,Sadiki 1996, Wu 1989, Forsyth 1997).
Phthalates have been shown to cause developmental andreproductive damage (NTP 2000), altered liver(Woodward 1990) and kidney function (Seth 1982) andhave been linked to the development of respiratory prob-lems in children (Jaakkola 1999, Oie 1997). Moredetailed information on the health and environmentalimpact of phthalates used in PVC products are availablefrom many resources (ATSDR 1997, HCWH 2002, Rossi2001).
Metal stabilizers are used in PVC to prevent degrada-tion from heat during processing and from exposure toultraviolet light during the useful life of a product (Pless2002). They include lead, cadmium, zinc, antimonyand the organotins (see Table 5). These metals willleach out of PVC products. Lead and cadmium werefound to leach out of children’s toys made with PVC(DiGangi 1997). Lead migrated out of PVC windowblinds (CT 1996) and into water carried in PVC pipes(DTI 1995). Lead is a known cause of neurodevelop-mental problems (USEPA 2004a). Cadmium causescancer and kidney damage (USEPA 2003d).
Organotin stabilizers (tributyltin, tetrabutyltin,monooctyltin, dioctyltin) were introduced to replacetoxic metal stabilizers like lead and cadmium, but theyhave also been found to leach from PVC products(Sadiki 1999, Harmon 2001). The organotins are alsotoxic. They affect the central nervous system, skin,liver, immune system and reproductive system (WHO1980, Pless 2002). The diorganotins, such as dioctyltin,are potent developmental toxins (Ema 1995, Pless
CH
AP
TE
R
3:
T
RO
UB
LE
FR
OM
TH
ES
TA
RT
—
T
he
P
ro
du
ct
ion
a
nd
U
se
o
f
PV
C
20
Stabilizers
Lead ● Cadmium ● Antimony ● Organotins ● Zinc
Plasticizers
Diethylhexylphthalate (DEHP) ● Diisononylphthalate (DINP)
Diisodecylphthalate (DIDP)
● ● ● ● ● Table 5 ● ● ● ● ●
Common Additives Found in PVC
Source: CEC 2000, DEPA 1995

2002) and potent teratogens (Noda 1993, Pless 2002).Tributyltin affects the nervous system, and has causedreproductive and developmental problems in animalstudies (Boyer 1989, ATSDR 1992).
Antimony trioxide (ATO) is added to PVC used inflexible electrical cables and roofing foils (an alternativeto roofing felt on flat roofs) to inhibit the formation andspread of flames during a fire (UBA 2001, DEPA 1999).For flame retardant applications, PVC accounted for32% of the European market for antimony trioxide in1998 (UBA 2001). The antimony, which is a synergistrather than a flame retardant, acts to enhance theflame retarding properties of chlorine in PVC.Antimony trioxide is a suspect human carcinogen wheninhaled and is toxic to the lungs, heart, eyes and skin(UBA 2001, NAS 2000a). During fires and wasteincineration, antimony dust and toxic antimony halidesare released. Antimony also catalyzes the formation ofdioxins and furans (UBA 2001).
Other flame retardants added to PVC include chlori-nated paraffins, phosphate esters (organic phosphoruscompounds some of which also contain chlorine orbromine) and aluminum trihydroxide (UBA 2001).These additives are used in high volumes but are alsoused in many other polymer applications in addition toPVC. Chlorinated paraffins and antimony are added asa flame retardant formulation for some PVC textilefibers that are resistant to soaking and weather (UBA2001). Chlorinated paraffins are complex mixtures ofshort-chain and long-chain hydrocarbons containing upto 70% chlorine. Chlorinated paraffins cause liver andkidney toxicity in animals while the short-chain mix-ture is an animal carcinogen and possible human car-cinogen (NAS 2000a). Chlorinated paraffins and phos-phate esters in PVC also function as secondary plasti-cizers (UBA 2001).
The phosphate ester flame retardants used in PVCinclude tris (2-chloroethyl) phosphate, tris (chloro-propyl) phosphate [TCCP], and tris (dichloropropyl)phosphate [TDCPP]. These compounds are added toPVC floor covering and are released as off-gassingoccurs from the vinyl (Marklund 2003). TDCPP waswidely used as a flame retardant in children’s sleepwearuntil May 1977, when it was withdrawn from the mar-ket after published reports that it was mutagenic in bac-teria (Sanders 1978). The use of TDCPP as a flameretardant may pose significant cancer risks and repro-ductive harm (testicular atrophy and decreased seminalvesicle secretions), according to a committee of topU.S. scientists (NAS 2000a). The German FederalEnvironmental Agency has recommended a reduction
in the use of TCCP in favor of safer substitutes, since ithas high environmental persistence with some evidenceof carcinogenicity. (UBA 2001).
Structural and Vehicle Fires Another hazard associated with the use of PVC pro-ducts arises when PVC is burned in an accidental fire.Not only are many building materials made from PVCbut it was once standard practice to use PVC to insulatewiring in buildings. In 1995, there were an estimated574,000 structural fires and another 406,000 vehiclefires in the U.S. (USEPA 2001). When the PVC inbuildings and vehicles burns, a variety of toxic sub-stances are formed that pose major public health risks.The primary combustion products are hydrogen chloridegas, carbon dioxide and carbon monoxide (OFM 1997).Hydrogen chloride gas is a corrosive and highly toxic gasthat can burn the skin and cause severe damage to theeyes and lungs. When hydrogen chloride comes in con-tact with the mucous lining of the lungs, it is convertedinto hydrochloric acid that can cause severe and perma-nent respiratory damage (IAFF 1995).
Accidental fires that burn PVC also generate phosgenegas, benzene, toluene, xylenes, dioxins, furans and otherproducts of incomplete combustion (IAFF 1995). Thepoor combustion conditions that are typical of these firesare ideal for the formation of dioxins and furans (TNO1996). Dioxins were found in the air, water, surface soiland nearby vegetation following the burning of a plasticsrecycling plant in Hamilton, Ontario (OMEE 1997). Inthe World Trade Center fires, dioxins and furans wereidentified as significant components of the smoke givenoff by the smoldering buildings (Landrigan 2004). InGermany, dioxin levels in indoor soot remaining after ahouse fire were found to be as high as 45,000 parts pertrillion (ppt) TEQ—more than 300 times the Germangovernment’s health standard (Fiedler 1993). After a fireat a plastics warehouse in Binghamton, NY, dioxin levelsin soils were found to be more than 100 times higherthan other areas of the community not impacted by thefire (Schecter 1996).
Firefighters and emergency responders are especially atrisk from smoke and gases generated by fires burningPVC. Exposure to combustion gases from building fireshas been linked to a high incidence of leukemia andlaryngeal and colon cancers in firefighters at young ages(Wallace 1990) and to other adverse health problemsincluding pulmonary hemorrhage and edema due tochemical pneumonitis (Schreiber 2003, Dyer 1976).This is one of the reasons why the International
CH
AP
TE
R
3:
T
RO
UB
LE
FR
OM
TH
ES
TA
RT
—
T
he
P
ro
du
ct
ion
a
nd
U
se
o
f
PV
C
21

Association of Fire Fighters sup-ports the use of alternative buildingmaterials that do not pose as high arisk as PVC (Duffy 1998).
The toxic gases generated whenPVC is burned in accidental fireshave resulted in deaths andinjuries, including workers exposedto toxic gases from burning electri-cal wires coated with PVC(Colardyn 1978); residents exposedto airborne toxics from a Hamilton,Ontario plastics recycling plant fire(Upshur 2001); and guests whodied in the MGM Grand Hotel firein Las Vegas (Buerk 1982). A sum-mary of the public health hazardsassociated with accidental fires thatburn PVC has been published else-where (Schreiber 2003).
PVC’s use to insulate wiring hasraised concerns not only for its usein buildings, but also in airplanes.The use of PVC insulation aroundwiring was once standard practicein airplanes. A typical airplane, forexample, could contain more than100 miles of PVC coated wiring(Ackerman 2003). Insulation ofthe wires is critical to air safety, butdefects in the insulation can lead toshort circuits and sparks that couldpotentially start a fire or spark anexplosion. If PVC wiring overheatsand starts to smolder, large amountsof smoke are generated and, ifmoisture is present, hydrochloricacid can be produced. Althoughthere is no proof that PVC insula-tion has ever caused an airplanecrash, concerns have been raisedabout older airplanes that still con-tain PVC-insulated wires. Use ofPVC wiring is now prohibited on new planes since PVCinsulation failed Federal Aviation Administration flam-mability tests (Ackerman 2003).
Accidental fires are unexpected, and thus difficult toregulate, but phasing out PVC could reduce the harmthey cause. If PVC was not so widely used as a buildingmaterial, accidental fires would not produce the toxiccombustion products that are specifically caused by the
burning of PVC. Both immediate and long-termimpacts would be lessened: firefighters and victims alikewould avoid exposure to the toxic gases and smokecaused by the fire, and the leftover ash would be largelyfree of these toxins as well.
CH
AP
TE
R
3:
T
RO
UB
LE
FR
OM
TH
ES
TA
RT
—
T
he
P
ro
du
ct
ion
a
nd
U
se
o
f
PV
C
22
C A S E S T U D Y
Illiopolis, Illinois: PVC Plant Explodes
On April 23, 2004, a PVC plant operated by Formosa Plastics inIlliopolis, Illinois exploded. A towering plume of smoke containingdioxins, hydrochloric acid, vinyl chloride and vinyl acetate could beseen for miles around. The explosion caused both power and waterto be cut off and over 900 people were evacuated from the commu-nity. People were stationed in makeshift shelters including the localshopping mall. The U.S. Chemical Safety and Hazard InvestigationBoard called the explosion the most serious the agency has investi-gated since it was founded in 1998. Four workers were killedinstantly and one died shortly after being hospitalized.
Nearly three months after the disaster, the Illinois EnvironmentalProtection Agency (IEPA) reported elevated levels of dioxin were foundin the soil at 12 of 13 sites sampled. Some samples reached levels of50 ppt—10 times higher than normal. Some areas tested were as faras 3 miles from the explosion. Residents are concerned about theconstant health risks posed by these hazardous sites. More testing isplanned. (Sources: Antonacci 2004, IEPA 2004, Steingraber 2004a).
C A S E S T U D Y
Montreal, Canada: PVC Fire and Firefighter Exposure
A 1993 fire in St. Terese, Canada at a plastics plant called Plastibec,Ltd consumed more than 15 tons of PVC. The plant manufacturedvinyl blinds and vinyl window frames. After burning for 18 hoursand forcing 250 people from their homes, the smoldering structurecontinued to emit thick black smoke. In the end, the fire producedbetween 40-85 grams of dioxins and furans, equal to the amountreleased by the pulp and paper industry in an entire year. Of the 50firefighters called out to the blaze, 6 were treated for smoke inhala-tion and more than 30 required medical treatment after beingexposed to the fumes (Source: Greenpeace 1994).

The Formation of Dioxin A major concern about PVC is the formation of dioxinduring production and during disposal through inciner-ation. The term ‘dioxin’ refers to a family of chemicalcompounds that are not intentionally made. They aregenerated as by-products during production and dispos-al of chlorinated compounds including PVC. There aremany forms (“congeners”) of dioxin, each with a differ-ent toxicity. The most toxic form is 2,3,7,8-tetra-chlorodibenzo-p-dioxin (TCDD), and is the standardagainst which the toxicity of all other forms of dioxin ismeasured. TCDD is a known human carcinogenaccording to the U.S. National Toxicology Program(USHHS 2002), World Health Organization (WHO1997) and U.S. Environmental Protection Agency(USEPA) (USEPA 2000). Dioxin is fat-soluble, whichmeans it will bioaccumulate in increasing concentra-tions as it moves up the food chain. Exposure to diox-ins is associated with reproductive and developmentalhealth problems, and has been shown to impairimmune system response and interfere with normal hor-mone function (Birnbaum 2003).
The PVC-Dioxin ConnectionThe relationship between PVC and the formation ofdioxins in incinerators is clear: PVC is a significantchlorine donor in the incineration process, spurring theformation of dioxins. The strongest evidence of this
PV
C:
B
ad
N
ew
s
Co
me
s
In
T
hr
ee
s
23
IVTHE DEADLYCONNECTION
PVC, Chlorine and Dioxin
MAJOR FINDINGS● When burned, PVC plastic, which contains
57% chlorine when pure, forms dioxins, ahighly toxic group of chemicals that build upin the food chain.
● The PVC content in the waste stream fed toincinerators has been linked to elevated lev-els of dioxins in stack air emissions andincinerator ash.
● PVC is the major contributor of chlorine tofour combustion sources— municipal solidwaste incinerators, backyard burn barrels,medical waste incinerators and secondarycopper smelters—that account for a signifi-cant portion of dioxin air emissions. In themost recent USEPA Inventory of Sources ofDioxin in the United States, these foursources accounted for more than 80% ofdioxin emissions to air (based on 1995 data).

comes from laboratory studies. The German EPAfound that burning waste that includes PVC or otherorganochlorines produced dioxins, while burning wastewithout PVC did not (Theisen 1991). Two Danishstudies found similar results (Vikelsoe 2000,Christmann 1989). In Japan, researchers found thatadding 4% PVC to a mixture of PVC-free materialincreased dioxin emissions ten fold (Ishibashi 2000).When PVC was added to a mixture of newspapers or tochlorine-free paper and burned, dioxin emissionsincreased significantly with chlorine and PVC content(Yasuhara 2001). In a similar study, dioxin levels in flyash were 200 to 1,200 times higher when PVC wasadded to a mixture of newspaper or chlorine-free plas-tics (Takasuga 2000). Several other studies foundincreased dioxin levels in fly ash or unburned residuewere correlated with increased PVC levels in the wastestream burned (Kopponen 1992, Kolenda 1994,Wunderli 2000).
When elemental chlorine was added to a mixture ofcoal and salt, dioxin levels were 130 times higher thanwhen the same mixture was burned without the chlo-rine (Mahle 1980). Adding PVC or chlorine gas tochloride-containing vegetable matter resulted inincreased dioxin formation (Liberti 1983). In anotherstudy, as the level of organochlorines in a waste streamincreased, so too did the amount of dioxins formed(Altwicker 1993). A study in Finland found that burn-ing perchloroethylene in a laboratory produced moredioxins, chlorobenzenes and chlorophenols than burn-ing sodium chloride (Halonen 1995).
There is also evidence from small-scale incineratorsthat support a relationship between burningorganochlorine compounds like PVC and dioxin forma-tion. The Danish EPA found that doubling the PVCcontent of an incinerator’s waste feed increases dioxinemissions by 32% (DEPA 1995). Conversely, reducingthe PVC feed results in a reduction in dioxin emissions.Researchers in Japan found that burning a mixture ofPVC and polyethylene produced large amounts of diox-ins (Tamade 2000, Yoneda 2000). A study conductedfor the Dutch Environment Ministry found that PVClevels in the waste stream increased dioxin levels in theair emissions (Kanters 1996). Other studies in both theU.S. (Wagner 1993) and Europe (Christmann 1989,Vesterinen 1996, Halonen 1993, Hutari 1996,Manninen 1996, Hatanaka 2000) have found a positivecorrelation between PVC content in a waste streamand dioxin emissions.
An excellent review of the evidence linking chlorinecontent in the waste stream and dioxin emissions has
been published (Costner 2001). This paper identified47 studies involving laboratory and pilot scale combus-tion system/processes; 12 studies involving small-scaleand other combustion systems/processes; and 31 studiesinvolving full-scale combustors that are relevant to therelationship of chlorine content and dioxin emissions.The author found that reduced chlorine content wascorrelated with reduced dioxin formation in all threestudy groups and concluded that there is “a compellingbody of evidence that dioxin formation in waste incin-erators decreases when chlorine input is reduced.”
The USEPA confirmed that PVC is a dioxin precursorin 1997 (USEPA 1997). They also acknowledged that,“several studies have identified strong correlationsbetween chlorine content and CDD/CDF[dioxin/furan] emissions during combustion tests.” Aspart of the Inventory of Sources of Dioxin developed bythe USEPA, the agency acknowledged that a “review ofexperimental data clearly indicates an associationbetween chlorine content of feed/fuels and … synthesisof CDDs and CDFs” (USEPA 2001). However, theagency concluded that the results on whether a rela-tionship between chlorine input and dioxin emissionsexists were not “unequivocal” and left it at that.
Additional insight into the relationship between PVCand dioxin emissions can be found by examining theUSEPA Inventory of Sources of Dioxin. Table 6 sum-marizes dioxin emissions from sources that includePVC. The table shows facilities that burn PVC areresponsible for most of the dioxin sources identified.Eight quantified air sources and eight non-quantifiedair sources are identified that include PVC as a chlorinecontributor in the waste stream. There are also quanti-fied releases to water and land from sources that clearlycontain PVC as a chlorine donor. In addition, quanti-fied sources such as tire burning and asphalt mixingplants may contain PVC when household garbage isburned with tires, or when PVC is added as “filler” inproducing asphalt. In fact, any process that burnshousehold garbage—including gasification or pyrolysis(systems that burn waste in the absence of oxygen) —can be expected to generate dioxin emissions in largepart due to the presence of PVC in the waste (BREDL2002). The table also shows a number of otherunquantified sources that may include PVC as a con-tributor to dioxin emissions. The data used to gener-ate these estimates were collected in 1995 and repre-sent the most recent data available on dioxin emissionsin the U.S. (USEPA 2001).
The top four quantified sources alone—municipal solidwaste incinerators, backyard barrel burning, medical
CH
AP
TE
R
4:
T
HE
DE
AD
LY
CO
NN
EC
TIO
N
—
PV
C,
C
hlo
rin
e
an
d
Dio
xin
24
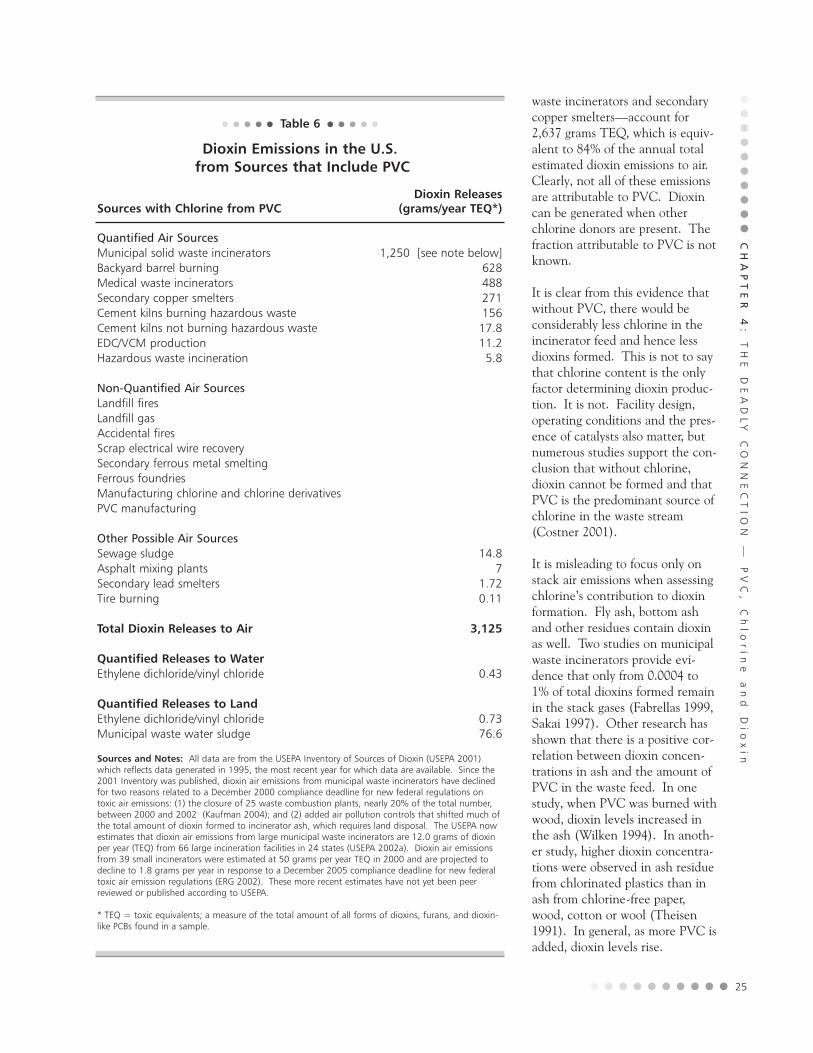
waste incinerators and secondarycopper smelters—account for2,637 grams TEQ, which is equiv-alent to 84% of the annual totalestimated dioxin emissions to air.Clearly, not all of these emissionsare attributable to PVC. Dioxincan be generated when otherchlorine donors are present. Thefraction attributable to PVC is notknown.
It is clear from this evidence thatwithout PVC, there would beconsiderably less chlorine in theincinerator feed and hence lessdioxins formed. This is not to saythat chlorine content is the onlyfactor determining dioxin produc-tion. It is not. Facility design,operating conditions and the pres-ence of catalysts also matter, butnumerous studies support the con-clusion that without chlorine,dioxin cannot be formed and thatPVC is the predominant source ofchlorine in the waste stream(Costner 2001).
It is misleading to focus only onstack air emissions when assessingchlorine’s contribution to dioxinformation. Fly ash, bottom ashand other residues contain dioxinas well. Two studies on municipalwaste incinerators provide evi-dence that only from 0.0004 to1% of total dioxins formed remainin the stack gases (Fabrellas 1999,Sakai 1997). Other research hasshown that there is a positive cor-relation between dioxin concen-trations in ash and the amount ofPVC in the waste feed. In onestudy, when PVC was burned withwood, dioxin levels increased inthe ash (Wilken 1994). In anoth-er study, higher dioxin concentra-tions were observed in ash residuefrom chlorinated plastics than inash from chlorine-free paper,wood, cotton or wool (Theisen1991). In general, as more PVC isadded, dioxin levels rise.
CH
AP
TE
R
4:
T
HE
DE
AD
LY
CO
NN
EC
TIO
N
—
PV
C,
C
hlo
rin
e
an
d
Dio
xin
25
● ● ● ● ● Table 6 ● ● ● ● ●
Dioxin Emissions in the U.S. from Sources that Include PVC
Dioxin Releases Sources with Chlorine from PVC (grams/year TEQ*)
Quantified Air SourcesMunicipal solid waste incinerators 1,250 [see note below]Backyard barrel burning 628Medical waste incinerators 488Secondary copper smelters 271Cement kilns burning hazardous waste 156Cement kilns not burning hazardous waste 17.8EDC/VCM production 11.2Hazardous waste incineration 5.8
Non-Quantified Air Sources Landfill firesLandfill gasAccidental firesScrap electrical wire recoverySecondary ferrous metal smeltingFerrous foundriesManufacturing chlorine and chlorine derivativesPVC manufacturing
Other Possible Air SourcesSewage sludge 14.8Asphalt mixing plants 7Secondary lead smelters 1.72Tire burning 0.11
Total Dioxin Releases to Air 3,125
Quantified Releases to WaterEthylene dichloride/vinyl chloride 0.43
Quantified Releases to Land Ethylene dichloride/vinyl chloride 0.73Municipal waste water sludge 76.6
Sources and Notes: All data are from the USEPA Inventory of Sources of Dioxin (USEPA 2001)which reflects data generated in 1995, the most recent year for which data are available. Since the2001 Inventory was published, dioxin air emissions from municipal waste incinerators have declinedfor two reasons related to a December 2000 compliance deadline for new federal regulations ontoxic air emissions: (1) the closure of 25 waste combustion plants, nearly 20% of the total number,between 2000 and 2002 (Kaufman 2004); and (2) added air pollution controls that shifted much ofthe total amount of dioxin formed to incinerator ash, which requires land disposal. The USEPA nowestimates that dioxin air emissions from large municipal waste incinerators are 12.0 grams of dioxinper year (TEQ) from 66 large incineration facilities in 24 states (USEPA 2002a). Dioxin air emissionsfrom 39 small incinerators were estimated at 50 grams per year TEQ in 2000 and are projected todecline to 1.8 grams per year in response to a December 2005 compliance deadline for new federaltoxic air emission regulations (ERG 2002). These more recent estimates have not yet been peerreviewed or published according to USEPA.
* TEQ = toxic equivalents; a measure of the total amount of all forms of dioxins, furans, and dioxin-like PCBs found in a sample.

Nonetheless, most studies focus on dioxin concentra-tions in stack gas as a means of assessing the relation-ship between chlorine and dioxin. The fact that manystudies examining miniscule dioxin concentrations inthis hard-to-measure source still find a positive correla-tion between chlorine and dioxin testifies to thestrength of the relationship.
Despite this compelling body of evidence, the ChlorineChemistry Council (CCC) has aggressively argued thatthere is no relationship between PVC content anddioxin emissions from incinerators. The industry’sprime support for this claim is a study funded by theVinyl Institute, a member of the CCC, conducted by anindustry consultant and published by the AmericanSociety of Mechanical Engineers (ASME). This studyexamined data from 169 facilities and concluded thatthere was “little or no correlation between chlorineinput and dioxin emissions from incinerators” (Rigo1995). This study has been critiqued and its methodol-ogy shown to be invalid (Thornton 2002, Costner 2000,Costner 1997, Chien 2003). In addition, the conclu-sions of the ASME study were refuted at a workshopheld by the USEPA in 1996 on Dioxin FormationProcesses and Sources (Costner 2000).
Furthermore, a memo prepared prior to the release ofthe ASME study by the public relations firm Nichols-Desenhall Communications (under contract to the
Vinyl Institute) calls into question the derivation andperhaps the integrity of the ASME study. This memolaid out a strategy to diffuse any connection betweenchlorine content/PVC and dioxin emissions made bythe USEPA as part of their Dioxin Reassessment effort.The memo recommends the Vinyl Institute fund an“independent” scientific study to “debunk” theUSEPA’s claim about the positive relationship betweenPVC and dioxin emissions (Burnett 1994). This studyturned out to be the one conducted under contractwith the consulting firm of Rigo & Rigo Associatesunder the auspices of ASME. An internal VinylInstitute memo described the role of the ASME, “Thepurpose of the ASME as the contractor is to provideunassailable objectivity to the study …” (Goodman1994). In this same memo, Rigo was described as “…willing to set his priorities to our needs, and he appearssympathetic to Plastics, Vinyl, PVC and Cl2 ...”Additional details on these memos have beendescribed elsewhere (Thornton 2002).
PVC is the primary source of chlorine in the wastestream. Eliminating PVC would dramatically reduce theamount of chlorine being burned, and thereby limitdioxin formation. Given the abundant evidence impli-cating chlorine as an essential precursor to dioxin forma-tion, it is important to reduce if not eliminate the levelsof PVC in the waste stream. Banning PVC would bethe most effective means of achieving this goal.
CH
AP
TE
R
4:
T
HE
DE
AD
LY
CO
NN
EC
TIO
N
—
PV
C,
C
hlo
rin
e
an
d
Dio
xin
26

MAJOR FINDINGS● More than 100 municipal waste incinerators
in the U.S. burn 500 to 600 million poundsof PVC each year, forming highly toxic diox-ins and releasing toxic additives to the airand in ash disposed of on land.
● The largest PVC-burning states includeMassachusetts, Connecticut, Maine—whichall burn more than half of their waste—Florida, New York, Virginia, Pennsylvania,Maryland, Minnesota, Michigan, New Jersey,Indiana and Washington.
● The incineration of medical waste, which hasthe highest PVC content of any wastestream, is being steadily replaced by cleanernon-burn technologies.
● Open burning of solid waste, which containsPVC, is a major source of dioxin air emissionsand dioxin-laden ash, as well as other dan-gerous pollutants.
● Backyard burning of PVC-containing house-hold trash is not regulated at the federallevel and is poorly regulated by the states—it is completely unrestricted in Michigan andPennsylvania, partially restricted in 30 statesand banned in 18.
When PVC is burned in municipal and medical wasteincinerators, dioxins and other toxic gases are formedand heavy metals present in the waste are released intothe air and residual ash. Dioxins are also releasedwhen residents in rural areas dispose of their trash byburning it in small furnaces or barrels behind theirhomes, and when PVC products or waste are burned inbuilding, vehicle and landfill fires.
Municipal Waste IncineratorsIncineration, or high-temperature burning, is frequentlyused to dispose of municipal, hazardous and medicalwastes. Because PVC is a widely used plastic (especial-ly in medical applications), the waste burned in theseincinerators inevitably contains PVC. As discussedearlier, the chlorine in PVC facilitates the formation ofdioxins and other chlorinated organic compounds thatare subsequently released to the environment (Costner2001). Thus, incinerators are a major source of dioxinsreleased to the air and land, and PVC is largely respon-sible for this situation.
Municipal waste or household trash incinerators areconsidered the largest source of dioxin emissions in air(USEPA 2001). The most recent inventory of dioxinsources in the U.S. estimated municipal and medicalwaste incinerators together account for 55% of all diox-in releases to air (40% and 15%, respectively) (USEPA2001). Dioxin air emissions have since declined as
PV
C:
B
ad
N
ew
s
Co
me
s
In
T
hr
ee
s
27
VDON’T BURN ITThe Hazards of
Burning PVC Waste
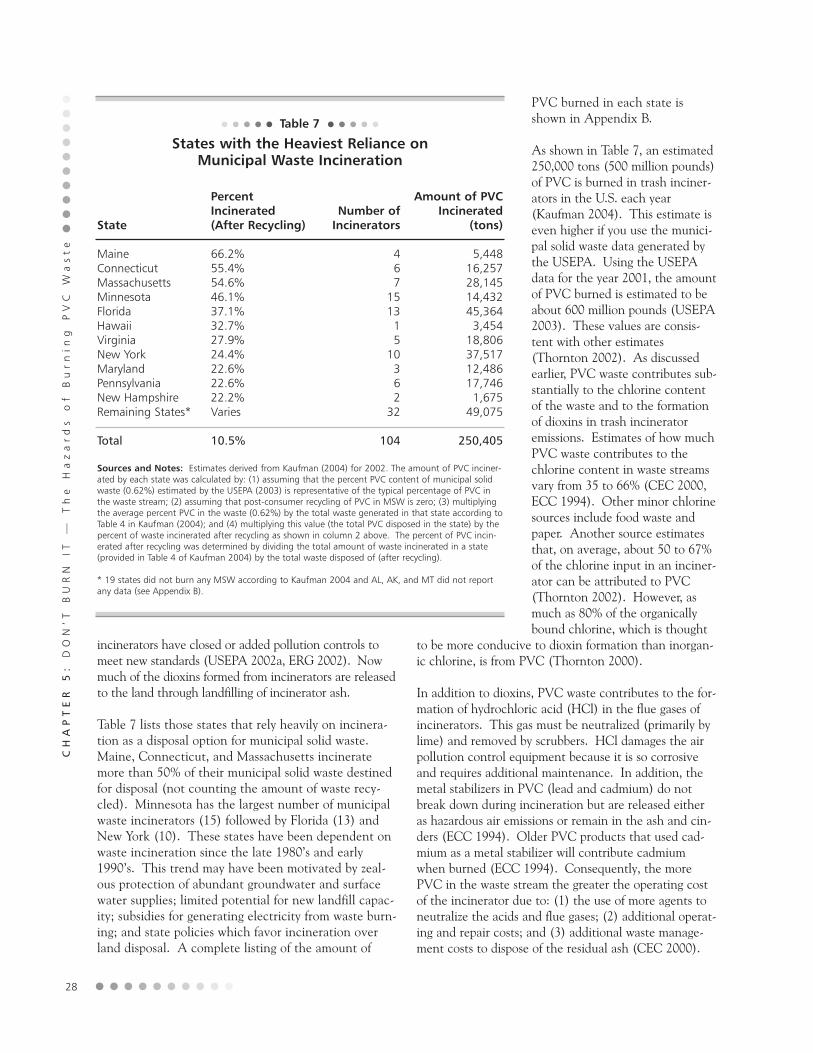
incinerators have closed or added pollution controls tomeet new standards (USEPA 2002a, ERG 2002). Nowmuch of the dioxins formed from incinerators are releasedto the land through landfilling of incinerator ash.
Table 7 lists those states that rely heavily on incinera-tion as a disposal option for municipal solid waste.Maine, Connecticut, and Massachusetts incineratemore than 50% of their municipal solid waste destinedfor disposal (not counting the amount of waste recy-cled). Minnesota has the largest number of municipalwaste incinerators (15) followed by Florida (13) andNew York (10). These states have been dependent onwaste incineration since the late 1980’s and early1990’s. This trend may have been motivated by zeal-ous protection of abundant groundwater and surfacewater supplies; limited potential for new landfill capac-ity; subsidies for generating electricity from waste burn-ing; and state policies which favor incineration overland disposal. A complete listing of the amount of
PVC burned in each state isshown in Appendix B.
As shown in Table 7, an estimated250,000 tons (500 million pounds)of PVC is burned in trash inciner-ators in the U.S. each year(Kaufman 2004). This estimate iseven higher if you use the munici-pal solid waste data generated bythe USEPA. Using the USEPAdata for the year 2001, the amountof PVC burned is estimated to beabout 600 million pounds (USEPA2003). These values are consis-tent with other estimates(Thornton 2002). As discussedearlier, PVC waste contributes sub-stantially to the chlorine contentof the waste and to the formationof dioxins in trash incineratoremissions. Estimates of how muchPVC waste contributes to thechlorine content in waste streamsvary from 35 to 66% (CEC 2000,ECC 1994). Other minor chlorinesources include food waste andpaper. Another source estimatesthat, on average, about 50 to 67%of the chlorine input in an inciner-ator can be attributed to PVC(Thornton 2002). However, asmuch as 80% of the organicallybound chlorine, which is thought
to be more conducive to dioxin formation than inorgan-ic chlorine, is from PVC (Thornton 2000).
In addition to dioxins, PVC waste contributes to the for-mation of hydrochloric acid (HCl) in the flue gases ofincinerators. This gas must be neutralized (primarily bylime) and removed by scrubbers. HCl damages the airpollution control equipment because it is so corrosiveand requires additional maintenance. In addition, themetal stabilizers in PVC (lead and cadmium) do notbreak down during incineration but are released eitheras hazardous air emissions or remain in the ash and cin-ders (ECC 1994). Older PVC products that used cad-mium as a metal stabilizer will contribute cadmiumwhen burned (ECC 1994). Consequently, the morePVC in the waste stream the greater the operating costof the incinerator due to: (1) the use of more agents toneutralize the acids and flue gases; (2) additional operat-ing and repair costs; and (3) additional waste manage-ment costs to dispose of the residual ash (CEC 2000).
CH
AP
TE
R
5:
D
ON
’T
B
UR
N
IT
—
Th
e
Ha
za
rd
s
of
B
ur
nin
g
PV
C
Wa
st
e
28
State
MaineConnecticutMassachusettsMinnesotaFloridaHawaiiVirginiaNew YorkMarylandPennsylvaniaNew HampshireRemaining States*
Total
PercentIncinerated(After Recycling)
66.2%55.4%54.6%46.1%37.1%32.7%27.9%24.4%22.6%22.6%22.2%Varies
10.5%
Number ofIncinerators
467
151315
10362
32
104
Amount of PVCIncinerated
(tons)
5,44816,25728,14514,43245,3643,454
18,80637,51712,48617,7461,675
49,075
250,405
Sources and Notes: Estimates derived from Kaufman (2004) for 2002. The amount of PVC inciner-ated by each state was calculated by: (1) assuming that the percent PVC content of municipal solidwaste (0.62%) estimated by the USEPA (2003) is representative of the typical percentage of PVC inthe waste stream; (2) assuming that post-consumer recycling of PVC in MSW is zero; (3) multiplyingthe average percent PVC in the waste (0.62%) by the total waste generated in that state according toTable 4 in Kaufman (2004); and (4) multiplying this value (the total PVC disposed in the state) by thepercent of waste incinerated after recycling as shown in column 2 above. The percent of PVC incin-erated after recycling was determined by dividing the total amount of waste incinerated in a state(provided in Table 4 of Kaufman 2004) by the total waste disposed of (after recycling).
* 19 states did not burn any MSW according to Kaufman 2004 and AL, AK, and MT did not reportany data (see Appendix B).
● ● ● ● ● Table 7 ● ● ● ● ●
States with the Heaviest Reliance on Municipal Waste Incineration
Waste incineration has been linked to a number of seri-ous health problems in plant workers, as well as in sur-rounding communities. Many of these troubles impli-cate PVC as the root source of contamination. Forinstance, workers in incinerator plants have increasedlevels of chlorinated phenols and lead in their body tis-sues, which may result from PVC, as well as mercuryand arsenic (Allsopp 2001). The USEPA has reportedthat metals emissions in incinerators rise when thechlorine content of the waste rises. In one study, met-als were up to seven times higher when the chlorinecontent of the waste was increased from 0 to 8.3%(Carroll 1989). Elevated chlorine content levels alsoimpair the efficiency of the scrubber (an air pollutioncontrol device) to remove metals from stack gases(Carroll 1989). Incinerator operators are not the onlyexposed group. Populations living near incinerators areparticularly vulnerable to elevated levels of dioxins andheavy metals in tissue and blood, as well as to respirato-ry ailments and cancers (Allsopp 2001). Elevated levelsof congenital abnormalities have also been observed innewborns in areas in the immediate vicinity of incinera-tion plants (ten Tusscher 2000).
Even distant populations are at risk, as toxic air releasessettle on crops and these crops are transported to otherareas and/or eaten by livestock which, in turn, are con-sumed by people (Cohen 1998, Cohen 1995). A studyby Barry Commoner and researchers at Queens Collegein New York found Inuit Native peoples living in thenorthern reaches of Canada, miles from any sources ofdioxin, had high levels of dioxin in their bodies(Commoner 2000). These researchers also found diox-ins released from incinerators and other dioxin sourceshundreds of miles away in the U.S. and lower Canadawere transported by wind currents to the far reaches ofthe globe.
A common argument in favor of incinerators is thatthey significantly reduce the weight and volume ofwaste going to landfills. While waste volume is reducedby about 45 to 50%, this statement only tells part of thestory. The fly ash captured by the air pollution controlequipment and the residual ash left in the burner mustbe disposed of in landfills and is often more toxic thanthe original raw waste. This is the result of burningmetal-containing materials (including PVC), chlorine-containing PVC waste that generates dioxins, and otherdifficult to burn waste. This ash is stored in landfills,and often leaches into surrounding soil and water.Incineration may indeed reduce the volume of wastegoing to landfills, but in doing so, this practice shifts thewaste burden to air releases and increases the toxicityof the waste that will eventually be landfilled in the
form of ash. Incineration is not a solution to waste dis-posal, especially not for PVC-containing waste.
Medical Waste Incinerators Incineration of medical waste involves the burning ofsolid waste generated primarily by hospitals andresearch facilities. PVC accounts for 5 to 15% of med-ical waste (DTI 1995, Hasselriis 1993, Marrack 1988,USOTA 1988). Medical products made of, or contain-ing, PVC include surgical gloves, dialysis tubing, blisterpacks, inhalation masks, IV bags/tubing, mattress coversand blood bags. Even non-medical products containingPVC (e.g., office supplies) are often burned along withmedical trash.
As the overall volume of waste generated by hospitalshas increased over the past 50 years, so has the propor-tion of that waste containing PVC. In 1996, PVCaccounted for 27% of all plastic used in durable anddisposable medical products (Rossi 2000). This growthin the use and disposal of vinyl medical products hasled to increased chlorine input to medical waste incin-erators and thus greater dioxin formation. In 2001, theUSEPA cited medical waste incinerators as the 3rdlargest source of dioxin releases to the environment inthe U.S (USEPA 2001).
In 1990, roughly 70% of U.S. hospitals used on-siteincinerators (USOTA 1990). According to theUSEPA, the number of medical waste incinerators oper-ating in the U.S. dropped roughly in half from 1987 to1995 (USEPA 2001). Similarly, the amount of medicalwaste burned in these incinerators dropped from anestimated 1.43 billion kilograms (kg) in 1987 to 0.77billion kg in 1995. Today there are substantially fewermedical waste incinerators operating (USEPA 2004b).Some of this drop is due to new regulations that havegone into effect, which increased operating costs(USEPA 2000a). But the work of activist grassroots cit-izen organizations and national groups like Health CareWithout Harm have played a major role in shuttingdown medical waste incinerators and encouraging theuse of non-incineration treatment technologies(HCWH 2001, Lester 2003).
Hospital waste primarily consists of general solid waste(70%), medical waste (17%), patient waste (9%) and asmall amount of hazardous waste (2%). Approximately15% of this waste is considered to be infectious waste(HCWH 2001), which requires treatment to disinfectthe waste but not necessarily incineration. Viable alter-natives to incineration exist for the disposal of the
CH
AP
TE
R
5:
D
ON
’T
B
UR
N
IT
—
Th
e
Ha
za
rd
s
of
B
ur
nin
g
PV
C
Wa
st
e
29

remaining 98% of medical wastethat is non-pathological. Much ofthis waste is paper, cardboard, plas-tic, metals and general solid wastethat does not need to be burned.
The most prominent alternative fortreating hospital waste is autoclav-ing—a process that disinfects thebiological waste component. Othertreatment methods includemicrowaving, electro-thermal deac-tivation, gasification, chemical dis-infection and thermal treatment(HCWH 2001). Yet even thesealternatives do not address theunderlying problem, the initial useand generation of PVC wastes. Abetter solution is to replace PVCproducts with non-chlorinated plas-tics.
Given the finding in recent studiesthat flexible PVC products used inhospitals (like dialysis tubing) leachtoxic additives into patients’ bodies(USFDA 2001, NTP 2000), theimperative to employ alternatives isstronger than ever. Additivesmixed in with PVC to make it flexi-ble or rigid are not chemicallybound to the plastic and are thusprone to leach from the material.One such additive, a phthalatecalled 2-diethylhexyl phthalate(DEHP), has been found to leachfrom soft plastic, and has been doc-umented to have a significantimpact on the development of themale reproductive system and theproduction of normal sperm inyoung animals (Moore 2001). Alsolinked with DEHP exposure is res-piratory distress, changes in kidneyand liver function, ovarian dysfunc-tion and decreased hormone pro-duction in females (Rossi 2001).
Open BurningPerhaps the most under appreciatedsource of dioxin emissions is theopen burning of household trash.
CH
AP
TE
R
5:
D
ON
’T
B
UR
N
IT
—
Th
e
Ha
za
rd
s
of
B
ur
nin
g
PV
C
Wa
st
e
30
C A S E S T U D Y
Detroit, Michigan: Henry Ford HospitalMedical Waste Incinerator
In February 2000, residents of a predominately African-Americancommunity in Detroit, Michigan succeeded in their efforts to shutdown Henry Ford Hospital’s medical waste incinerator. Since itbegan operating in 1980, the facility had been burning approxi-mately 6 million pounds of waste annually. As of 1998, Henry Fordwas the only hospital (of 25 surveyed) still burning medical waste inan on-site incinerator. Environmental justice was a primary concern:the Henry Ford Hospital System owns two other hospitals located inpredominately white suburbs that send their waste to a commercialautoclave facility in Toledo, Ohio rather than burn it. This inconsis-tency fueled local activists.
The Henry Ford Hospital incinerator was a major, chronic polluter.For instance, the only emission controls in place were opacity limits,which do not involve emissions testing, but use a visual estimate ofhow ‘opaque’ a cloud of smoke emitted from the stack is. And eventhose limits had been violated on a number of occasions. Federalpollution controls on emissions of mercury, dioxins and heavy metalshad not yet been implemented in Michigan, so the facility burnedmedical and other waste largely without regulation. The impact onpublic health was consequently severe. A five year long MichiganDepartment of Community Health study found the rate of childrenhospitalized for asthma in the zip codes immediately surroundingthe incinerator to be three times that of neighboring Wayne County.Moreover, a report commissioned by the New York UniversityResearch Program focusing on Ambulatory Care Sensitive Conditionsin Michigan from 1983 through 1994 found that in the four zipcodes surrounding the incinerator, the average hospital admissionsof children aged zero to four were four times the state average.
A coalition of more than a dozen organizations including DetroitersWorking for Environmental Justice, Virginia Park Citizen’s DistrictCouncil, a local Sierra Club chapter, and the Sugar Law Center forEconomic and Social Justice worked together for four years beforesuccessfully closing the incinerator in the spring of 2000. Strategiesincluded civil disobedience, media attention and coalition building.Yard signs helped draw attention to the fight, and a constant bar-rage of phone calls and postcards to hospital officials ensured resi-dents’ concerns would not be ignored. Steady, targeted pressure onexecutives within Henry Ford Hospital System was a major factor inthe eventual shutdown of the incinerator (Sources: Lott 2004,Holden 1999, Bates-Rudd 2000).

Open burning, also called uncon-trolled burning or backyard burning,involves the burning of householdtrash by residents on their property.Burning typically occurs in a burnbarrel, open fireplace or furnace,homemade burn box, wood stove,outdoor boiler or open pit (USEPA2003e). Most backyard burningoccurs in rural areas where there isno curbside trash pickup.According to government surveys,an estimated 20 million people inrural areas burn trash in their back-yards (MDEQ 2003).
The smoke and vapors from theopen burning of household trashcontain many toxic chemicals thatcan affect people’s health and theenvironment, including dioxins andfurans; carbon monoxide; heavymetals such as mercury, lead,arsenic, and cyanide; volatile organ-ic compounds (VOCs) such as ben-zene, styrene, and formaldehyde;particulates; polycyclic aromatichydrocarbons (PAHs); and hexa-chlorobenzene (USEPA 2003f,MDEQ 2003). Exposure to thesechemicals have been linked toadverse health problems including,but not limited to asthma, lungcancer, and other respiratory ail-ments, kidney and liver damage,and nervous system, reproductiveand developmental disorders(USEPA 2003g). One study foundemissions were highest for VOCssuch as benzene and styrene,formaldehyde, hydrogen cyanideand hydrochloric acid, followed bypolychlorinated biphenyls (PCBs)and arsenic (MDEQ 2003).
Among the toxic byproducts ofbackyard waste burning, dioxinsand furans may pose the greatestpublic health threat. Dioxins arehighly toxic even at low levels andhave been linked to serious healthproblems in people that includecancer and adverse developmentaland reproductive effects (USEPA
CH
AP
TE
R
5:
D
ON
’T
B
UR
N
IT
—
Th
e
Ha
za
rd
s
of
B
ur
nin
g
PV
C
Wa
st
e
31
C A S E S T U D Y
Oakland, California: IES Medical Waste Incinerator
On December 10, 2001, after a 4-year struggle, IntegratedEnvironmental Systems (IES) was forced to shut down its commer-cial medical waste incinerator in Oakland, California. Even under“perfect” operating conditions, the incinerator was known to emitdioxins, mercury and other toxic pollutants. The facility was alsonotorious for all kinds of permit violations including excess emis-sions, broken monitors, odors, uncontrolled bypasses of the pollu-tion control devices and worker safety violations.
The Coalition for Healthy Communities and Environmental Justice,consisting of Oakland residents and community, health, and environ-mental justice organizations, formed to bring an end to the IES incin-erator. After having ignored emissions and permit violations for years,the Bay Area Air Quality Management District finally took action bydeclining to renew the facility’s operating permit in 2001. When IESinsisted on its intentions to keep burning millions of pounds of med-ical and non-medical waste every year, a powerful direct action wasplanned and executed by the Coalition. Community protestersblocked the entrance to the IES incinerator for eight hours nonviolent-ly putting their bodies in front of trucks carrying waste.
Owing largely to the community’s powerful voices and actions, IESsold its company to competitor Stericycle in December 2001 who isreportedly planning to tear down the incinerators and close thefacility (Sources: Greenaction 2001, Greenaction 2001a).
C A S E S T U D Y
Gila River Indian Reservation, Arizona: Stericycle Medical Waste Incinerator
Members of the Gila River Indian community near Chandler, Arizonaorganized as the Gila River Alliance for a Clean Environment and suc-ceeded in forcing Stericycle to shut down a medical waste incineratoroperating on tribal land in 2002. The incinerator had been burningmedical and non-medical waste from several states for about 10years, and was among the largest in the U.S. Waste from hospitals,medical and dental offices, mortuaries and research institutes wasamong the waste being burned. When Stericycle’s lease for the facil-ity came up for renegotiation, activists seized the opportunity topush for cleaner technologies like autoclaving. The renegotiatedlease will allow only an autoclave on the site. With the closure ofthis facility, there are now no commercial medical waste incineratorsin Arizona, Nevada, or California (Source: Greenaction 2002).

2003g, Birnbaum 2003). Dioxins areformed primarily because of lowcombustion temperatures, poor airdistribution, and the presence ofchlorine (USEPA 2003h). Themajority of chlorine in householdtrash comes from PVC plastic.Because the emissions from openburning are released close to theground, they are particularly danger-ous to people and animals locatednearby. There are also no pollutioncontrol devices on these burners.
The backyard burning of householdtrash also produces residual ash thatcontains toxic metals such as lead,chromium, mercury and arsenic, aswell as PCBs and dioxins (USEPA2003f, Lemieux 1998). The ash leftover from the burning is often usedby homeowners in gardens or placedin areas where children may play andcome in contact with these toxicsubstances. In gardens, vegetablescan absorb and accumulate the met-als (USEPA 2003f).
Open burning was not initially iden-tified by the USEPA as a source ofdioxin (USEPA 1998). Now theagency has identified open burningas a major source of dioxins. TheUSEPA’s most recent Inventory ofSources of Dioxin estimated openburning may account for as much as628 grams TEQ dioxin, making itthe second largest source of dioxinemissions in the U.S. (USEPA 2001).The USEPA found a single house-hold burn barrel may release moretoxic chemicals into the air than amunicipal waste incinerator burning200 tons of household trash a daythat is equipped with state-of-the-artair pollution control devices (Lemieux 1998).
A key study used by the USEPA to estimate theamount of dioxins generated by open burning of house-hold trash was published in 1998 by a New Yorkresearcher (Lemieux 1998). The author burned twosets of simulated household garbage in separate metalburn barrels in a controlled laboratory setting andmeasured emissions from each barrel. One barrel con-
tained simulated waste from a household that did notrecycle and the other contained waste remaining after“avid recycling.” This study reported high emissions ofvolatile organic compounds (VOCs) including benzene,polynuclear aromatic hydrocarbons (PAHs), chlorinatedbenzenes and dioxins and furans. Surprisingly, higherlevels of dioxins and furans were found in the emissionsfrom the avid recycling household sample compared tothe non-recycler.
CH
AP
TE
R
5:
D
ON
’T
B
UR
N
IT
—
Th
e
Ha
za
rd
s
of
B
ur
nin
g
PV
C
Wa
st
e
32
C A S E S T U D Y
Maine Bans Backyard Burning;Warns Public About PVC Hazards
Reducing dioxin emissions and protecting the health of Maine resi-dents was a high priority when the Maine legislature voted to pro-hibit backyard trash burning in 2001. This new law and PVC educa-tional outreach followed a citizen advocacy campaign led by theNatural Resources Council of Maine which focused on reducing theuse and disposal of PVC because of its role as a dioxin-forming con-sumer product. A 1997 study found 10,000 backyard burn barrelsacross rural Maine and documented the high levels of dioxin emis-sions and exposures that resulted. The law also required the MaineDepartment of Environmental Protection (DEP) to educate peopleabout dioxin-forming PVC products and their alternatives.
An educational bulletin, poster and flyer prepared and distributed bythe Maine DEP contain clear and compelling messages about PVC.
“We can make a difference by RETHINKING our purchasinghabits to avoid putting PVC products in the waste stream.”
“You can help to reduce dioxin pollution from municipaltrash incineration by: REPLACING #3 PVC Products with‘less polluting’ natural materials OR safer plastic alterna-tives #1 PETE, #2 HDPE, #4 LDPE, #5 PP.”
“PVC plastics waste is a major source of our dioxin pollu-tion in Maine. It is the only plastic that forms significantamounts of dioxin when burned and has very low recyclingrates. It is even preferable to avoid burning PVC in munici-pal incinerators to reduce air pollutant levels and toxic ashdisposal. Safe alternatives exist for virtually every use ofPVC plastic.”
Maine’s educational materials also give clear consumer guidance onsafer alternatives to typical uses of PVC plastic. The Maine DEP estab-lished the link between open burning and PVC as follows: “In additionto eliminating backyard trash burning, we need to reduce the toxicnature of our waste stream that goes to incineration because of thepotential for serious health effects and contamination of our foodsupply” (Sources: MDEP 2001, MDEP 2001a, MDEP 1997).
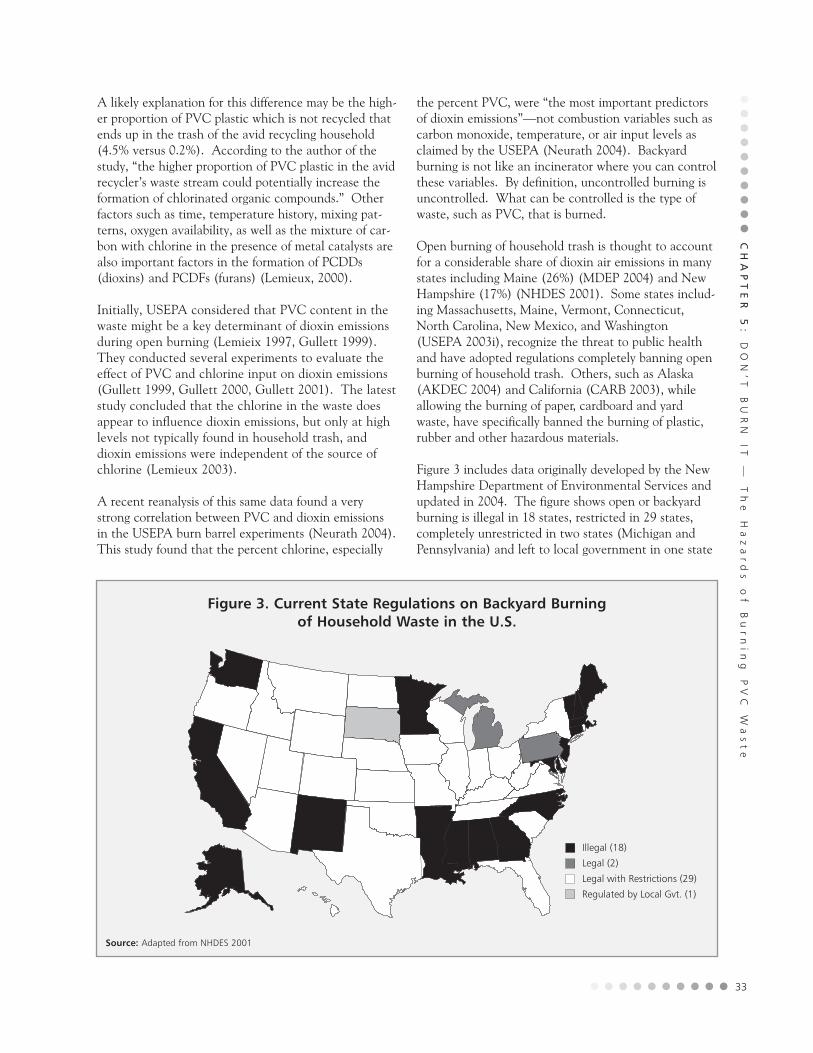
A likely explanation for this difference may be the high-er proportion of PVC plastic which is not recycled thatends up in the trash of the avid recycling household(4.5% versus 0.2%). According to the author of thestudy, “the higher proportion of PVC plastic in the avidrecycler’s waste stream could potentially increase theformation of chlorinated organic compounds.” Otherfactors such as time, temperature history, mixing pat-terns, oxygen availability, as well as the mixture of car-bon with chlorine in the presence of metal catalysts arealso important factors in the formation of PCDDs(dioxins) and PCDFs (furans) (Lemieux, 2000).
Initially, USEPA considered that PVC content in thewaste might be a key determinant of dioxin emissionsduring open burning (Lemieix 1997, Gullett 1999).They conducted several experiments to evaluate theeffect of PVC and chlorine input on dioxin emissions(Gullett 1999, Gullett 2000, Gullett 2001). The lateststudy concluded that the chlorine in the waste doesappear to influence dioxin emissions, but only at highlevels not typically found in household trash, anddioxin emissions were independent of the source ofchlorine (Lemieux 2003).
A recent reanalysis of this same data found a verystrong correlation between PVC and dioxin emissionsin the USEPA burn barrel experiments (Neurath 2004).This study found that the percent chlorine, especially
the percent PVC, were “the most important predictorsof dioxin emissions”—not combustion variables such ascarbon monoxide, temperature, or air input levels asclaimed by the USEPA (Neurath 2004). Backyardburning is not like an incinerator where you can controlthese variables. By definition, uncontrolled burning isuncontrolled. What can be controlled is the type ofwaste, such as PVC, that is burned.
Open burning of household trash is thought to accountfor a considerable share of dioxin air emissions in manystates including Maine (26%) (MDEP 2004) and NewHampshire (17%) (NHDES 2001). Some states includ-ing Massachusetts, Maine, Vermont, Connecticut,North Carolina, New Mexico, and Washington(USEPA 2003i), recognize the threat to public healthand have adopted regulations completely banning openburning of household trash. Others, such as Alaska(AKDEC 2004) and California (CARB 2003), whileallowing the burning of paper, cardboard and yardwaste, have specifically banned the burning of plastic,rubber and other hazardous materials.
Figure 3 includes data originally developed by the NewHampshire Department of Environmental Services andupdated in 2004. The figure shows open or backyardburning is illegal in 18 states, restricted in 29 states,completely unrestricted in two states (Michigan andPennsylvania) and left to local government in one state
CH
AP
TE
R
5:
D
ON
’T
B
UR
N
IT
—
Th
e
Ha
za
rd
s
of
B
ur
nin
g
PV
C
Wa
st
e
33
Figure 3. Current State Regulations on Backyard Burning of Household Waste in the U.S.
Illegal (18)
Legal (2)
Legal with Restrictions (29)
Regulated by Local Gvt. (1)
Source: Adapted from NHDES 2001

(South Dakota) (NHDES 2001, NHDES, 2003, NMED2004, CARB, 2003a, MRSA 2004). Several states thathave yet to enact proper legislation (e.g., Rhode Island,New York, Pennsylvania) have issued public healthstatements and developed pamphlets warning of thedangers associated with burning plastic, specifically therelease of dioxins. The USEPA currently has no regula-tions that apply to open burning even though they esti-mate that it is one of the largest sources of dioxin in air(USEPA 2001). To assist in finding current regulationsfor each state, the USEPA has constructed a virtualmap on their Website with links to each state’s rulesand regulations (USEPA 2003i).
Regulations on open burning typically vary betweenrural and urban/suburban areas. While generally pro-hibited in highly populated areas and municipalities,open burning is seldom stringently regulated in ruralareas. One reason given for this has been that deci-sions on whether to restrict or ban open burning ofhousehold trash has been driven by citizen complaints(Lighthall 1998). Thus, those communities withenough people to generate a substantial number ofcomplaints are the ones that enact or adopt policies torestrict or ban the open burning of household trash.
Every state has distinct laws though, and even withinstates, rules are far from uniform. Even in those statesand areas where rules and regulations exist, enforce-ment is extremely difficult. This lack of coherencetends to stifle efforts to curb open burning in generaland PVC burning in particular. Unless open burning
can be curtailed or even adequately controlled, it isunrealistic to expect PVC will not be burned. PVC willcontinue to harm human and environmental health aslong as open burning continues to be used to dispose oftrash.
In addition to open burning of household trash, vehiclefires, structure fires, construction site burning and land-fill fires all represent significant types of uncontrolledPVC combustion. Because PVC is so ubiquitous, thechance that it will be burned in intentional or acciden-tal fires is high.
The cost of waste disposal has risen in recent years, andmany rural residents are unable or unwilling to paythese increased costs. Otherwise laudable “pay-as-you-throw” (variable rate pricing) programs in communitiesacross the nation aim to reduce waste, but in rural areasaccustomed to paying a fixed rate regardless of theamount of waste they generate, such programs actuallytend to trigger an increase in burning and illegal dump-ing. Rather than reduce the amount of waste generat-ed, the more appealing option for some is illegal dump-ing and/or open burning. Moreover, proper disposal isoften less convenient in rural areas. Burning trash maybe a more appealing option than driving long distancesto pay for and legally dispose of trash. State and localgovernments must address matters of affordability andconvenience in these areas in order to help bring anend to open burning (MEDEP 1997). In the long termthough, replacing PVC with safer alternatives is theonly way to eliminate PVC from the waste stream.
CH
AP
TE
R
5:
D
ON
’T
B
UR
N
IT
—
Th
e
Ha
za
rd
s
of
B
ur
nin
g
PV
C
Wa
st
e
34

MAJOR FINDINGS● Dumping of PVC in landfills poses significant
long-term environmental threats due toleaching of toxic additives into groundwater,dioxin-forming landfill fires and toxic emis-sions in landfill gases.
● Land disposal is the final fate of between 2billion and 4 billion pounds of PVC that isdiscarded every year in some 1,800 munici-pal waste landfills.
● Many of the more than 1,900 landfills usedfor disposal of construction and demolition(C&D) debris are unlined and can not cap-ture any contaminants that leak out of PVCbuilding material waste.
● An average of 8,400 landfill fires are report-ed every year in the U.S., contributing fur-ther to PVC waste combustion and dioxinpollution.
Landfilling is the most common disposal option forPVC and thus is a significant part of the disposal stageof the PVC life cycle. The majority of PVC that is dis-carded as waste ends up in a landfill. However, landfillsdo not solve the PVC disposal dilemma. They eventu-ally leak, routinely emit toxic gases and occasionallycatch on fire. Landfills merely represent a temporary,polluting alternative to burning PVC and creating diox-ins. As an interim strategy, land disposal of PVC ispreferable to incineration, but it does not provide along-term secure solution to PVC waste management.
Municipal Waste LandfillsIn 2001, about 79% of U.S. municipal solid waste des-tined for disposal was landfilled (USEPA 2003).According to data made available by the USEPA, about1.42 million tons of PVC was in U.S. municipal solidwaste in 2001 (USEPA 2003). This represents less thanone percent of the 163 million tons of municipal solidwaste disposed of in landfills and incinerators. (Thistotal does not include an additional 49 millions tons ofmunicipal discards that were recycled or composted andcontained negligible amounts of PVC).
The USEPA data establishes a low-end estimate ofabout 1.12 million tons of PVC (more than 2.2 billionpounds) that was dumped in landfills in 2001 (USEPA2003). Using another source of data on municipalwaste generation for 2002, the amount of PVC dumped
PV
C:
B
ad
N
ew
s
Co
me
s
In
T
hr
ee
s
35
VINO PLACE LEFTProblems with PVC
in Landfills
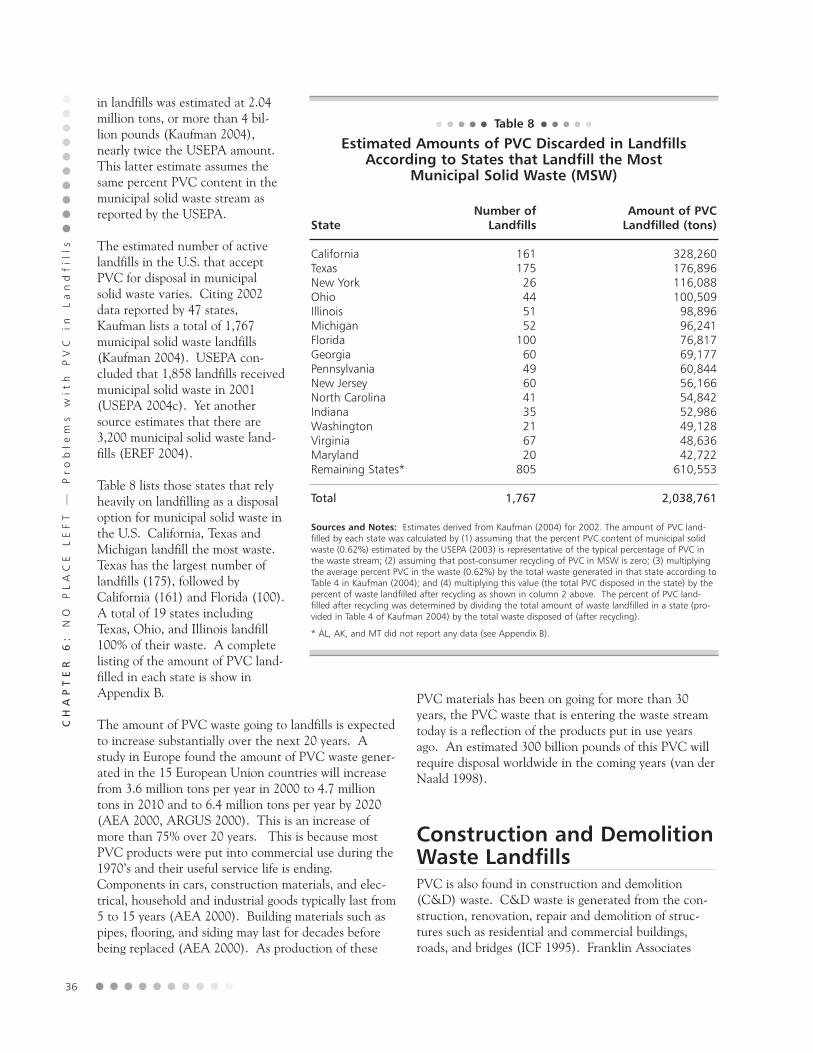
in landfills was estimated at 2.04million tons, or more than 4 bil-lion pounds (Kaufman 2004),nearly twice the USEPA amount.This latter estimate assumes thesame percent PVC content in themunicipal solid waste stream asreported by the USEPA.
The estimated number of activelandfills in the U.S. that acceptPVC for disposal in municipalsolid waste varies. Citing 2002data reported by 47 states,Kaufman lists a total of 1,767municipal solid waste landfills(Kaufman 2004). USEPA con-cluded that 1,858 landfills receivedmunicipal solid waste in 2001(USEPA 2004c). Yet anothersource estimates that there are3,200 municipal solid waste land-fills (EREF 2004).
Table 8 lists those states that relyheavily on landfilling as a disposaloption for municipal solid waste inthe U.S. California, Texas andMichigan landfill the most waste.Texas has the largest number oflandfills (175), followed byCalifornia (161) and Florida (100).A total of 19 states includingTexas, Ohio, and Illinois landfill100% of their waste. A completelisting of the amount of PVC land-filled in each state is show inAppendix B.
The amount of PVC waste going to landfills is expectedto increase substantially over the next 20 years. Astudy in Europe found the amount of PVC waste gener-ated in the 15 European Union countries will increasefrom 3.6 million tons per year in 2000 to 4.7 milliontons in 2010 and to 6.4 million tons per year by 2020(AEA 2000, ARGUS 2000). This is an increase ofmore than 75% over 20 years. This is because mostPVC products were put into commercial use during the1970’s and their useful service life is ending.Components in cars, construction materials, and elec-trical, household and industrial goods typically last from5 to 15 years (AEA 2000). Building materials such aspipes, flooring, and siding may last for decades beforebeing replaced (AEA 2000). As production of these
PVC materials has been on going for more than 30years, the PVC waste that is entering the waste streamtoday is a reflection of the products put in use yearsago. An estimated 300 billion pounds of this PVC willrequire disposal worldwide in the coming years (van derNaald 1998).
Construction and DemolitionWaste LandfillsPVC is also found in construction and demolition(C&D) waste. C&D waste is generated from the con-struction, renovation, repair and demolition of struc-tures such as residential and commercial buildings,roads, and bridges (ICF 1995). Franklin Associates
CH
AP
TE
R
6:
N
OP
LA
CE
LE
FT
—
P
ro
ble
ms
w
ith
P
VC
in
L
an
df
ills
36
Sources and Notes: Estimates derived from Kaufman (2004) for 2002. The amount of PVC land-filled by each state was calculated by (1) assuming that the percent PVC content of municipal solidwaste (0.62%) estimated by the USEPA (2003) is representative of the typical percentage of PVC inthe waste stream; (2) assuming that post-consumer recycling of PVC in MSW is zero; (3) multiplyingthe average percent PVC in the waste (0.62%) by the total waste generated in that state according toTable 4 in Kaufman (2004); and (4) multiplying this value (the total PVC disposed in the state) by thepercent of waste landfilled after recycling as shown in column 2 above. The percent of PVC land-filled after recycling was determined by dividing the total amount of waste landfilled in a state (pro-vided in Table 4 of Kaufman 2004) by the total waste disposed of (after recycling).
* AL, AK, and MT did not report any data (see Appendix B).
● ● ● ● ● Table 8 ● ● ● ● ●
Estimated Amounts of PVC Discarded in LandfillsAccording to States that Landfill the Most
Municipal Solid Waste (MSW)
State
CaliforniaTexasNew YorkOhioIllinoisMichiganFloridaGeorgiaPennsylvaniaNew JerseyNorth CarolinaIndianaWashingtonVirginiaMarylandRemaining States*
Total
Number of Landfills
16117526445152
1006049604135216720
805
1,767
Amount of PVCLandfilled (tons)
328,260176,896116,088100,50998,89696,24176,81769,17760,84456,16654,84252,98649,12848,63642,722
610,553
2,038,761

(under contract to the USEPA) estimated that 136 mil-lion tons of building-related C&D debris was generatedin 1996 (FA 1998). This figure did not include road,bridge and land clearing debris. C&D waste consistsmainly of wood products, asphalt, drywall and masonrywaste with lesser quantities of metals, plastics includingPVC, dirt, shingles, insulation, paper and cardboard(ICF 1995). The percentage of PVC in C&D waste ishard to estimate. One report specifically identified andestimated the percent of vinyl siding and PVC pipes inC&D waste to be 0.63% for the two materials com-bined (FA 1998). Other types of PVC plastic wastewere not considered.
In 2002, forty-two states reported that 1,931 landfillswere dedicated for disposal of C&D waste (Kaufman2004). Many if not most of these landfills are unlined,offering groundwater supplies even less protection fromcontaminants that may leach from PVC and otherC&D waste components.
The Hazards of LandfillDisposal of PVCThere are significant dangers associated with the dump-ing of PVC in landfills. Although there appears to belittle degradation of the PVC polymer (ARGUS 2000,Mersiowski 1999), the additives present in PVC prod-ucts are not chemically bound to the PVC and they willseep out into the environment over time (CEC 2000).These additives include plasticizers, stabilizers, pig-ments, fillers and other chemicals that are added toPVC depending on the final product’s intended purpose(see Chapter 3). Many of these additives leach out inthe disposal phase (Mersiowski 1999). This is especiallytrue of flexible PVC products. In the case of the rigidPVC products, stabilizers are generally thought to beencapsulated in the matrix of the PVC polymer andthus migration is expected to be less than what occurswith the plasticizers (ARGUS 2000, AEA 2000,Mersiowski 1999).
In landfills, PVC (as well as all waste) is subject to dif-ferent reactive conditions such as moisture, changingtemperatures, the presence (or absence) of oxygen, andthe activity of microorganisms (CEC 2000). These fac-tors will interact with the waste at different stages ofthe aging process. Recent studies evaluating the behav-ior of PVC in landfills found that microorganismsand/or corrosive liquids common to landfill environ-ments act to accelerate the release of additives in PVCproducts (Mersiowski 1999, Hjertberg 1995).
Cadmium, lead, organotins and phthalates (whichaccount for over 90% of plasticizers) are commonlyreleased from PVC waste in landfills (Mersiowski 1999,Hjertberg 1995). In studies evaluating the leaching ofbisphenol A (BPA), an additive used in many plastics,PVC was found to release the highest concentrations ofBPA (Yamamoto 1999). These additives will mix withwater and other substances in the waste and generate“leachate” which will contaminate local groundwater inthe vicinity of the landfill.
Leachate generated by waste in landfills has beendetected in groundwater monitoring wells at numerousgarbage landfills (Lee 1996). One study in Californiareported that 72% of 528 landfills had polluted thenearby groundwater (Lee 1996). The USEPA passedregulations in 1991 to control landfill leachate (USEPA1991). These regulations have been criticized for rely-ing on a “fundamentally flawed technological approachfor MSW management that at best only postponeswhen significant environmental problems will occur asa result of the landfilled waste” (Lee 2003).
Estimates have been made of the amount of lead pres-ent in landfills that are attributable to lead additives indiscarded PVC products. These estimates range from1 to 28% (CEC 2000). In 1998, an estimated 51,000tons of lead were used as stabilizers in plastic in Europe(CEC 2000) and an estimated 6 billion tons were usedworldwide in 2000 (Tukker 2001). Much of this leadwill end up in landfills and can be expected to be a sig-nificant source of lead being released into the environ-ment (NCM 2003). The key question is how much ofthe lead will be mobilized and released into the envi-ronment and when. Although the mobility of lead isgenerally thought to be low, small amounts will slowlyleak out. Over time, this could lead to substantialamounts of lead being released into the environment.One study in Europe reported that an estimated 8 kilo-tons of lead from PVC entered the waste stream andthat 0.5 kilotons was released into the environment in2000 (Tukker 2001). Given the longevity of PVC prod-ucts, it can be expected that lead leaching from discard-ed PVC products in landfills will continue to be ahealth and environmental threat for many years tocome.
The lack of adequate liners and/or leachate treatmentin many old landfills (and even some new ones) ensuresthat these releases have an easy route into surroundinggroundwater and soil. Many construction and demoli-tion debris landfills are completely unlined. Most oldlandfills contain no liner or collection system to preventleachate generated in the landfill from mixing with and
CH
AP
TE
R
6:
N
OP
LA
CE
LE
FT
—
P
ro
ble
ms
w
ith
P
VC
in
L
an
df
ills
37

contaminating local groundwater. This leachate willseep down through the waste and eventually contami-nate groundwater with hazardous and toxic chemicals(Lee 1994).
Even landfills equipped with the best liners and mostup-to-date treatment methods cannot ensure long-termsafety. In instances where liners or collection systemshave been installed, leachate is still generated. When itreaches the bottom of the landfill, it is collected by asystem of pipes and treated. The treated leachate isoften sprayed back onto the waste and eventually col-lected again. If these pipes clog up, the leachate willaccumulate in the landfill and create pressure on theliner. Eventually, this pressure will force the leachateout at the point of least resistance, usually the bottomof the landfill when the bottom liner fails.
These collection systems can be clogged by silt or mud,the growth of microorganisms in the pipes, or chemicalreactions leading to the precipitation of minerals in thepipes. The pipes may also become weakened by chemi-cal attack (acids, solvents, oxidizing agents or corro-sion) and may be crushed by the tons of garbage piledon them (ERF 1989)
The liners used in landfills are generally made fromhigh-density polyethylene (HDPE). These liners can bedegraded by a number of household chemicals that cancause them to either lose strength, soften or becomebrittle and crack. Liners will also tear during installa-tion or as a result of pressure from the weight of thewaste. There may also be defects in the liners such ascracks, holes and faulty seams that allow leachate topass through the liner (ERF 1992). One study foundcertain organic chemicals, such as chlorinated solvents,benzene, trichloroethylene (TCE) and vinyl chloride,can readily pass through an intact liner (i.e., a linerwith no holes) in a short period of time (Haxo 1988).This finding has been confirmed in separate studies(Sakti 1991, Buss 1995, Lee 1996). Eventually, alllandfills will leak whether they have a liner or not (ERF1992, Bonaparte 1990, Lee 1992) and threaten thehealth of residents living nearby (ERF 1998). Landfillscannot guarantee safe, long-term disposal of PVCwastes and their by-products.
Landfill fires present another cause for concern. Thesefires generate a range of hazardous gases including car-bon dioxide, carbon monoxide and hydrogen chloride.Dioxins and furan are also formed (USEPA 2001).Such fires are not uncommon. An average of 8,400landfill fires are reported each year in the U.S. (FEMA2002) and their ignition can be traced to a number of
causes. Though over half of reported fires have noinformation available as to the initial cause, 40% ofreported fires are classified as deliberate or suspicious,20% are attributable to smoldering waste, and 5% ignitespontaneously. Highly flammable methane gas,released by landfilled waste as it decays is a primary fac-tor in many cases.
PVC products disposed of in landfills contribute to theformation of dioxins and furans in the event of a fire.Four PVC products—pipes, rigid foils, floorings andcable wires—contribute about 40% of the chlorine con-tent in landfills (Mersiowsky 1999). As previously dis-cussed, the chlorine in PVC contributes to the forma-tion of dioxins. Other factors that influence theamount of chlorinated dioxins and furans formedinclude fire temperature, and the availability of oxygenand catalysts (e.g., copper). Lower oxygen concentra-tions and lower temperatures (500-700° C) correspondwith elevated dioxin formation (Moeller 1996). Boththese conditions occur frequently at landfill fires.
Measured concentrations of dioxins and furans in theair of landfill fires are generally high and consistentwith evidence gathered from test fires (Ruokojärvi1995). As is the case with open burning, these airemissions are unfiltered and largely uncontrolled (seeChapter 3).
Another concern with landfills is the generation oflandfill gases. All municipal waste landfills generategases that result from the degradation of materials inthe waste (USEPA 1995). The most common landfillgas is methane that results from the degradation of bio-logical matter in the waste stream. Other commonlandfill gases include vinyl chloride, benzene, tolueneand dichloroethane (ATSDR 2001). These volatilegases result from the breakdown of waste componentspresent in the landfill. When PVC degrades, plasticiz-ers and other additives leach out, and some of theseevaporate and contribute to the landfill gases (ARGUS2000).
Older landfills made no attempt to vent or controlthese gases. As a result, there were many explosions inhomes and buildings located near solid waste landfillscaused by the migration of methane gas, a highly explo-sive substance (USEPA 1990, Lee 1994). More modernlandfills attempt to capture these gases using a gas col-lection system. These systems consist of a series ofwells installed throughout the landfill that are used topull out the gas. A series of pipes connect the wellsand carry the gas to either a flare where it is burned orto an energy recovery system where the gases are con-
CH
AP
TE
R
6:
N
OP
LA
CE
LE
FT
—
P
ro
ble
ms
w
ith
P
VC
in
L
an
df
ills
38
verted into electricity (USEPA 1990). The flares canbe a source of dioxins if chlorinated chemicals such asvinyl chloride are present in the landfill gases (USEPA2001, Eden 1993).
Since 1996, large landfills have been required to havegas collection systems, which, the USEPA maintains,capture 75% of the gases (USEPA 2002b). However,there is no factual basis for this number. There are nostudies that define the collection efficiency of these sys-tems. Instead, this estimate is intended to reflect thebest achievable efficiency while the systems are operat-ing. The flaws in EPA’s estimate are two fold. First,more of the gases are emitted both before the systemsare installed and after they are removed from service,than during the time they are functional. Second, mostlandfills do not achieve best practices, especiallybecause there is no way to measure emissions thatmight disclose poor efficiency, other than by detectingodor problems, which is just the manifestation of theworst fugitive emissions. A study that includes thesefactors found that there is no factual basis to conclude
that, in practice and on a lifetime basis, more than 20%of the landfill gases generated are actually captured andeither flared or used to recover energy (Anderson2004a).
Landfills are also used to discard the residual ash gener-ated when PVC products are incinerated. This ashcontains dioxins and many heavy metals that will even-tually cause many of the same leaching problems andthreats to groundwater discussed earlier (USEPA1994a, ERF 1990, Denison 1988). Clearly, landfills donot solve the disposal dilemma. They merely present atemporary, polluting alternative to burning PVC andcreating dioxins. As an interim strategy, land disposalof PVC in a hazardous waste landfill may be preferableto incineration, but it poses its own environmental andpublic health threats and does not provide a long termsecure solution to PVC waste management. Avoidingthe generation of PVC-containing waste is the onlysure way to prevent the problems associated with eitherlandfill disposal or incineration of PVC waste.
CH
AP
TE
R
6:
N
OP
LA
CE
LE
FT
—
P
ro
ble
ms
w
ith
P
VC
in
L
an
df
ills
39


MAJOR FINDINGS● Contrary to popular belief, recycling of PVC
is negligible, with estimates ranging from0.1% to 3% of post-consumer PVC wastebeing recycled.
● PVC is very difficult to recycle because themany additives used in PVC products makeit impossible to retain the unique propertiesof the original formulation from a batch ofmixed PVC products collected for recycling.
● PVC severely impacts the recycling of PETplastic bottles due to difficulty in separat-ing these plastics when they are mixedtogether, and because of the contaminationcaused by the chlorine in PVC when theyare processed together for recycling.
● The vinyl industry has inflated its PVC recy-cling rate by failing to account for all PVCwaste generated and by redefining PVCwaste incineration as recycling.
● PVC increases the toxic impacts of the recy-cling process for other discarded productssuch as nylon carpet, computers, automo-biles and corrugated cardboard.
The ability to recycle used PVC products into newproducts is not feasible as a practical matter (Plinke2000). While the vinyl industry has argued that PVCcan be recycled (VI 2004a, PP 1999), in reality, a neg-ligible amount of PVC is actually recycled. Estimatesof how much post-consumer PVC (PVC that was usedby a consumer for its intended purpose) is recycled varyfrom a high of about 3% (Plinke 2000, PP 1999) to alow of less than 1% (Denison 1997, Beck 1996).USEPA reports that less than 0.1% of PVC in post-consumer municipal solid waste was recycled in 2001,the most recent year for which data are available(USEPA 2003). As discussed below, at most 0.3% ofPVC bottles were recycled in 2001 (Anderson 2004).
The primary reason for these poor recycling rates is thelack of uniformity in the composition of PVC products.Vinyl products are made using various formulationsthat are designed to achieve certain properties and cre-ate specific products. To achieve these features, addi-tives such as lead, cadmium and phthalates thatenhance properties such as durability and plasticity aremixed together with PVC. For example, vinyl sidingand windows are made with lead to make them moredurable, whereas infant chew toys contain phthalatesto make them more soft and pliable. Table 9 showswhat portion of the PVC is made up of these additives.
When these different formulations of PVC are mixedtogether, such as when they are collected as part of arecycling effort, they cannot be readily separated which
PV
C:
B
ad
N
ew
s
Co
me
s
In
T
hr
ee
s
41
VIIRECYCLING MENACEPVC UnderminesRecycling Efforts

is necessary to reprocess the PVC back into its originalformulation and to retain the unique properties of theoriginal formulation (Plinke 2000, Thornton 2000). Thisproblem is further complicated because PVC formula-tions for the same materials have changed over time.
There are other problems with mixing PVC with otherplastics. One difficulty is color. Recycled products mustbe separated by color, which in most cases is not practi-cal (Plinke 2000). Another difficulty is that soft PVCcannot be used in rigid PVC applications, and rigid PVCcannot be used in soft PVC applications since the mate-rial has to be reformulated (i.e., new additives need tobe added). Thus, when different formulations of PVCare mixed together, it becomes virtually impossible tocreate a formulation that can be used for any applicationthat requires specific properties.
As a result, a lower quality PVC plastic is producedwhich cannot be used for the same purpose as the origi-nal product (Plinke 2000). Thus, PVC can never betruly recycled into the same quality material. It usuallyends up being made into lower quality products with lessstringent requirements such as speed bumps, parkingbumpers, or park benches. The loss of quality in a mate-rial during recycling is called “downcycling.” The down-cycling of plastics is common because of the difficulties inseparating out the components with different additives(Plinke 2000). PVC that is downcycled does not reduce
the overall demand for the raw materials (virgin resin)used in making plastic, and has no effect on the amountof vinyl produced each year (Denison 1997).
In Europe, where PVC recycling has received greaterattention, the vinyl industry has claimed greaterprogress in PVC recycling than is actually the case.Instead of measuring recycling progress against the totalamount of PVC waste generated, the industry insteadlimited its recycling goals to the much smaller fractionof PVC waste that they deem to be economically “col-lectable” and “available.” With this distortion theEuropean industry claimed that they achieved theirgoal of recycling 25% of PVC waste window frames,pipes and fittings, and roofing membranes by 2003. Infact, actual PVC recycling rates were less than 5% forpipes and fittings, 6% for roofing waste and 16% forwindow frames (ENDS 2004).
The PVC industry’s distortion of its recycling progresscan’t hide the facts. Throughout Europe, the totalamount of PVC recycled in 2003 was 2% to 3%, match-ing only one-fifth of the industry’s modest goal of recy-cling 10% to 15% of all PVC (not just what’s collecta-ble and available) by 2010 (ENDS 2003). These mod-est gains are being rapidly overshadowed by the project-ed 50% to 80% increase in PVC waste generation overthe next twenty years (ENDS 2003, ENDS 2004).
CH
AP
TE
R
7:
R
EC
YC
LIN
GM
EN
AC
E
—
PV
C
Un
de
rm
ine
s
Re
cy
cli
ng
E
ff
or
ts
42
Application
Rigid PVC ApplicationsPipesWindow Profiles (lead stabilized) Other profiles Rigid film
Flexible (soft) PVC ApplicationsCable installationFlooring (calander)Flooring (paste, upper layer)Flooring (paste, inside material)Synthetic leather Furniture filmsLeisure articles
PVC Polymer
98859095
42426535537560
Plasticizer
————
23153225401030
Stabilizer
1-233
—
2211122
Filler
—46
—
3341—40555
Others
—815
—02
—183
Share of the Components (weight - %)
● ● ● ● ● Table 9 ● ● ● ● ●
Typical Composition of PVC Products and Materials
Source: Prognos 1994, Prognos 1999, Totsch 1990 as cited in Plinke, 2000.
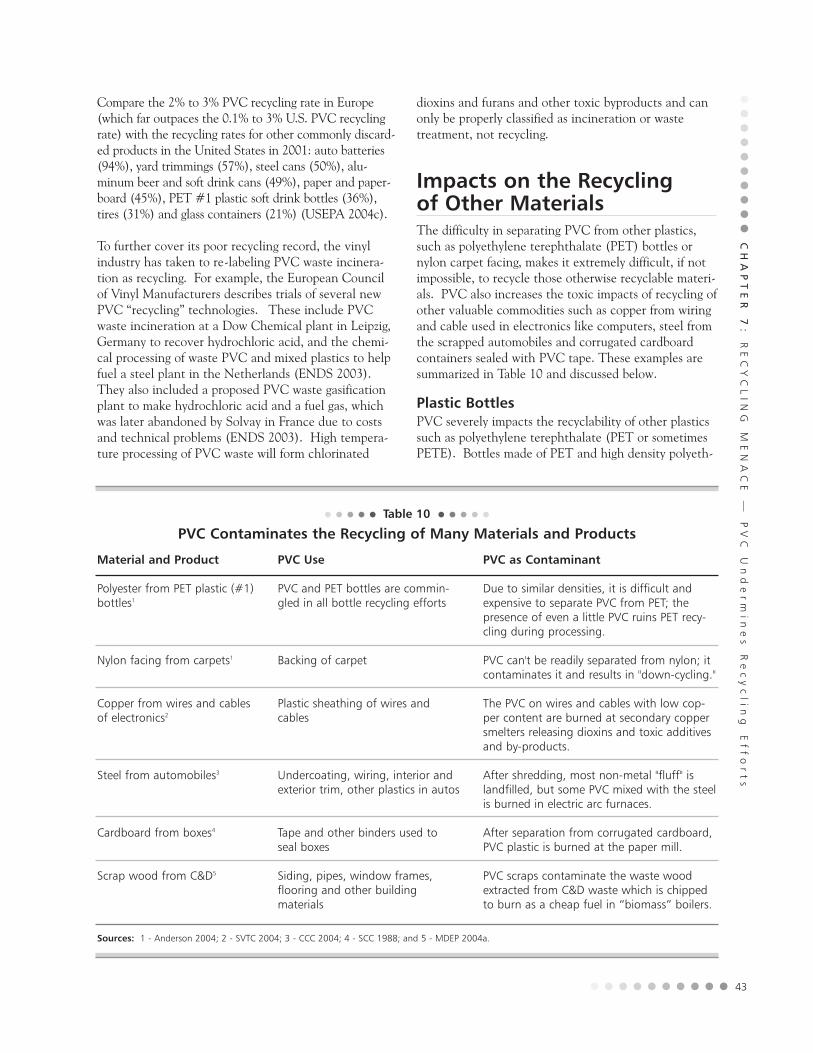
Compare the 2% to 3% PVC recycling rate in Europe(which far outpaces the 0.1% to 3% U.S. PVC recyclingrate) with the recycling rates for other commonly discard-ed products in the United States in 2001: auto batteries(94%), yard trimmings (57%), steel cans (50%), alu-minum beer and soft drink cans (49%), paper and paper-board (45%), PET #1 plastic soft drink bottles (36%),tires (31%) and glass containers (21%) (USEPA 2004c).
To further cover its poor recycling record, the vinylindustry has taken to re-labeling PVC waste incinera-tion as recycling. For example, the European Councilof Vinyl Manufacturers describes trials of several newPVC “recycling” technologies. These include PVCwaste incineration at a Dow Chemical plant in Leipzig,Germany to recover hydrochloric acid, and the chemi-cal processing of waste PVC and mixed plastics to helpfuel a steel plant in the Netherlands (ENDS 2003).They also included a proposed PVC waste gasificationplant to make hydrochloric acid and a fuel gas, whichwas later abandoned by Solvay in France due to costsand technical problems (ENDS 2003). High tempera-ture processing of PVC waste will form chlorinated
dioxins and furans and other toxic byproducts and canonly be properly classified as incineration or wastetreatment, not recycling.
Impacts on the Recyclingof Other Materials The difficulty in separating PVC from other plastics,such as polyethylene terephthalate (PET) bottles ornylon carpet facing, makes it extremely difficult, if notimpossible, to recycle those otherwise recyclable materi-als. PVC also increases the toxic impacts of recycling ofother valuable commodities such as copper from wiringand cable used in electronics like computers, steel fromthe scrapped automobiles and corrugated cardboardcontainers sealed with PVC tape. These examples aresummarized in Table 10 and discussed below.
Plastic BottlesPVC severely impacts the recyclability of other plasticssuch as polyethylene terephthalate (PET or sometimesPETE). Bottles made of PET and high density polyeth-
CH
AP
TE
R
7:
R
EC
YC
LIN
GM
EN
AC
E
—
PV
C
Un
de
rm
ine
s
Re
cy
clin
g
Ef
fo
rt
s
43
Material and Product
Polyester from PET plastic (#1)bottles1
Nylon facing from carpets1
Copper from wires and cablesof electronics2
Steel from automobiles3
Cardboard from boxes4
Scrap wood from C&D5
PVC Use
PVC and PET bottles are commin-gled in all bottle recycling efforts
Backing of carpet
Plastic sheathing of wires andcables
Undercoating, wiring, interior andexterior trim, other plastics in autos
Tape and other binders used toseal boxes
Siding, pipes, window frames,flooring and other buildingmaterials
PVC as Contaminant
Due to similar densities, it is difficult andexpensive to separate PVC from PET; thepresence of even a little PVC ruins PET recy-cling during processing.
PVC can't be readily separated from nylon; itcontaminates it and results in "down-cycling."
The PVC on wires and cables with low cop-per content are burned at secondary coppersmelters releasing dioxins and toxic additivesand by-products.
After shredding, most non-metal "fluff" islandfilled, but some PVC mixed with the steelis burned in electric arc furnaces.
After separation from corrugated cardboard,PVC plastic is burned at the paper mill.
PVC scraps contaminate the waste woodextracted from C&D waste which is chippedto burn as a cheap fuel in “biomass” boilers.
Sources: 1 - Anderson 2004; 2 - SVTC 2004; 3 - CCC 2004; 4 - SCC 1988; and 5 - MDEP 2004a.
● ● ● ● ● Table 10 ● ● ● ● ●
PVC Contaminates the Recycling of Many Materials and Products

ylene (HDPE) make up 95% of all plastic bottles com-pared to only about 2.3% for PVC bottles (Anderson2004). PET bottles (recycling code #1) are commonlyused to contain water, soda, vegetable oil and manyother products (Anderson 2004) and are highly recycla-ble. Lower quality recycled PET (which has greater tol-erance for contaminants such as PVC) is often used tomake a polyester fabric known as “fiberfill” that is usedin coats, sleeping bags, pillows and carpeting. However,higher quality recycled PET (containing very littlePVC) is increasingly being recycled directly back intobottles. It also has an economic benefit as it is sold forfiber at seven times the price of PET contaminated withPVC (Anderson 2004).
When PVC is mixed together with PET or other highlyrecyclable plastic, such as in the “all-bottle” recyclingprograms favored by the plastics industry, the few PVCbottles likely to be collected will be virtually indistin-guishable from PET containers due to their similarappearance and density. Sophisticated separation tech-nology that uses optical systems is available to identifyand remove unwanted plastic bottles, such as PVC(USEPA 1993). However, the effectiveness of thesesystems is greatly reduced when the bottles are dam-aged or dirty. This makes accurate readings difficult toachieve and as a practical matter separation of PVCalmost impossible (USEPA 1993, Anderson 2004).
If the PVC cannot be separated from the PET, it willseverely effect the processing of the PET bottles intoreusable plastic resin. This is because PET and PVCbehave very differently when they are processed forrecycling. PVC burns at a lower temperature than PET.It burns at the temperature that simply melts PET(Anderson 2004, EAF 1993). When this occurs, “blackspots” get into the PET resin contaminating the batchand ruining or seriously downgrading the quality of recy-cled PET residue (Anderson 2004). According to oneplastics recycler, “introducing one PVC bottle into therecycling process can contaminate 100,000 PET bottles”(Anderson 2004, EAF 1993). In addition, when PVC ismelted, it generates hydrochloric acid, which will dam-age the processing equipment (OSWM 1993).
Despite these difficulties, the vinyl industry partiallysubsidized PVC bottle recycling in the mid-1990s(Anderson 2004). This effort failed miserably. At best,barely 2% of the bottles were recovered (Anderson2004). Instead, truckloads of PVC plastic waste werelandfilled (Denison 1997) leading the Association ofPost-Consumer Plastic Recyclers (APR), a recyclingindustry trade group, to declare that vinyl products are“unrecyclable contaminants” in the recycling of PET
and HDPE bottles (PMF 2003). APR later abandonedits efforts to establish viable markets to recycle PVC(RT 2001). A report on the recycling of PVC wasteprepared for the European Union similarly concluded“mechanical recycling is not qualified to contribute sig-nificantly to the management of PVC post-consumerwastes in the next decades…” (Plinke 2000).
More recently, a report released by the GrassRootsRecycling Network (a group of community activists andrecycling professionals advocating for zero waste andsustainable communities) concluded that PVC bottlerecycling is negligible today and that at most 0.3% ofPVC bottles were recycled in 2001 (Anderson 2004).The report provides details of how PVC recycling ofbottles does not exist, cannot exist, and is not wantedeven by the plastics recycling industry. The only solu-tion is a total phase-out of PVC and a rejection of pro-grams encouraging curbside pickup of PVC that ulti-mately cause more harm than good.
ElectronicsAn estimated 26% of the plastic used in electrical andelectronic equipment is made of PVC (MCTC 1996).The cabling of computers and other electronics is cur-rently a major application of PVC in electronics, althoughit can be found in the housings of older computers thatmay still enter the waste stream (SVTC 2004).
When these consumer products reach the end of theiruseful life, components can be recovered and reused.Recyclers strive to recover valuable metals, such as cop-per from the wiring of these electronics. This is doneby mechanical removal of the plastic sheathing, but it isonly economical when the copper content is high.Most PVC cables from consumer electronics do notcontain enough copper and so are bundled and shippedto a secondary copper smelter. Once there, the PVCplastic is burned off from the copper, a known catalystof dioxin formation. Thus, recovery of copper wireresults in toxic emissions including dioxins and furansto air and ash (SVTC 2004, USEPA 2001).
Smelting can present dangers similar to incineration. Areport on the recycling of computer parts raised con-cerns that the Noranda Smelter in Quebec, Canada,where much of the North American “electroscrap” issent, is “producing dioxins due to the residual presenceof PVC or other plastics in the scrap” (SVTC 2004).Noranda has denied that this facility presents a “pollu-tion hazard.” Secondary copper smelters, such as theone operated by Noranda, have been identified as oneof the highest sources of dioxin emissions in the U.S.(USEPA 2001).
CH
AP
TE
R
7:
R
EC
YC
LIN
GM
EN
AC
E
—
PV
C
Un
de
rm
ine
s
Re
cy
cli
ng
E
ff
or
ts
44

AutomobilesCars currently produced in North America averageabout twenty-four pounds of PVC per vehicle, accord-ing to plastics manufacturers (APC 2004). When thehulks of old cars are shredded, some of the PVC plasticmixes with the scrap metal which is melted down tomake recycled steel. The high temperature and possi-ble metal catalysts trigger formation of dioxins andfurans. The vinyl industry advocates burning the plas-tics-rich automotive shredder residue (ASR or “fluff”)either with municipal solid waste or in a cement kiln(VI 2004b). This will further contribute to dioxin for-mation from the chlorine present in automotive vinylmaterials and formation of toxic PVC by-products(Singhofen 1997, CCC 2004).
The main uses of PVC in automobiles include under-body coatings and sealants, wire harnesses, dash boards,door panels, arm and head rests, upholstery, heatingand cooling ducts, floor mats, spray-on sound deadener,seat belt latches, seat covers, mud flaps, and exteriortrim such as body side protection strips, weather stripsand window sealing profiles (APC 2004, VI 2004c,CCC 2004). PVC is the second largest volume plasticfor automotive use in North America (APC 2004).
CarpetsThe disposal of carpets in municipal and constructionand demolition waste adds PVC from carpet backing tothe solid waste stream. Two progressive companies con-trolling just ten percent of the market have achieved amodest 22% recycling rate for PVC carpet backing. Butmechanical separation used by companies such asInterface Fabrics leaves too much PVC contaminant inwith the nylon. PVC burns at the same temperaturethat nylon begins to soften and destroys the separatednylon fibers (Anderson 2004). Another company thatuses recycling (Collins & Aikman) must downcycle theentire carpet to a lower value carpet backing, losing thenylon fibers for reuse and requiring virgin materials fornew carpet facing (Anderson 2004).
Truly closed loop recycling for carpets, in which the fac-ing and the backing fibers are recycled back into theiroriginal uses, remains elusive (Anderson 2004). Andthe modest success earned by recycling of PVC carpetbacking can’t be readily translated to other uses ofPVC. The carpet makers enjoy a large volume, steadysupply of discards with a relatively standard formula ofPVC, unlike the variable PVC mixtures used in somany other far-flung products that are difficult to col-lect and recycle for a high end use (Anderson 2004).
Old Corrugated Cardboard (OCC)Another use of PVC is to make packing tape that bindscorrugated cardboard boxes. After this cardboard isused, it is broken down and returned to a paper mill forrecycling. Any tape or plastic binding used to seal thecardboard is removed and separated from the card-board, and then burned in the mill’s industrial boilers.When this tape or binding is made of PVC and burned,another source of dioxin is created (SCC 1988). TheSmurfit-Stone Container cardboard recycling facility inMissoula, MT processes up to 525 tons of old corrugat-ed cardboard (OCC) per day. This mill generates about15 to 25 tons per day of “OCC rejects” that consist ofplastic packing tape, plastic twine and other non-card-board contaminants, some of which is made of PVC(WVE 2002). Dioxins and furans have been identifiedin the air emissions of pulp and paper mills (USEPA2004d).
Scrap WoodPressures are increasing to burn more scrap wood forfuel and power in so-called “biomass” boilers that are aproven source of dioxin emissions (MDEP 2004). Yet itis increasingly likely that PVC siding, window frames,roofing foils and other vinyl building materials willbecome mixed with scrap wood recovered from con-struction and demolition debris. When chipped andburned, this PVC-contaminated wood scrap is likely toadd to the amount of dioxins formed.
CH
AP
TE
R
7:
R
EC
YC
LIN
GM
EN
AC
E
—
PV
C
Un
de
rm
ine
s
Re
cy
clin
g
Ef
fo
rt
s
45


MAJOR FINDINGS
● PVC is the most environmentally harmfulplastic; many other plastic resins can substi-tute more safely for PVC when natural mate-rials are not available.
● Safer alternatives to PVC are widely availableand effective for almost all major uses inbuilding materials, medical products, packag-ing, office supplies, toys and consumer goods.
● PVC alternatives are affordable and alreadycompetitive in the market place.
● In many cases, the alternatives are only mar-ginally more costly than PVC, and in somecases the costs of the alternative materialsare comparable to PVC when measured overthe useful life of the product.
● Phasing out PVC in favor of safer alterna-tives is economically achievable.
● A PVC phase-out will likely require the sametotal employment as PVC production (anestimated 9,000 jobs in VCM/PVC resin pro-duction, and 126,000 jobs in PVC fabrica-tion) by making the same types of productsfrom safer plastic resins.
Safer alternatives to the use of PVC plastic are widelyavailable, effective and affordable. These alternativespose fewer toxic chemical hazards than those associatedwith the manufacturing, use and disposal of PVC. Inmany cases, they completely avoid the formation ofchlorinated by-products of combustion, e.g., dioxins,because they are chlorine-free; they also prevent therelease of other harmful chemicals because they do notcontain additives such as phthalates, lead, cadmium ortin, which are commonly found in PVC formulations.
Safer alternatives to PVC come in several forms includingnatural materials, as well as other synthetic plastics thatare cleaner than PVC. For instance, instead of a vinylshower curtain, a cloth shower curtain, wood clapboardsiding or glass door easily does the job. For some people,the perceived aesthetic value of these natural materialsfurther outweighs the comparative appearance of thePVC products. For others, the perceived convenience oflower maintenance tips the balance in favor of syntheticmaterials.
Even so, other cleaner plastics will do the same job asPVC without the high degree of toxic impacts through-out their life cycle. For example, a polyurethane-coatednylon shower curtain will repel water as well as onemade of vinyl. The newly marketed polyethylene-basedplastic siding avoids the toxic impacts associated withvinyl siding.
PV
C:
B
ad
N
ew
s
Co
me
s
In
T
hr
ee
s
47
VIIIDON’T BUY ITSafer Alternatives to PVC are Available,
Effective and Affordable

Many OtherPlastic Resins areSafer Than PVC Not all plastics or synthetic poly-mers are created equal. In a studyof all major packaging materialsconducted for the Council of StateGovernments in the U.S., PVC wasfound to be the most damaging ofall plastics (Tellus 1992). A lifecycle analysis conducted by theDanish EPA found that commonplastics, such as polyethylene,polypropylene, polystyrene, PETand ethylene-propylene syntheticrubber, were all clearly preferable toPVC in terms of resource and ener-gy consumption, accident risk andoccupational and environmentalhazards (Christiansen 1990).
This ranking of the major plasticresins from most harmful to leastharmful is reflected in a revision ofthe Plastics Pyramid, originallydeveloped by Greenpeace, shown inFigure 4 (DEPA 1995, van derNaald 1998, Tickner 1999a). Theranking qualitatively accounts forthe toxic chemical hazards associat-ed with the manufacture, use and disposal of plastics.Similar in concept to the federal government’s FoodPyramid, the most harmful items at the narrow top ofthe pyramid should be avoided or used sparingly, whileliberal advantage should be taken of the least harmfulitems listed at the broad base of the pyramid.
PVC clearly ranks as the most harmful plastic due to itshigh chlorine content, the toxic intermediate com-pounds used to produce PVC, the many toxic additivesroutinely added and its toxic by-products of combus-tion. PVC products, especially bottles and packaging,are sometimes labeled with the code number “3” (or theletter “V”) based on a system used by the plastics indus-try to distinguish among the major plastic resins.
The next level of the pyramid lists plastics that are stillharmful but less so than PVC. These include poly-styrene (PS), used for plastic cups and utensils and tomake Styrofoam, and polycarbonate (PC), used to makecompact discs and most reusable water bottles. PCreleases a chemical known as bisphenol A (BPA) whichis known to interfere with the functioning of the hor-mone system in lab animals and, as an endocrine dis-ruptor, may pose a hazard to human health (Colborn,1996). Acrylonitrile Butadiene Styrene (ABS) andpolyurethane (PU) are also hazardous, but they are lesstoxic, persistent, and bioaccumulative than PVC.
The plastics in the middle of the ranking are even lesshazardous than PVC and the other plastics higher onthe pyramid. These include the polymer most oftenfound in plastic beverage bottles, including bottleddrinking water, known as polyethylene terephthalate(PET or PETE) (code # 1). Although hazardouschemicals are involved in the production of PET, it isrecycled at a relatively high rate for plastics (19%)(USEPA 2003), especially in the eleven states that have
CH
AP
TE
R
8:
D
ON
’T
BU
Y
IT
—
Sa
fe
r
Alt
er
na
tiv
es
t
o
PV
C
48
Figure 4. A Plastics Pyramid
Sources: DEPA 1993, van der Naald 1998, Tickner 1999a.
Level 1 PVC = Polyvinyl chlorideLevel 2 PS = Polystyrene
PU = PolyurethaneABS = AcrylonitrileButadieneStyrenePC = PolycarbonateTPE = Thermoplastic Elastomer
Level 3 PETE = Polyethylene terephthalateEVA = Ethyl vinyl acetate
Level 4 PE = PolyethylenePP = Polypropylene
Level 5 Bio-based Polymers
Chlorine, intermediates, many additives, byproductsIntermediates, fewer additives, some byproductsSome chlorine used, intermediates, waste byproductsHazardous intermediates, difficult to recycleSome chlorine used, intermediates, toxic solvents, BPAA copolymer or alloy of conventional plasticSome hazardous chemicals, high recycling rateChloride catalyst, some byproductsFewer additives, some byproducts, high recycling rateFewer additives, some byproductsNaturally based, e.g. starch, cellulose; compostable
MostHarmful
LeastHarmful
PVC#3
PS#6
PU, PC,ABS, TPE
PETE#1
EVA
PE #2, #4 PP #5
Bio-based Polymers
TPEMetallocenes
This ranking is based on the health and environ-mental hazards createdduring production, use
and disposal of the listed plastics. The code
numbers are used by the industry to identify the
major plastic resins.
A key to the plastics and some hazards associated with production, use and disposal

a returnable deposit on the sale of bottles of beer, wine,soda and other beverages.
Two high volume synthetic plastics are found near thebase of the pyramid because they are far cleaner thanPVC. These are polyethylene and polypropylene.Although these are both synthetic resins derived fromnonrenewable fossil fuels, they are produced withouttoxic intermediates and far fewer additives or toxic by-products. Polyethylene, which ranks first in productionamong all resins, comes in two major versions: highdensity (HDPE or # 2), which is widely used in manyapplications, and low density (LDPE or # 4), which iscommonly used in plastic bags. Both types are highlyrecyclable. Polypropylene (PP or # 5), often used forcontainers for products such as yogurt and prescriptiondrugs, can readily be recycled but few recycling marketshave been developed.
Even more environmentally preferable are the bio-based polymers, which are derived from natural renew-able materials such as cornstarch or cellulose and whichcan be composted into beneficial organic matter toenrich soils rather than landfilled or incinerated. TheInterface Fabrics company, among others, is pilot test-ing textile fibers made from bio-based polymers. Aneven higher standard would give preference to bio-based plastics developed from sustainable agriculturalpractices (e.g., without the use of pesticides and mini-mal fossil fuel inputs) that do not rely on geneticallymodified organisms or displace food products from serv-ing the marketplace. Genetically engineered productsshould not be used in making bio-plastics.
Minimizing the disposal impacts of PVC favors the useof natural organic-based materials whenever practicalbecause they biodegrade and represent a renewableresource. In many cases, however, a durable man-madeplastic offers unique advantages to alternatives made oforganic matter, minerals or metals.
Fortunately, as Figure 4 shows, many other syntheticplastic resins are widely available for product manufac-turers to choose from to avoid the harmful impacts ofPVC. And the emergence of bio-based plastics in thecommercial marketplace gives an even greater boost tothe success of sustainable production and environmen-tally preferable purchasing.
Safer Alternatives to PVCare Widely Availableand Effective PVC-free alternatives are already widely available formany applications. Several extensive reports haveidentified available and affordable alternatives to PVC(Ackerman 2003, Thornton 2002, Greenpeace 2001).Table 11 provides a few examples of available PVC-Freealternatives for several common PVC products. Thesources reviewed below provide specific guidance onwhich vendors currently provide alternatives to specificproducts representing some of the most common uses ofPVC. Several of these resources are searchable onlinedatabases of PVC-free products. The alternativesdescribed can be currently found in the marketplaceand are functionally equivalent, i.e., are as effective as aPVC product for the specified end use.
Building MaterialsEffective alternatives are available now for most con-struction-related uses of PVC. Several databases, suchas those offered by the Healthy Building Network(HBN 2004: http://www.healthybuilding.net/pvc/alternatives.html) and Greenpeace (Greenpeace 2004:http://archive.greenpeace.org/toxics/pvcdatabase), listthese alternatives. A large number of constructionprojects, including the Sydney 2000 Olympic Stadiumand the new EPA headquarters in Washington, DChave been constructed with little or no PVC(Greenpeace 2001, Greenpeace 2004b).
Medical ProductsThe Sustainable Hospitals Project is an excellentresource for healthy medical products, including PVC-free alternatives for gloves, bags and tubing. They oper-ate a Website that includes extensive listings of prod-ucts by category, by “hazard” or by manufacturer (SHP2000: http://www.sustainablehospitals.org/cgi-bin/DB_Index.cgi).
Office SuppliesThe Lowell Center for Sustainable Production has iden-tified alternatives to the use of PVC in office supplies(SHP 2000: http://www.sustainablehospitals.org/cgi-bin/DB_Index.cgi). For example, instead of the com-mon vinyl-coated three-ring binder, you can purchasean equivalent binder made of polypropylene with recy-cled content.
PackagingThe Grassroots Recycling Network has identified specif-ic brand products that are currently packaged in PVC
CH
AP
TE
R
8:
D
ON
’T
BU
Y
IT
—
Sa
fe
r
Alt
er
na
tiv
es
t
o
PV
C
49

CH
AP
TE
R
8:
D
ON
’T
BU
Y
IT
—
Sa
fe
r
Alt
er
na
tiv
es
t
o
PV
C
50
PVC Product
Automobile Components
Blinds
Bottles
Flooring (Hard)
Flooring (Resilient)
Gloves
Medical Bags, Tubing, Etc.
Pipes
Roofing (For Flat Roofs)
Siding
Wallpaper
Windows
Available Alternatives
Polyolefins1
Wood3, Aluminum3
High Density Polyethylene (HDPE)4
polypropylene (PP) Polyethylene Terephthalate (PET)4
Bamboo5, Ceramic Tile5
Recycled Glass Tile5
Cork6, Stratica6, Linoleum6
Nitrile7
Polyurethane7,8, Silicon7,8
Polypropylene7,8, Polyethylene7,8
High Density Polyethylene5,6,9
Copper6,9, Cast Iron5,9
Vitrified Clay5, Concrete9
TPO- Thermoplastic Polyolefin5
EPDM- Ethylene Propylene DieneMonomer5
Wood6, Fiber Cement6, Aluminum5
Natural Fiber6
Wood6, Aluminum6
Affordability
Competitive for most uses1,2
Varies
Slightly more expensive. Costs expected to godown with increased market share.
Bamboo is comparable to vinyl.5 Ceramic andrecycled glass are more expensive.5
Alternatives cost more up front but last nearly twiceas long. Savings of 30-50% over 20 years.6
Cost competitive when purchased in large quantities.7
Prices vary but most hospitals are able to negoti-ate comparable rates through high volume pur-chasing.8 Prices will fall as market increases.8
Decreased labor cost for installation reduces impor-tance of price.6,9 Pipe selection rarely determined bymaterial cost differences in this industry6,9
Comparable to similar vinyl roofing5
Varies - High quality, longer lasting materials cancost less than PVC if you shop wisely.6 Aluminumis more expensive but very durable and mainte-nance free.5
More expensive5
Varies widely6
Sources and Notes: 1 - Greenpeace 2001; 2 - Singhofen 1997; 3 - Dickey 2002; 4 - GRRN -2004; 5 - CEC 2004; 6 - Ackerman 2003; 7 - Ruzickova2004; 8- SHP 2000; 9 - Harvie 2002. Note: This table is not meant to be exhaustive, as there are endless uses of PVC. Rather, it is provided to offer afew concrete examples of available and affordable alternatives to PVC. In choosing alternative materials for this table, an effort was made to excludethose having significant environmental and/or health concerns of their own. This does not imply an endorsement by CHEJ or EHSC of any materials listed.We do believe, however, that the materials listed offer an improvement over PVC. For any material, there are advantages and disadvantages and wewould encourage you to thoroughly research all purchasing decisions.
● ● ● ● ● Table 11 ● ● ● ● ●
PVC-Free Alternatives to Common Materials
bottles (GRRN 2004a: To view their list online, go tohttp://www.grrn.org/pvc). The market share of PVC forcontainers has steadily declined to about 2% of all bot-tles sold (Anderson 2004). The mostly widely usedPVC-free alternatives for plastic bottles are high densitypolyethylene (used for milk products and almost all per-
sonal and household care products) and PET (used formost beverages and vegetables oils, for example).
Toys and Other Consumer ProductsGreenpeace has established a Website that providesinformation on PVC alternatives for more general con-

sumer items, including toys. This site includes a toy-company report card that rates companies on a scale of1 to 5, from being completely PVC-free to refusing tochange policies or provide information (Greenpeace2003, Greenpeace 1997: http://archive.greenpeace.org/comms/pvctoys; a more recent 2003 version can befound at http://www.greenpeaceusa.org/features/details?item_id=526899). It is worth visitingeach site as they both contain unique information.Greenpeace also has issued a report on worldwide PVCrestrictions that includes a list of companies, by coun-try, that have made a decision to phase out the use ofPVC in their products (Greenpeace 2001:http://archive.greenpeace.org/toxics/reports/restric-tions.pdf).
AutomobilesMany automobile makers are beginning to find andimplement alternatives to PVC. General Motors, theworld’s largest auto manufacturer, was the first to make apublic statement of its intention to stop using vinyl. GMplanned to end the use of PVC in car interiors by 2004,cutting total PVC use by 30% (CCC 2004:http://www.cleancarcampaign.org/pvc_elvbackground.shtml). Also, other automakers, while remaining lesspublic, have taken similar steps. Daimler Benz has notused PVC for interiors or undercoating in Mercedesautos since 1995 and Honda said they would graduallyreplace PVC in interiors by 2003 (Greenpeace 2001).Pontiac has found a unique way of applying polyolefinskin for full instrument panel design, instead of PVC.Likewise, Mitsubishi has substituted polyolefins in itsinstrument panels and door trimmings (Greenpeace2001). According to the Clean Car Campaign—anational campaign coordinated by state, regional andnational environmental organizations promoting a cleanrevolution in the motor vehicle industry—Volvo,Nissan, Toyota, and BMW are all using alternativematerials to PVC in various applications and to varyingdegrees (Singhofen 1997). And according to theGreenpeace Review of Restrictions and PVC-FreePolicies Worldwide, “Ford world-wide has set itself andits suppliers the ambitious target to eliminate applica-tions of PVC by the 2006 model year” (Greenpeace2001).
Appendix A to this report lists some common productsavailable on the market that may contain PVC, includ-ing which products are bottled or packaged in PVC con-tainers. Used with the resources reviewed above, con-sumers can easily leverage this knowledge to identify andreplaced their purchases of PVC with safer alternatives.Also available is a list of specific products packaged withPVC (GRRN 2004a: http://www.grrn.org/pvc).
PVC Alternativesare AffordableThe following section on the affordability of replacing PVCwith safer alternatives was derived primarily from the report“The Economics of Phasing Out PVC,” written by FrankAckerman and Rachel Massey of the Global Developmentand Environmental Institute, Tufts University, December2003 (Ackerman 2003). This section was adapted fromthe above report with permission of the authors. The refer-ences used by the authors are cited in the original reportwhich can be found in its entirety at www.ase.tufts.edu/gdae/Pubs/rp/Economics_of_PVC.pdf.
The serious health and environmental impacts causedby the production, use and disposal of PVC raise twoimportant economic policy questions.1) Are there affordable alternatives to replace most
uses of PVC?2) What would be the economic impact on society if
PVC were phased out?
The Tufts University Global Development andEnvironment Institute addressed both of these questionsin their recent report The Economics of Phasing Out PVC(Ackerman 2003). This report found that alternativesto PVC do exist and that PVC does not offer enormouseconomic advantages over other materials.
PVC-free alternatives are already competitive in themarket place. The Tufts researchers found affordablealternatives available in every commercial and institu-tional PVC market they evaluated, including pipes,roofing materials, flooring, medical gloves, siding andwindows (Ackerman 2003). Because PVC is found inso many products, the alternatives also widely differdepending on the product. The estimated costs ofphasing out specific PVC products will likewise differfrom one product market to the next. Many manufac-turers and suppliers have been identified who currentlysell cost-comparable alternatives to PVC used in med-ical bags and tubing, office supplies and building andconstruction materials.
The Tufts report concluded that a PVC phase-out isachievable and affordable and that it would not place alarge burden on the economy. The study finds that theadvantages of PVC are often overstated, that PVC isnot substantially cheaper than many alternatives, andthat alternatives providing equal or better performanceare available for almost every use of PVC. In somecases, the costs of the alternative materials are alreadycomparable to PVC when costs are measured over the
CH
AP
TE
R
8:
D
ON
’T
BU
Y
IT
—
Sa
fe
r
Alt
er
na
tiv
es
t
o
PV
C
51

useful life of the product. In other cases, the alternativesare slightly more costly in today’s market, though theyare likely to come down in cost as their market shareexpands. There are “good reasons to expect the costs ofalternatives to decline over time.” The report also foundthat the continued use of PVC offers small short-termgains in some areas, and none at all in others.
The Costs of Replacing PVC:Three StudiesThe Tufts report identified three detailed studies, allpublished in the mid-1990’s, which estimated the costsof phasing out PVC. All three studies found PVC to beonly modestly cheaper than the alternatives. The firststudy, conducted by the U.S.-Canada International JointCommission (IJC) for the Great Lakes, examined thecost of phasing out PVC as part of its 1993 “Strategy forVirtual Elimination of Persistent Toxic Substances.”This report was written for the IJC by a Canadian con-sulting firm, the Hickling Corporation, and updated in1994. Charles River Associates (CRA), a U.S. consult-ing firm under contract to the Chlorine Institute, con-ducted the second study. This report, which was pre-pared in response to the IJC report, provided an eco-nomic analysis of the benefits of chlorine and relatedchemicals and included an analysis of PVC. The thirdstudy, conducted by Environment Canada in 1997, eval-uated the options for replacing chlorine-based productsand included a detailed look at the alternatives to PVC(Ackerman 20003a).
Each of these studies evaluated many specific uses ofPVC and compared the prices of PVC products to theirPVC-free alternatives. Environment Canada createdtwo sets of price comparisons: alow cost case based on the leastexpensive available alternativeand a high cost case based onhigher-priced alternatives. Table12 provides a summary of the esti-mated costs of replacing PVCmade in each of these three stud-ies. The table shows the costincrease that would result fromswitching to PVC-free alterna-tives, expressed in dollars perpound of PVC produced (updatedto 2002 prices) for each study.Cost estimates are shown sepa-rately for pipes and for all otherproducts since pipes representabout half of all PVC use. The
pipe and non-pipe figures in Table 12 were averaged toobtain a rough estimate of the total cost of replacingPVC.
According to the Tufts report, this table shows thatthere was a remarkable degree of agreement betweenthe Hickling and CRA studies. These studies foundnearly identical average costs for replacing PVC—$1.07to $1.15 per pound. The Environment Canada low esti-mate had an average cost of about half this much, dueto its lower estimate for pipe costs. For the non-pipeuses of PVC, there also was fairly good agreementbetween CRA, Hickling and the Environment Canadalow estimate ($0.87 to $1.10 per pound). The datashows that PVC is only modestly cheaper than the alter-natives. The Environment Canada study, which includ-ed the full cost of installation, found alternative materi-als would cost just 6% more than vinyl, and building aPVC-free home would increase the cost of a home byjust 0.4 percent—increasing the cost of a $150,000home to $150,600 (CIS 1997, Thornton 2000).
Factors FavoringPhase-Out of PVCAccording to the Tufts report, cost estimates such asthose made by Environment Canada, based on currentmarket prices, tend to overstate the economic benefitsof PVC. Four reasons were given for this conclusion.
1) Life Cycle CostsOften Favor Alternatives. Some of the alternatives have higher initial purchaseprices than PVC products, but are actually less expen-sive over the useful life of the product. The total costC
HA
PT
ER
8
:
DO
N’
TB
UY
IT
—
S
af
er
A
lte
rn
at
ive
s
to
P
VC
52
Average is the unweighted average of pipes and "all other uses." Hickling data excludes windows.
Source: Ackerman 2003
● ● ● ● ● Table 12 ● ● ● ● ●
The Cost of Replacing PVCUS dollars per pound of PVC (2002 prices)
PipesAll other usesAverage
CRA (industry)
$1.43$0.87$1.15
Hickling(for IJC)
$1.03$1.10$1.07
Low
$0.15$0.94$0.55
High
$0.33$3.84$2.08
Environment Canada

over a product’s life cycle is thecost that ultimately matters tothe user. For example, the main-tenance and repair costs for somebuilding materials, such as floor-ing, can be the largest cost of aproduct’s life cycle. In suchcases, the lowest maintenanceproduct is often the cheapest ona life cycle basis, regardless if ithas the lowest purchase price. Inthis example, PVC or vinyl floor-ing is the cheapest option forcommercial and institutionalflooring on an initial cost basis,but among the most expensiveoptions on a life cycle basis.When full life cycle costs aretaken into account, PVC flooringloses out to alternatives that mayhave a higher initial price but lastlonger and are more easily main-tained (Ackerman 2003).
2) Mass ProductionReduces Costs.Most products are cheaperwhen they are produced in largequantities. Costs typically dropas production volume increases.Currently, the advantages tomass production favor PVC, asmany PVC products are pro-duced in huge volumes.However, the production of thealternatives could likewise growin volume in the future, makingthem less expensive and morecompetitive than they are atpresent. There are also learningcurves that affect costs over time. As an industry gainsexperience with a production line, “bugs” are workedout, process improvements develop, and maintenanceprocedures and schedules are improved. All of thesefactors help to reduce costs.
3) PVC Products Endanger Their Users. As previously discussed, the harmful effects of PVC aresometimes felt by the users of the products. For exam-ple, plasticizers in flexible PVC products such as chil-dren’s toys can leach out of the product during use pos-ing health hazards to users (see Chapter 3).
4) Environmental Protection Costs AreRoutinely Less than Anticipated. History has shown that the actual costs of compliancewith environmental standards are often lower than theoriginally predicted costs. One of the best examples ofthis occurred in the PVC industry in 1974 when theOccupational Safety and Health Administration(OSHA) established a strict standard for workplaceexposure to vinyl chloride, the raw material used to pro-duce PVC. When this standard was proposed, the vinylindustry claimed that the costs of compliance would bein the “billions” and that the industry might shut down.Instead, actual costs were only a fraction of the originalestimates primarily because the industry developed new
CH
AP
TE
R
8:
D
ON
’T
BU
Y
IT
—
Sa
fe
r
Alt
er
na
tiv
es
t
o
PV
C
53
The Impact of a PVC Phase-Out on Jobs
The Tufts report examined the impact that phasing out PVC would
have on jobs. Using data provided by the Alliance for Responsible
Use of Chlorine Chemistry (ARCC), they estimated that there are
approximately 126,000 workers in PVC fabrication plants and
approximately 170,000 workers at chlorine-producing and chlorine-
using chemical plants in the U.S. However, most of the chlorine
workers are in non-PVC related chlorine sectors such as paper mills,
pesticides, and solvents. The Tufts researchers estimated that only
about 9,000 of the 170,000 workers were employed in the produc-
tion of vinyl chloride monomer (VCM) and PVC resin.
The Tufts report identified 12 operating VCM plants in the U.S. as of
2000, with a capacity to produce 17.4 billion pounds of VCM.
According to the report, seven of the facilities that account for
more than half the capacity were jointly located with PVC plants
owned by the same company. The report also showed that as of
mid-2003, ten companies produced 15.8 billion pounds of PVC resin
at twenty locations in the U.S. Three other plants were idled by the
recession with an additional capacity of 1.2 billion pounds.
The Tufts report suggested that replacing PVC with safer alternatives
will change some of these jobs: from fabricating PVC products to
fabricating the same products from other materials, most often
other plastics; or from making vinyl chloride and PVC resin to mak-
ing safer substitutes. However, the alternatives are likely to require
about the same total employment as production of PVC. In some
cases, the same workers who currently make PVC products will be
employed making products from PVC alternatives
(Sources: Ackerman 2003 and Ackerman 2003c).
cost effective technologies to comply with the regula-tion. Other studies have confirmed this pattern of over-estimating compliance costs (Ackerman 2003b).
In summary, the Tufts report concluded that a “PVCphase-out is achievable and affordable. The alterna-tives are increasingly well known and well developed,
and in many cases are already cost-competitive withPVC. It is realistic and practical to build health andenvironmental considerations into materials choices formunicipal infrastructure, commercial and residentialbuildings, medical supplies and consumer products.The cost impacts of substitution will be modest and willgrow smaller over time” (Ackerman 2003).
CH
AP
TE
R
8:
D
ON
’T
BU
Y
IT
—
Sa
fe
r
Alt
er
na
tiv
es
t
o
PV
C
54

PV
C:
B
ad
N
ew
s
Co
me
s
In
T
hr
ee
s
55
IXRECOMMENDATIONS● Policy makers at the local, state and federal
level should enact and implement laws thatsteadily reduce the impacts of PVC disposaland lead to a complete phase-out of PVCuse and waste incineration within ten years.
● A new materials policy that embracesaggressive source reduction of PVC shouldbe adopted to steadily reduce the use ofPVC over time.
● Federal and state waste management priori-ties should be changed to make incinerationof PVC waste the least preferable disposaloption.
● In the interim, any PVC waste generatedshould be diverted away from incinerationto hazardous waste landfills.
● Consumers should take personal action tobuy PVC-free alternatives and to remove PVCfrom their trash for management as house-hold hazardous waste.
● Communities should continue to organizeagainst PVC-related dioxin sources such aswaste incinerators while working to pro-mote safer alternatives.
Personal and political actions must be taken to preventharm to human health and the environment from theuse and disposal of PVC. If we don’t burn PVC, theformation of dioxins and other toxic by-products ofcombustion will be prevented. If we can reduce theflow of PVC to landfills, leaching of toxic additives willbe avoided. If we promote and purchase safer alterna-tives to PVC whenever they are available, then toxicpollution will be prevented throughout the PVC lifecycle.
Making Choices: A NewMaterials Policy for PVCWhen solid waste experts in the U.S. first establishedmeaningful management goals about fifteen years ago,there was universal support for source reduction as thetop priority (USEPA 1989). Table 13 shows the priori-ties established by the USEPA for the most environ-mentally sound strategies for managing solid waste.Source reduction is the top choice. It means takingaction to avoid or prevent waste from being generatedin the first place. In keeping with this philosophy, thefirst priority in managing PVC waste should be to avoidmaking it or using it in the first place.
We should adopt a universal policy and practice acrossthe country to avoid the purchase or use of PVC when-ever possible in order to prevent waste managementproblems before they start. We need to dramatically
TAKE ACTIONPreventing Harm from PVC Use and Disposal

and steadily reduce the amount of PVC waste producedthrough a source reduction strategy that targets PVC-containing products.
The second best option, if generating waste can’t beavoided in the first place, is to reuse, recycle and com-post the wastes. With PVC waste, this is not anoption. Most PVC products cannot be reused or recy-cled, and definitely will not compost. What is the bestoption for PVC waste after source reduction and recy-cling? The answer lies in defining what ultimate dis-posal strategy is preferred once PVC waste hasunavoidably been generated.
Federal solid waste policy fails to express a preferencebetween waste disposal in incinerators or in landfills,treating each as equally usable options (See Table 13).Consistent with this lack of judg-ment, the USEPA has failed forover 12 years to finalize its reassess-ment of the health risks from expo-sure to dioxins. In addition, theUSEPA has failed to take aggressiveaction to prevent dioxins and othertoxic pollutant releases at theirsource, such as working to reducePVC use and disposal.
Some states have chosen incinera-tion as their top waste managementoption, favoring even dirty massburn facilities over landfill disposal.For example, as shown in Table 14,under Maine state law, waste incin-eration is preferred over landfill dis-posal (MRSA 2004a). The State ofMaine, in turn, burns the highestproportion of its waste (after recy-cling) of any state in the country(see Table 7 in Chapter 5).
By favoring waste incineration,such policies encourage the contin-uous formation of dioxins and othertoxic air emissions, and the genera-tion of toxic ash requiring land dis-posal. The burning of PVC inmunicipal solid waste releases diox-ins and toxic additives. Land dis-posal, on the other hand, minimizesdioxin formation by avoiding inten-tional combustion, although somehighly polluting landfill fires areunavoidable. Land disposal addi-tives in PVC will leach and eventu-
ally contaminate groundwater. However, this is alsotrue for incineration, since a large amount of dioxin andmetal-laden incinerator ash also requires land disposal.
We believe that a new health-based materials policy isneeded to reorder current federal and state priorities forwaste management. Such a health-based policy shouldbe designed so that the greatest effort is invested in thehighest priority options as shown in Table 15. We pro-pose a new set of priorities for PVC waste managementthat are based first and foremost on targeted sourcereduction steps that will prevent the creation of PVCwaste in the first place. This strategy aims to aggres-sively and continuously replace the most hazardous usesof PVC with safer alternatives whenever available.
These source reduction steps include immediate action
CH
AP
TE
R
9:
T
AK
EA
CT
ION
—
P
re
ve
nt
ing
H
ar
m
fr
om
P
VC
U
se
a
nd
D
isp
os
al
56
● ● ● ● ● Table 13 ● ● ● ● ●
National Priorities for Solid Waste Management
Highest Priority
Middle Priority
Lowest Priority
SOURCE REDUCTION
RECYCLING
DISPOSAL
Includes Reuse
Includes Composting
Includes both Combustionand Land Disposal
Source: USEPA 2004d, USEPA 1989
● ● ● ● ● Table 14 ● ● ● ● ●
The State of Maine's Waste Management PolicyFavors Incineration Over Landfill Disposal
Highest Priority
2nd Priority
3rd Priority
4th Priority
5th Priority
Lowest Priority
SOURCE REDUCTION
REUSE
RECYCLING
COMPOSTING
INCINERATION
LAND DISPOSAL
Includes reducing boththe amount and toxicity
of the waste
Of biodegradable waste
And other wasteprocessing which reduces
waste volume
Source: MRSA 2004a

CH
AP
TE
R
9:
T
AK
EA
CT
ION
—
P
re
ve
nt
ing
H
ar
m
fr
om
P
VC
U
se
a
nd
D
isp
os
al
57
to end the use of PVC bottles and packaging. Othersource reduction targets would include short-lived dis-posable PVC products and those that contain lead, cad-mium and phthalates. Fire-vulnerable uses of PVC inbuildings and vehicles should be replaced with saferalternatives. To avoid toxic by-products generated dur-ing structural fires, vinyl siding, roofing and windowframes among other uses, should be replaced with saferalternatives.
This health-based materials policy would favor land dis-posal over incineration only temporarily and only forlegacy waste from the stock of current PVC in use andany other unavoidable PVC waste. This waste would bemanaged by land disposal in a hazardous waste landfill.
A new materials policy for PVC defines incineration asthe least favorable waste disposal option. We need tocreate effective systems to collect and divert PVC in
the waste stream away from incineration. PVC shouldbe actively managed as a serious problem waste akin tohandling household hazardous waste (or other non-haz-ardous problem wastes like propane tanks or latexpaint). This would mean educating consumers to iden-tify PVC waste and separate it from the waste stream.As an interim practice, PVC should be diverted awayfrom incineration for collection and transfer to a triple-lined “secure” hazardous waste landfill. With time,after PVC has been replaced with safer materials, theneed to divert PVC to landfills would diminish.
Our vision for managing PVC waste is positive. Wepromote safer alternatives to PVC that are effective,affordable and available now. Alternatives that existfor most uses of PVC are able to do the job well at acost that is comparable to PVC. Substituting safermaterials for PVC is consistent with principles of clean,sustainable production (see Chapter 8).
● ● ● ● ● Table 15 ● ● ● ● ●
Proposed Priorities for PVC Waste Management
Step # 1 - SOURCE REDUCTION
Step # 2 - SOURCE REDUCTION
Step # 3 - SOURCE REDUCTION
Step # 4 - SOURCE REDUCTION
Step # 5 - SOURCE REDUCTION
EXTENDED PRODUCER
RESPONSIBILITY
REUSE AND RECYCLING
LAND DISPOSAL
INCINERATION
Ban disposable PVC bottles, containers and packaging.
End the use of lead and cadmium in all PVC products.
Phase out all disposable, non-durable uses of PVC.
End the use of PVC products containing phthalates.
Phase out PVC uses that are vulnerable to fire hazards,
e.g., in building materials and cars.
Require manufacturers to finance the "take-back"
and safe management of PVC products at the end
of their useful life.
Achieve the low potential to recycle bulk PVC waste into
the same type products.
In the interim, divert any unavoidable PVC waste away
from incineration for disposal in hazardous waste landfills.
Ban open burning and incineration of
any waste containing PVC
Highest Priorities
2nd Highest Priority
3rd Priority
4th Priority
Last Option

CH
AP
TE
R
9:
T
AK
EA
CT
ION
—
P
re
ve
nt
ing
H
ar
m
fr
om
P
VC
U
se
a
nd
D
isp
os
al
58
To realize steady progress on the path to a PVC–FreeFuture, many personal and political actions by manypeople will be necessary.
Personal StepsTaking personal responsibility for preventing harm fromPVC is an important place to begin. Here are some keyactions you can take as a consumer and contributor togenerating household PVC waste.
1. Identify PVC Products. Look for the “# 3” or the letter “V” inside the plasticrecycling symbol (or sometimes beneath the recyclingsymbol) on the bottom of bottles and on clear plasticpackaging such as blister packs. The # 3 and the letterV indicate that the plastic is made from PVC. Also,look for the words “PVC” or “vinyl” on the product(e.g., plastic pipe) or on its packaging. You will need touse other strategies to identify PVC products that arenot labeled. Does the unlabeled soft plastic, such asthe skin on a 3-ring office binder or a shower curtain,have that “new car smell” of chemicals? If so, it’s prob-ably vinyl and you’re breathing phthalates, a PVC addi-tive. Check the PVC product listing in Appendix A forlikely suspects. You can also call the company and askthem whether they use PVC. If they do, ask them toswitch. If they don’t, thank them for being environ-mentally conscientious.
2. Buy and Promote Safer Alternatives. Search for and purchase non-PVC alternatives (seeChapter 8). Always avoid PVC bottles and plastic wrap(e.g., Saran Wrap). Consult Internet resources onPVC-free alternatives for office supplies, medical sup-plies, toys and building materials (see Chapter 8).Educate others about PVC hazards. Promote saferalternatives in your homes and business, with yourfriends and neighbors. If the best alternative is a plas-tic, look for the cleaner plastics, such as polyethylene(# 4 or # 2) or polypropylene (# 5) (See Figure 4).
3. Start Collecting PVC. Don’t toss PVC in the household trash, especially ifyour garbage is incinerated (see Table 7 to see if yourstate relies heavily on burning its waste). Put the PVCaside in an enclosed cardboard box and/or garbage bagaway from the sun and possible ignition sources. Seehow much PVC you can salvage and segregate from thewaste stream. Every bit of PVC diverted away fromincineration will prevent some dioxin formation.
4. Ask the Manufacturer to Take it Back. If you can identify who made the product containingPVC, bundle it up in a secure cardboard box and mail itback to the Chief Executive Officer of the productmanufacturer (search the Internet for the address of thecorporate headquarters and the CEO’s name). Enclosea polite note asking that they take personal and corpo-rate responsibility for safely managing this problemmaterial at the end of its life. Tell them you won’t buyany more of their products until they make the switchto PVC-free manufacturing. Warn them not to burn it.Ask them to dispose of it at a hazardous waste landfillor to securely store the PVC unless they can recycle itfor high value uses. Ask for a written response.
5. Dispose of Your Collected PVC as YouWould Household Hazardous Waste. If you have too much PVC waste to mail back, ask thatyour community household hazardous waste collectionprogram accept PVC plastic for secure hazardous wasteland disposal, not for incineration. Explain the reasonswhy PVC is a serious problem waste. Encourage othersto separate and divert PVC away from incineration.
Community Action: People,Voices and CommunitiesBeing a PVC-free consumer is not enough. The realpower needed to adopt a new health-based materialspolicy for PVC lies in the number of people involved.When friends and neighbors work together to organizetheir community to take action, major changes canoccur. Grassroots action by community groups aroundthe country has already stemmed the damage from PVCuse and disposal. Medical waste incinerators are rapidlybeing replaced due to community-based campaigns thatpromote non-incineration alternatives (see case studiesin Chapter 5). Few new municipal waste incineratorshave been sited in the last ten years due to environ-mental health concerns and community opposition.

CH
AP
TE
R
9:
T
AK
EA
CT
ION
—
P
re
ve
nt
ing
H
ar
m
fr
om
P
VC
U
se
a
nd
D
isp
os
al
59
Community action has also repeatedly changed nation-al waste policy from the grassroots up. Join with yourfriends and neighbors to make a difference. Join a localgroup or start a new one to take action against dioxinsources such as incinerators, backyard burning, landfills,biomass plants or building fires where PVC use and dis-posal release toxic chemicals into the environment. Forreferrals and how-to tips, contact the Center forHealth, Environment and Justice (www.chej.org).
Organizing To WinAround Issues on PVCEvery day, people facing threats to their health and envi-ronment speak out about PVC problems. They look forproof that a landfill leaks, or seek to undertake a healthstudy to link emissions from an incinerator to cancer, orfind evidence that a polluting company has a bad envi-ronmental record. However, simply speaking the truth
about landfills, incinerators, toxicproducts or previous violations won’tstop the poisoning of our bodies andthe environment.
The truth is only a start. In orderfor things to change, the truth hasto be understood by a large groupof people who then use this knowl-edge to fuel their efforts to win jus-tice. The truth won’t stop the poi-soning, but mobilizing and organiz-ing will.
According to Webster’s dictionary,organizing is “uniting in a body orbecoming systematically arranged.”Organizing to protect our commu-nities from environmental harmmeans pulling together a largeenough, diverse enough, activeenough group of people to convincecorporations and the governmentthat they have to stop making peo-ple sick with toxic chemicals.
Organizing is how we restore thebalance between the rights of peopleto safe products and healthy com-munities, and the rights of corpora-tions to profit. We will never haveas much money as the corporatepolluters. We will never be able to
afford their Madison Avenue media campaigns or theirtwenty-four hour access to elected officials. But we canbuild our own power to overcome their influence. Wecan do this by organizing to demonstrate the strength ofour numbers and the righteousness of our demands.
Successful organizing happens when a group of peoplefind visible ways to use the truth to wake up the con-science of a larger group. In an era when politics isdefined by scandals and sound bytes, organizing canremind the American people that political life is sup-posed to be about self-government, justice and thecommon good.
After years of doing it, we’ve come to the conclusionthat organizing is more of an art than a science. At thesame time, there are some basic rules for organizing thatusually hold true. These rules aren’t always applicable,but they are right often enough that you should consid-er them if you start to get organized around an environ-mental issue in your community.
C A S E S T U D Y
Intimate Brands Responds to 6,000Consumers and Stops Using PVC
Greenpeace and the Center for Health, Environment and Justice(CHEJ) teamed up in 2001 to launch a consumer campaign against amajor beauty supply company who distributed products packagedin PVC containers. The Victoria’s Dirty Little Secret campaign suc-cessfully targeted Intimate Brands, the parent company of Victoria’sSecret and Bath & Body Works, who agreed to phase-out PVC con-tainers from their product line by the end of 2003 after receiving6,000 faxes, phone calls, and postcards in one month.
Organizers launched the campaign at an Eco-Conference held annu-ally on college campuses, distributed flyers and postcards, and post-ed an action alert allowing Website visitors to fax a letter or send apostcard directly to Intimate Brands. The company initially respond-ed by sending defensive letters to the individuals that wrote tothem. However, as more letters continued to come in, they took thedemand more seriously. In February 2002, they met with represen-tatives from CHEJ and Greenpeace and presented a plan to phaseout the use of PVC bottles in both their Victoria’s Secret and Bath &Body Work’s line. PVC bottle production would stop by 2003 andby 2005 all PVC bottles would be out of circulation. The effective-ness of this campaign is a testimony to the positive changes thatcan be made when people come together and pressure companiesto put safety first (Source: Lester 2003).

CH
AP
TE
R
9:
T
AK
EA
CT
ION
—
P
re
ve
nt
ing
H
ar
m
fr
om
P
VC
U
se
a
nd
D
isp
os
al
60
Basic Organizing Rules Power determines the outcome. If two or more groups care about an issue, and one ofthem has a lot more power, that group will get what itwants, no matter what the facts are or who will be hurt.
Our power comes from people, whilecorporations and government’s powercomes from money.Communities need to use strategies that depend onpeople’s creativity, courage and caring. The corpora-tions and government will use strategies that depend onthings that can be paid for, like experts and lawyers.
Polluters and government agencies writethe rules so they can win using expertsand lawyers, which are their strength. You can assume going in that if you play exactly accord-ing to the rules of their game, you will lose most of thetime, whether you are at the slot machines in AtlanticCity or the hearing process of your state environmentalagency. Create your own rules instead.
To win, communities will have to workharder than polluters and governmentagencies do. Polluters and agencies are doing what they do becausethey are paid to. They’ve done it before, and they knowmost of the facts before the fight even starts. You areopposing them because you believe your health and yourcommunity are at risk. This gives you an unmatchedmotivation for working harder than they do.
These rules may seem harsh and they are. And some-times things turn out to be easier than these ruleswould lead you to expect. But when your community isat stake, it’s important to start out vigilant, alert andready to face the challenges ahead.
Experience has taught us that organizing isn’t easy.Recognizing this should help you to be forgiving of eachother and ourselves. We are trying to build a democrat-ic society without adequate blueprints and models, soour trial-and-error method has to leave room for experi-mentation and mistakes. And recognizing how neces-sary organizing is should help you to be inclusive andpersistent. There are no magic facts. There are no per-fect heroes to give perfect speeches that will convincethe polluters to stop polluting. There is only thedogged determination of people working together to
protect their own health, their families’ health and thehealth of their communities. This is why we organize.(See below for “Ten Simple Steps To Organizing.”)
Mobilizing vs. Organizing What is the difference between mobilizing and organiz-ing? Take the 2004 protests in New York City aroundthe Republican Convention. There was a large mobi-lization—demonstrations that brought out over 800,000people—and various targeted actions. The main goalwas to influence the results on Election Day and getpeople to understand the issues.
Mobilization is a thing that good organizers do.Mobilization is getting people together, moving peopleout. It’s bringing people in to do an action. It’s usingeverything including phone calls, personal visits andhanding out fliers to bring a certain level of conscious-ness to the community. When trying to change policyand public opinion and purchasing choices, you need touse both organizing and mobilizing.
As a result of a mobilizing initiative, you will likely findpeople who will join your organization and build yourorganization’s base. However, most people who aremobilized are not likely to join but their voice/presencein an activity increases your power for that moment.You are not likely to know how folks got to the mobiliz-ing activity. Maybe they saw it listed on the internet atMoveOn.org or received an e-mail flyer, or a friendagreed to have dinner with them afterwards if they metat an event.
In organizing, leaders understand how people got there.For an organizer it would be important to have 100people at a demonstration and to know exactly howthose people got there. You know which leaders talkedto people and can talk to them again, not just for thisone event, but maybe for another campaign. Thinkabout how to use mobilization opportunities to moveyour issues and to identify new members for your organ-ization.

CH
AP
TE
R
9:
T
AK
EA
CT
ION
—
P
re
ve
nt
ing
H
ar
m
fr
om
P
VC
U
se
a
nd
D
isp
os
al
61
Ten Simple Steps ToOrganizing
1. Talk and ListenIf you are one, two or three individuals without anorganization, you’ll need to talk with other people inyour community to build a group. If you are alreadypart of an organization, then your next step is to talk tothe people in your organization about initiating a cam-paign around a PVC issue in your community. Brainstorm a list of groups and individuals whose inter-ests are most directly affected by PVC, then determinewho you need to talk with first. Who are the peoplethat are most directly affected? Who are the leaders inthat neighborhood? What other organizations areinvolved in protecting the community’s health? Youcan work out the answers to these questions in a brain-storming exercise at an early meeting of your group.Brainstorm a list of the groups of people whose self-interests are most directly affected, then figure out whohas contacts with these groups or individuals.
2. Create and Distribute Fact SheetsCreate an attractive, easy-to-read and accurate factsheet to educate the community about the problemsand how these problems relate directly to their lives. Asimple one-page fact sheet will serve the purpose.
3. Recruit Hundreds, One At A TimeRecruiting will help you build the relationships,resources and critical mass to act effectively for change.Reach out to a wide range of local groups to build thebroadest possible coalition. It will be much more diffi-cult for decision-makers to ignore your concerns if yourcampaign represents a wide cross-section of your com-munity. All recruiting is a form of door knocking. Ifyou are trying to organize a neighborhood, the doorsline the streets. If you are trying to build a differentkind of group or coalition, the doors may spread all overtown and you may need appointments to open them.There are several ways to make knocking on doors easi-er. First come up with a ‘rap’— “I am...” “We are...”“This is...” “We want...” “You can...” Also, consider cir-culating a petition. Not only will the petition help youget the names and addresses of community supportersand show community support to those in power, it alsobegins the process of getting the people you’re talkingwith involved in the issue. Make sure to listen closelyto the concerns of the people you are talking with andlink the PVC problem to their interests and concerns.
4. Hold Meetings That Make People Wantto Come Back and Bring Their FriendsPeople will come to a meeting if:● They have made a commitment to come● They have a role or responsibility in the meeting● They have an immediate and specific self-interest
in the work of the organization● They have past, positive experiences with similar
meetings
To have a successful meeting, your recruitment effortsmust satisfy the first and third of these conditions. Thesecond and fourth conditions will depend on how yourun the meeting. There are several different kinds ofmeetings to suit different purposes.
House Meetings - This is the kind of meeting manygroups hold when they are first forming. The meetingis held at a member’s house and the style is informal.One of the biggest benefits of this kind of meeting isthe greater comfort level among members.
Planning Meetings - Leaders or other key decisionmakers within the group get together to set their agen-da, review the work that’s been done and plan activi-ties. Planning meetings should not be decision-makingmeetings, but rather they should establish the agendaand process by which decisions will be made at a generalmembership meeting or define a plan to carry out anactivity that has already been decided upon by themembership.
General Membership Meetings - These meetings areimportant to ensure that all members of the organiza-tion share the responsibility for decision making andcarrying out the activities of the organization. Thetime and location should always be chosen to accom-modate the maximum number of people. The meetingshould always start with an agenda and when possible,get the agenda out to people prior to the meeting in theform of a flier (this will also serve as a reminder for themeeting). Make sure you pass around a sign up sheetto collect names and addresses to contact people whoattended in the future.
People will come to the next meeting if they enjoyed thefirst one, if it started and ended on time and wasn’t a bore,if it produced concrete results, if it was lively and exciting,and if it delivered what was promised.
CH
AP
TE
R
9:
T
AK
EA
CT
ION
—
P
re
ve
nt
ing
H
ar
m
fr
om
P
VC
U
se
a
nd
D
isp
os
al
62
5. Set GoalsIt is critically important to have long-term, intermediateand short-term goals to help members understandwhere they are going and the steps they have masteredalong the way. Ask yourselves: What do we want?What is your bottom line? Do you want to pass a localor state law that bans PVC products where alternativesare available? This could be your long-term goal.
Next identify different strategies and tactics that willlead you to your goal such as getting your city or countycouncil to pass a resolution to phase out all PVC prod-ucts where alternatives are readily available. This couldbe your intermediate or short-term goal.
6. Identify Your TargetsOnce you’ve identified what it is that you want, thenext step is to identify who can give it to you. Pinpointthe actions and the people that have the power to helpyou reach your goal. The people who impede theachievement of your goal are often referred to as thetargets of the campaign. This does not mean that theyare evil or bad. It simply means that because they havethe power to give you what you want, it makes sense tofocus your attention and actions on them. The targetof your campaign must always be a person or persons.You can’t fight City Hall because City Hall is a building,but you can target the person with the power at CityHall to get them to act.
To help your group identify your targets, answer thesethree questions.● Who is responsible for the situation you want to
change?● Who can make the changes you want to happen?● How can you convince them to act on your issue?
7. Research Is An Essential Tool Research is a tool, not an end product. You need to doresearch to gather enough information to achieve yourgoals, not to know absolutely everything there is toknow. Research should tell you who has the power togive you what you want and should help you figure outwhat arguments your targets will probably use againstyou. Once you know this, you can create counter argu-ments. This report will give you some of the informa-tion you need, but you need to undertake the localresearch related to the problem that you want toaddress.
8. Take Direct ActionAn action is any step you take to advance your group’sgoals. Petitions, letter-writing campaigns and educa-
tional meetings are all actions that advance yourgroup’s goals. A direct action is the most dramatic typeof action, involving confrontation and demands. Directaction begins after your efforts at education, informa-tion sharing and persuasion are ignored. Use directaction when your group is ready to confront a decision-maker with its frustrations and to make specificdemands. Direct actions move your organization out-side the established rules for meetings and discussion.It takes your group into a forum in which you make therules and where elected representatives and corporateexecutives are less sure of themselves and how to han-dle the situation. A direct action often provides thenecessary pressure to force your target to act on yourgroup’s issue.
9. Target The MediaWho are the media decision-makers who need to beconvinced that your story should be covered? Whatwill it take to convince them? In most media outlets,the decision-makers are the editors, and the way youget to them is to spoon-feed them a story they can usewithout much work. It is important to develop a mediastrategy for your campaign that you can constantlyrefine and develop. But don’t be fooled into believingthat the media is the only way to get your story out.Keep creating your own media through fact sheets,cable access television programs, newsletters, call-ins toradio talk shows, letters to the editor, statements atpublic hearings, barbecues, rallies, auctions, concertsand videotapes.
10. Celebrate The Victories AndKeep Applying PressureSavor the victories no matter how large or small. Ameeting with the City Council is a small victory and aresolution to stop purchasing PVC is a larger victory.Celebrate all victories because it helps members to seethat you are moving forward and are winning. No onewants to join a loser organization.
Policy ActionWhile personal steps are critically important, communi-ty action is a must. But neither are enough. The per-sonal should also be political. Unless the system thatunduly relies on hazardous materials like PVC ischanged, then green consumerism and green behaviorwill remain a minor movement of the privileged few.Unless many community-based organizations join forces,large-scale systemic change will be slow in coming.

Here are a number of action steps that government atthe state, local and national levels must take to phase-out PVC in a timely and orderly manner. Actions thatmay be successful early on and that establish a founda-tion for future PVC reductions are listed first in orderon the timeline below. These policy actions also giveguidance to other decision makers in industry, com-merce and institutions about policies that they shouldembrace to help prevent harm from PVC use. ThisPVC-free action agenda is summarized in Table 16.
Accomplish Within Three Years1. Ban All Open Waste Burning. Backyard burningof household trash and other open burning should be
strictly prohibited everywhere asthe country’s major uncontrolledsource of dioxin pollution.However, a statutory ban will notbe effective without educatingpeople about the hazards of PVCand simultaneously workingaggressively to reduce the toxici-ty of the waste stream. Peopleburn their waste to avoid realcosts and inconvenience, and outof cultural habit and practice.People need to know the truthabout PVC and waste burning inorder to overcome their resist-ance to change.
2. Educate the Public AboutPVC Hazards. Conduct a well-funded public education cam-paign that targets PVC as a seri-ous problem waste that especiallythreatens public health whenburned, but also creates healthand environmental risks whendisposed of in a landfill. Use ahard-hitting approach that holdsthe chemical industry responsiblefor the impacts of open burningand for selling a material thatreleases toxic additives and by-products. Model the campaignalong the same lines as the anti-tobacco industry ads that work toreduce teenage and adult smok-ing. The educational campaignshould sell PVC-free solutions asit persuades people to halt thebackyard burning of trash.
3. Ban the Incineration of PVC Waste. All forms ofincineration of PVC waste should be phased out by acertain date. Designate PVC waste as hazardous waste.Develop educational programs and incentives toremove PVC from waste streams destined for incinera-tion. Replace all medical waste incinerators with non-burn technologies for waste that needs to be disinfectedand send the disinfected residue to a “secure” landfill.Develop a workable timeline to ban the incineration ofPVC in municipal solid waste.
4. Collect PVC Products Separately from OtherWastes. Award grants and publicize new programs tosupport PVC waste separation and collection. Identify
CH
AP
TE
R
9:
T
AK
EA
CT
ION
—
P
re
ve
nt
ing
H
ar
m
fr
om
P
VC
U
se
a
nd
D
isp
os
al
63
● ● ● ● ● Table 16 ● ● ● ● ●
A PVC-Free Policy Action Agenda
Accomplish Within Three Years
1. Ban all open waste burning.
2. Educate the public about PVC hazards.
3. Ban the incineration of PVC waste.
4. Collect PVC products separately from other waste.
5. In the interim, divert PVC away from incineration to
hazardous waste landfills.
Accomplish Within Five Years
6. Establish our Right-to-Know about PVC.
7. Label all PVC products with warnings.
8. Give preference to PVC-free purchasing.
9. Ban use of PVC in bottles and disposable packaging.
10. Ban sale of PVC with lead or cadmium.
Accomplish Within Seven Years
11. Phase out other disposable PVC uses.
12. Phase out other high hazard PVC uses.
13. If safer alternatives are not yet available, extend
the PVC phase-out deadlines for specific uses.
14. Fund Efforts to reduce the amount of PVC generated
through fees on the PVC content of products.
Accomplish Within Ten Years
15. Phase out remaining durable PVC uses.
16. Decommission municipal waste incinerators in
favor of zero waste plans.

CH
AP
TE
R
9:
T
AK
EA
CT
ION
—
P
re
ve
nt
ing
H
ar
m
fr
om
P
VC
U
se
a
nd
D
isp
os
al
64
PVC as a hazardous waste and addPVC waste products to existingprograms that collect householdhazardous waste, mercury productsand other problem wastes for safermanagement.
5. In the Interim, Divert PVCAway from Incineration toHazardous Waste Landfills.Clarify waste management prioritiesfor PVC to establish preference forland disposal over incineration dueto the formation of dioxin andother toxic by-products. Make theinstitutional arrangements neededto ensure that PVC waste is dis-posed of in “secure” triple-linedhazardous waste landfills anddiverted away from incineration.Identify opportunities for operatorsof waste incinerators to removemore PVC waste from the floor ofthe incinerator prior to waste com-bustion.
Accomplish WithinFive Years6. Establish Our Right-To-KnowAbout PVC. Require productmanufacturers that sell productscontaining PVC to notify the stateof the amount of PVC and the spe-cific chemical name of additivesused in individual products, identi-fied by brand name, model andtype of PVC use. This informationshould be made available on-line ina searchable database on PVCproducts that allows consumers andbusiness people to identify PVCand its ingredients in consumerproducts and materials. This pro-vides people with the knowledgethey need to ask questions andmake decisions about safer PVC-free alternatives.
7. Label All PVC Products withWarnings. A meaningful educa-tion and PVC diversion programwill run head long into the currentlimits on identifying PVC in the
C A S E S T U D Y
PVC Identified asHousehold Hazardous Waste
In its Plan for the Statewide Collection of Household HazardousWaste, the State of Maine identified PVC as a problem waste thatshould be separately collected and, if not recycled, then divertedaway from incineration to landfill disposal. Although householdhazardous waste remains exempt from regulation, collection pro-grams are being expanded in Maine and elsewhere to encourageresidents to turn in old hazardous products for safe managementrather than tossing them in the trash. In addition to spent paintthinner, old pesticides, mercury products and other toxic householdwaste, the Plan targets PVC, latex paint and old propane tanks asproblem wastes requiring special collection and management.Efforts are underway to establish a reliable means of funding theoperational costs of household hazardous waste collection so thatthis plan can be fully implemented in Maine (Source: MDEP 2001b).
C A S E S T U D Y
San Francisco Bay Area AdoptsDioxin-Free Purchasing Policies
The San Francisco Bay Area is leading the nation in preventing diox-in pollution by passing Dioxin Resolutions in Oakland and SanFrancisco and establishing dioxin-free purchasing requirements forlocal governments. The resolutions grew out of a grassroots cam-paign to shut down the last commercial medical waste incinerator inOakland, one of the largest sources of dioxin in the Bay Area. Adiverse coalition of environmental, environmental justice, health-impacted groups, labor representatives, and local government offi-cials worked together to shut down the incinerator in 2001. In theprocess, they convinced local governments to pass dioxin resolutionsand establish a Bay Area Government Task Force to implement reso-lutions that will:
● Promote dioxin pollution prevention practices;
● Use less toxic, non-chlorinated products and processes, such aschlorine-free paper and PVC-free plastics;
● Urge health care institutions to phase out PVC products;
● Work with other local governments to convene a Regional TaskForce to identify sources of regional dioxin pollution and devel-op prevention strategies; and
● Pursue dioxin reduction practices that do not cause workers tobecome unemployed (Sources: Greenaction 2001a, CO 1999,CSF 1999).

CH
AP
TE
R
9:
T
AK
EA
CT
ION
—
P
re
ve
nt
ing
H
ar
m
fr
om
P
VC
U
se
a
nd
D
isp
os
al
65
waste stream. By requiring all PVCproducts to be labeled, PVC can bemore readily separated from otherwaste and diverted away from incin-eration. Warnings should encourageconsumers to avoid burning PVCproducts. Labeling will also encour-age product manufacturers to switchto safer non-PVC materials to avoidlabeling requirements.
8. Give Preference to PVC-freePurchasing. A government pro-curement policy that establishes as apriority the purchasing of safer alter-natives to PVC will harness institu-tional buying power. Changing thebuying habits of various levels ofgovernment will help drive the mar-ket for PVC alternatives and beginto affect the practices of other insti-tutions in the supply chain that sup-ports government operations.
9. Ban the Use of PVC in Bottles and DisposablePackaging. These two uses of PVC are the easiest andmost compelling to ban outright in the near term. Bothrepresent short-lived uses that become PVC waste soonafter purchase. The PVC in bottles contaminates therecycling of the more plentiful and safer PET bottles (#1 plastic) (see Chapter 7). The market in PVC bottleshas already been declining steadily. The growing use ofPVC for packaging, such as in clear plastic blister packs,adds disproportionately to the problem of PVC inmunicipal solid waste. Safer alternatives for both usesare readily available and already in the market place.
10. Ban the Sale of Any PVC Containing Lead andCadmium. The continued use of these two highly toxicPVC additives presents a serious hazard that has longbeen recognized by progressive governments. Even thePVC industry has moved to replace some uses of leadand cadmium as stabilizers in their products. For exam-ple, the European vinyl industry has set a voluntary goalto phase out the sale of lead stabilizers by 2015 with a15% reduction by 2005 and 50% by 2010 (ENDS 2004).However, by 2003 only a 5.3 % reduction in lead hadbeen achieved (ENDS 2004). We think the global PVCindustry needs to move away from lead much faster. Bybanning the sale of any new PVC product containinglead or cadmium, policy makers will be acting on strongpublic health science. Such a ban will further clean upPVC and raise questions about the other additives usedin PVC and the hazards of the material itself.
Accomplish Within Seven Years
11. Phase Out Other Disposable Uses of PVC.Non-durable products made with PVC become waste inshort order, steadily adding PVC to the municipal wastestream. Separating PVC from the waste stream after itis generated will never be 100% effective. Nor canthese collected non-durable PVC products be readilyrecycled. Therefore, the next phase in directing reduc-tions in PVC usage should focus on replacing theremaining non-durable disposable uses of PVC withsafer alternatives whenever they are available, effectiveand affordable.
12. Phase Out Other High Hazard Uses of PVC. Afurther priority should target replacement of PVC usesthat expose sensitive groups of people to toxic additivesand other uses that are vulnerable to dioxin-formingfires. The continued use of vinyl in medical products
U.S. Companies Stop UsingPVC in Products
Dozens of U.S. companies have stopped using PVC in their products.Some examples are as follows.
● General Motors announced it would phase out the use of PVCfor auto interior panels by 2004, informing its suppliers to usealternatives for all new products (CCC 2004).
● Nine toy manufacturers, including International Playthings,Gerber and Brio are phasing out all the PVC in their products(Greenpeace 2003).
● Mattel, Inc., the world’s largest toy manufacturer, is planning tophase in plant-based plastics to replace PVC in company prod-ucts (Greenpeace 2001).
● NIKE, the shoe and sports equipment manufacturer, is phasingout PVC in its products (Greenpeace 2001).
● Helene Curtis eliminated PVC bottles for packaging Suave, andIntimate Brands, a major beauty supply company, is phasingout PVC containers by 2005 (Lester 2003).
Priorities for Replacing Specific PVC Uses1. PVC bottles and disposable packaging
2. PVC containing lead or cadmium
3. Other non-durable disposable PVC uses
4. Other higher hazard PVC uses
5. Other PVC used in durable goods
CH
AP
TE
R
9:
T
AK
EA
CT
ION
—
P
re
ve
nt
ing
H
ar
m
fr
om
P
VC
U
se
a
nd
D
isp
os
al
66
represents a prime example ofunnecessary exposure to the addi-tives in PVC products. DEHP, atype of phthalate additive, leachesout of vinyl medical bags and tub-ing. An infant boy in neonatalintensive care may be exposed toenough phthalates from PVC topose harm to his developing repro-ductive organs (Rossi 2001).Examples of PVC uses particularlyvulnerable to dioxin-forming firesinclude automotive applicationsand building materials such as vinylsiding. High fire hazard uses ofPVC should be replaced with saferalternatives.
13. If Safer Alternatives are NotYet Available, Extend the Phase-Out Deadlines for Specific PVCUses. A reasonable PVC phase-out policy would make allowancefor those few cases where accept-able alternatives are not readilyavailable. In such a case, a tempo-rary exemption could be grantedfor a scheduled PVC phase-outdeadline upon a satisfactorydemonstration by a product manu-facturer. Further criteria for grant-ing interim relief should considerwhether the specific use of PVC isessential to public health and safetyor if the available alternative doesnot work effectively or is muchmore expensive.
14. Fund Efforts to Reduce theAmount of PVC WasteGenerated Through Fees on thePVC Content of Products.Funding will be needed for publiceducation, developing diversionand labeling programs, and toadminister an orderly phase-out ofPVC products. PVC productsshould be assessed fees to pay forthese PVC reduction programs.That’s the fairest approach. Feesshould be collected at the productdistribution level to avoid theadministrative burden of retail feecollection.
Health Care Institutions Moveto Phase Out PVC
● Health Care Purchasing: Four top group purchasing organiza-tions that buy supplies for more than 70% of U.S. health carefacilities, such as Premier, Inc., established initiatives to reducethe purchasing of medical products containing PVC, mercuryand the chemical plasticizer diethylhexyl phthalate (DEHP)(HCWH 2002a).
● Baxter International, Inc., one of the world’s largest medicalsupply manufacturers, is phasing out PVC in its intravenous (IV)solutions containers (Baxter 1999).
● Abbott Laboratories has committed to move toward PVC- andDEHP-free alternatives (Abbott 2003).
● The thirty-seven members of the Maine Hospital Associationagreed to continuously reduce the use and disposal of PVC plas-tic in hospitals as part of a statewide pollution preventionagreement (MHA 2001)
C A S E S T U D Y
Model Policy Action Takento Phase Out PBTs and PVCIn 2000, the Washington State Department of Ecology (Ecology)developed a groundbreaking strategy to phase out some of thedeadliest toxic chemicals in Washington—persistent, bioaccumula-tive and toxic chemicals (PBTs). Ecology’s program has a goal ofreducing PBTs such as mercury, dioxin, PBDEs (toxic flame retar-dants) and PCBs by the year 2020.
Under Washington’s PBT strategy, chemical action plans are devel-oped for high priority chemicals. In 2003, Ecology developed a planto reduce and phase out mercury and the legislature passed a bill toban certain mercury consumer products. Right now, Ecology isworking on a chemical action plan to reduce and eliminate toxicflame retardants (PBDEs), chemical cousins of PCBs that are rapidlyrising in the environment, breast milk, orcas and other wildlife.
The Toxic Free Legacy Coalition, led by Washington Toxics Coalition,Washington Physicians for Social Responsibility, Healthy BuildingNetwork, WashPIRG, Breast Cancer Fund and People for PugetSound, is working to ensure the meaningful implementation of leg-islation and Ecology’s PBT strategy.
On a local level, the Toxic Free Legacy Coalition was successful ingetting the City of Seattle to adopt a first in the nation purchasingpolicy to reduce and eliminate the purchasing of products that con-tain or generate PBTs, including PVC. The hazards of PVC continueto be central to the debate surrounding successful implementationof the Resolution (Source: WTC 2004).
CH
AP
TE
R
9:
T
AK
EA
CT
ION
—
P
re
ve
nt
ing
H
ar
m
fr
om
P
VC
U
se
a
nd
D
isp
os
al
67
Accomplish Within Ten Years15. Phase Out Remaining Uses of Durable PVCProducts. The remaining uses of PVC should be rela-tively lower hazard uses in longer-lived products thathave less chance of accidental combustion or publicexposure to toxic additives. These uses should bereplaced with safer alternatives as the final priority forthe orderly phase-out of PVC. By ending all uses ofPVC, the toxic impacts across the life cycle from pro-duction to disposal will be prevented.
16. Decommission Municipal Waste Incinerators inFavor of ‘Zero Waste’ Plans. Within ten years, weshould replace the inherently dirty and obsolete strategyof needlessly burning valuable resources disguised as dis-carded materials and products. Zero waste strategiesinvolving much more aggressive source reduction(including product redesign), reuse, recycling and com-
posting can reduce waste volumes even more thanincineration, and without generating toxic by-products.As the contracts expire on the current inventory ofmore than 100 municipal solid waste incinerators, theseplants should be safely decommissioned. Waste inciner-ation should be relegated to the dustbin of history.
ConclusionWithin ten years, we can bring a virtual halt to thetoxic life cycle of PVC. Through persistent organizedaction at all levels, discarding harm from PVC disposalwill become a practice of the past. Safer alternativeswill serve the same purposes filled by PVC now throughthe use of clean materials and the sustainable produc-tion of clean products. The health and environmentalproblems created by PVC can be solved through twoprofoundly simple actions—don’t buy it, don’t burn it!


PV
C:
B
ad
N
ew
s
Co
me
s
In
T
hr
ee
s
69
AThousands of consumer products and packaging are made from PVC. Thefollowing is a general list of some common products that are typically madeof PVC This list is meant to be a starting point for identifying what com-mon products are packaged in or made from PVC. In creating this list, werecognize that companies are always changing their products, including thematerials they use to package them. In some cases, you may find that aproduct listed is no longer made from PVC. If this happens, you may wantto contact the company and congratulate them for being environmentallyconscientious.
While this list may help get you started, not all containers and products arelabeled. If you suspect that a product or its packaging is made of PVC, wesuggest you contact the product manufacturer and ask them directly aboutthe materials used in the product or its packaging. One way to be sure ifthe packaging of a product is made from PVC is to look for the number “3”or for the letter “V” inside the universal recycling symbol. This means thatthe product is made of PVC. Soft flexible plastic products that are madewith PVC often have a distinct odor. What you smell is the plasticizer thatwas added to the PVC material to make it soft and flexible.
In addition, a list of specific products identified by brand name that arepackaged in PVC bottles, was generated by the Grassroots RecyclingNetwork (GRRN 2004a). This list can be accessed on the GRRN web siteat http://www.grrn.org/pvc.
Apparel:BootsApronsT-shirts with PVC prints (shiny)RaincoatsRain pantsSkirtsLingerieShoesBagsLuggage BibsBackpacks (PVC coating for
waterproofing) WatchbandsDiaper covers
Personal Care Items(packaging):ShampooHair gelLotionSuntan lotionBaby oilMouthwashFace WashAloe Vera GelMassage oilLiquid soap
APPENDIX ACommon Household Products and Packaging
That May Contain PVC
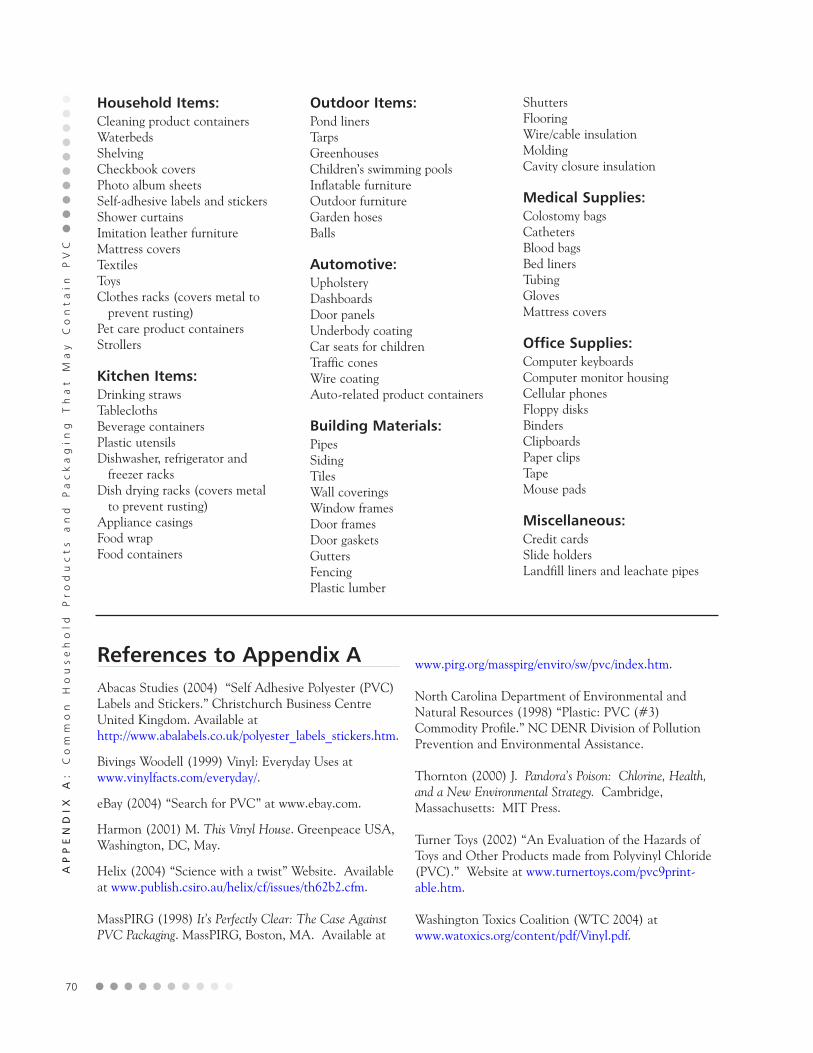
AP
PE
ND
IX
A:
C
om
mo
n
Ho
us
eh
old
P
ro
du
ct
s
an
d
Pa
ck
ag
ing
T
ha
t
Ma
y
Co
nt
ain
P
VC
70
Household Items:Cleaning product containersWaterbedsShelvingCheckbook coversPhoto album sheetsSelf-adhesive labels and stickersShower curtainsImitation leather furnitureMattress coversTextilesToysClothes racks (covers metal to
prevent rusting)Pet care product containersStrollers
Kitchen Items:Drinking straws Tablecloths Beverage containersPlastic utensilsDishwasher, refrigerator and
freezer racksDish drying racks (covers metal
to prevent rusting)Appliance casings Food wrap Food containers
Outdoor Items:Pond linersTarps Greenhouses Children’s swimming poolsInflatable furnitureOutdoor furnitureGarden hosesBalls
Automotive:UpholsteryDashboardsDoor panelsUnderbody coatingCar seats for childrenTraffic cones Wire coatingAuto-related product containers
Building Materials:PipesSidingTilesWall coveringsWindow framesDoor framesDoor gasketsGuttersFencingPlastic lumber
ShuttersFlooringWire/cable insulationMoldingCavity closure insulation
Medical Supplies:Colostomy bagsCathetersBlood bagsBed linersTubingGlovesMattress covers
Office Supplies:Computer keyboardsComputer monitor housingCellular phonesFloppy disksBindersClipboardsPaper clips TapeMouse pads
Miscellaneous:Credit cardsSlide holdersLandfill liners and leachate pipes
References to Appendix A Abacas Studies (2004) “Self Adhesive Polyester (PVC)Labels and Stickers.” Christchurch Business CentreUnited Kingdom. Available athttp://www.abalabels.co.uk/polyester_labels_stickers.htm.
Bivings Woodell (1999) Vinyl: Everyday Uses atwww.vinylfacts.com/everyday/.
eBay (2004) “Search for PVC” at www.ebay.com.
Harmon (2001) M. This Vinyl House. Greenpeace USA,Washington, DC, May.
Helix (2004) “Science with a twist” Website. Availableat www.publish.csiro.au/helix/cf/issues/th62b2.cfm.
MassPIRG (1998) It’s Perfectly Clear: The Case AgainstPVC Packaging. MassPIRG, Boston, MA. Available at
www.pirg.org/masspirg/enviro/sw/pvc/index.htm.
North Carolina Department of Environmental andNatural Resources (1998) “Plastic: PVC (#3)Commodity Profile.” NC DENR Division of PollutionPrevention and Environmental Assistance.
Thornton (2000) J. Pandora’s Poison: Chlorine, Health,and a New Environmental Strategy. Cambridge,Massachusetts: MIT Press.
Turner Toys (2002) “An Evaluation of the Hazards ofToys and Other Products made from Polyvinyl Chloride(PVC).” Website at www.turnertoys.com/pvc9print-able.htm.
Washington Toxics Coalition (WTC 2004) atwww.watoxics.org/content/pdf/Vinyl.pdf.

PV
C:
B
ad
N
ew
s
Co
me
s
In
T
hr
ee
s
71
BState
Alabama
Alaska
Arizona
Arkansas
California
Colorado
Connecticut
Delaware
Florida
Georgia
Hawaii
Idaho
Illinois
Indiana
Iowa
Kansas
Kentucky
Louisiana
Maine
Maryland
Massachusetts
Michigan
Minnesota
Mississippi
Missouri
Montana
Nebraska
Total MSW Generated
(tons)
*
*
6,012,359
3,838,217
54,429,851
5,051,132
4,734,132
1,069,042
19,706,584
11,214,006
1,706,018
1,090,000
15,951,037
9,542,378
3,416,268
4,698,338
5,465,608
4,952,900
1,327,164
8,904,464
8,307,387
16,916,076
5,043,752
2,918,407
7,256,744
*
2,395,100
Total Amount of PVCDisposed (tons)1
*
*
37,277
23,797
337,465
31,317
29,352
6,628
122,181
69,527
10,577
6,758
98,896
59,163
21,181
29,130
33,887
30,708
8,228
55,208
51,506
104,880
31,271
18,094
44,992
*
14,849
Amount of PVCIncinerated (tons)2
*
*
0
545
9,205
0
16,257
0
45,364
350
3,454
0
0
6,177
366
0
16
0
5,448
12,486
28,145
8,639
14,432
0
207
*
0
Amount of PVCLandfilled (tons)2
*
*
37,277
23,252
328,260
31,317
13,095
6,628
76,817
69,177
7,123
6,758
98,896
52,986
20,815
29,130
33,871
30,708
2,780
42,722
23,361
96,241
16,839
18,094
44,785
*
14,849
APPENDIX BAmount of PVC Generated, Incinerated
and Landfilled in Each State
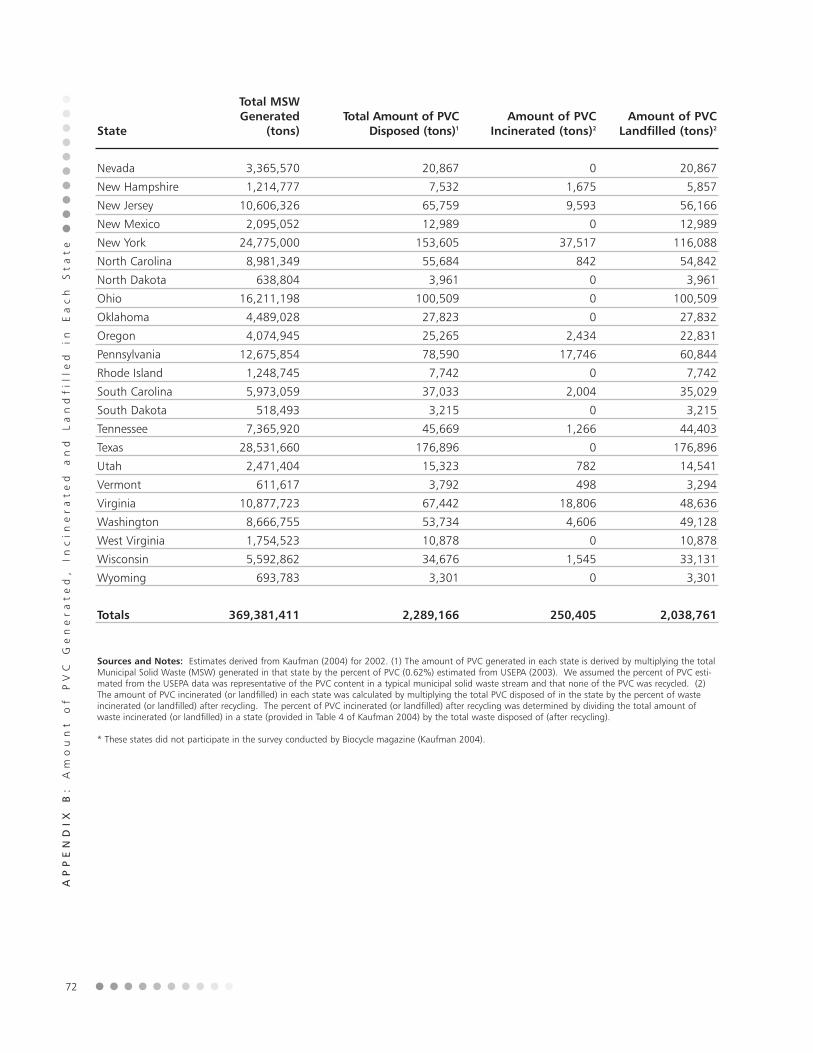
AP
PE
ND
IX
B:
A
mo
un
t
of
P
VC
G
en
er
at
ed
,
Inc
ine
ra
te
d
an
d
La
nd
fil
led
in
E
ac
hS
ta
te
72
State
Nevada
New Hampshire
New Jersey
New Mexico
New York
North Carolina
North Dakota
Ohio
Oklahoma
Oregon
Pennsylvania
Rhode Island
South Carolina
South Dakota
Tennessee
Texas
Utah
Vermont
Virginia
Washington
West Virginia
Wisconsin
Wyoming
Totals
Total MSW Generated
(tons)
3,365,570
1,214,777
10,606,326
2,095,052
24,775,000
8,981,349
638,804
16,211,198
4,489,028
4,074,945
12,675,854
1,248,745
5,973,059
518,493
7,365,920
28,531,660
2,471,404
611,617
10,877,723
8,666,755
1,754,523
5,592,862
693,783
369,381,411
Total Amount of PVCDisposed (tons)1
20,867
7,532
65,759
12,989
153,605
55,684
3,961
100,509
27,823
25,265
78,590
7,742
37,033
3,215
45,669
176,896
15,323
3,792
67,442
53,734
10,878
34,676
3,301
2,289,166
Amount of PVCIncinerated (tons)2
0
1,675
9,593
0
37,517
842
0
0
0
2,434
17,746
0
2,004
0
1,266
0
782
498
18,806
4,606
0
1,545
0
250,405
Amount of PVCLandfilled (tons)2
20,867
5,857
56,166
12,989
116,088
54,842
3,961
100,509
27,832
22,831
60,844
7,742
35,029
3,215
44,403
176,896
14,541
3,294
48,636
49,128
10,878
33,131
3,301
2,038,761
Sources and Notes: Estimates derived from Kaufman (2004) for 2002. (1) The amount of PVC generated in each state is derived by multiplying the totalMunicipal Solid Waste (MSW) generated in that state by the percent of PVC (0.62%) estimated from USEPA (2003). We assumed the percent of PVC esti-mated from the USEPA data was representative of the PVC content in a typical municipal solid waste stream and that none of the PVC was recycled. (2)The amount of PVC incinerated (or landfilled) in each state was calculated by multiplying the total PVC disposed of in the state by the percent of wasteincinerated (or landfilled) after recycling. The percent of PVC incinerated (or landfilled) after recycling was determined by dividing the total amount ofwaste incinerated (or landfilled) in a state (provided in Table 4 of Kaufman 2004) by the total waste disposed of (after recycling).
* These states did not participate in the survey conducted by Biocycle magazine (Kaufman 2004).

PV
C:
B
ad
N
ew
s
Co
me
s
In
T
hr
ee
s
73
RREFERENCES
Abacas Studies (2004) “Self Adhesive Polyester (PVC) Labels and Stickers.” Christchurch Business Centre UnitedKingdom. Available at http://www.abalabels.co.uk/polyester_labels_stickers.htm.
Abbott Laboratories (2003) Making a Difference Around the World. Global Citizenship Report 2000-2001. Available at:http://www.abbott.com/citizenship/pdf/2000-01_gc_report.pdf.
Ackerman (2003) F. and R. Massey. “The Economics of Phasing Out PVC,” Global Development and EnvironmentInstitute, Tufts University, Somerville, MA, December. Available at www.ase.tufts.edu/gdae/Pubs/rp/Economics_of_PVC.pdf.
Ackerman (2003a) F. and R. Massey. “The Economics of Phasing Out PVC.” The studies discussed by Ackerman:“A Strategy for Virtual Elimination of Persistent Toxic Substances,” International Joint Commission (IJC), Windsor, Ontario,1993; Economic Instruments for the Virtual Elimination of Persistent Toxic Substances in the Great Lakes Basin, Report to IJC,Hickling Corporation, 1994; Assessment of the Economic Benefits of Chlor-Alkali Chemicals to the United States and CanadianEconomy, Charles River Associates, Boston, MA 1993; and A Technical and Economic Comparison of Options to ProductsDerived from the Chlor-Alkali Industry, Environment Canada, 1997; are all cited in Ackerman 2003.
Ackerman (2003b) F. and R. Massey. “The Economics of Phasing Out PVC.” The references used by Ackerman to sup-port the discussion that environmental costs are less than anticipated: Gauging Control Technology and Regulatory Impactsin Occupational and Safety and Health, US Congress Office of Technology Assessment, OTA-ENV-635, Washington, DC,September, 1995 and A Retrospective Evaluation of Control Measures for Chlorinated Substances (Case Studies of Ex-Ante/Ex-Post Socioeconomic Effects, Report to Environment Canada and Ontario Ministry of Energy, Science and Technology,Cheminfo Services, 2000.
Ackerman (2003c) F. and R. Massey. “The Economics of Phasing Out PVC.” The references used by Ackerman to pro-vide statistics on VCM and PVC facilities in US: Chemical Economics Handbook: Polyvinyl Chloride (PVC) Resins,”CEH Marketing Research Report, SRI International, Menlo Park, CA, September, 2003 and Chemical EconomicsHandbook “Vinyl Chloride Monomer,” SRI Consulting, Menlo Park, CA, December, 2000.
AEA Technology (AEA 2000) Economic Evaluation of PVC Waste Management. Prepared for the European CommissionEnvironment Directorate, by AEA Technology, Oxfordshire, England, June.
Agency for Toxic Substances and Disease Registry (ATSDR 2001) Landfill Gas Primer An Overview for EnvironmentalHealth Professionals. Public Health Service, U.S. Department of Health and Human Services, Atlanta, GA. Available at http://www.atsdr.cdc.gov/hac/landfill/html/intro.html.

Agency for Toxic Substances and Disease Registry (ATSDR 1997) Toxicity Profile for Vinyl Chloride (Update). PublicHealth Service, U.S. Department of Health and Human Services, Atlanta, GA, September. Available at http://www.atsdr.cdc.gov/toxprofiles/tp20.html.
Agency for Toxic Substances and Disease Registry (ATSDR 1992) Toxicity Profile for Tin. Public Health Service, U.S.Department of Health and Human Services, Atlanta, GA, September. Available athttp://www.atsdr.cdc.gov/toxprofiles/tp55.html.
Al-Malack (2000) M.H., A.Y. Sheikheldin, N.M. Fayad, and N. Khaja. “Effect of Water Quality Parameters on the Migrationof Vinyl Chloride Monomer from Unplasticized PVC Pipes. Water, Air and Soil Pollution 120 (1-2): 195-208, May.
Alaska Department of Environmental Conservation (AKDEC 2004) “Open Burning and Policy Guidelines.” Alaska DECDivision of Air Quality Air Permits Program. May. Available at http://www.state.ak.us/dec/air/ap/docs/obrguide.pdf.
Alliance for the Responsible Use of Chlorine Chemistry (ARCC 2003) “Chlorine Chemistry Key to U.S. Economy andLife.” Available at http://www.chlorallies.org/employ.html.
Allsopp (2001) M., P. Costner, and P. Johnston. Incineration and Human Health – State of Knowledge of the Impacts of WasteIncinerators on Human Health. Greenpeace Research Laboratories, University of Exeter, United Kingdom, March.Available at http://archive.greenpeace.org/~toxics/reports/euincin.pdf.
Altwicker (1993) E.R., R.K.N.V. Konduri, C. Lin, and M.S. Milligan. “Formation of precursors to chlorinateddioxin/furans under heterogeneous conditions.” Combustion Science and Technology 88: 349-368.
American Plastics Council (APC 2004) Frequently asked questions. APC Automotive Learning Center. Available athttp://www.plastics-car.org/s_plasticscar/doc.asp?cid=407&did=1604
Anderson (2004) P. Message in a Bottle: The Impacts of PVC on Plastics Recycling.” A Report to the GrassRoots RecyclingNetwork from Recycle Worlds Consulting, June. Available at http://www.grrn.org/assets/pdfs/pvc/PVCBottleRecyclingReport06162004.pdf
Anderson (2004a) P. Personal Communication with Peter Anderson, Recycle Worlds Consulting, Madison, WI, October 13.
Antonacci (2004) S. “Formosa Tests Find Higher Dioxins.” The State Journal-Register, Undated. Available athttp://www.sj-r.com/sections/news/stories/30228.asp
ARGUS (2000) The Behaviour of PVC in Landfill. Final Report. ARGUS in association with University of Rostock-ProfSpillmann, Carl Bro a/s and Sigma Plan S.A. European Commission DGXI.E.3, February.
Bates-Rudd (2000) R. “Henry Ford to Shut Down Incinerator.” The Detroit News, February 23. Available at:http://www.detnews.com/2000/detroit/0002/25/02230049.htm.
Baxter International (1999) Memorandum of Understanding dated March 5. Available at:http://www.noharm.org/details.cfm?type=document&id=304.
Beck (1996) R.W. 1995 National Post-Consumer Plastics Recycling Rate Study. R.W. Beck and Associates for the VinylInstitute, September.
Belliveau (2002) M. “Reducing PVC Through a Statewide Pollution Prevention Agreement.” Presented at CleanMed2002 in Chicago, Illinois, October.
Bertin Technologies (Bertin 2000) The influence of PVC on quantity and hazardousness of flue gas residues from incineration,Study for DG XI, April.
Birnbaum (2003) L. and W. Farland. “Health Risk Characterization of Dioxins and Related Compounds.” in Dioxins andHealth, Second Edition, Edited by Arnold Schecter and Thomas Gasiewicz, John Wiley and Sons, Hoboken, NJ.
RE
FE
RE
NC
ES
74

Bivings Woodell (1999) Vinyl: Everyday Uses at www.vinylfacts.com/everyday/.
Blue Ridge Environmental Defense League (BREDL 2002) “Waste Gasification Impacts on the Environment and PublicHealth.” BREDL Glendale Springs, NC, April.
Bonaparte (1990) R. and B.A. Gross. “Field behavior of double-liner systems.” In Waste Containment Systems:Construction, Regulation, and Performance. Rudolf Bonaparte (editor). Geotechnical Special Publications No. 26. NewYork: American Society of Civil Engineers, pp. 52-83.
Boyer (1989) I. “Toxicity of dibutyltin, tributyltin and other organotin compounds to humans and to experimental ani-mals.” Toxicology 55: 253-298.
Buerk (1982) C., J. Batdorf, K. Carmack and O. Ravenholt. “The MGM Grand Hotel Fire. Lessons Learned from aMajor Disaster.” Archives of Surgery 117: 641-644.
Burnett (1994) R. “Crisis Management Plan for the Dioxin Reassessment.” Memorandum and enclosures from the VinylInstitute Executive Director to the Vinyl Institute Executive Board Members and Issues Management CommitteeMembers. Vinyl Institute, Morristown, NJ, September 6.
Buss (1995) S.E., A.P. Butler, P.M. Johnson, C.J. Sollars, and R. Perry. “Mechanisms of leakage through synthetic landfillliners materials.” Journal of The Chartered Institution of Water and Environmental Management 9: 353-359.
California Air Resources Board (CARB 2003) “Backyard Household Waste Burning Fact Sheet: What you don’t knowcan hurt you.” CARB, Sacramento, CA, revised April 15. Available at http://www.arb.ca.gov/smp/resburn/factsheets/res-burn-eng.pdf.
California Air Resources Board (CARB 2003a) Airborne Toxic Control Measure to Reduce Emissions of Toxic AirContaminants from Outdoor Residential Waste Burning. California Code of Regulations, Section 93113, Title 17, FinalRegulation Order, Effective February 3.
California Air Resources Board (CARB 1999) Common Indoor Sources of Volatile Organic Compounds: Emission Rates andTechniques for Reducing Consumer Exposures. Final Report. Contract No. 95-302, January.
Carroll (1989) G.J., R.C. Thurnau, R.E. Mournighan, L.R. Waterland, J.W. Lee, and D.J. Fournier, Jr. “Partitioning ofMetals in Rotary Kiln Incineration.” US Environmental Protection Agency, PB90-132812, Cincinnati, OH, September.
Cascadia Consulting Group (Cascadia 2003) Wisconsin Statewide Waste Characterization Study. Final Report, prepared forthe Wisconsin Department of Natural Resources with the assistance of R.W. Beck GRG Analysis, May. Available atwww.dnr.state.wi.us/org/aw/wm/publications/recycle/wrws-finalrpt.pdf.
Chemical Economics Handbook (CEH 2003) “Polyvinyl Chloride (PVC) Resins.” CEH Marketing Research Report, SRIInternational, Menlo Park, CA, September, as cited in Ackerman 2003.
Chemical Economics Handbook (CEH 2000) “Vinyl Chloride Monomer.” CEH, SRI Consulting, Menlo Park, CA,December, as cited in Ackerman 2003.
Chem-Info Services (CIS 1997) A Technical and Socio-Economic Comparison of Options to Products Derived from the Chlor-alkali Industry, Environment Canada, Burlington, Ontario.
Chicago Tribune (CT 1996) “Hazardous Lead Levels Exist in Plastic Vinyl Mini-Blinds.” Chicago Tribune July 8, page A7.
Chien (2003) T. Affidavit before the Supreme Court of the State of New York in the matter of the Resilient FloorCovering Institute and Tarkett, Inc. versus the New York State Department of Environmental Conservation.
Christiansen (1990) K., A. Grove, L.E. Hansen, L. Hoffmann, A.A. Jensen, K. Pommer, and A. Schmidt. EnvironmentalAssessment of PVC and Selected Alternative Materials. Prepared for the Danish National Agency of EnvironmentalProtection, Danish Ministry of the Environment.
RE
FE
RE
NC
ES
75

Christmann (1989) W. “Combustion of polyvinyl chloride – an important source for the formation of PCDD/PCDF.”Chemosphere 19: 387-392.
Citizens’ Environmental Coalition (CEC 2004) Building Green Without Going in the Red - A Household Guide to Healthy,Affordable Building Materials. Albany, New York.
City of Oakland (CO 1999) “Resolution for the City of Oakland Establishing a Regional Task Force and Policy on Dioxin,Public Health and the Environment.” Passed by the Oakland City Council on February 2. Available at:http://www.noharm.org/details.cfm?type=document&id=735.
City of San Francisco (CSF 1999) “Establishing Dioxin Pollution as a High Priority for Immediate Action for the City andCounty of San Francisco in Order to Restore Water, Air and Total Environment Quality” City and County of SanFrancisco Resolution passed on March 22. Available at: http://www.noharm.org/details.cfm?type=document&id=739.
Clean Car Campaign (CCC 2004) “PVC in Vehicles.” A Fact Sheet prepared by the Clean Car Campaign. Available athttp://www.cleancarcampaign.org/pvc.shtml.
Cohen (1998) M., B. Commoner, J. Richardson, S. Flack, P.W. Bartlett, P. Cooney, K. Couchot, H. Eisl, and C. Hill.Dioxin Sources, Air Transport and Contamination in Dairy Feed Crops and Milk. Center for Biology of Natural Systems,Queens College, Flushing NY.
Cohen (1995) M., B. Commoner, H. Eisl, P. Bartlett, A. Dickar, C. Hill, J. Quigley, and J. Rosenthal. QuantitativeEstimation of the Entry of Dioxins, Furans and Hexachlorobenzene into the Great Lakes from Airborne and Waterborne Sources.Center for Biology of Natural Systems, Queens College, Flushing, NY.
Colardyn (1978) F., M. Van der Straiten, H. Lamont, and T. Van Peteghem. “Acute Inhalation–Intoxication byCombustion of Polyvinylchloride.” International Archives of Occupational and Environmental Health 38: 121-127.
Colborn (1996) T., D. Dumanoski, and J.P. Myers. Our Stolen Future. Penguin Books, New York.
Commission of the European Communities (CEC 2000) Green Paper: Environmental Issues of PVC. COM (2000) 469 final,Brussels, July 26. Available at http://www.europa.eu.int/comm/environment/waste/pvc/en.pdf/green_paper_pvc.thtm.
Commoner (2000) B., P. Woods Bartlett, H. Eisl, and K. Couchot. Long-Range Air Transport of Dioxin from North AmericanSources to Ecologically Vulnerable Receptors in Nunavut, Arctic Canada. Center for the Biology of Natural Systems, QueensCollege, City University of New York, Flushing, New York.
Consumer Reports (CR 1998) “Hormone mimics, they’re in our food: Should we worry?” Consumer Reports 63: 52-55, June.
Costner (2001) P. “Chlorine, Combustion and Dioxins: Does Reducing Chlorine in Wastes Decrease Dioxin Formation inWaste Incinerators?” Greenpeace International, September 10.
Costner (2000) P. “Chlorine Input and Dioxin Output from Incinerators and Other Combustion Systems.” Part 2 ofGreenpeace Comments to the US Environmental Protection Agency Science Advisory Board on the Y2000 DioxinReassessment Draft Final Report, November 12.
Costner (1997) P. “Correlation of Chlorine Input and Dioxin Output from Combustors: A Review and Reanalysis.”Organohalogen Compounds 32: 436-438.
Creech (1974) J. and M. Johnson. “Angiosarcoma of liver in the manufacture of polyvinyl chloride.” Journal ofOccupational Medicine 16: 150-151.
Danish Environmental Protection Agency (DEPA 2001) Environmental and Health Assessment of Alternatives to Phthalatesand to Flexible PVC. Environmental Report No. 590. Danish Environmental Protection Agency, Copenhagen, Denmark,as cited in (HCWH 2002).
RE
FE
RE
NC
ES
76

Danish Environmental Protection Agency (DEPA 1999) Brominated Flame Retardants; Substance Flow Analysis andAssessment of Alternatives. June.
Danish Environmental Protection Agency (DEPA 1995) PVC and Alternative Materials (English translation). DanishEnvironmental Protection Agency, Copenhagen, Denmark.
Danish Technical Institute (DTI 1995) Environmental Aspects of PVC. Copenhagen, November.
Denison (1997) R. “Something to Hide: The Sorry State of Plastics Recycling,” Environmental Defense Fund,Washington, DC, October.
Denison (1988) R.A. and E.K. Silbergeld. “Risks of municipal solid waste incineration: an environmental perspective.”Risk Analysis 8(3): 343-355, September.
Dickey (2002) P. “Vinyl Exam: Eliminating PVC in your Home” A Washington Toxics Coalition Fact Sheet, September.Available at: http://www.watoxics.org/content/pdf/vinyl.pdf.
Di Gangi (1997) J. Lead and Cadmium in Vinyl Children’s Products. Greenpeace USA, Washington, DC, October.
Duffy (1998) R.M. Letter to Concord School Board Members. International Association of Fire Fighters. WashingtonDC, April 14, as cited in Thornton 2002.
Dyer (1976) R.F. and V.H. Esch. “Polyvinyl Chloride Toxicity in Fires.” Journal of the American Medical Association 235(4): 393-397.
Eastern Research Group, Inc. (ERG 2002) “National Emission Trends for Small Municipal Waste Combustion Units[Years 1990 to 2005].” Memorandum from Jason M. Huckaby, Eastern Research Group to Walt Stevenson,USEPA/Combustion Group, June 12.
eBay (2004) “Search for PVC” at www.ebay.com.
Ecocycle Commission of the Government of Sweden (ECC 1994) PVC: A Plan to Prevent Environmental Impact. EcocycleCommission, SOU, Stockholm, Sweden: 104.
Eden (1993) R. “Toxic emissions from different types of LFG burners.” In Proceedings of Sardinia ’93 IV InternationalLandfill Symposium, Sardinia, Italy, pp. 635-636, October.
Ema (1995) M. A.M. Kurosaka and Y. Ogawa. “Comparative developmental toxicity of butyltin trichloride, dibutyltindichloride and tributyl chloride in rats.” Journal of Applied Toxicology 15: 297-302.
Ermler (2001) S. “Toxic Silence in Louisiana.” New York Catholic Worker, June-July. Available at http://www.dallaspeace-center.org/toxicla.htm.
Environmental Action Foundation (EAF 1993) “The Real Wrap on Polyvinyl Chloride Packaging.” Sold Waste ActionPaper #8, The Solid Waste Alternatives Project, EAF, Takoma Park, MD.
Environmental Data Services Ltd. (ENDS 2004) “Slow progress on voluntary PVC recycling targets.” ENDS Report 352,May, pp. 32-33.
Environmental Data Services Ltd. (ENDS 2003) “PVC industry raises the bar on recycling.” ENDS Report 340, May, pp.20-21.
Environmental Research and Education Foundation (EREF 2001) “Size of the United States Solid Waste Industry.”Prepared by R.W. Beck and Chartwell Information Publishers, Alexandria, VA, April.
Environmental Research Foundation (ERF 1998) “Landfills are Dangerous.” Rachel’s Environment & Health Weekly # 617,Environmental Research Foundation, September 24.
RE
FE
RE
NC
ES
77

Environmental Research Foundation (ERF 1992) “New Evidence That All Landfills Leak.” Rachel’s Hazardous WasteNews # 316, ERF, Annapolis, MD, December 16.
Environmental Research Foundation (ERF 1990) “Incineration Worsens Landfill Hazards.” Rachel’s Hazardous WasteNews # 162, ERF, Annapolis, MD, January 3.
Environmental Research Foundation (ERF 1989) “Leachate Collection Systems: The Achilles Heal of Landfills.” Rachel’sHazardous Waste News # 119, ERF, Annapolis, MD, March 7.
Evers (1989) E. The Formation of Polychlorinated Dibenzofurans and Polychlorinated dibenzo-p-dioxins and Related CompoundsDuring Oxyhydrochlorination of Ethylene. University of Amsterdam, Department of Environmental and ToxicologicalChemistry, Amsterdam.
Fabrellas (1999) B., P. Sanz, E. Abad, and J. Rivera. “The Spanish dioxin inventory: Proposal and preliminary results frommunicipal waste incinerator emissions.” Organohalogen Compounds 41: 491-494.
Federal Emergency Management Agency (FEMA 2002) Landfill Fires: Their Magnitude, Characteristics, and Mitigation.United States Fire Administration, May. Available at http://fema.gov/downloads/pdf/publications/fa-225.pdf.
Fiedler (1993) H., O. Hutzinger and J. Hosseinpour. “Analysis and remedial actions following an accidental fire in akindergarten.” Organohalogen Compounds 14: 19-23.
Forsyth (1997) D.S. and B. Jay. “Organotin leachates in drinking water from chlorinated poly (vinyl chloride) (CPVC)pipe.” Applied Organometallic Chemistry 11: 551-558.
Franklin Associates (FA 1998) Characterization of Building-Related Construction and Demolition Debris in the United States.Prepared for the U.S. Environmental Protection Agency Municipal and Industrial Solid Waste Division Office of SolidWaste by Franklin Associates, Report No. EPA530-R-98-010, Prairie Village, KS, June. Available athttp://www.epa.gov/epaoswer/hazwaste/sqg/c&d-rpt.pdf
Goodman (1994) D. Memorandum: Incineration Task Force, Vinyl Institute, Morristown, NJ, August 22.
GrassRoots Recycling Network (GRRN 2004) “What is Zero Waste?” GRRN, Madison WI. Available athttp://www.grrn.org/zerowaste/zerowaste_faq.html
Grassroots Recycling Network (GRRN 2004a) “So what is packaged in PVC, anyway?” GRRN, Madison, WI. Availableat http://www.grrn.org/pvc.
Green (1993) AES, “The future of medical waste incineration.” In Green, AES, ed. Medical Waste Incineration andPollution Prevention, New York: Van Nostrand Reinhold, pp. 170-207.
Greenaction (2002) “Stericycle Closes Controversial Waste Incinerator at Gila River Indian Community Reservation inArizona.” News Update, November 26. Available at http://www.greenaction.org/ies/pr112602.shtml.
Greenaction (2001) “Trucks Carrying Medical Waste Blocked at IES Incinerators, 499 High Street, East Oakland!” NewsUpdate, August 7. Available at http://www.greenaction.org/ies/pr080701.shtml.
Greenaction (2001a) “IES Medical Waste Incinerators in Oakland to Close Immediately!” News Update, December 7.Available at http://www.greenaction.org/ies/pr120701.shtml.
Greenpeace (2004) “PVC Alternatives Database Building the Future.” Greenpeace. Available at http://archive.green-peace.org/toxics/pvcdatabase.
Greenpeace (2004a) “Mossville, Louisiana.” Fact Sheet. Available athttp://www.greenpeaceusa.org/media/factsheets/mossvilletext.htm.
RE
FE
RE
NC
ES
78

Greenpeace (2004b) “Lake Charles, Louisiana: a Global Dioxin Hot Spot.” Fact Sheet. Available at http://www.green-peaceusa.org/media/factsheets/hotspottext.htm.
Greenpeace (2003) “2003 Toy Report Card” Greenpeace. Available at:http://www.greenpeaceusa.org/features/details?item_id=526899&campaign_id=512832.
Greenpeace (2001) PVC-Free Future: A Review of Restrictions and PVC free Policies Worldwide.” Greenpeace International,Inc. The Netherlands, August. Available at http://archive.greenpeace.org/toxics/reports/restrictions.pdf .
Greenpeace (1997) “Play Safe Buy PVC Free.” Greenpeace. Available at http://archive.greenpeace.org/comms/pvctoys.
Greenpeace (1994) “PVC Fires List: Accidental Fires that have Involved the Synthetic Material Polyvinyl Chloride.”Washington, DC, June. Available at http://archive.greenpeace.org/toxics/reports/gopher-reports/pvcfires.txt.
Gullett (2001) B., P. Lemieux, C. Lutes, C. Winterrowd, and D. Winters. “Emissions of PCDD/F from uncontrolled,domestic waste burning.” Chemosphere 43: 721-725.
Gullett (2000) B., P. Lemieux, C. Winterrowd, and D. Winters. “PCDD/F Emissions from Uncontrolled, Domestic WasteBurning.” Organohalogen Compounds 46: 193-196.
Gullett (1999) B., P. Lemieux, C. Lutes, C. Winterrowd, and D. Winters. “PCDD/F emissions from uncontrolled, domes-tic waste burning.” Organohalogen Compounds 41: 27-30.
Halonen (1995) I., J. Tarhanen, T. Ruokojarvi, K. Tuppurainen, and J. Ruuskanen. “Effect of catalysts and chlorine sourceon the formation of organic chlorinated compounds.” Chemosphere 30: 1261-1273.
Halonen (1993) I., J. Tarhanen, T. Kopsa, J. Palonen, H. Vilokki and J. Ruuskanen. “Formation of polychlorinated dioxinsand dibenzofurans in incineration of refuse derived fuel and biosludge.” Chemosphere 26: 1869-1880.
Harmon (2001) M. This Vinyl House. Greenpeace USA, Washington, DC, May.
Harvie (2002) J. and T. Lent. PVC-Free Pipe Purchasers’ Report. Draft, Healthy Building Network, Washington, DC,November. Available at http://www.healthybuilding.net/pvc/alternatives.html.
Hasselriis (1993) F. and L. Constantine. “Characterization of Today’s Medical Waste.” In Green AES, ed. MedicalIncineration and Pollution Prevention, New York: Van Nostrand Reinhold pp. 37-52.
Hatanaka (2000) T., T. Imagawa, and M. Takeuchi. “Formation of PCDD/Fs in artificial solid waste incineration in a labo-ratory-scale fluidized bed reactor: influence of contents and forms of chlorine sources in high -temperature combustion.”Environmental Science and Technology 34: 3920-3924.
Haxo (1988) H.E. and T.P. Lahey. “Transport of Dissolved Organics from Dilute Aqueous Solutions through FlexibleMembrane Liners.” Hazardous Waste & Hazardous Materials 5(4): 275-294.
Health Care Without Harm (HCWH 2002) Aggregate Exposures to Phthalates in Humans. HCWH, Washington DC, July.
Health Care Without Harm (HCWH 2002a) “Top GPOs Embrace Effort to Reduce Environmental Impact of HealthCare.” News Release, October, 31. Available at: http://www.noharm.org/details.cfm?type=document&id=692.
Health Care Without Harm (HCWH 2001) Non-Incineration Medical Waste Treatment Technologies. A resource fortHospital Administrators, Facility Managers, Health Care Professionals, Environmental Advocates, and CommunityMembers. HCWH, Washington DC, August.
Healthy Building Network (HBN 2004) “PVC Alternatives.” A fact sheet available athttp://www.healthybuilding.net/pvc/alternatives.html.
RE
FE
RE
NC
ES
79

Helix (2004) “Science with a twist” website. Available at www.publish.csiro.au/helix/cf/issues/th62b2.cfm.
Hickling Corporation (HC 1994) Economic Instruments for the Virtual Elimination of Persistent Toxic Substances in the GreatLakes Basin. Report to the International Joint Commission, Windsor, Ontario.
Hjertberg (1995) T. and T. Gevert. Evaluation of possible degradation of pipes and cable insulation of PVC-Results obtainedwith samples collected after about 25 years use. Department of Polymer Technology, Chalmers Technical University ofGothenburg, Sweden.
Holden (1999) A. “Environmental Justice: A Burning Issue in Detroit.” EJ Times. Sierra Club, October-December.Available at http://www.sierraclub.org/environmental_justice/newsletter/1.pdf.
Huang (2004) J. “Medical waste site sought.” Maine Sunday Telegram, April 4.
Hutari (1996) J. and R. Vesterinen. “PCDD/F emissions from co-combustion of RDF with peat, wood waste, and coal inFBC boilers.” Hazardous Waste and Hazardous Materials 13: 1-10.
ICF (1995) Construction and Demolition Waste Landfills. ICF Incorporated, prepared for the USEPA Office of Solid Waste,Contract No. 68-W3-0008, February.
Illinois Environmental Protection Agency (IEPA) (2004) “Formosa Plant Information.” Formosa Plastics Corporation Site,June 22. Available at http://illiopolis.tripod.com/pages/formosa_plant_information.htm.
International Association of Fire Fighters (IAFF 1995) Hazardous Materials: Polyvinyl Chloride. Department ofOccupational Health and Safety. Revised May 16.
Ishibashi (2000) N., Y. Yoshihara, K. Nishiwaki, S. Okajima, M. Hiraoka, and J. Shudo. “The effects of organic- and inor-ganic–chloride in municipal solid wastes on dioxins formation and emission.” Organohalogen Compounds 546: 122-125.
Jaakkola (1999) J., L. Oie, P. Nafstad, G. Botten, S. Samuelson, and P. Magnus. “Interior surface materials in the homeand the development of bronchial obstruction in young children in Oslo Norway.” American Journal of Public Health 89(2): 188-191.
Kanters (1996) M. J., R. Van Nispen, R. Louw, and P. Mulder. “Chlorine input and chlorophenol emission in the lab-scalecombustion of municipal solid waste.” Environmental Science and Technology 30: 2121-2126.
Kaufman (2004) S.M., N. Goldstein, K. Millrath and N.J. Themelis. “The State of Garbage in America: 14th AnnualNationwide Survey of Solid Waste Management in the United States.” A Joint Study with the Earth Engineering Centerof Columbia University, BioCycle: 31-41, January.
Kielhorn (2000) J., C. Melber, U. Wahnschaffe, A. Aitio, and I. Mangelsdorf. “Vinyl Chloride: Still a Cause for Concern.”Environmental Health Perspectives 108 (7): 579-588, July.
Kolenda (1994) J., H. Grass, M. Wilken, J. Jager, and B. Zeschmer-Lahl. ”Determination and reduction of PCDD/F emis-sions from wood burning facilities.” Chemosphere 29: 1927-1938.
Kopponen (1992) P., R. Torronen, J. Ruuskanen, J. Tarhanen, T. Vartiainen, and S. Karenlampi. “Comparison ofcytochrome P450IA1 induction with the chemical composition of fly ash from combustion of chlorine containing materi-al.” Chemosphere 24: 391-401.
Landrigan (2004) P.J., P.J. Lioy, G. Thurston, G. Berkowitz, L.C. Chen, S.N. Chillrud, S.H. Gavett, P.G. Georgopoulos, A.S.Geyh, S. Levin, F. Perera, S.M. Rappaport, C. Small, and the NIEHS World Trade Center Working Group. “Health andEnvironmental Consequences of the World Trade Center Disaster.” Environmental Health Perspectives 112 (6) 731-739.
Lee (2003) G. F. “Deficiencies in the US EPA’s Characterization of the Protection Provided by Subtitle D Landfilling ofMSW.” El Macero, CA, March 12.
RE
FE
RE
NC
ES
80

Lee (1996) G. F. and A. Jones-Lee. “Landfill Leachate Management.” MSW Management 6: 18-23.
Lee (1994) G. F. and A. Jones-Lee. “Impact of Municipal and Industrial Non-Hazardous Waste Landfills on Public Healthand the Environment: An Overview.” Prepared for CA EPA Comparative Risk Project, May 1994.
Lee (1992) G.F. and A. Jones. “Municipal Solid Waste Management in Lined, “Dry Tomb: Landfills: A TechnologicallyFlawed Approach for Protection of Groundwater Quality.” G. Fred :Lee Associates, El Macero, CA, March.
Lemieux (2003) P. B. Gullett, C. Lutes, C. Winterrowd, and D. Winters. “Variables Affecting Emissions of PCDD/Fs fromUncontrolled Combustion of Household Waste in Barrels.” Journal of Air &Waste Management Association 53: 523-531, May.
Lemieux (2000) P., C. Lutes., J. Abbott, and K. Aldous. “Emissions of Polychlorinated Dibenzo-p-dioxins andPolychlorinated Dibenzofurans from the Open Burning of Household Waste in Barrels,” Environmental Science &Technology, Web release date January 4, 2000 10.1021/es990465t S0013-936X(99)00465-4) Available athttp://www.ecy.wa.gov/programs/air/outdoor_woodsmoke/AmerChemReport.pdf.
Lemieux (1998) P. Evaluation of Emissions from the Open Burning of Household Waste in Barrels. USEPA National RiskManagement Research Laboratory Project Summary EPA/600/SR-97-134, Cincinnati, OH March.
Lester (2003) S. “When people lead, policies follow.” Organohalogen Compounds 65: 398-401.
Liberti (1983) A., G.Goretti, and M.V. Russo. “PCDD and PCDF formation in the combustion of vegetable wastes.”Chemosphere 12: 661-663.
Lighthall (1998) D. and S. Kopecky. “Confronting the Problem of Backyard Burning: The Case for New York.” ColgateUniversity, Department of Geography, Hamilton, New York.
Lott (2004) L. “Health Care With Harm: A Study of the Initiative To Shut Down Henry Ford Hospital’s Medical WasteIncinerator in Detroit, Michigan.” Undated. Available at http://www.umich.edu/~snre492/Jones/henryford.htm.
Louisiana Bucket Brigade (LBB) “Birds of Prey: Feeding off of Mossville and Calcasieu Parish.” LBB undated.
Mahle (1980) N. and L. Whiting. “The formation of chlorodibenzo-p-dioxins by air oxidation and chlorination of bitumi-nous coal.” Chemosphere 9: 693-699.
Maine Department of Environmental Protection (MDEP 2004) Tabular Presentation of Sources of Dioxin in Maine.August. Available at http://www.state.me.us/dep/dioxin/inventory.htm.
Maine Department of Environmental Protection (MDEP 2001) Toxic Dioxin Emissions Cause Maine Legislature to Ban BackYard Trash Burning, Environmental Bulletin, A Maine DEP Information Bulletin for Maine Citizens & Municipal Officials,Winter 2001/02. Available at http://www.state.me.us/dep/air/compliance/byb/bybban.pdf.
Maine Department of Environmental Protection (MDEP 2001a) Dioxin pollution causes ban on open burning of wastes! Aposter prepared by the Maine Department of Environmental Protection. Available at http://www.state.me.us/dep/air/com-pliance/byb/posterbyb.pdf.
Maine Department of Environmental Protection (MDEP 2001b) Plan for the Statewide Collection of Household HazardousWaste, March.
Maine Department of Environmental Protection (MDEP 1997) State of Maine 1997 Backyard Trash Burning (BYB) Study,Bureau of Air Quality, Augusta: Maine.
Maine Hospital Association (MHA 2001) Blueprint for Action, Maine Hospitals for a Healthy Environment – WorkingTogether to Build a Healthier Maine Environment, Winter. Available at http://www.themha.org/hhe/blueprint.htm.
RE
FE
RE
NC
ES
81

Maine Revised Statutes Annotated (MRSA 2004) Title 22, Section 9324, Out-of-door Fires: Prohibited Acts; added byChapter 277, An Act to Reduce the Release of Dioxin from Consumer Products into the Environment, Public Laws of
Maine, First Regular Session of the 120th Legislature, 2001.
Maine Revised Statutes Annotated (MRSA 2004a) Title 38, Chapter 24 - Solid Waste Management and Recycling,Section 2101 - Solid Waste Management Hierarchy, Paragraph 1, Added by Public Laws of 1989 as Chapter 585.Available at http://janus.state.me.us/legis/statutes/38/title38sec2101.html.
Manninen (1996) H., A. Perkio, T. Vartiainen, and J. Ruuskanen. “Formation of PCDD/PCDF: effect of fuel and fly ashcomposition on the formation of PCDD/PCDF in the co-combustion of refuse-derived and packaging-derived fuels.”Environmental Science and Pollution Research 3: 129-134.
Marklund (2003) A., B. Andersson, and P. Haglund. “Screening of organophophorus compounds and their distribution invarious indoor environments.” Chemosphere 53: 1137-1146.
Marrack (1988) D. “Hospital red bag waste: An assessment and management recommendations.” Journal of the AirPollution Control Association 38: 1309-1311.
MassPIRG (1998) It’s Perfectly Clear The Case Against PVC Packaging. MassPIRG, Boston, MA. Available atwww.pirg.org/masspirg/enviro/sw/pvc/index.htm.
Mersiowski (1999) I. and J. Ejlertsson. “Long-term Behaviour of PVC Products Under Landfill Conditions.” TechnicalUniversity of Hamburg-Harburg, Germany; Linköping University, Sweden, July.
Michigan Department of Environmental Quality (MDEQ 2003) “Burning Household Waste.” Brochure. MI DEQ AirQuality Division, Lansing, MI. June 2003. Available at http://www.deq.state.mi.us/documents/deq-aqd-bhw.pdf.
Microelectronics and Computer Technology Corporation (MCTC 1996) Electronics Industry Environmental Roadmap.MCTC, Austin, TX.
Moeller (1995) S., J. Larsen, J. Jelnes, H. Faergemann, L. Ottosen, and F. Knudsen. Environmental Aspects of PVC.Environmental Project No. 313, Danish Environmental Protection Agency.
Moore (2001) R., T. Rudy, T-M. Lin, K. Ko, and R. Peterson. Abnormalities of Sexual Development in Male Rats within Utero and Lactational Exposure to the Antiandrogenic Plasticizer Di(2-ethylhexyl) Phthalate. School of Pharmacy,Environmental Toxicology Center, and Endocrinology-Reproductive Physiology Program, University of Wisconsin,Madison, Wisconsin, USA. Available at http://ehpnet1.niehs.nih.gov/docs/2001/109p229-237moore/abstract.html.
Mossville Environmental Action Now, Inc. (MEAN 2000) “Breathing Poison: The Toxic Costs of Industries in CalcasieuParish, Louisiana.” A report by MEAN, Lake Charles Area Concerned Citizens, Communities for a Better Environment –NORAN Project, Earthjustice Legal Defense Fund (Louisiana Office).
National Academy of Sciences (NAS 2004) Acute Exposure Guideline Levels for Selected Airborne Chemicals, Volume 4.Subcommittee on the Acute Exposure Guidelines Committee on Toxicology Board on Environmental Studies andToxicology Division on Earth and Life Sciences National Research Council, Washington, DC.
National Academy of Sciences (NAS 2000) Toxicological Effects of Methylmercury. Committee on the Toxicological Effectsof Methylmercury, Board on Environmental Studies and Toxicology, Commission on Life Sciences National ResearchCouncil, Washington, DC.
National Academy of Sciences (NAS 2000a) Toxicological Risks of Selected Flame-Retardant Chemicals. Subcommittee onFlame-Retardant Chemicals, Board on Environmental Studies and Toxicology, Commission on Life Sciences NationalResearch Council, Washington, DC.
National Environmental Trust (NET 1999) Phthalates Found in Common Children’s Toys. NET Washington, DC,December.
RE
FE
RE
NC
ES
82

National Toxicology Program (NTP 2000) Center for the Evaluation of Risks to Human Reproduction Expert PanelReports: Di(2-ethyl hexyl) phthalate, Butyl benzyl phthalate, Di-isononyl phthalate, and Di-n-octyl phthalate, Research TrianglePark, NC. Available at http://cerhr.niehs.nih.gov/news/phthalates.
Neurath (2004) C. “PVC’s Role in Dioxin Emissions From Open Burning: New Analysis of US EPA Data.” OrganohalogenCompounds 66: 1146-1152.
New Hampshire Department of Environmental Services (NHDES 2003) “Prevention, Abatement, and Control of OpenSource Air Pollution” New Hampshire Code of Administrative Rules, Chapter Env-A 1000.
New Hampshire Department of Environmental Services (NHDES 2001) New Hampshire Dioxin Reduction Strategy.NHDES, Concord, NH, February.
New Mexico Environment Department (NMED 2004) “Environment Department Announces Major Changes to OpenBurning Regulation, Trash Burning Ban” Press Release, January 9.
Noda (1993) T. et al. “Teratogenic effects of various di-n-butyltins with different anions and butyl(e-hydroxybutyl)tindilaurate in rats.” Toxicology 85: 149-160.
Nordic Council of Ministers (NCM 2003) Lead Review. Prepared by COWI Consulting Engineers and Planners, January.
North Carolina Department of Environment and Natural Resources (NCDENR 1998) “Plastic: PVC (#3) CommodityProfile.” NC DENR Division of Pollution Prevention and Environmental Assistance.
Office of the Fire Marshall (OFM 1997) Protecting the Public and the Environment by Improving Fire Safety at Ontario’sRecycling and Waste Handling Facilities. Ministry of the Solicitor General and Correctional Services Office of the FireMarshal, August.
Office of Solid Waste Management (OSWM 1993) “The Technology of Plastics Recycling.” Solid Waste Management Vol.7, No, 7, July, University of Illinois at Chicago (M/C 922), Chicago, IL.
Oie (1997) L., LG Hersough and JO Madsen. “Residential exposure to plasticizers and its possible role in the pathogene-sis of asthma.” Environmental Health Perspectives 105: 972-978.
Ontario Ministry of the Environment and Energy (OMEE 1997) Plastimet Inc. Fire Hamilton Ontario July 9-12, 1997.OMEE Environmental Sciences and Standards Division and Operations Division, October.
Organization for Economic Co-operation and Development (OECD 2004)OECD Environment Health and Safety Publications, Series on Emission Scenario Documents Number 3, EmissionScenario Document on Plastics Additives, Environment Directorate, Joint Meeting of the Chemicals Committee and theWorking Party on Chemicals, Pesticides and Biotechnology, June 24.
Papp (1996) R. “Organochlorine waste management.” Pure and Applied Chemistry 68:1801-1808.
Pearson (1993) S. and L. Trissel. “Leaching of diethylhexyl phthalate from polyvinyl chloride containers by selected drugsand formulation components.” American Journal of Hospital Pharmacy 50 (7): 1405-09, July.
Pitot (1991) H.C. and Y.P. Dragan. “Facts and theories concerning the mechanisms of carcinogenesis.” The FASEBJournal 5: 2280-2286.
Pless (2002) P. and J.P. Fox. Environmental Assessment of Shoreguard and Alternative Bulkhead Materials. Report presented toCalifornia Coastal Commission, November 18.
Principia Partners (PP 1999) Post-Industrial and Post-Consumer Vinyl Reclaim, Material Flow and Uses in North America, AFinal Report to the Chlor-Vinyl Steering Group, July. Available at www.principiaconsulting.com/pdf/rteports_vinyl.pdf.
RE
FE
RE
NC
ES
83

Plastics Machining and Fabricating (PMF 2003) “APR Calls PVC Post-Consumer Bottles a ‘Contaminant’ to Recycling ofPET and HDPE Bottles.” Plastics Machining and Fabricating: Industry News Archive, July 30. Available athttp://www.plasticsmaching.com/magazine/news/news4.html
Plinke (2000) E., N. Wenk, G. Wolff, D. Castiglione, and M. Palmark. Mechanical Recycling of PVC Waste, Final Report, AStudy for DG XI of the European Commission in co-operation with Plastic Consult (Italy) and COWI (Denmark),Basal/Milan/Lyngby, January.
Recycling Today (RT 2001) “APR pulls back from PVC.” Recycling Today On-Line August 5. Available athttp://www.recyclingtoday.com/articles/articles.asp?Id=3270&SubCatID=12&CatID=3.
Rigo (1995) G., A. Chandler, and S. Lanier. The Relationship Between Chlorine in Waste Streams and Dioxin Emissions fromWaste Combustors. The American Society of Mechanical Engineers, New York.
Rossi (2001) M. Neonatal Exposure to DEHP (di-2-ethylhexyl phthalate) and Opportunities for Prevention. Health CareWithout Harm, Falls Church, VA.
Rossi (2000) M. and T. Schettler. “Setting Healthcare’s Environmental Agenda: White Paper on PVC.” October 16.Available at http://www.noharm.org/details.cfm?type=document&ID=489.
Rudell (2000) R.A. “Polycyclic Aromatic Hydrocarbons, Phthalates and Phenols. In Indoor Air Quality Handbook, Editedby JD Spangler, JF McCarthy and JM Samet, New York: McGraw Hill 34: 1-34.
Ruokojärvi (1995) P., M. Ettala, P. Rahkonen, J. Tarhanen, and J. Ruuskanen. “Polychlorinated Dibenzo-P-Dioxins and–Furans (PCDDs and PCDFs) in Municipal Waste Landfill Fires.’ Chemosphere 30 (9): 1697-1708.
Ruzickova (2004) K., M. Cobbing, M. Rossi, and T. Belazzi. Preventing Harm from Phthalates, Avoiding PVC in Hospitals. AHealth Care Without Harm Report. Available at: http://www.noharm.org/details.cfm?type=document&id=918.
Sadiki (1999) A. and D. Williams. “A study on organotin levels in Canadian drinking water distributed through PVCpipe.” Chemosphere 38 (7): 1541-1548.
Sadiki (1996) A., D. Williams, R. Carrier, and B. Thomas. “Pilot Study on the contamination of drinking water by organ-otin compounds from PVC materials.” Chemosphere 32 (12): 2389-2398.
Sakai (1997) S. and M. Hiraoka. “A study of total PCDDs/Fs release to environment from MSWI.” OrganohalogenCompounds 31: 376-381.
Sanders (1978) H.J. “Flame retardants: Government regulations and public emphasis on safety provide the impetus for anexpanding industry.” Chemical & Engineering News, pp. 22-36, April 24.Sasolwatch (2004) Available at http://www.sasolwatch.com.
Sakti (1991) J.P., J.K. Park, and J.A. Hoopes. “Permeation of organic chemicals through HDPE geomembranes.” InProceedings of ASCE National Environmental Engineering Conference, ASCE, New York, July.
Schecter (1996) A. and H. Kessler. “Dioxin and dibenzofuran formation following a fire at a plastic storage warehouse inBinghamton, New York in 1995.” Organohalogen Compounds 27: 187-190.
Schreiber (2003) J. Affidavit before the Supreme Court of the State of New York in the matter of the Resilient FloorCovering Institute and Tarkett, Inc. versus the New York State Department of Environmental Conservation.
Seth (1982) P.K. “Hepatic effects of phthalate esters.” Environmental Health Perspectives 45: 27-34.
Silicon Valley Toxics Coalition (SVTC 2004) “Just Say No to E-Waste: Background Document on Hazards and Wastefrom Computers.” SVTC, San Jose, CA. Available at http://www.svtc.org/cleancc/pubs/sayno.htm
RE
FE
RE
NC
ES
84

Singhofen (1997) A. “End-of-Life Vehicles: A Threat to the Environment, The Need to Ban the Use of PVC (Vinyl) Plasticin Cars.” Clean Car Campaign, December. Available at http://www.cleancarcampaign.org/pvc_elvbackground.shtml.
Steingraber (2004) S. Update on the Environmental Health Impacts of Polyvinyl Chloride (PVC) as a Building Material:Evidence from 2000-2004, a commentary for the U.S. Green Building Council, on behalf of Healthy Building Network,April 2. Available at www.healthybuilding.net/pvc/steingraber.pdf.
Steingraber (2004a) S. “Fireballs in the Night Sky, Death by a Thousand Cuts; Lessons from the Formosa PVC Plant,Illiopolis, Illinois.” Healthy Building News, May 3.
Stone Container Corporation (SCC 1988) Correspondence with Attachment from Jenny Brown, Process Engineer –Paper to Larry Lloyd, Administrator, Montana Department of Health and Environmental Sciences, Helena, Montana.Attachment was a revision to the proposed OCC plant report previously submitted to the MDHES, October 19.
Stringer (1997) R., I. Labounskaia, D. Santillo, P. Jonston, J. Siddorn and A Stephensen. Determination of the Compositionand Quality of Phthalate Ester Additives in PVC Children’s Toys. Greenpeace Research Laboratories Technical Note 06/97University of Exeter Department of Biological Sciences, Prince of Wales Road, Exeter, England, September.
Sustainable Hospital Project (SHP 2000) “Here are four ways to find alternative products.” Lowell Center for SustainableProduction, Lowell, MA. Available at http://www.sustainablehospitals.org/cgi-bin/DB_Index.cgi.
Takasuga (2000) T., T. Makino, K. Tsubota, and N. Takeda. “Formation of dioxins (PCDDs/PCDFs) by dioxin-free fly ashas a catalyst and relation with several chlorine sources.” Chemosphere 40: 1003-1007.
Tamade (2000) Y., T. Ikeguchi, Y. Yagi, K. Yoneda, and K. Omori. “Generation of dioxins from waste plastics combustionin a fluidized bed incinerator.” Organohalogen Compounds 46: 166-169.
Tellus (1992) Institute. Council of State Governments/Tellus Packaging Study. Prepared for the Council of StateGovernments, US Environmental Protection Agency, and New Jersey Department of Environmental Protection andEnergy, Boston MA.
ten Tusscher (2000) G.W., G.A. Stam, and J.G. Koppe. “Open chemical combustions resulting in a local increased inci-dence of orofacial clefts.” Chemosphere 40:1263-1270.
Theisen (1991) J. Untersuchung der Moglichen Umweltgefahrdung Beim Brand Von Kunststoffen (Investigation of PossibleEnvironmental Dangers Caused by Burning Plastics) German Umweltbundesamt Report 104-09-222, Bismarkplatz 1, 1000Berlin 33, Germany.
Thornton (2002) J. Environmental Impacts of Polyvinyl Chloride Building Materials – A Healthy Building Network Report.Healthy Building Network, Washington, DC, 2002. Available at http://www.healthybuilding.net/pvc/Thornton_Enviro_Impacts_of_PVC.pdf
Thornton (2000) J. Pandora’s Poison: Chlorine, Health, and a New Environmental Strategy. Cambridge, Massachusetts:MIT Press.
Thornton (1997) J. The PVC Lifecycle: Dioxin from Cradle to Grave. Greenpeace, April 1997. Available at http://archive.greenpeace.org/~usa/reports/toxics/PVC/cradle/dcgtoc.html.
Tickner (1999) J. The Use of Di-2-Ethylhexyl Phthalate in PVC Medical Devises: Exposure, Toxicity, and Alternatives.University of Massachusetts at Lowell: Lowell Center for Sustainable Production, Lowell, MA.
Tickner (1999a) J. A Review of the Availability of Plastic Substitutes for Soft PVC in Toys, University of Massachusetts atLowell: Lowell Center for Sustainable Production, Lowell, MA, February.
TNO (1996) Center for Technology and Policy Studies. A PVC Substance flow Analysis for Sweden: Report for Norsk-Hydro, Apeldoorn, Netherlands as cited in Thornton 2002.
RE
FE
RE
NC
ES
85

Tukker (2001) A., H. Buijst, L. van Oers, and E. van der Voet. Risks to Health and the Environment Related to the Use ofLead in Products. TNO Strategy, Technology and Policy. TNO Report STB-01-39 (Final), September, 2001. Available athttp://europa.eu.int/comm/enterprise/chemicals/legislation/markrestr/studies/lead.pdf
Tuomainen (2003) A., M. Seuri, and A. Sieppi. “Indoor air quality and health problems associated with damp floor cover-ings.” International Archives of Occupational and Environmental Health 77(3): 222-6, April.
Turner Toys (2002) “An Evaluation of the Hazards of Toys and Other Products made from Polyvinyl Chloride (PVC).”Website at http://www.turnertoys.com/PVC_framepage1.htm.
UBA (2001) Umweltbundesamt (German Federal Environmental Agency) A. Lesisewitz, H. Kruse, and E. Schramm.Substituting Environmentally Relevant Flame Retardants: Assessment Fundamentals: Results and summary overview,Environmental Research of the Federal Ministry of the Environment, Nature Conservation and Nuclear Safety, ResearchReport 204 08 542 (old) 297 44 542 (new), UBA-FR 000171/1o.
Uhde (2001) E., M. Bednarek, F. Fuhrmann, and T. Salthammer. “Phthalate esters in the indoor environment – testchamber studies on PVC-coated wall coverings.” Indoor Air 11(3): 150-155.
Upshur (2001) R., M. James, E. Richardson, G. Brunton, W. Hunter, and L. Chambers. “Short-term Adverse HealthEffects in a Community Exposed to a Large Polyvinyl Chloride Plastics Fire.” Archives of Environmental Health 56(3): 264-270.
U.S. Congress Office of Technology Assessment (USOTA 1990) Finding the Rx for Managing Medical Wastes. OTA-O-459, Washington, DC, September.
U.S. Congress Office of Technology Assessment (USOTA 1988) Issues in Medical Waste Management Background Paper.OTA-BP-O-49, Washington, DC, October.
U.S. Department of Health and Human Services (USHHS 2002) Public Health Services, National Toxicology Program,Report on Carcinogens, Tenth Edition, December 2002. Available at http://ehp.niehs.nih.gov/roc/toc10.html.
U.S. Environmental Protection Agency (USEPA 2004) “Toxic Release Inventory, Release Year 2002.” Chemical ReportVinyl Chloride and Dichloroethane U.S. 2002. Data set frozen April 1, 2004 and released to the public June 23, 2004.Available at www.epa.gov/triexplorer.
U.S. Environmental Protection Agency (USEPA 2004a) “Lead Compounds Fact Sheet.” USEPA Technology TransferNetwork Air Toxics Website, last updated June 14. Available at http://www.epa.gov/ttn/atw/hlthef/vinylchl.html.
U.S. Environmental Protection Agency (USEPA 2004b) “HMIWI Facility and Emissions Inventory–English Units.” June8. Available at http://www.epa.gov/ttn/atw/129/hmiwi/2004hmiwi_inventory.xls.
U.S. Environmental Protection Agency (USEPA 2004c) “Basic Facts: Municipal Solid Waste (MSW),” A fact sheet pre-pared by the U.S. Environmental Protection Agency. Available at http://www.epa.gov/epaoswer/non-hw/muncpl/facts.htm.
U.S. Environmental Protection Agency (USEPA 2004d) “Toxic Release Inventory, Release Year 2002.” Chemical ReportDioxin and Dioxin-like Compounds U.S. 2002. Data set frozen April 1, 2004 and released to the public June 23, 2004.Available at www.epa.gov/triexplorer.
U.S. Environmental Protection Agency (USEPA 2003) Municipal Solid Waste in the United States: 2001 Facts and Figures.USEPA Office of Solid Waste and Emergency Response (5305W), EPA530-R-03-011, October.
U.S. Environmental Protection Agency (USEPA 2003a) “Ethylene Dichloride (1,2-Dichloroethane) Fact Sheet.” USEPATechnology Transfer Network Air Toxics Website, last updated February 12. Available athttp://www.epa.gov/ttnatw01/hlthef/di-ethan.html
U.S. Environmental Protection Agency (USEPA 2003b) “Chlorine Fact Sheet.” USEPA Technology Transfer NetworkAir Toxics Website, last updated February 12. Available at http://www.epa.gov/ttn/atw/hlthef/chlorine.html
RE
FE
RE
NC
ES
86
U.S. Environmental Protection Agency (USEPA 2003c) “National Emission Standards for Hazardous Air Pollutants:Mercury Emissions from Mercury Cell Chlor-Alkali Plants. Final Rule.” 40 CFR Part 63 Federal Register Vol. 68 (244)70904, December 19.
U.S. Environmental Protection Agency (USEPA 2003d) “Cadmium Compounds Fact Sheet.” USEPA Technology TransferNetwork Air Toxics Website, last updated February 12. Available at http://www.epa.gov/ttn/atw/hlthef/cadmium.html.
U.S. Environmental Protection Agency (USEPA 2003e) “Backyard Burning: Basic Information.” USEPA Office of SolidWaste and Emergency Response, September 17. Available at http://www.epa.gov/epaoswer/non-hw/muncpl/backyard.
U.S. Environmental Protection Agency (USEPA 2003f) “Backyard Burning: Health Effects.” USEPA Office of SolidWaste and Emergency Response, September 17. Available at http://www.epa.gov/epaoswer/non-hw/muncpl/backyard.
U.S. Environmental Protection Agency (USEPA 2003g) “The Hidden Hazards of Backyard Burning.” Brochure. USEPAOffice of Solid Waste and Emergency Response, EPA530-F-03-112, August. Available athttp://www.epa.gov/epaoswer/non-hw/muncpl/backyard/pubs/residents.pdf.
U.S. Environmental Protection Agency (USEPA 2003h) “State and Local Governments Are Key to Reducing BackyardBurning.” Brochure. USEPA Office of Solid Waste and Emergency Response, EPA530-F-03-003, August, 2003. Availableat http://www.epa.gov/epaoswer/non-hw/muncpl/backyard/pubs/st_local1.pdf.
U.S. Environmental Protection Agency (USEPA 2003i) “Where You Live: Information on what your state and communi-ty are doing about backyard burning. USEPA Office of Solid Waste and Emergency Response, last updated September 17.Available at http://www.epa.gov/epaoswer/non-hw/muncpl/backyard/live.htm.
U.S. Environmental Protection Agency (USEPA 2002) “Vinyl Chloride Fact Sheet.” USEPA Technology TransferNetwork Air Toxics Website. Available at http://www.epa.gov/ttn/atw/hlthef/vinylchl.html.
U.S. Environmental Protection Agency (USEPA 2002a) “Emission from Large MWC Units at MACT Compliance.”Memorandum from Walt Stevenson, Combustion Group, ESD, OAQPS, USEPA to Docket A-90-45 (Large MWCs),Research Triangle Park, North Carolina, June 20.
U.S. Environmental Protection Agency (USEPA 2002b) Solid Waste Management and Greenhouse Gases: A Life-CycleAssessment of Emissions and Sinks. EPA530-R-02-006, May. Available at http://www.epa.gov/epaoswer/non-hw/muncpl/ghg/ghg.htm
U.S. Environmental Protection Agency (USEPA 2001) Exposure and Human Health Reassessment of 2,3,7,8Tetrachlorodibenzo-p-Dioxin (TCDD) and Related Compounds, Part I: Estimating Exposures to Dioxin–Like Compounds, Volume2: Sources of Dioxin-Like Compounds in the United States. September 2000. Available athttp://www.epa.gov/ncea/pdfs/dioxin/part1/volume2.
U.S. Environmental Protection Agency (USEPA 2000) Exposure and Human Health Reassessment of 2,3,7,8Tetrachlorodibenzo-p-Dioxin (TCDD) and Related Compounds. September 2000. Available athttp://www.epa.gov/ncea/pdfs/dioxin/part3/chapter1-6.pdf.
U.S. Environmental Protection Agency (USEPA 2000a) “Federal Plan Requirements for Hospitals/Medical/InfectiousWaste Incinerators Constructed On or Before June 20, 1996, Final Rule.” Federal Register 65 (158): 49868-49894.
U.S. Environmental Protection Agency (USEPA 1998) Inventory of Sources of Dioxins in the United States. Review Draft.EPA/600P-98/002Aa. April 1998. Available at http://cfpub1.epa.gov/ncea/cfm/recordisplay.cfm?deid=20797
U.S. Environmental Protection Agency (USEPA 1997) Locating and Estimating Air Emissions From Sources of Dioxins andFurans. USEPA Office of Air Quality Planning and Standards, Office of Air and Radiation, EPA-454/R-97-003,Research Triangle Park, North Carolina, May 1997.
RE
FE
RE
NC
ES
87

U.S. Environmental Protection Agency (USEPA 1995) Air Emissions from Municipal Solid Waste Landfills – BackgroundInformation for Final Standards and Guidelines, Final EIS. Office of Air Quality Planning and Standards, EPA-453/R-94-021, Research Triangle Park, NC, December.
U.S. Environmental Protection Agency (USEPA 1994) Medical Waste Incinerators – Background Information for ProposedStandards and Guidelines: Industry Profile Report for New and Existing Facilities. USEPA Office of Air Quality Planning andStandards, Research Triangle Park, NC., July. Available at http://www/.epa.gov/ttnatw01/129/hmiwi/rihmiwi.html.
U.S. Environmental Protection Agency (USEPA 1994a) “Supreme Court Rules; Treat Incinerator Ash as HazardousWaste.” National Center for Environmental Economics, newsletter Volume #1, Summer.
U.S. Environmental Protection Agency (USEPA 1993) Evaluation of an Automated Sorting Process for Post-Consumer MixedPlastic Containers. USEPA Office of Research and Development, EPA/600/R-93/165, Washington DC, September.
U.S. Environmental Protection Agency (USEPA 1991) “Solid Waste Disposal Facility Criteria; Final Rule.” 40 CFR Parts257 and 258. Federal Register 56 (196): 50,978-51,119, October 9.
U.S. Environmental Protection Agency (USEPA 1990) Air Emissions from Municipal Solid Waste Landfills – BackgroundInformation for Proposed Standards and Guidelines, Draft EIS, Office of Air Quality Planning and Standards, ResearchTriangle Park, NC, March 12.
U.S. Environmental Protection Agency (USEPA 1989) The Solid Waste Dilemma: An Agenda for Action. Final Report ofthe Municipal Waste Task Force, EPA530-SW-89-019, February.
U.S. Food and Drug Administration (USFDA 2001) Safety Assessment of Di(2-ethylhexyl)phthalate (DEHP) Released fromPVC Medical Devices. FDA Center for Devices and Radiological Health, Rockville, MD, September.
van der Naald (1998) G.N. and B.G. Thorpe. PVC Plastic, A Looming Waste. Greenpeace International, The Netherlands,April.
Vesterinen (1996) R. and M. Flyktmann. “Organic emissions from co-combustion of RDF with wood chips and milledpeat in a bubbling fluidized bed boiler.” Chemosphere 32: 681-689.
Vikelsoe (2000) J. and E. Johansen. “Estimation of dioxin emissions from fires in chemicals.” Chemosphere 40: 165-175.
Vinyl Institute (VI 2004) “Vinyl – the Material.” Fact sheet prepared by the Vinyl Institute. Available athttp://www.vinylinfo.org/materialvinyl/material.html.
Vinyl Institute (VI 2004a) “Recycling Vinyl.” Fact sheet prepared by the Vinyl Institute. Available at http://www.vinylin-fo.org/rcycling/index.html.
Vinyl Institute (VI 2004b) “Vinyl Automotive.” Vinyl Facts. Fact sheet prepared by the Vinyl Institute. Available athttp://www.vinylfacts.com/auto/auto_briefing.html.
Vinyl Institute (VI 2004c) “Infinite Uses.” Vinyl in Automobiles (Europe). Fact sheet prepared by the Vinyl Institute.Available at http://www.vinylinfo.org/infiniteuses/automotive/autobriefing.html#5.
Wagner (1993) J. and A. Green. “Correlation of chlorinated organic compound emissions from incineration with chlori-nated organic input.” Chemosphere 26: 2039-2054.
Wallace (1990) D. In the Mouth of the Dragon: Toxic Fires in the Age of Plastics. Avery Publishing Group: Garden City,New York. 1990.
Washington Toxics Coalition (WTC 2004) Available at www.watoxics.org/content/pdf/Vinyl.pdf.
RE
FE
RE
NC
ES
88

Wilken (1994) M. “Dioxin emissions from furnaces, particularly from wood furnaces.” Berlin: Engineering Group forTechnological Environmental Protection for the German Environmental Protection Agency, February 1994. GermanEnvironmental Protection Agency (UBA) “Dioxin emissions from wood furnaces” (Press release). Berlin, February.
Women’s Voices for the Earth (WVE 2002) “PVC- What is it? Why do we care?” Fact sheet on PVC and Smurfit-StoneContainer prepared by WVE, Missoula, MT.
Woodward (1990) K.N. “Phthalate esters cystic kidney disease in animals and possible effects on human health: areview.” Human Experimental Toxicology 9: 397-401.
World Health Organization (WHO 1997) International Agency for Research on Cancer Monographs on the Evaluation ofCarcinogenic Risks to Humans, Volume 69 Polychlorinated Dibenzo-para-Dioxins and Polychlorinated Dibenzofurans, Lyon,France, February.
World Health Organization (WHO 1980) Environmental Health Criteria 15. Tin and Organotin Compounds: A PreliminaryReview. International Programme on Chemical Safety, Geneva, Switzerland.
Wu (1989) W., R.S. Roberts, Y-C. Chung, W. Ernst, and S.C. Havlicek. “The extraction of organotin compounds fropolyvinyl chloride pipe.” Archives of Environmental Contamination and Toxicology 18: 839-843.
Wunderli (2000) S., M. Zennegg, et al. “Determination of polychlorinated dibenzo-p-dioxins and dibenzofurans in solidresidues from wood combustion by HRGC-HRMS.” Chemosphere 40: 641-649.
Yaw (1999) E.M. and J. Morris. “Old PVC Pipe a Potential Problem.” Opflow, pp. 6-7, January.
Yamamoto (1999) T. and Yasuhara, A. “Quantitities of bisphenol A leached from plastic waste samples.” Chemosphere 38:2569-2576.
Yasuhara (2001) A., T. Katami, T. Okuda, N. Ohno, and T. Shibamoto “Formation of dioxins during the combustion ofnewspapers in the presence of sodium chloride and poly (vinyl chloride).” Environment Science & Technology 35 (7): 1373-78, April 1.
Yoneda (2000) K., Y. Yagi, T. Ikeguchi, Y. Tamade, and K. Omori. “Behavior of dioxins and precursors in industrial wasteincineration.” Organohalogen Compounds 46: 170-173.
RE
FE
RE
NC
ES
89


ENVIRONMENTALH E A L T HS T R A T E G Y C E N T E R
Printed with soy-based inks on Scheufelen Phoeno Star, a process chlorine-free paper.