putting ubiquitous devices' data to use - birkbeck, …gr/muc/2013/4_neal_lathia.pdfputting...
TRANSCRIPT

Putting Ubiquitous Devices' Data to Use
@neal_lathiaUniversity of Cambridge
January 23, 2013

what data can we collect?

recommender systemsaim to match users to items that will be of interest to them

recommender systemsaim to match users mobility profiles to items social events that will be of interest to them
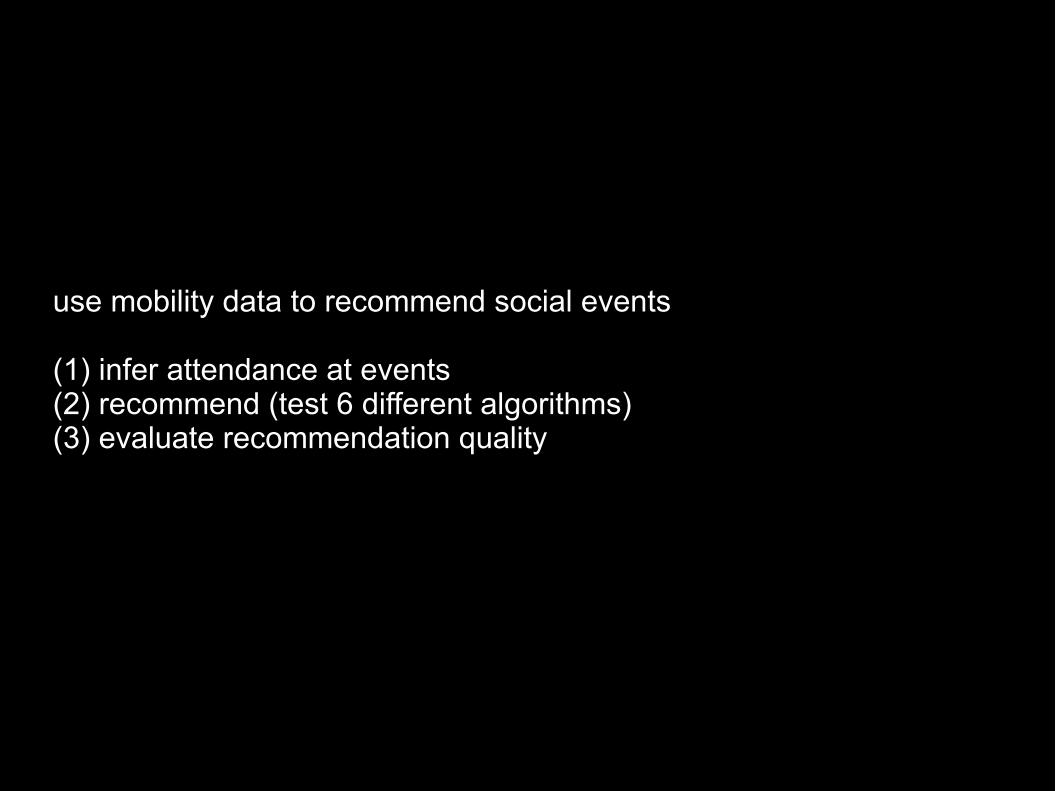
use mobility data to recommend social events
(1) infer attendance at events(2) recommend (test 6 different algorithms)(3) evaluate recommendation quality


task
(1) get users' data, split temporally(2) run algorithm that outputs recommendations... (3) evaluate the quality of the recommendations

algorithms
(1) popular events (in the city)(2) geographically close(3) popular events (where you live)(4) TF-IDF(5) k-Nearest Locations(6) k-Nearest Events

what is a good recommendation?

what is a good recommendation?
evaluate by ranking: are the events you went to 'near' the top of the recommendation list?
metric: percentile ranking. small value = good. high value = bad.


future
how would you use other smartphone sensors to improve recommendations?


what tools could we design to help travellers?

sensing mobility:5%-sample, 2 x 83-days
time-stamped location (entry, exit), modality payments (top-ups, travel cards)
card-types (e.g., student)

mobility vs. cost

questions
(1) what is the relation between how we travel & how we spend?(2) do travellers make the correct decisions? (no)(3) can we help them with recommendations? (yes)

(%) pay as you go purchases
49.8 < 5 GBP
24.2 5 – 10 GBP
15.5 10 – 20 GBP
(%) travel card purchases
70.8 7-day travel card
15.8 1-month travel card
11.6 7-day bus/tram pass
Mon Tue Wed Thu Fri Sat Sun
0
5
10
15
20
25
30 Purchase BehaviourTravel CardsPAYG
% P
urch
ases

Mobility FlowZone 1Zone 2Zone 3Zone 4Zone 5Zone 6
arrive
depart
1 2 3 4 5 6 7 8 9
0
5
10
15
20
25
30
35
40
45Purchase Geography
PAYGTravel Cards

the data shows that:(a) there is a high regularity in travel & purchase behaviour(b) travellers buy in small increments and short-terms(c) most purchases happen upon refused entry

(2) do travellers make the correct decisions?compare actual purchases to the optimal (per traveller)
how:(a) clean data(b) build & search on a tree ~ sequence of choices

PAYG, £aa.aa
7-day£bb.bb
30-day£cc.cc
how: build a tree with each user's mobility datawhere a node is a purchase (expire, cost)that is expanded when it has expired(reduced) example:

how: build a tree with each user's mobility datawhere a node is a purchase (expire, cost)that is expanded when it has expired(reduced) example:
PAYG, £aa.aa
7-day£bb.bb
30-day£cc.cc
7-day£bb.bb
PAYG, £aa.aa
30-day£cc.cc
we reduce the space-complexity ofsearching on this tree by implementing
expansion rules, pruning heuristics
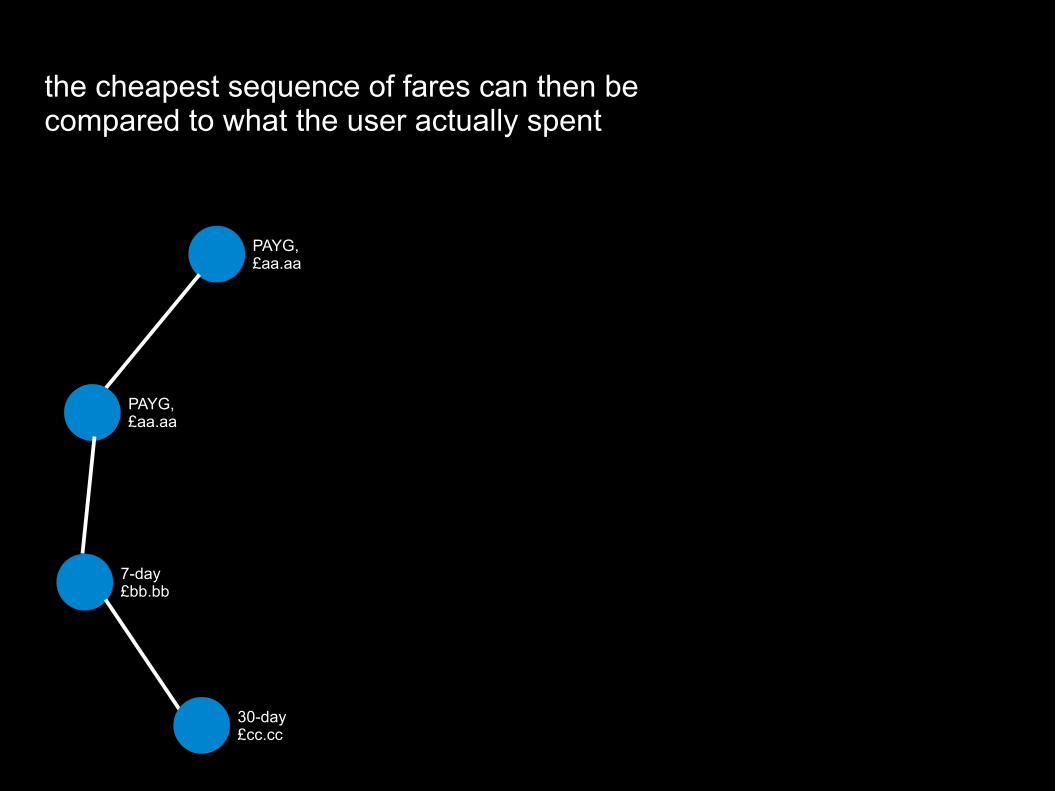
the cheapest sequence of fares can then be compared to what the user actually spent
PAYG, £aa.aa
7-day£bb.bb
PAYG, £aa.aa
30-day£cc.cc

the cheapest sequence of fares can then be compared to what the user actually spent
PAYG, £aa.aa
7-day£bb.bb
PAYG, £aa.aa
30-day£cc.cc
in each 83-day dataset, the 5% sample of userswhere overspending by ~ £2.5 million
An estimate of how much everybody (100%)is overspending during an entire year (365 days)
is thus £200 million

overspending comes from(a) failing to predict one's own mobility needs
...but we have observed that mobility is predictable
(b) failing to match mobility with fares (in a complex fare system)...which is an easy problem for a computer
can we help travellers?

recommender systemsaim to match users to items that will be of interest to them

recommender systemsaim to match users mobility profiles to items fares that will be of interest the cheapest for them

three steps1. for a given set of travel histories, compute the cheapest
fare (by tree expansion)2. reduce each travel history into a set of generic features,
describing the mobility (next slide)3. train classifiers to predict the cheapest fare given the set
of features

we have a set of {d, f, b, r, pt, ot, N} = F
where
d = number of tripsf = average trips per day
b / r = proportion of trips on the bus / railpt / ot = proportion of peak & off-peak trips
N = zone O-D matrixF = cheapest fare (label)

two baselines, three algorithms:0. baseline – everyone on pay as you go 1. naïve bayes – estimating probabilities2. k-nearest neighbours – looking at similar profiles3. decision trees (C4.5) – recursively partitions data to infer rules4. oracle – perfect knowledge

Accuracy (%) Savings (GBP)
Dataset 1 Dataset 2 Dataset 1 Dataset 2
Baseline 74.99 76.91 326,447.95 306,145.85
Naïve Bayes 77.46 80.71 393,585.81 369,232.24
k-NN (5) 96.74 97.09 465,822.17 426,375.85
C4.5 98.01 98.29 473,918.38 434,082.81
Oracle 100 100 479,583.91 438,923.30

station interest ranking
current system: free travel alerts – manually set up by traveller
future system: predict (and rank) the stations that travellers will visit in their future trips for personalised notifications

station interest ranking
can we automate this?
baseline: rank by visit popularity
proposal: station similarity neighbourhood (visit co-occurrence) and traveller trip history

station interest ranking

accurate rankingwithout knowing who travellers are, the network topology, train schedule, disruptions and closures, we designed: no context

today:(a) mobile location recommendations (b) fare purchase recommendations(c) travel alerts

Further reading:
D. Quercia, N. Lathia, F. Calabrese, G. Di Lorenzo, J. Crowcroft. Recommending Social Events from Mobile Phone Location Data. In IEEE ICDM 2010, Sydney, Australia.
N. Lathia, L. Capra. Mining Mobility Data to Minimise Travellers' Spending on Public Transport. In ACM KDD 2011, San Diego, USA.
N. Lathia, J. Froehlich, L. Capra. Mining Public Transport Data for Personalised Intelligent Transport Systems. In IEEE ICDM 2010, Sydney, Australia.
Android app to try: www.tubestar.co.uk
