putting the permian basin in perspective: tight oil & the ... · all prices in constant july...
TRANSCRIPT

Slide1LabyrinthConsul4ngServices,Inc. artberman.com
Putting the Permian Basin in Perspective: Tight Oil & the Long-Term Debt Cycle
West Texas Geological Society 2017 Fall Symposium
Art Berman Labyrinth Consulting Services, Inc.
Midland, Texas September 27, 2017

Slide2LabyrinthConsul4ngServices,Inc. artberman.com
Pu>ngtheShaleRevolu4oninPerspec4ve
• The1stBubble1974-1980:oilshocksandpriceincreasefrom$23to$117/barrelledtomassiveE&Pinvestments,over-produc4on,demanddestruc4on&oil-pricedefla4onun4l1998.
• SecondBubble:1999-2014:flatglobaloutput&growingAsiandemandledtoincreasingoilpricesfrom$17to$148/barrelby2008.
• ATerthe2008FinancialCollapse,OPECcutproduc4onthen,decliningOPECsparecapacity,fallingOECDinventories,&near-zerointerestrates—ledtothelongestperiodofhighoilpricesinhistoryfrom2011-2014.
• Over-investmentresultedinamassiveover-supply,muchofitfromtheUnitedStates.• Thebubbleburstin2014andpricescollapsed.
52
53
54
55
56
57
58
59
60
61
62
63
64
65
66
Jan-12
Mar-12
May-12
Jul-1
2
Sep-12
Nov-12
Jan-13
Mar-13
May-13
Jul-1
3
Sep-13
Nov-13
Jan-14
Mar-14
May-14
Jul-1
4
Sep-14
Nov-14
Jan-15
Mar-15
May-15
Jul-1
5
Sep-15
Nov-15
Jan-16
Mar-16
May-16
Jul-1
6
Sep-16
Nov-16
MillionsofIn
crem
entalBarrelsofCrudeOil&CondensatePerD
ay
U.S.IncrementalOuput:TheMajorCauseForLowOilPrices
Iraq
Iran
RussiaBrazil
SaudiArabia
U.S.
Canada
KuwaitUAE
AngolaVenezuelaMexicoAlgeriaNigeriaBase
Libya
Indonesia-Ecuador-Qatar-Gabon
Source:EIA & LabyrinthConsulting Services,Inc.
Canada, Iraq,Iran SaudiArabia andRussiaAlsoImportantContributors
$0
$10
$20
$30
$40
$50
$60
$70
$80
$90
$100
$110
$120
$130
$140
$150
$160
Jan-70
Jan-71
Jan-72
Jan-73
Jan-74
Jan-75
Jan-76
Jan-77
Jan-78
Jan-79
Jan-80
Jan-81
Jan-82
Jan-83
Jan-84
Jan-85
Jan-86
Jan-87
Jan-88
Jan-89
Jan-90
Jan-91
Jan-92
Jan-93
Jan-94
Jan-95
Jan-96
Jan-97
Jan-98
Jan-99
Jan-00
Jan-01
Jan-02
Jan-03
Jan-04
Jan-05
Jan-06
Jan-07
Jan-08
Jan-09
Jan-10
Jan-11
Jan-12
Jan-13
Jan-14
Jan-15
Jan-16
Jan-17
CPIA
djustedWTIPrice
s(Ja
nuary2017DollarsPe
rBarrel)
Oil Shocks-->
Massive E&PInvestment(North
Sea,Mexico,Siberia)
Over-Supply, DemandDestruction&PriceDeflation
Debt-FueledEconomicExpansion&Rapid
GrowthinChina&EastAsia
MassiveE&PInvestment(Shale, DeepWater,Heavy
Oil)
Over-Supply, DemandDestruction&Price
Deflation
Current$50OilPrice>40%HigherThanJan1986- Dec2004AverageinJuly2017Dollars
Source:EIA, U.S.Bureau ofLaborStatistics &LabyrinthConsulting Services,Inc.
Avg1986-2004 $36/barrel Avg2005-2014$91/barrel
All PricesinConstant July2017Dollars
Avg1974-1985 $71/barrel<$23/barrel
$50/barrel
1stBubble:1974-1980
2ndBubble:1999-2014
$48/barrel

Slide3LabyrinthConsul4ngServices,Inc. artberman.com
OilPrices&TheLong-TermDebtCycle
$0
$10
$20
$30
$40
$50
$60
$70
$80
$90
$100
$110
$120
$0
$5
$10
$15
$20
$25
$30
$35
1960
1962
1964
1966
1968
1970
1972
1974
1976
1978
1980
1982
1984
1986
1988
1990
1992
1994
1996
1998
2000
2002
2004
2006
2008
2010
2012
2014
2016
WTIPricein2016Do
llarsPerBarrel
U.S.G
ovennm
ent+
Consumer+Non-FinancialCorporateDebt(Trillions)
OilPrices2.4timesHigherAfter2004Than1986-2004In2016Dollars
Debt
GDP
Source:U.S.FederalReserveBank,U.S.Bureauof Labor Statiistics, WorldBank,EIA&LabyrinthConsulting Services,Inc.
Oil Price
Oil Shocks$69AvgPrice
$86AvgPrice
$34AvgPrice
Debt>GDPAfter1974-1986OilShocks
$23AvgPrice
$48$45/barrel1950-2016AvgPrice
Debt >GDPAfter1986
3.5
2.7
3.5
4.1
3.4
2.2
2.9
1.1
1.2
1.7
1.4
1.8
1.1
0.4
0.5
0.6
0.1
1.0
1.5
1.7
1.3
0.5
1.8
1.8
0.8
0.6
1.6
3.1
1.4
1.0
1.5
3.1
0.9
1.1
1.0
1.2
1.9
1.3
1.5
1.4
-0.8
-0.4
-1.3
-1.9
-1.5
-0.4
-0.2
-0.6
-1.0
-2.25 -2 -1.75 -1.5 -1.25 -1 -0.75 -0.5 -0.25 0
0.25
0.5
0.75
1
1.25
1.5
1.75
2
2.25
2.5
2.75
3
3.25
3.5
3.75
4
4.25
4.5
$0
$20
$40
$60
$80
$100
$120
1970
1971
1972
1973
1974
1975
1976
1977
1978
1979
1980
1981
1982
1983
1984
1985
1986
1987
1988
1989
1990
1991
1992
1993
1994
1995
1996
1997
1998
1999
2000
2001
2002
2003
2004
2005
2006
2007
2008
2009
2010
2011
2012
2013
2014
2015
2016
2017E
2018E
AnnualLiquidsDemandGrowth(mmb/d)
CPI-AdjustedBrentPrice(December2016$/barrel)
NoDemandDestructionDuringThe2012-2016Oil-PriceCollapse
Source:IEA,EIA,OPEC, BP,U.S.BureauofLabor Statistics&Labyrinth Consulting Services,Inc.
PositiveDemandGrowth(RHS)
BrentPriceLHS(WTIbefore 1975)
NegativeDemandGrowth
(RHS)
1.2mmb/d30-YearAvg
• PetroleumAgeaTerWWIIproducedunprecedentedeconomicgrowth.• Oilshocksof1974-1986threatenedtoendthatparty.• Demanddestruc4on&oilproduc4onbubbleresultedin18yearsofcheapenergy.• Debtre-startedeconomicgrowth&debt-basedgrowthofChinachallengedoilsupplyaTer2004.• Secondoilshockmadeunconven4onaloilpossible.Zero-interestratesledto2ndoilbubble.• Longestperiodofhighoilpricesinhistory.• Thatbubbleburstin2014andoilpricescollapsedbutwithoutdemanddestruc4on.• Now,weareneartheendoflong-termdebtcyclebutdenyingthattheeconomicbasicshave
fundamentallychangedsincethepost-warera.
Slide4LabyrinthConsul4ngServices,Inc. artberman.com
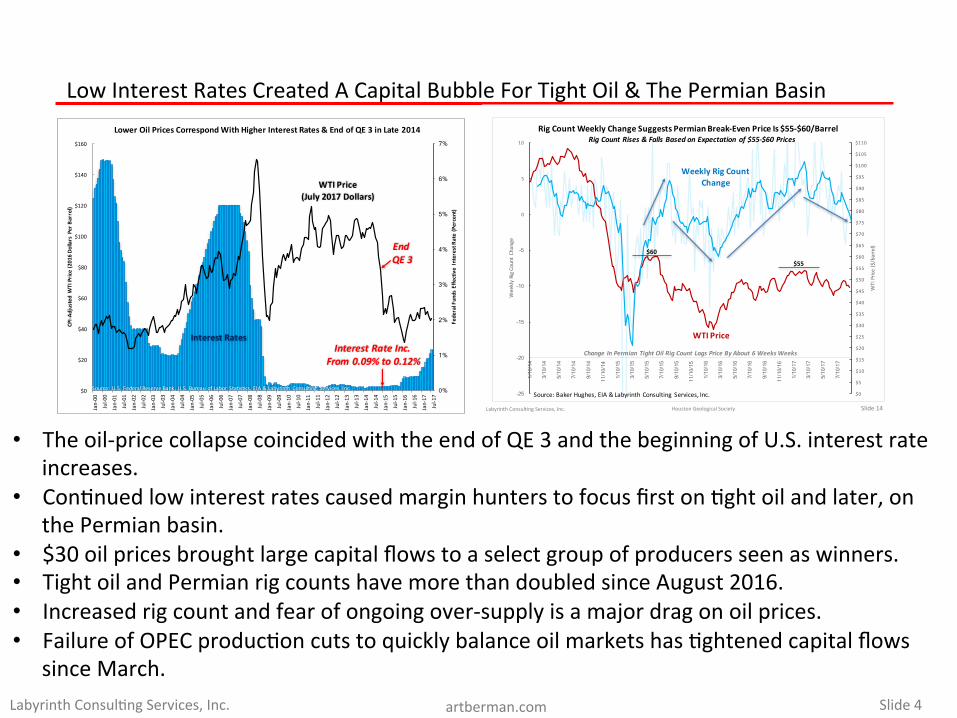
LowInterestRatesCreatedACapitalBubbleForTightOil&ThePermianBasin
• Theoil-pricecollapsecoincidedwiththeendofQE3andthebeginningofU.S.interestrateincreases.
• Con4nuedlowinterestratescausedmarginhunterstofocusfirston4ghtoilandlater,onthePermianbasin.
• $30oilpricesbroughtlargecapitalflowstoaselectgroupofproducersseenaswinners.• TightoilandPermianrigcountshavemorethandoubledsinceAugust2016.• Increasedrigcountandfearofongoingover-supplyisamajordragonoilprices.• FailureofOPECproduc4oncutstoquicklybalanceoilmarketshas4ghtenedcapitalflows
sinceMarch.
0%
1%
2%
3%
4%
5%
6%
7%
$0
$20
$40
$60
$80
$100
$120
$140
$160
Jan-00
Jul-00
Jan-01
Jul-01
Jan-02
Jul-02
Jan-03
Jul-03
Jan-04
Jul-04
Jan-05
Jul-05
Jan-06
Jul-06
Jan-07
Jul-07
Jan-08
Jul-08
Jan-09
Jul-09
Jan-10
Jul-10
Jan-11
Jul-11
Jan-12
Jul-12
Jan-13
Jul-13
Jan-14
Jul-14
Jan-15
Jul-15
Jan-16
Jul-16
Jan-17
Jul-17
FederalFundsEffe
ctiveInterestRate(Percent)
CPI-A
djustedWTIPrice(2016Do
llarsPerBarrel)
LowerOilPricesCorrespondWithHigherInterestRates&EndofQE3inLate2014
WTIPrice(July2017Dollars)
InterestRatesInterestRate Inc.
From0.09%to0.12%
EndQE3
Source:U.S.FederalReserve Bank,U.S.BureauofLabor Statistics,EIA&Labyrinth Consulting Services,Inc.
Slide14LabyrinthConsultingServices,Inc. HoustonGeologicalSociety
$0
$5
$10
$15
$20
$25
$30
$35
$40
$45
$50
$55
$60
$65
$70
$75
$80
$85
$90
$95
$100
$105
$110
-25
-20
-15
-10
-5
0
5
10
1/10/1
4
3/10/1
4
5/10/1
4
7/10/1
4
9/10/1
4
11/10
/14
1/10/1
5
3/10/1
5
5/10/1
5
7/10/1
5
9/10/1
5
11/10
/15
1/10/1
6
3/10/1
6
5/10/1
6
7/10/1
6
9/10/1
6
11/10
/16
1/10/1
7
3/10/1
7
5/10/1
7
7/10/1
7
WTIPrice($/barrel)
WeeklyRigCountChange
RigCountWeeklyChangeSuggestsPermianBreak-EvenPriceIs$55-$60/Barrel
$55
$60
Source:BakerHughes,EIA&LabyrinthConsultingServices,Inc.
Weekly RigCountChange
WTIPrice
Change InPermianTightOilRigCountLagsPriceByAbout6WeeksWeeks
RigCountRises&FallsBasedonExpectationof$55-$60Prices

Slide5LabyrinthConsul4ngServices,Inc. artberman.com
TheFalsePremisethatTightOilPlaysAretheNewSwingProducer:the“CallonShale”
• WidespreadbeliefthatU.S.shaleproduc4oncontrolsworldproduc4onsurplus—resultsinover-emphasisonU.S.rigcountasaleadingindicator.
• The“callonshale”thesis:just-in-4menatureofshalesupplymeansthatproduc4oncanstart&stopquicklybasedonpriceandinventorysignals.
• ImpliesthatU.S.shaleisthenewswingproduceroftheworldeffec4velyreplacingOPEC.• Beingaswingproducermeansthatthereissufficientsparecapacitytoturnonandoffbasedonmarket
signals.• The“callonshale”isaridiculousidea:thevolumeofshaleproduc4onchangecannotbecorrelatedtooilprice
orinventoriesaspromotersclaim.• Shaleoutputreactstopricejustlikeallplays—slowly&inlong-periodcycles.• Shaleplayshavenosparecapacity—theyarejust-in-4me.• Shaleproducerscannotevencontroloutputbecausetheyareconstrainedbycomple4oncrewsandcapital.• DUCsarenotsparecapacitybecausetheyarenotreadytoproduce.
$0
$20
$40
$60
$80
$100
$120
$140
$160
0.0
0.5
1.0
1.5
2.0
2.5
3.0
3.5
4.0
4.5
Jan-03
Jun-03
Nov-03
Apr-04
Sep-04
Feb-05
Jul-05
Dec-05
May-06
Oct-06
Mar-07
Aug-07
Jan-08
Jun-08
Nov-08
Apr-09
Sep-09
Feb-10
Jul-10
Dec-10
May-11
Oct-11
Mar-12
Aug-12
Jan-13
Jun-13
Nov-13
Apr-14
Sep-14
Feb-15
Jul-15
Dec-15
May-16
Oct-16
Mar-17
WTIPrice($2017/barrel)
CrudeOil+CondensateProduction(m
mb/d)
The"CallonShale"ThesisisNotSupportedByPriceData
Permian
Bakken
Niobrara
EagleFord
GraniteWash
Miss.Lime
WTI(RHS)
Source:Drilling Info,EIA,LabyrinthConsulting Services,Inc.&Crude OilPeak700
750
800
850
900
950
1,000
1,050
1,100
1,150
1,200
0.0
0.5
1.0
1.5
2.0
2.5
3.0
3.5
4.0
4.5
Jan-03
Jun-03
Nov-03
Apr-04
Sep-04
Feb-05
Jul-0
5 Dec-05
May-06
Oct-06
Mar-07
Aug-07
Jan-08
Jun-08
Nov-08
Apr-09
Sep-09
Feb-10
Jul-1
0 Dec-10
May-11
Oct-11
Mar-12
Aug-12
Jan-13
Jun-13
Nov-13
Apr-14
Sep-14
Feb-15
Jul-1
5 Dec-15
May-16
Oct-16
Mar-17
CrudeOil+
RefinedProducts(m
mb)
CrudeOil+
CondensateProduction(m
mb/d)
The"CallonShale"ThesisisNotSupportedByInventoryData
Permian
Bakken
Niobrara
EagleFord
GraniteWash
Miss.Lime
Inventories(RHS)
Source:Drilling Info,EIA,LabyrinthConsulting Services,Inc.&Crude OilPeak

Slide6LabyrinthConsul4ngServices,Inc. artberman.com
Howisthe“CallonShale”ConsistentWithFlatU.S.OutputSincetheOPECCut?
• U.S.oiloutputhasbeenflatsincetheOPECproduc4oncutsandhigheroilprices.• 43%ofU.S.supplyis4ghtoil.• Whereisthesurgeinjust-in-4meproduc4onfromthecallonshale?
9.63
8.55
9.07 9.13
9.11 9.17
9.09 9.24
9.19 9.
69 10.09
$0
$20
$40
$60
$80
$100
$120
0.00
2.00
4.00
6.00
8.00
10.00
12.00
Jan-14
Feb-14
Mar-14
Apr-14
May-14
Jun-14
Jul-14
Aug-14
Sep-14
Oct-14
Nov-14
Dec-14
Jan-15
Feb-15
Mar-15
Apr-15
May-15
Jun-15
Jul-15
Aug-15
Sep-15
Oct-15
Nov-15
Dec-15
Jan-16
Feb-16
Mar-16
Apr-16
May-16
Jun-16
Jul-16
Aug-16
Sep-16
Oct-16
Nov-16
Dec-16
Jan-17
Feb-17
Mar-17
Apr-17
May-17
Jun-17
Jul-17
Aug-17
Sep-17
Oct-17
Nov-17
Dec-17
Jan-18
Feb-18
Mar-18
Apr-18
May-18
Jun-18
Jul-18
Aug-18
Sep-18
Oct-18
Nov-18
Dec-18
WTIPrice($/Barrel)
MillionsofB
arrelsofCrudeOilPerD
ay
U.S.OutputHasBeenFlatin2017
April
2015
Source: EIASTEOSept2017&Labyrinth Consulting Services,Inc.
-1.08mmb/d
OilProduction
(LHS)
WTIPrice(RHS)
Aug2
017
Dec2
017
Sept
2016
Dec2
018
+0.89mmb/dAug2017-Dec2018
mmb/d Apr-15 Sep-16 Jun-17 Jul-17 Aug-17 Dec-17 Dec-18Production 9.63 8.55 9.09 9.24 9.19 9.69 10.09Since Apr-15 0.00 -1.08 -0.53 -0.39 -0.43 0.07 0.46Since Sep-16 0.00 0.55 0.69 0.65 1.15 1.54Since Jun-17 0.00 0.15 0.10 0.60 1.00Since Jul-17 0.00 -0.04 0.45 0.85
0
1
2
3
4
5
6
7
8
9
10
Jan-00
Jun-00
Nov-00
Apr-01
Sep-01
Feb-02
Jul-0
2 Dec-02
May-03
Oct-03
Mar-04
Aug-04
Jan-05
Jun-05
Nov-05
Apr-06
Sep-06
Feb-07
Jul-0
7 Dec-07
May-08
Oct-08
Mar-09
Aug-09
Jan-10
Jun-10
Nov-10
Apr-11
Sep-11
Feb-12
Jul-1
2 Dec-12
May-13
Oct-13
Mar-14
Aug-14
Jan-15
Jun-15
Nov-15
Apr-16
Sep-16
Feb-17
OilP
roduction
(mmb/d)
43%ofU.S.ProductionisTightOil
ConventionalOil
TightOil
Source:Drilling Info,EIA,LabyrinthConsulting Services,Inc.&Crude OilPeak

Slide7LabyrinthConsul4ngServices,Inc. artberman.com
ShaleCostReduc4onsMostlyIndustryBust,ThresholdForGrowth>$50WTI
• Lowercostsofshaleproduc4onwidelyanributedtotechnologyandefficiency.• Costcostdefla4onwas90%becauseofadepressionintheoilindustry,10%technology.• Thatisoverfornowandpriceshaveincreased8%in2017.• Rigcountdataindicatesthatexpecta'onof$55-$60isnecessaryfordrillinggrowth.• Drillingdoesnottranslateintoproduc4onbecauseofOFSlimita4ons.• Shalegrowthhasmoretodowithinvestormoneythanbreak-evenprices.• Investorsneedtobelievethatsignificantlyhigherpricesarecoming.• WTIisnotthepricethatproducersget.Discountis$5to$15/barrel.• CurrentBakkenwellheadpriceis$35.83butWTIis$50.00.
0
0.2
0.4
0.6
0.8
1
Dec-85
Sep-86
Jun-87
Mar-88
Dec-88
Sep-89
Jun-90
Mar-91
Dec-91
Sep-92
Jun-93
Mar-94
Dec-94
Sep-95
Jun-96
Mar-97
Dec-97
Sep-98
Jun-99
Mar-00
Dec-00
Sep-01
Jun-02
Mar-03
Dec-03
Sep-04
Jun-05
Mar-06
Dec-06
Sep-07
Jun-08
Mar-09
Dec-09
Sep-10
Jun-11
Mar-12
Dec-12
Sep-13
Jun-14
Mar-15
Dec-15
Sep-16
Jun-17
Norm
alize
dWTI&ProducerPrice
Index
TheCostofDrillingOilandGasWellsFell45%AfterTheOil-PriceCollapse;CostsHaveIncreased8%SinceJanuary2017
Source:U.S.Federal ReserveBank,EIA&LabyrinthConsulting Services,Inc.
WTIPrice
OIl&GasWell DrillingProducer PriceIndex
Source:U.S.Federal ReserveBank,EIA&LabyrinthConsulting Services,Inc.
4-FoldIncreaseinO&GPPI Because of
UnconventionalOil&Gas2004-2014 45
%Decrease
$20
$25
$30
$35
$40
$45
$50
$55
$60
$65
$70
$75
$80
$85
$90
$95
$100
$105
$110
$115
-70
-60
-50
-40
-30
-20
-10
0
10
20
30
Jan-14
Feb-14
Mar-14
Apr-14
May-14
Jun-14
Jul-1
4 Au
g-14
Sep-14
Oct-14
Nov-14
Dec-14
Jan-15
Feb-15
Mar-15
Apr-15
May-15
Jun-15
Jul-1
5 Au
g-15
Sep-15
Oct-15
Nov-15
Dec-15
Jan-16
Feb-16
Mar-16
Apr-16
May-16
Jun-16
Jul-1
6 Au
g-16
Sep-16
Oct-16
Nov-16
Dec-16
Jan-17
Feb-17
Mar-17
Apr-17
May-17
Jun-17
Jul-1
7 Au
g-17
Sep-17
WTIPrice($/Barrel)
TightO
ilHR
ZRigCountC
hange
TightOilRigCountsFallWhenExpectationsof$55-$60OilPricesFade
TightOilRigCount4-weekmovingaverage(LHS)
WTIPrice12-weekmovingaverage(RHS)
Source:BakerHughes,EIA&LabyrinthConsultingServices,Inc.
$60
$54
Change InHorizontal TightOilRigCount LagsPriceByAbout 8Weeks

Slide8LabyrinthConsul4ngServices,Inc. artberman.com
Compara4veInventoryRemainsTheMostUsefulIndicatorofFuturePriceTrens
$0
$5
$10
$15
$20
$25
$30
$35
$40
$45
$50
$55
$60
$65
$70
$75
$80
$85
$90
$95
$100
$105
$110
$115
-50 -40 -30 -20 -10 0 10 20 30 40 50 60 70 80 90 100 110 120 130 140 150 160 170 180 190 200 210 220 230 240 250
MostLikelyDecember2017C.I.Range40-75mmb$50-$56/barrelC.I.Decreased-3.5mmbThisWeek
Comparative Inventory (C.I.)Millionsof Barrels
WTIPrice($/barrel)
Source:EIA&La
byrinthConsultingServices,Inc.
$40
$55
Mar-June 2015Optimism
2014-2017Data Mid-cycle
price
Late 2015-Early2016Pessimisim(Cushing >
80%Capacity)
OPEC ProductionCutOptimism
Last Week
Most-LikelyDec.2017C.I.Range40-75mmb
$50-$56/barrel
Mid-FebSept15
$0
$20
$40
$60
$80
$100
$120
800
850
900
950
1,000
1,050
1,100
1,150
1,200
1/1/10 1/1/11 1/1/12 1/1/13 1/1/14 1/1/15 1/1/16 1/1/17
WTIPrice($/barrel)
IvnetoriesofCrudeOil+Products(m
mb)
InventoriesHaveFallenFromRecordLevels--ComparativeInventory,TheDifferenceBetweenInventories&The5-YearAverage,RemainsNearRecordPre-2015Levels
Source:EIA &LabyrinthConsulting Services,Inc.
5-YearInventoryAverage(LHS)
WTIPrice(RHS)
Inventories(LHS)
99mmbGap
97mmbGap
RecordInventoryLevel
• Compara4veinventory(C.I.)isthekeytounderstandingoilpricesandpoten4alfuturetrends.• TheoilpricecollapseresultedinthelargestincreaseininventoriesandC.I.onrecord.• C.I.hasfallen116mmbsincemid-Februarybutthegapbetweeninventories&the5-yearaverageis
s4llverylarge.• FlatyieldcurveofWTIvsC.I.—largedecreasesinC.I.donotcreatemeaningfulpriceincreases.• Most-likelyrangeofC.I.indicatespossibleyear-endWTIpricerangeof$50to$56/barrel.• ThisassumesthatC.I.willfall3.75mmb/week,theaverageforthelast30weeks.• Obviously,thismustbemonitoredforchangesthatwouldpoten4allyresultinhigherorloweryear-
endprices.

Slide9LabyrinthConsul4ngServices,Inc. artberman.com
StrongRefinedProductDemand&LowerNetImportsDriveInventoryReduc4ons
-100
-50
0
50
100
150
200
250
300
18.0
18.5
19.0
19.5
20.0
20.5
21.0
21.5
22.0
22.5
1/3/14
3/3/14
5/3/14
7/3/14
9/3/14
11/3/
14
1/3/15
3/3/15
5/3/15
7/3/15
9/3/15
11/3/
15
1/3/16
3/3/16
5/3/16
7/3/16
9/3/16
11/3/
16
1/3/17
3/3/17
5/3/17
7/3/17
9/3/17
CrudeOil+
RefinedProductsComparativeInventory(m
mb)
Csonum
ption(ProductSupplied)(m
mb/d)
2017AverageConsumptionAtRecordLevelsFellAfterGulfHurricanesButRecoveredAboveYTDAvgThisWeek
Consumption(LHS)
ComparativeInventory(RHS)
Source:EIA &LabyrinthConsulting Services,Inc.
4-WeekAvg
AnnualAvg
0
50
100
150
200
250
300
-4.5
-4
-3.5
-3
-2.5
-2
-1.5
-1
-0.5
0
1/1/16
1/1
5/16
1/29/1
6 2/1
2/16
2/26/1
6 3/1
1/16
3/25/1
6 4/8
/16
4/22/1
6 5/6
/16
5/20/1
6 6/3
/16
6/17/1
6 7/1
/16
7/15/1
6 7/2
9/16
8/12/1
6 8/2
6/16
9/9/16
9/2
3/16
10/7/
16
10/21
/16
11/4/
16
11/18
/16
12/2/
16
12/16
/16
12/30
/16
1/13/1
7 1/2
7/17
2/10/1
7 2/2
4/17
3/10/1
7 3/2
4/17
4/7/17
4/2
1/17
5/5/17
5/1
9/17
6/2/17
6/1
6/17
6/30/1
7 7/1
4/17
7/28/1
7 8/1
1/17
8/25/1
7 9/8
/17
CrudeOIl+ProductsCom
parativeInventories(m
mb)
NetP
etroleum
ProductImports(m
mb/d)
~4.2mmb/week(600kb/d)DecreaseinNetPetroleumProductImportsAccountForMostInventoryReductionsin2017
ComparativeInventory-113mmb
(RHS)
NetImportsAnnual Avg(LHS)
NetProductImports&Trendline
(LHS)
-2.0mmb/d
-2.5mmb/d
Source:EIA &LabyrinthConsulting Services,Inc.
ComparativeInventoriesHaveFallen116mmbSinceMid-February
FEB10
SEPT8
Netimportsincreased1.7mmb/dbecauseofHurricaneHarvey
NetimportsdecreasedtoYTD avg3rdweekafterHarvey
• Strongrefinedproductdemandandreducednetproductimportsaredrivinginventoryreduc4on.• 2017YTDconsump4onisatrecordlevels.• ItfellaTerthehurricanesbuthasrecoveredtoabovetheYTDaveragethisweek.• Netrefinedproductimportshavefallen600kbpd(4.2mmb/week)in2017.• Lowernetcrudeimports,andfallinggasolineanddis4llatestocksarethekeycomponents.

Slide10LabyrinthConsul4ngServices,Inc. artberman.com
HowEffec4veisOPEC-NOPECComplianceWithProduc4onCuts?
• LibyaandNigeriaarechiefOPECover-producers.• SaudiArabiahasalsoincreasedproduc4onsinceQ12017.• MaximumOPEC-NOPECproduc4oncutswereinMarchandApril2017.• Augustoutputwas1.3mmb/dlessthaninNovember2016vs.sanc4onedcutsof1.8mmb/d.
51
51.5
52
52.5
53
53.5
54
Nov-16 Dec-16 Jan-17 Feb-17 Mar-17 Apr-17 May-17 Jun-17 Jul-17 Aug-17
Increm
entalLiquidsProduction(m
mb/d)
MostRecentOPEC-NOPECIncreasesFromNigeria,Libya&SaudiArabia
Angola,Gabon,Algeria,Ecuador
Libya
Nigeria
UAE SaudiArabia
Kuwait
Base
Russia
Mexico
Source:EIASeptSTEO,EIAInternationalData&LabyrinthConsulting Services,Inc.
IraqVenezuela
Qatar
Iran
0.00
-0.27
-1.56
-1.72
-2.25 -2.21
-1.72
-1.41
-1.07
-1.28
50
50.5
51
51.5
52
52.5
53
53.5
54
54.5
-2.6
-2.4
-2.2
-2
-1.8
-1.6
-1.4
-1.2
-1
-0.8
-0.6
-0.4
-0.2
0
Nov-16
Dec-16
Jan-17
Feb-17
Mar-17
Apr-17
May-17
Jun-17
Jul-1
7
Aug-17
LiquidsProduction(m
mb/d)
LiquidsProductionComparedWithNovem
ber2
016(m
mb/d)
OPEC-NOPECOnlyinComplianceWithProductionCutsInMarch&April2017
Source:EIASeptSTEO,EIAInternationalData&Labyrinth Consulting Services,Inc.
-1.8mmb/dThreshold

Slide11LabyrinthConsul4ngServices,Inc. artberman.com
OilFuturesHaveMovedIntoBackwarda4oninSeptember
• WTIhasmovedintofullbackwarda4onasoflastweek.• Brenthasalsomovedintobackwarda4on.• Thissignalsapercep4onofsupply4ghteningthatfavorssellingoilratherthanstoringit.
$44
$45
$46
$47
$48
$49
$50
$51
$52
$53
$54
Oct-17
Dec-17
Feb-18
Ap
r-18
Jun-18
Au
g-18
Oct-18
Dec-18
Feb-19
Ap
r-19
Jun-19
Au
g-19
Oct-19
Dec-19
Feb-20
Ap
r-20
Jun-20
Au
g-20
Oct-20
Dec-20
Feb-21
Ap
r-21
Jun-21
Au
g-21
Oct-21
Dec-21
Feb-22
Ap
r-22
Jun-22
Au
g-22
Oct-22
Dec-22
WTIFuturesPrice($/barrel)
WTIFuturesHaveMovedToBackwardationinSeptemberSignalingIncreasedSupplyTightening
Source:CME& LabyrinthConsultingServices,Inc.
Sept15
Sept20
Sept5
Sept26
$49
$50
$51
$52
$53
$54
$55
$56
$57
$58
$59
$60
Nov-17
Jan-18
Mar-18
May-18
Jul-1
8 Sep-18
Nov-18
Jan-19
Mar-19
May-19
Jul-1
9 Sep-19
Nov-19
Jan-20
Mar-20
May-20
Jul-2
0 Sep-20
Nov-20
Jan-21
Mar-21
May-21
Jul-2
1 Sep-21
Nov-21
Jan-22
Mar-22
May-22
Jul-2
2 Sep-22
Nov-22
Jan-23
Mar-23
May-23
Jul-2
3 Sep-23
Nov-23
Jan-24
Mar-24
May-24
Jul-2
4 Sep-24
Nov-24
BrentFuturesPrice
($/barrel)
BrentFuturesHaveAlsoMovedIntoBackwardation
Sept15
Sept20
Sept5
Source:CME& LabyrinthConsultingServices,Inc.
Sept26

Slide12LabyrinthConsul4ngServices,Inc. artberman.com
ReserveEs4mateUsing201610-KSECFilings(AnnualReports)
• EIA2015provedreserves:5billionbarrelsBakken,4.3bbEagleFord,0.8bbPermian.• Permianseemslow.• Es4mated~3.7billionbarrelsofprovedPermian4ghtoilreservesusing201610-KSECfilings
ofleadingoperatorsintheplays.• Allthecompaniesinthetabledifferen4atedPermianreservesfromothercompanyreserves.• Thosecompaniesaccountedfor47%ofall4ghtoilproduc4onin2016.Usedthatasascaling
factortoes4matethecontribu4onofcompanieslikeAnadarko,Apache,EOGandOXYthatdidnotseparatePermianfromothercompanyreservesintheir10-Kfilings.
• Thees4mateisfoundedonareliablebaseof1.7billionbarrelsfromcompanyfilings.Theassump4onthatundifferen4atedcompanyreserveswillfollow2016produc4onra4osisreasonablebutuncertain.
Permian2016ProvedOilReserves(kbo)
2016TightOilProduction(kbo)
PCTOFTotal2016Production
CONCHO 321,026 37,315 9.3%PIONEER 283,647 45,538 11.3%ENERGEN 199,575 10,468 2.6%LAREDO 167,100 9,146 2.3%RSPPERMIAN 164,700 11,040 2.7%DIAMONDBACK 139,174 14,892 3.7%PARSLEY 136,536 11,763 2.9%EP 81,800 3,973 1.0%DEVON 81,000 16,211 4.0%CIMAREX 74,300 17,920 4.5%CALLON 71,145 8,509 2.1%SUBTOTAL 1,720,003 186,776 47%TOTAL 3,696,999 401,459 100%
millionbarrels2014 2014 2015 2015
Production Reserves Production ReservesWilliston Bakken ND,MT,SD 387 5,972 421 5,030WesternGulf EagleFord TX 497 5,172 565 4,295Permian BoneSpring,Wolfcamp NM,TX 53 722 66 782Denver Niobrara* CO,KS,NE,WY 42 512 58 460Appalachian Marcellus* PA,WV 13 232 16 143FortWorth Barnett TX 9 47 5 33Sub-total 1,001 12,657 1,131 10,743Othertight 56 708 83 859U.S.tightoil 1,057 13,365 1,214 11,602
Basin Play State(s)
Table2.CrudeoilproductionandprovedreservesfromselectedU.S.tightplays,2014-15

Slide13LabyrinthConsul4ngServices,Inc. artberman.com
ShalePlays&SweetSpots($40CommercialAreas)
• Allthreeplayshaveconsiderablecommercialareasat$40wellheadprices.• BoneSpringcommercialareaisalmosttwiceaslargeasBakkenorEagleFord.• BoneSpringhas1/3thewelldensityoftheBakkenorEagleFord.• BoneSpringandEagleFordhavelowerbreak-evenEURthanBakken.• HigherearlyratesandlowerwellcostslargelyaccountforadvantagestoBoneSpringandEagleFord.

Slide14LabyrinthConsul4ngServices,Inc. artberman.com
TightOilProduc4onForecast
• Permianproduc4onshouldcon4nuetoincreaseintothemid-2020s.• EagleFordandBakkenwillprobablynotreach2015peakproduc4onlevels.• BakkenshoulddeclinemorethanEagleFord.
0
0.1
0.2
0.3
0.4
0.5
0.6
0.7
0.8
0.9
1
1.1
1.2
1.3
1.4
1.5
1.6
1.7
1.8
1.9
2
2.1
2.2
2010 2011 2012 2013 2014 2015 2016 2017 2018 2019 2020 2021 2022 2023 2024 2025 2026 2027 2028 2029
CrudeOil+
CondensateProduction(m
mb/d)
TightOilProductionForecast
Permian
EagleFord
Source:EIA&LabyrinthConsultingServices,Inc.
Bakken

Slide15LabyrinthConsul4ngServices,Inc. artberman.com
BakkenEUR,Gas-OilRa4os&WaterCutTrends
0
100
200
300
400
500
600
1 2 3 4 5 6 7 8 9 101112131415161718192021222324252627282930313233343536373839404142434445464748495051525354555657585960
OilP
roduction
(BarrelsofOilP
erDay)
MonthsofProduction
OilProductionDeclineRatesForRecentYearsAreGreaterThanForPreviousYearsForTop8BakkenProducers
2016
20152014
2013 2012
2016Declining FasterThanAllPreviousYearsDespiteHigherInitialRates
2015Declining FasterThanPreviousYears2014Declining FasterThanPreviousYears
Source:DrillingInfo& LabyrinthConsultingServices,Inc.
20%
25%
30%
35%
40%
45%
50%
55%
60%
1 2 3 4 5 6 7 8 9 10111213141516171819202122232425262728293031323334353637383940414243444546474849505152535455565758
PercentWater
MonthsofProduction
WaterCutIncreasedInTheLast3YearsForTop8BakkenProducers
2016 2015 2014
2013
2012
Source:DrillingInfo& LabyrinthConsultingServices,Inc.0
500
1,000
1,500
2,000
2,500
1 2 3 4 5 6 7 8 9 101112131415161718192021222324252627282930313233343536373839404142434445464748495051525354555657585960
Gas-OilRatio(CubicFeetPerBarrel)
MonthsofProduction
Gas-OilRatioIncreasesEveryYearForTop8BakkenProducers
2016
2015
2014 2013
2012
Source:DrillingInfo& LabyrinthConsultingServices,Inc.
• EURdecreased&declineratesincreasedforwellswith1stproduc4onaTer2013.• Gas-oilra4osincreased&thendecreased.• Watercutsincreasedforallwellswith1stproduc4onaTer2013.• Thesetrendssuggestdeple4onandthattheplayhasbeenover-drilled—notconclusivewithoutpressuredata.• Pioneer’sPermianbasinGORhasincreased28%sinceNovember2016.
0
500
1,000
1,500
2,000
2,500
1/1/12
3/1
/12
5/1/12
7/1
/12
9/1/12
11
/1/12
1/1
/13
3/1/13
5/1
/13
7/1/13
9/1
/13
11/1/
13
1/1/14
3/1
/14
5/1/14
7/1
/14
9/1/14
11
/1/14
1/1
/15
3/1/15
5/1
/15
7/1/15
9/1
/15
11/1/
15
1/1/16
3/1
/16
5/1/16
7/1
/16
9/1/16
11
/1/16
1/1
/17
3/1/17
5/1
/17
7/1/17
Gas-OilRatio(cubicfeet/barrel)
Pioneer'sPermianBasinGas-OilRatioHasIncreased28%SinceNovember2016
Source:DrillingInfo &LabyrinthConsultingServices,Inc.

Slide16LabyrinthConsul4ngServices,Inc. artberman.com
TightOilIsAMarginalBusinessAtBest
6.5
3.6
2.4
1.8 1.7 1.6 1.5 1.5 1.5 1.51.2 1.1 1.1 1.0 1.0 1.0
0.8 0.7 0.7 0.7 0.70.6 0.5
0
1
2
3
4
5
6
7
Parsley
Sanchez
Energen
Whitin
g
Hess
Carrizo
Laredo
Callon
Pion
eer
EPE
Oasis
New
field
Concho
EOG
Continental
Apache
Diamon
dback
Oxy
Chevron
Murph
y
Maratho
n
Cono
co
Statoil
FirstH
alf2
017RatioofC
apitalExpenditurestoCashFrom
Operations
TightOilIsaMarginalBusinessAtBestMostCompanies LoseMoneyorBreakEven
OnlyIntegratedCompanies&DiamondbackMadeMoneyin2017
MakeMoneyBreakEven
Lose Money
Source:GoogleFinance&LabyrinthConsultingServices,Inc.
• Despiteclaimsofever-decreasingcostsandbreak-evenprices,companybalancesheetsandincomestatementsdonotreflectprofitabilityformostpure4ghtoilplayers.
• Amongkey4ghtoil-weightedcompanies,mostlosemoney.• Afewbreakeven.• Onlyintegratedcompanieswithdiversifiedporwoliosoutsideof4ghtoilplays(e.g.,Chevron,ConocoPhilips,
Statoil,Oxy)makemoney.• Diamondbackistheonlypure4ghtoilplayerthatmademoneyin2017.• Thedisparitybetweenbreak-evenandIRRclaims,andcorporatefinancialdata:
Ø Selec4vedatainclaimsvs.averagewellEURandcosts.Ø Exclusionofmanycostsinclaimsthatarepartofthecostofdoingbusiness.Ø Misleadingemphasisonproduc4oncostsvsfullcosts.

Slide17LabyrinthConsul4ngServices,Inc. artberman.com
30
35
40
45
50
55
60
100105110115120125130135140145150
12-Sep-16
12-Oct-16
12-Nov-16
12-Dec-16
12-Jan-17
12-Feb-17
12-M
ar-17
12-Apr-17
12-M
ay-17
12-Jun
-17
12-Jul-17
12-Aug-17
Concho
Close WTI
30
35
40
45
50
55
60
120130140150160170180190200210
12-Sep-16
12-Oct-16
12-Nov-16
12-Dec-16
12-Ja
n-17
12-Feb-17
12-M
ar-17
12-Apr-17
12-M
ay-17
12-Ju
n-17
12-Ju
l-17
12-Aug-17
Pioneer
Close WTI
9/9/17, 6(51 PMEnergy Shares Set for Worst Month Since 2015 - WSJ
Page 2 of 4https://www.wsj.com/articles/energy-shares-set-for-worst-month-since-2015-1503846001?mg=prod/accounts-wsj
rise, bolstered by an agreement by the Organization of the PetroleumExporting Countries and other major producers to curb output.
But such shares lost much of their appeal this year when oil pricesstarted to fall again, even as earnings have generally improved off
a low base. U.S. crude prices are down 11% this year and arelanguishing below $50 a barrel.
About $2.7 billion has flowed out of energy-focused stock funds for theyear through July, according to data from Morningstar, after roughly$5.8 billion flowed in last year.
Analysts and investors pointed to quarterly reports from companiesincluding Pioneer Natural Resources Co. as key contributors to thesector’s sagging stock prices this month.
Some companies talked about not hitting production levels, which“spooked a lot of investors,” said Terry Simpson, a multiassetinvestment strategist at BlackRock.
Pioneer cut its production-growth guidance after running into drillingproblems that caused delays. Shares of Pioneer fell 11% Aug. 2, eventhough it reported a higher profit that beat analysts’ expectations.Pioneer is down 28% for the year, with most of that decline coming inAugust.
Investors are yanking money from energy funds after three years of inflows.Estimated net flows into and out of U.S. energy stock funds
THE WALL STREET JOURNALSource: MorningstarNote: All data are full-year except 2017, which is through July.
.billion
2012 ’13 ’14 ’15 ’16 ’17
-4
-2
0
2
4
6
8
$10
30
35
40
45
50
55
60
80
85
90
95
100
105
110
12-Sep-16
12-Oct-16
12-Nov-16
12-Dec-16
12-Jan-17
12-Feb-17
12-M
ar-17
12-Apr-17
12-M
ay-17
12-Jun
-17
12-Jul-17
12-Aug-17
Vanguard
Close WTI
EnergyStocksHaveSufferedin2017,PermianStocksMoreRecently
• Capitalflowsto4ghtoilhaveslowedin2017.• Sharepriceshavedeclinedasmarkets4reofmediocrefinancialreturns.• Con4nuedcapitalflowisthechieffactorin4ghtoilgrowth,notreservesoreconomics.

Slide18LabyrinthConsul4ngServices,Inc. artberman.com
TightOilandTheLong-TermDebtCycle
4835
0
50
100
150
200
250
300
350
Venezuela
Saud
iArabia
Canada Iran
Iraq
Russia
Kuwait
UAE
Libya
US
Nigeria
Kazakhstan
China
Qatar
Brazil
Algeria
Angola
Ecuado
r
Mexico
Norway
Azerbaijan
Oman
India
Vietnam
Australia
Malaysia
SouthSudan
Egypt
Perm
ian
BillionsofBarrelsofLiquids
TheU.S.MustDoubleReservesToBecomeanOil-DominantProducerEvenDoublingorTriplingPermianReservesNotNearlyEnough
BP EIA
UnitedStates So
urce:BP,EIA&LabyrinthConsultingServices,Inc.
PermianBasin
0%
20%
40%
60%
80%
100%
120%
$0
$20
$40
$60
$80
$100
$120
1960
1962
1964
1966
1968
1970
1972
1974
1976
1978
1980
1982
1984
1986
1988
1990
1992
1994
1996
1998
2000
2002
2004
2006
2008
2010
2012
2014
2016
U.S.PublicDebt-To-GDP
Percent
OilPriceinOctober2016Do
llars
HighOilPrices2005-2014PlusMassiveDebt&LowInterestRatesAfter2008
WTIPrice$2016(LHS)
Debt/GDP(RHS)
Source:U.S.FederalReserve Bank,U.S.Bureauof LaborStatiistics,WorldBank,EIA&LabyrinthConsultingServices,Inc.
LowOilPrices
HighOilPrices
HighOilPrices
IncreasingDebt-To-GDP
FallingOilPrices
CreditBubble
LedToMajorCreditBubble&TheShaleRevolution
• Shalerevolu4onmustbeputinperspec4ve.• Highoilprices2005-2104plusmassivedebt&lowinterestratesaTer2008createdacapitalbubblethatdrove
4ghtoildevelopmentandgrowth—muchofituneconomic!• Con4nuedavailabilityofexternalcapitalisthemostcri4calfactorforproduc4ongrowth&maintenance.• Thetruebreak-evenpricefor4ghtoilisnot<$50butiscloserto$60wellheadprice.• Tightoilplaysarenotthenewswingproduceroftheworld(i.e.,the“callonshale”).• Compara4veinventoryremainsthebestindicatoroffutureoilprices.• C.I.has4ghtenedinspiteofOPEC’smodestcompliancebutwillthiscon4nue?• Year-end2017WTIpricescouldbe$55butforwardcurvesareinbackwarda4on.• Permianplaysaregoodbutwillprobablycon4nuetodeliverlowreturnsandlowerproduc4ongrowththan
manyanalystspredict.• Enthusiasmfor4ghtoilinnova4onmustbebalancedbythedesirabilityofyearsofdepressedoilprices.