putting ecosystem services on the map taylor ricketts conservation science program, world wildlife...
Post on 21-Dec-2015
216 views
TRANSCRIPT

Putting ecosystem services
on the map
Taylor Ricketts
Conservation Science Program, World Wildlife Fund – U.S.

• 25 people• 10 PhDs• 11 Masters
• Plus• Interns• Students• Post-docs
Dual Roles1. Research
2. Advisors to WWF Programs
Conservation Science Program, WWF

Natural processes through which ecosystems sustain and fulfill human life.
Ecosystem Services
• Links nature to human welfare• New motivation, funding for conservation• Poorly understood

Year
1990
1995
2000
2005
Pap
ers
publ
ishe
d
0
50
100
150
200
250
"Ecosystem service*"
Growing attention

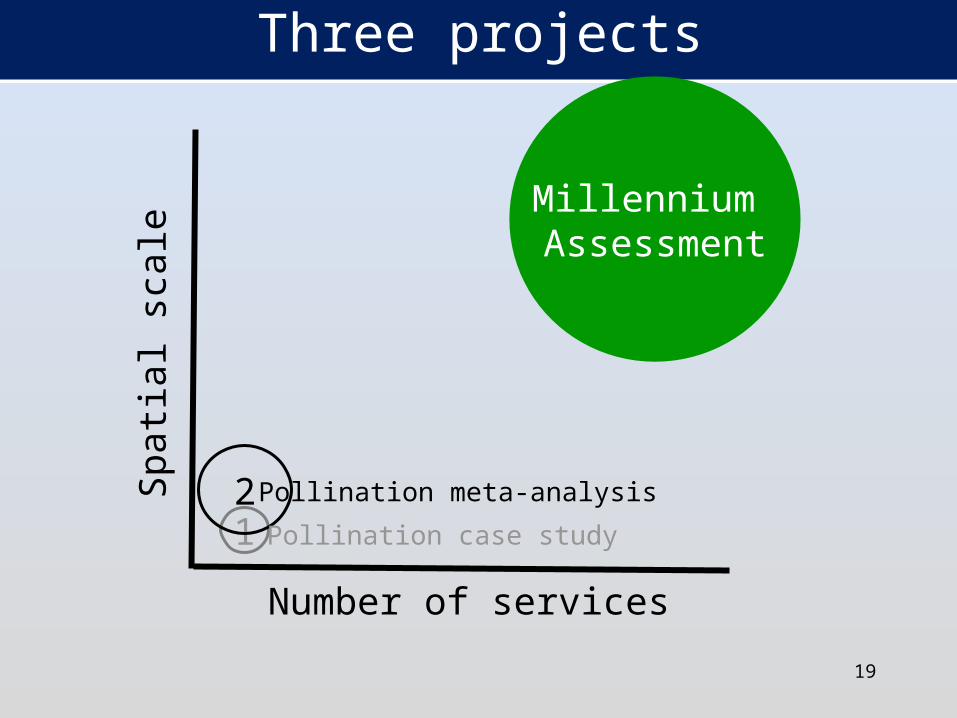
Three projects
Number of services
Spa
tial s
cale
Millennium Assessment
12
3
Pollination case study
Pollination meta-analysis
Natural Capital Project
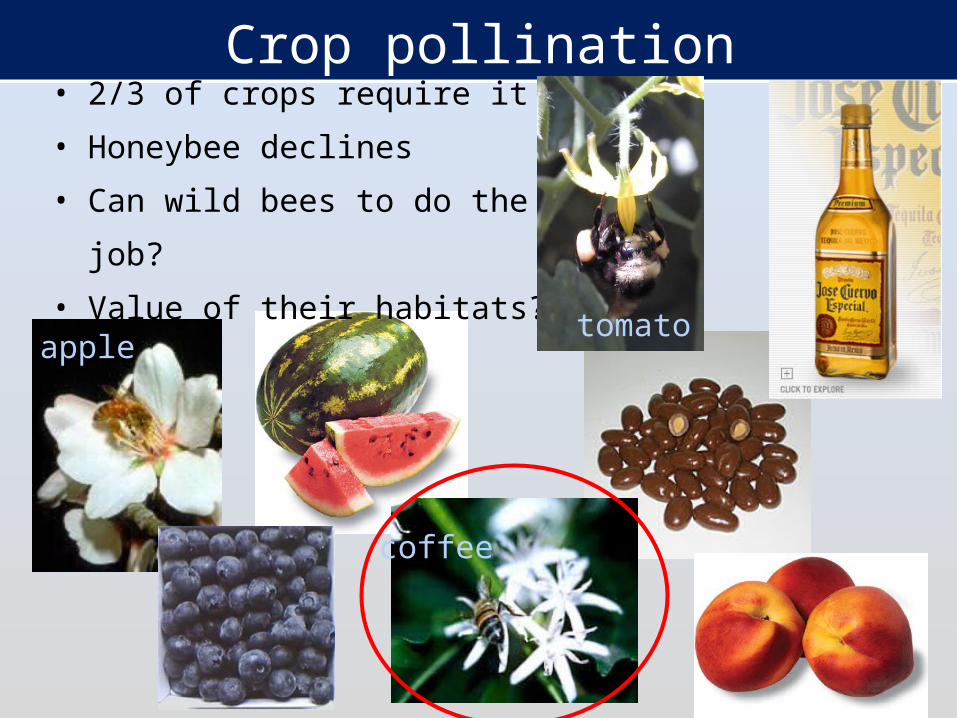
• 2/3 of crops require it
• Honeybee declines
• Can wild bees to do the job?
• Value of their habitats?
coffee
tomatoapple
Crop pollination

What is value of native habitats as sources of pollinators to surrounding crops?
1. Does pollinator activity decline with distance from native habitats?
2. Does this decline influence yields?
Questions

0 1 2 km
S
N
Near
Near
Med.
Med.
Far
Distance # sites
Near (<100m) 4
Mid (0.8 km) 4
Far (1.6 km) 4
Design

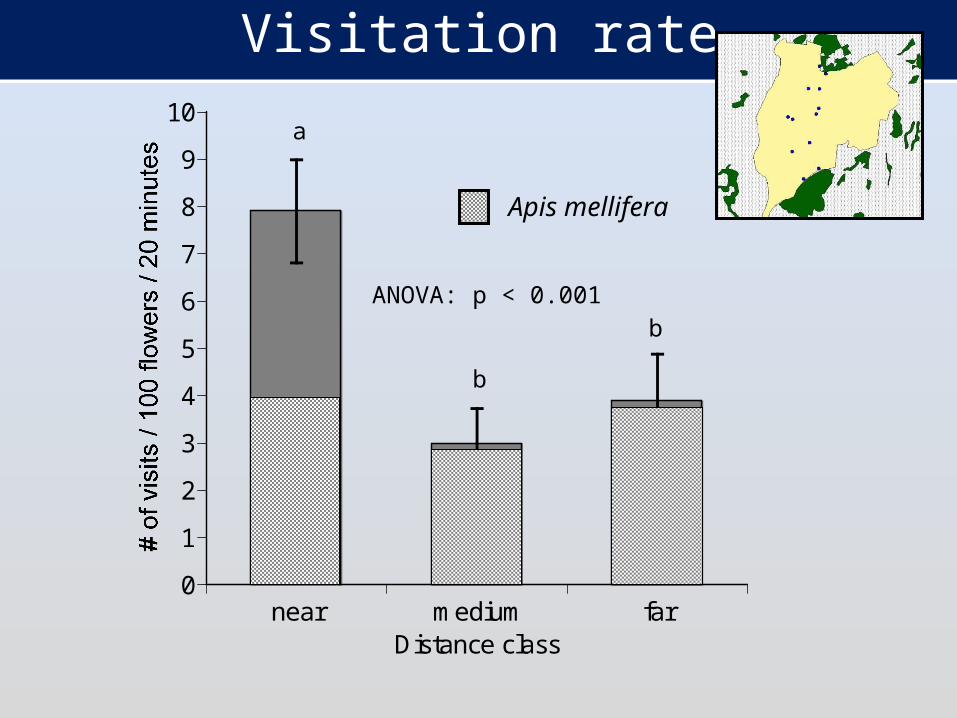
• Timed observations
• Diversity, visitation rate
Pollinator activity
near medium far0
1
2
3
4
5
6
7
8
9
10
Distance class
Visitation rate
ANOVA: p < 0.001
a
b
b
Apis mellifera
near medium far0
200
400
600
800
1000
1200
Distance class
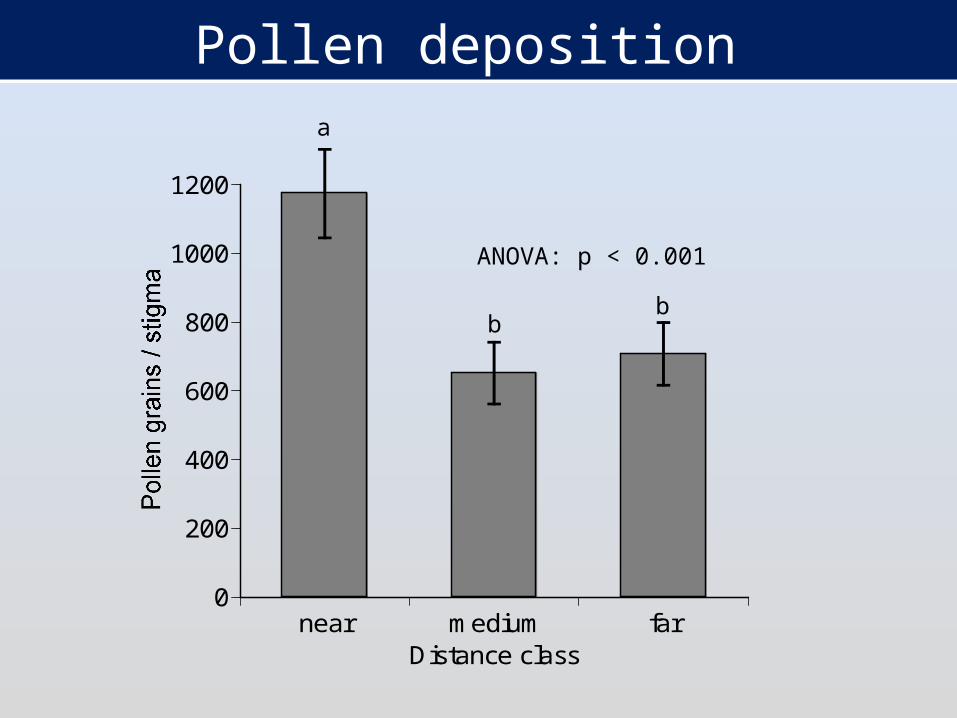
ANOVA: p < 0.001
Pollen depositiona
bb
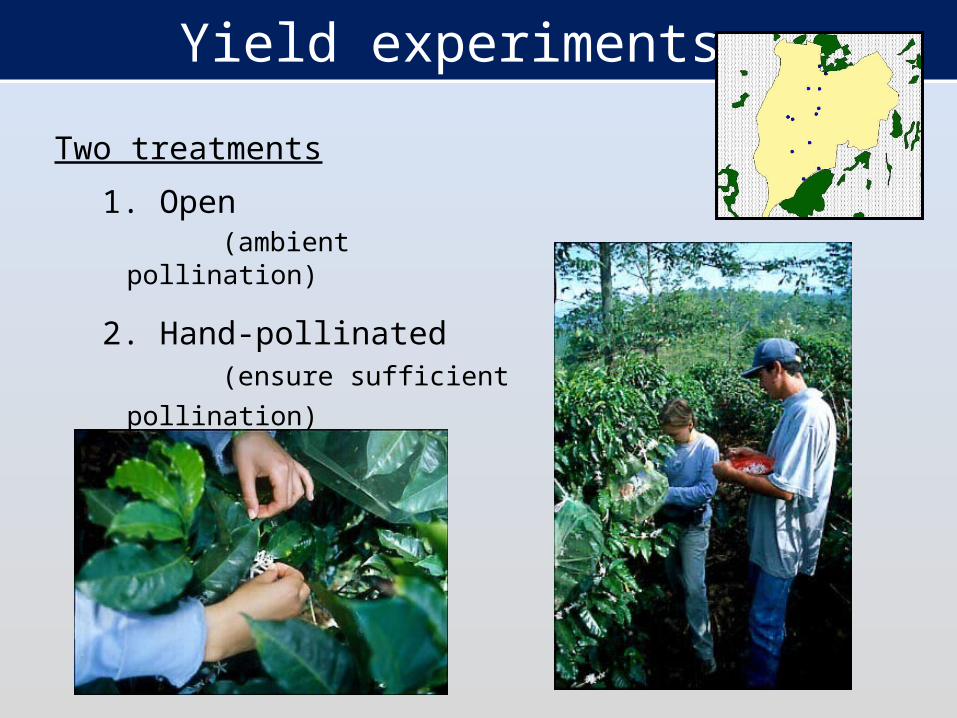
Yield experiments
Two treatments
1. Open(ambient pollination)
2. Hand-pollinated(ensure sufficient
pollination)

Question: are ambient pollination levels sufficient?
Possible results:
Experimental logic
Hand = OpenSufficient
Hand > OpenNot sufficient
Re
sid
ua
l s
ee
d m
as
s (
g)
-0.08
-0.06
-0.04
-0.02
0.00
0.02
0.04
0.06
0.08
Re
sid
ua
l s
ee
d m
as
s (
g)
-0.08
-0.06
-0.04
-0.02
0.00
0.02
0.04
0.06
0.08
Hand
Open
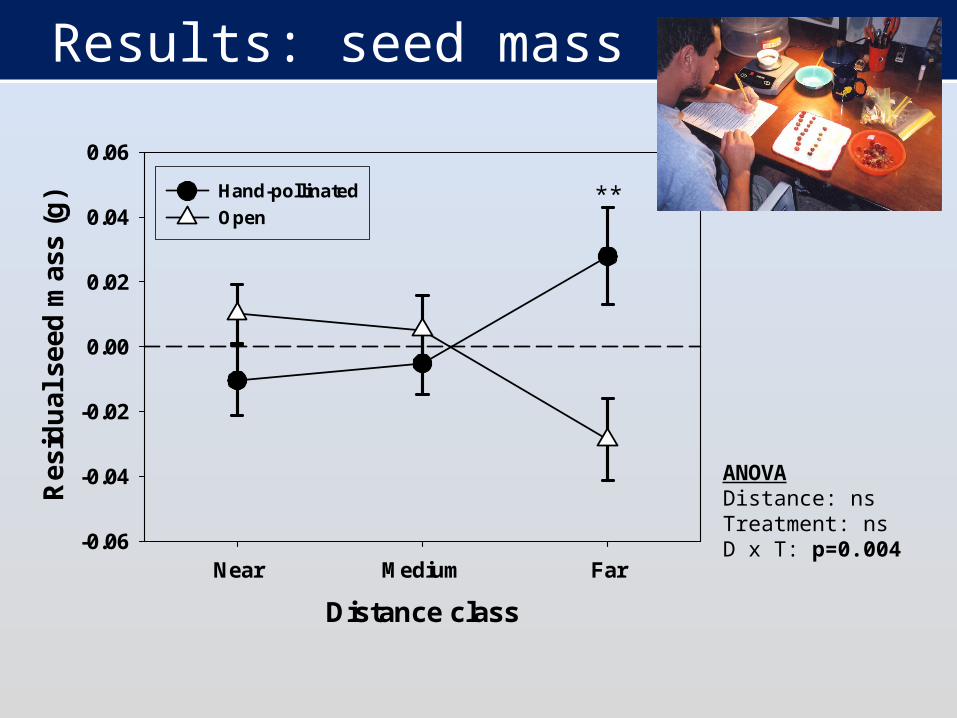
Results: seed mass
Distance class
Near Medium Far
Res
idu
al s
eed
mas
s (g
)
-0.06
-0.04
-0.02
0.00
0.02
0.04
0.06
Hand-pollinated
Open
ANOVADistance: nsTreatment: nsD x T: p=0.004
**

Questions:
1. Does pollinator activity decline with distance from forest?
• YES
• Ricketts, Cons Bio 2004
2. Does this decline influence coffee yields?
• YES
• ~20% decrease beyond 1km
• Ricketts et al., PNAS 2004
near medium far0
1
2
3
4
5
6
7
8
9
10
Distance class
Distance class
Near Medium Far
Res
idu
al s
eed
mas
s (g
)
-0.06
-0.04
-0.02
0.00
0.02
0.04
0.06
Hand-pollinated
Open

Value of pollination services
n
s
Numbers we need
• Forest effects 1 km
• Yield beyond 1km 17.8 fa*/ha
• Yield within 1km 21.5 fa/ha
• Net income $35/fa
* fanega = 200 liters
1.0 km
(far)
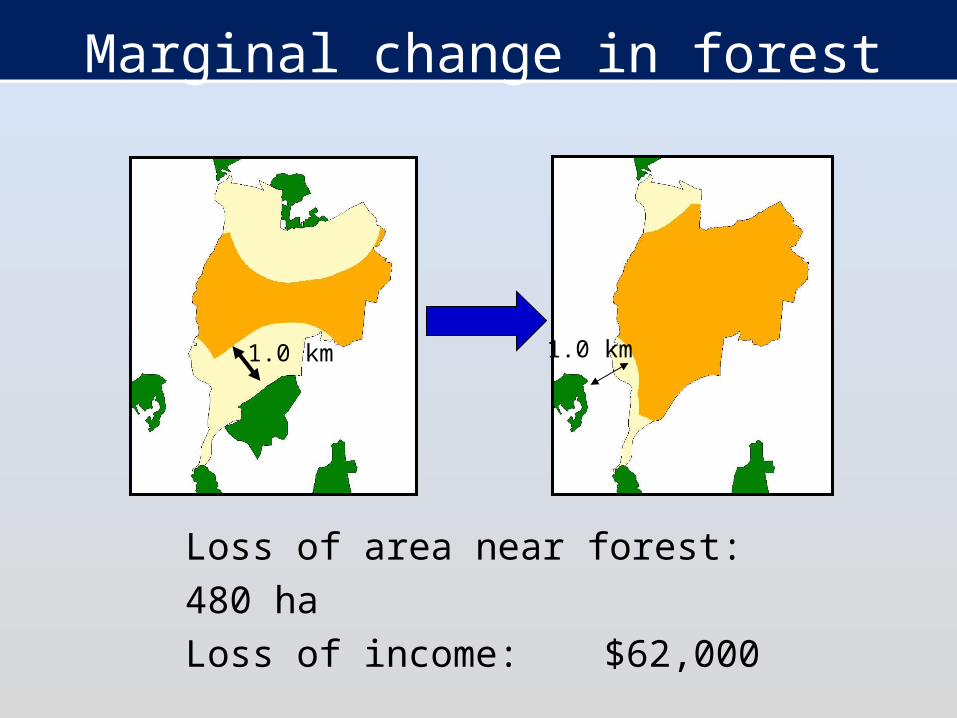
Marginal change in forest
1.0 km
Loss of area near forest: 480 ha
Loss of income: $62,000
1.0 km

Are forests undervalued?
Environmental Service Payments– Carbon sequestration– Hydrological services– Scenic beauty
– Biodiversity $42/ha/year
Pollination service value– $62,000 / 157 ha =
$395/ha/year
Underestimate:
other services, other farms
Three projects
19
Number of services
Spa
tial s
cale
Millennium Assessment
12
Pollination case study
Pollination meta-analysis
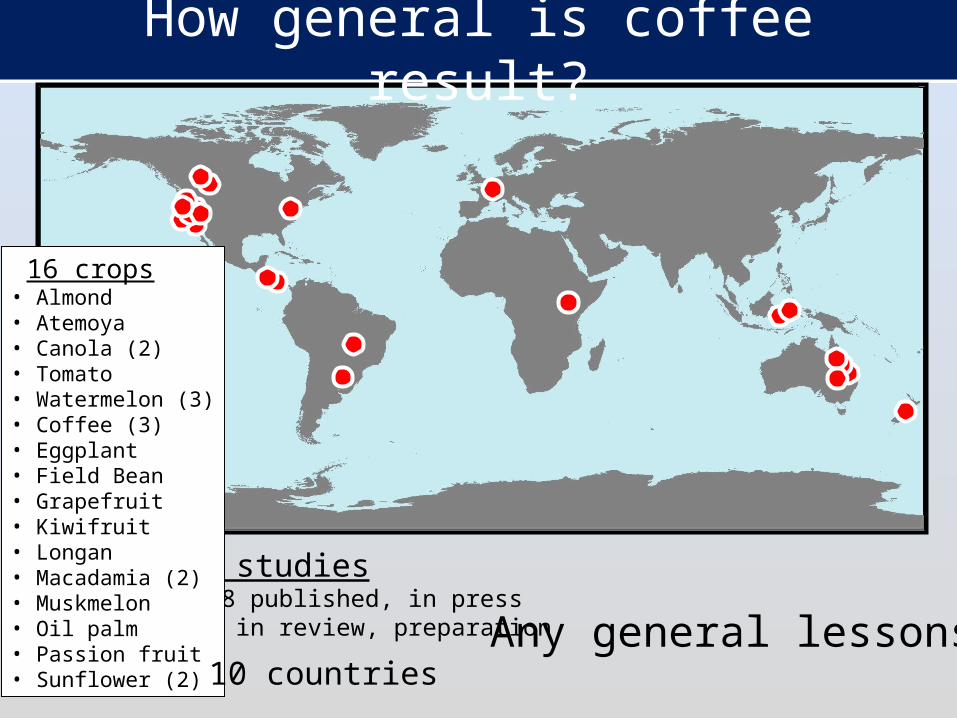
How general is coffee result?
23 studies• 18 published, in press• 5 in review, preparation Any general lessons?
16 crops• Almond• Atemoya• Canola (2)• Tomato• Watermelon (3)• Coffee (3)• Eggplant• Field Bean• Grapefruit• Kiwifruit• Longan• Macadamia (2)• Muskmelon• Oil palm• Passion fruit• Sunflower (2) 10 countries

Exponential decay model
Distance
Nat
ive
visi
tati
on
P = α * e(β*D) • α : intercept• β : decay rate

All studies (visitation)

Hierarchical Bayesian modeling
“ Mean β “
Pro
bab
ility
• Estimates probability distribution of
“mean β,“ given all studies
•α estimated separately for each study
• Better fits = more influence
• Stochastic sampling approach (WinBUGS)
• Flat priors
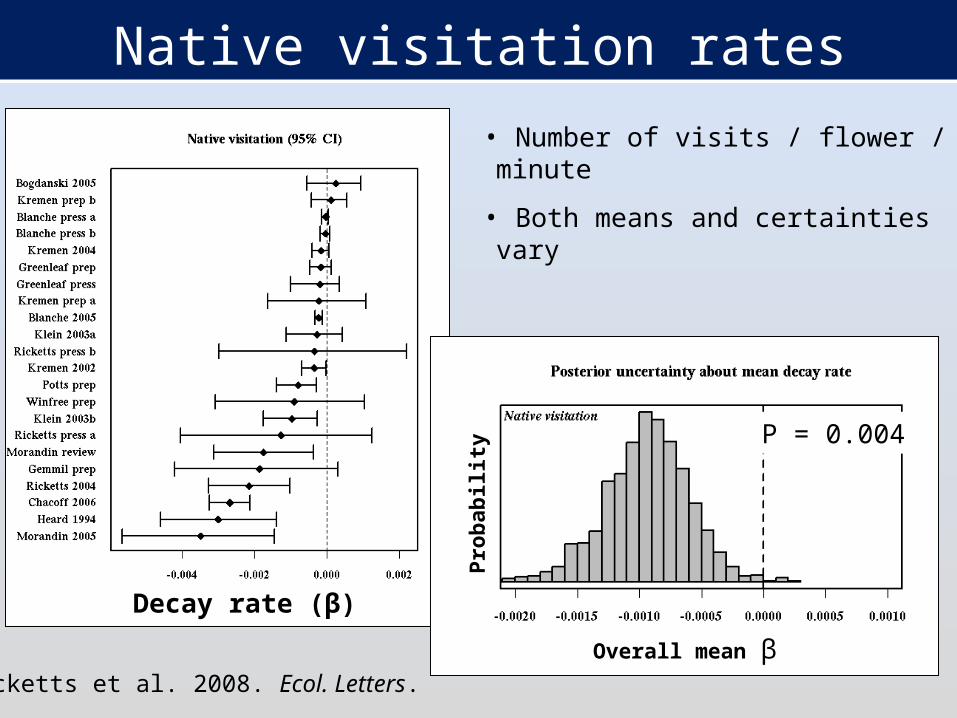
Native visitation rates
• Number of visits / flower / minute
• Both means and certainties vary
Decay rate (β)
Overall mean β
Pro
bab
ility
P = 0.004
Ricketts et al. 2008. Ecol. Letters.

Overall effect of distance
Point of 50% decline:
668m (395-1727m)
Distance (m)
Nat
ive
visi
tati
on
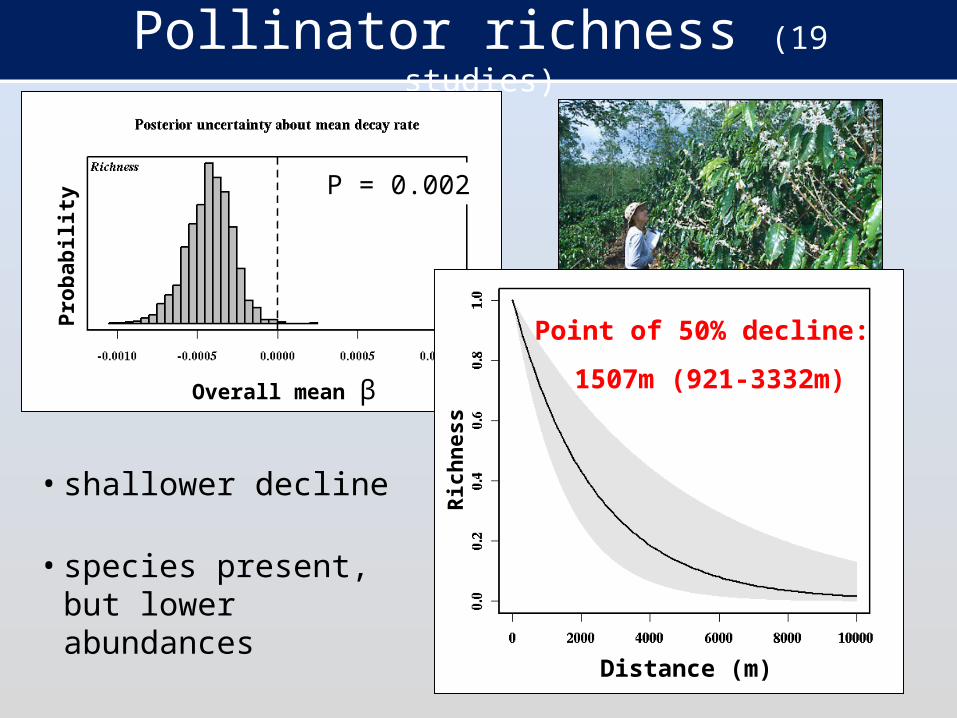
Pollinator richness (19 studies)
Point of 50% decline:
1507m (921-3332m)
• shallower decline
• species present, but lower abundances
Distance (m)
Ric
hn
ess
Overall mean β
Pro
bab
ility
P = 0.002

Fruit or seed set (12 studies)
Point of 50% decline:
26,826m (5038-NA)
• No overall decline detected
• sufficient pollination at low abundances
• crops self-compatible• experiments difficult Distance (m)
Fru
it/s
eed
setOverall mean β
Pro
bab
ility
P = 0.162

How does this help?
Ecology• Search for general patterns in
nature• Landscape effects on pollination
Conservation• Map ecosystem services• Inform landscape planning• Predict effects of land use change
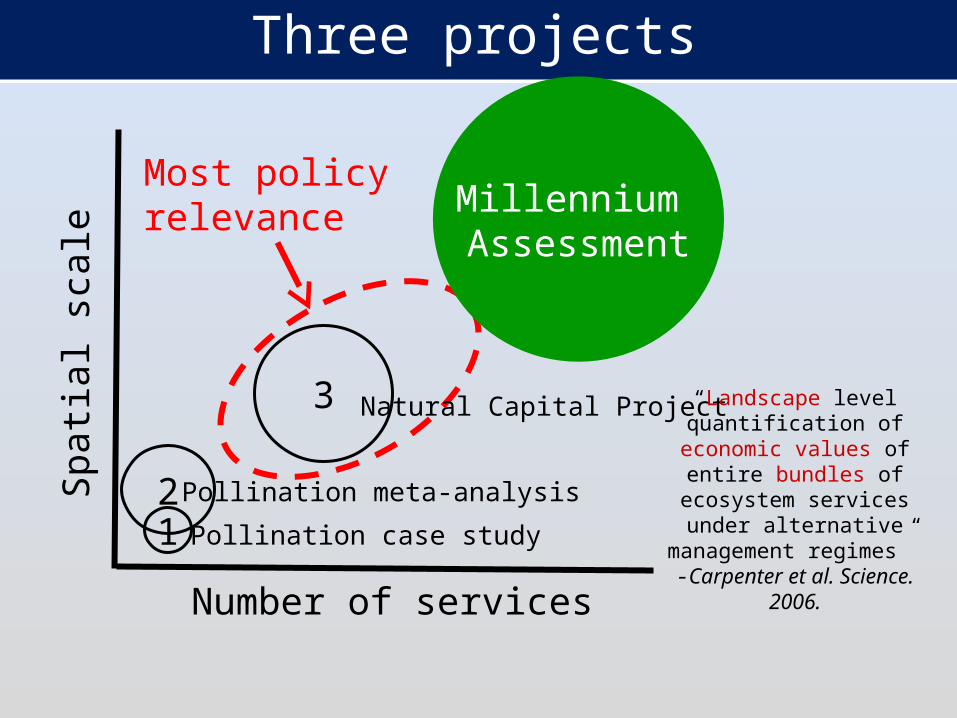
Three projects
Number of services
Spa
tial s
cale
Millennium Assessment
12
3
Pollination case study
Pollination meta-analysis
Natural Capital Project “Landscape level quantification of economic values of entire bundles of ecosystem services under alternative management
regimes” -Carpenter et al. Science. 2006.
Most policy relevance
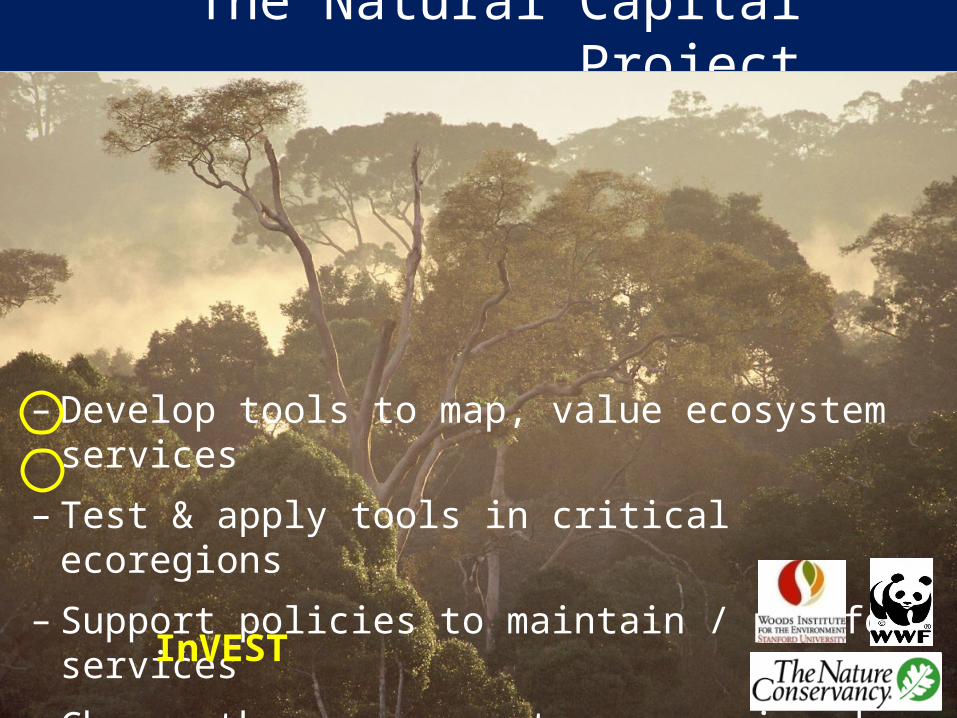
The Natural Capital Project
– Develop tools to map, value ecosystem services
– Test & apply tools in critical ecoregions
– Support policies to maintain / pay for services
– Change the way ecosystems are viewed
InVEST
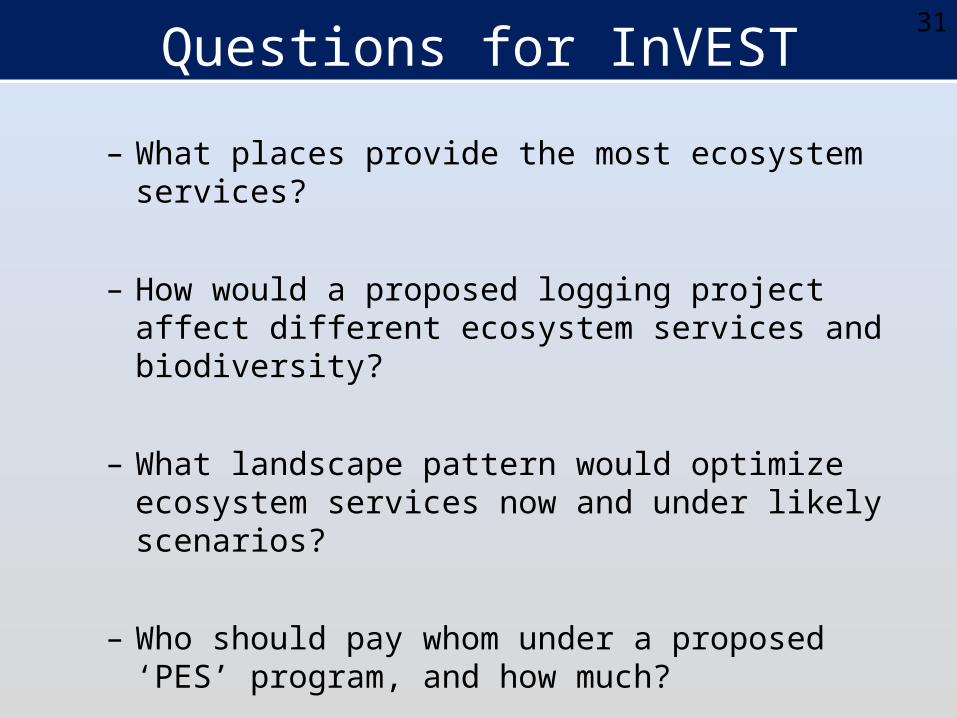
31Questions for InVEST
– What places provide the most ecosystem services?
– How would a proposed logging project affect different ecosystem services and biodiversity?
– What landscape pattern would optimize ecosystem services now and under likely scenarios?
– Who should pay whom under a proposed ‘PES’ program, and how much?

Biodiversity
Pollination
Carbon Storage, Sequest.
Timber & NTFP Production
Water quality
Water quantity and timing
Agricultural production
Recreation / Tourism
Cultural and Non-use
InVESTB
uilt
so fa
r
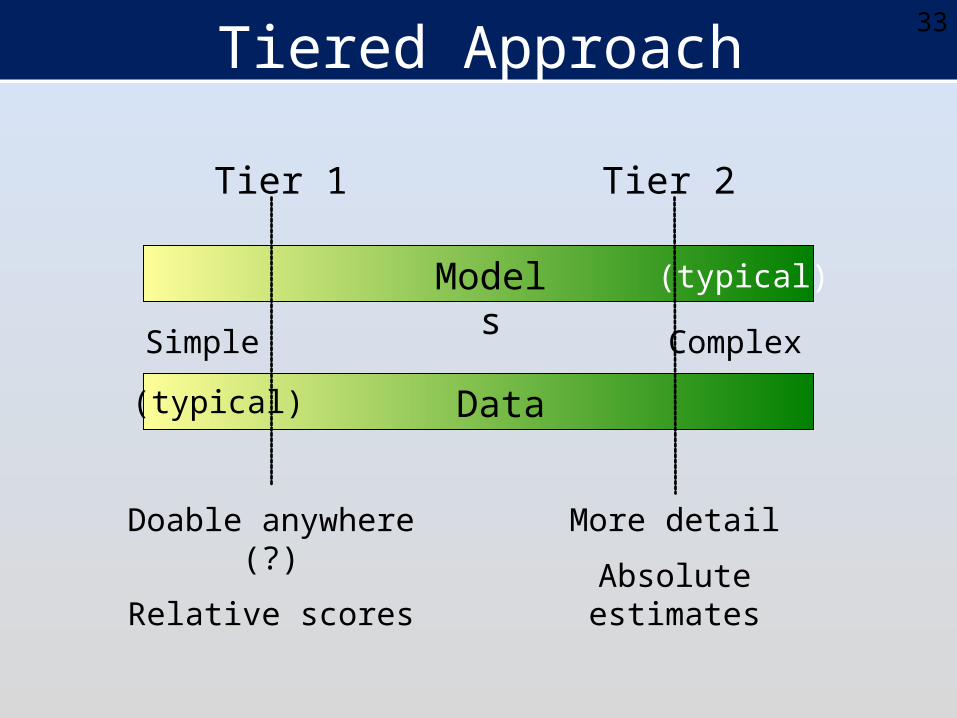
33Tiered Approach
Tier 1 Tier 2
Doable anywhere (?)
Relative scores
Simple Complex
Models
Data(typical)
(typical)
More detail
Absolute estimates

Pollination model
Pollinator source abundance
Fly to pollinate crops
Effect on crop yield
Distribute value to source A
A A
Y
P
Kremen, et al. 2007. Ecology LettersLonsdorf, et al. 2009. Annals of Botany

Testing in Costa Rica
Source abundanceContribution to coffee yieldSource value

Validating model results
y = 67.599Ln(x) + 179.53R2 = 0.842p < 0.001
0
20
40
60
80
100
120
0 0.05 0.1 0.15 0.2 0.25 0.3 0.35
Ob
serv
ed a
bu
nd
ance
Farm abundance score
y = 518.46Ln(x) + 1787.8R2 = 0.3044
p=0.063
0
200
400
600
800
1000
1200
1400
1600
1800
2000
0 0.05 0.1 0.15 0.2 0.25 0.3 0.35
Ob
serv
ed p
olle
n d
epos
itio
n
Farm Abundance Score
y = 79.366Ln(x) + 381.53R2 = 0.5457
p <0.001
0
50
100
150
200
250
300
350
400
450
0 0.05 0.1 0.15 0.2 0.25 0.3
Ob
serv
ed a
bu
nd
ance
Farm Abundance Score
y = 647.66Ln(x) + 2879.3R2 = 0.6053
p<0.001
0
500
1000
1500
2000
2500
3000
3500
0 0.05 0.1 0.15 0.2 0.25 0.3
Ob
serv
ed p
olle
n d
epos
itio
n
Farm Abundance Score
y = -0.0267Ln(x) - 0.0203R2 = 0.182
p = 0.17
0
0.02
0.04
0.06
0.08
0.1
0.12
0 0.05 0.1 0.15 0.2 0.25 0.3 0.35
Ove
rall
pol
len
lim
itat
ion
(se
ed m
ass)
Farm Abundance Score
Predicted on-farm abundance
Obs
erve
d on
-far
m a
bund
ance
• Good fits• Simple model• Simple data (experts)
Lonsdorf, et al. 2009. Annals of Botany
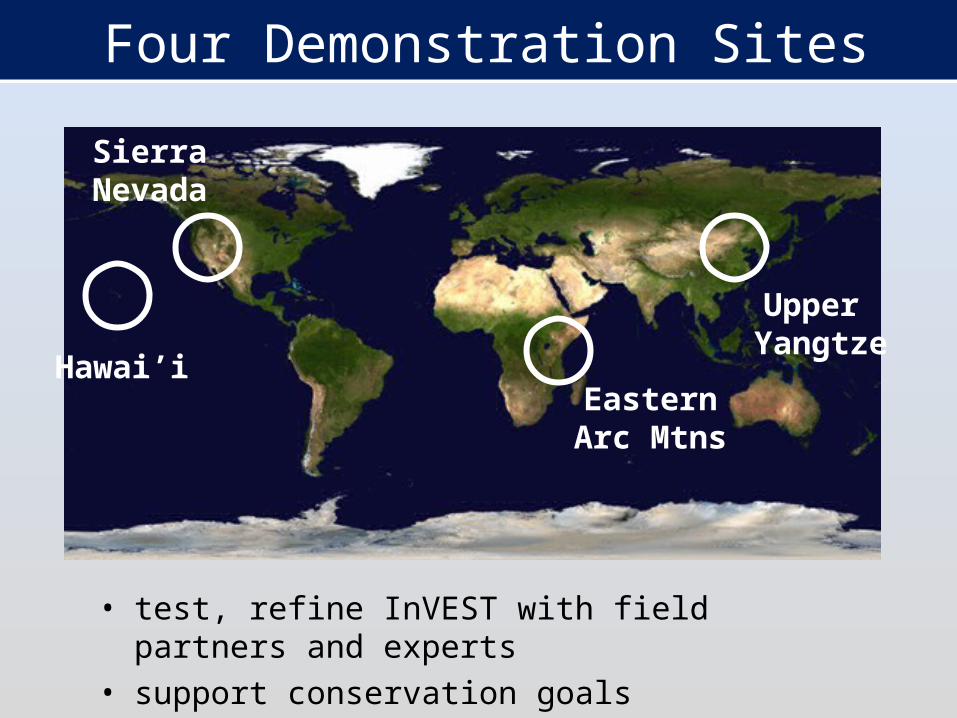
Upper Yangtze
EasternArc Mtns
SierraNevada
Four Demonstration Sites
Hawai’i
• test, refine InVEST with field partners and experts• support conservation goals

“Valuing the Arc”
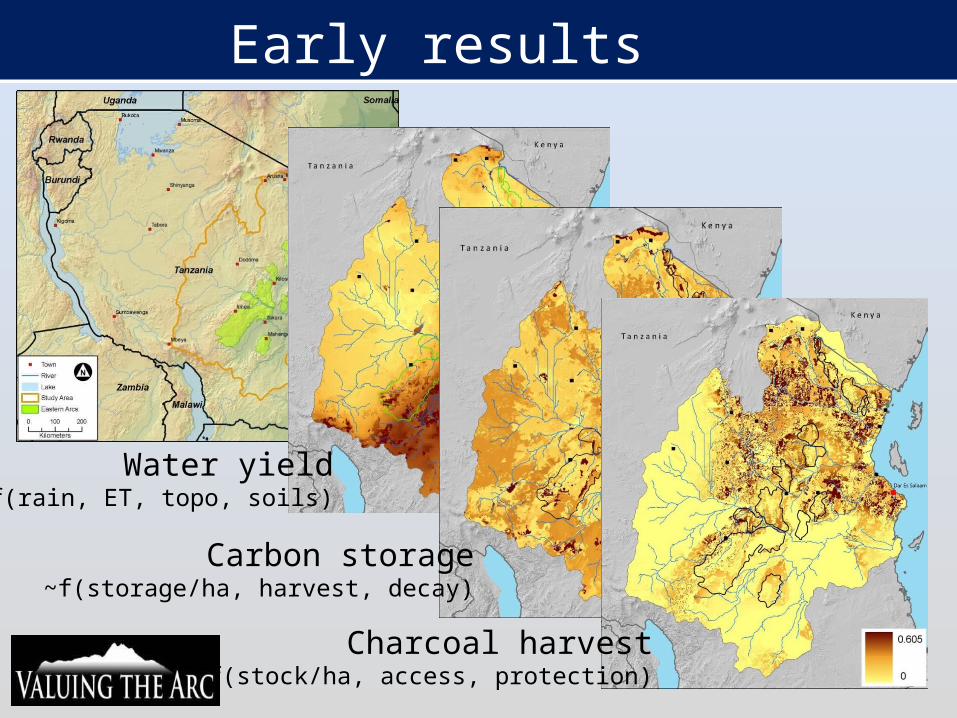
Early results
Water yield~f(rain, ET, topo, soils)
Carbon storage~f(storage/ha, harvest, decay)
Charcoal harvest~f(stock/ha, access, protection)
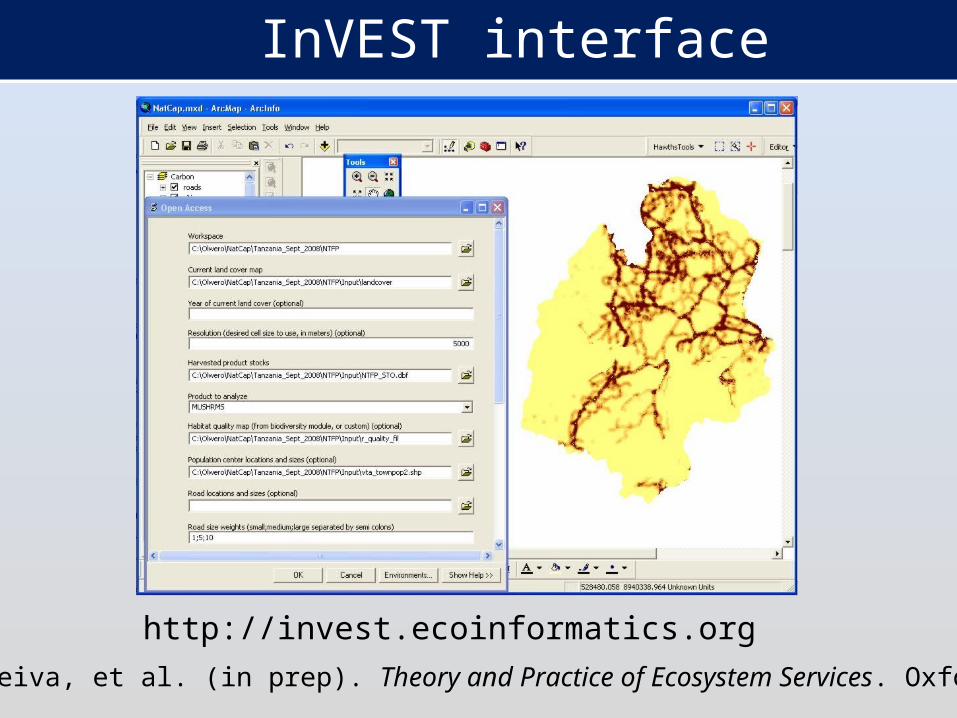
InVEST interface
http://invest.ecoinformatics.org
Kareiva, et al. (in prep). Theory and Practice of Ecosystem Services. Oxford.

Engaging people
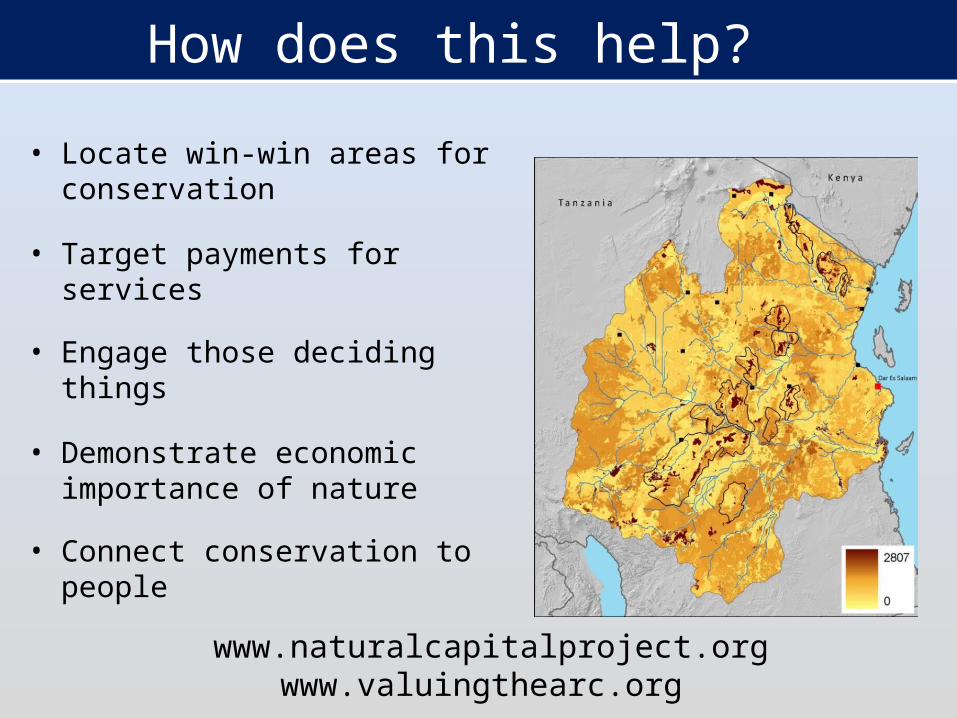
How does this help?
• Locate win-win areas for conservation
• Target payments for services
• Engage those deciding things
• Demonstrate economic importance of nature
• Connect conservation to people
www.naturalcapitalproject.orgwww.valuingthearc.org

Putting ES on the map
Number of services
Spa
tial s
cale
Millennium Assessment
12
3
Pollination case study
Pollination meta-analysis
Natural Capital Project

44
Thanks…NatCap / Valuing the Arc
Andrew BalmfordNeil Burgess
Gretchen DailyBrendan FisherPeter KareivaEric Lonsdorf
Guillermo MendozaShadrack Mwakalila
Robin NaidooErik Nelson
Nasser OlweroSteve Polasky
Jim RegetzMathieu RougetRuth SwetnamHeather Tallis
Buzz ThompsonKerry TurnerSue White
Michael Wright…
SupportNSF-NCEAS
NASALeverhulme Trust
Packard FoundationMacArthur Foundation
Moore FoundationSummit Foundation
Roger and Vicki SantPeter and Helen Bing
…
PollinationPaul EhrlichJaime FlorezGeoff Heal
David InouyeAilene Kane
Claire KremenMaya Hayden
Charles Michener Brad Reed
David RoubikNeal Williams
OTSFinca Santa Fe
The Fallas family…

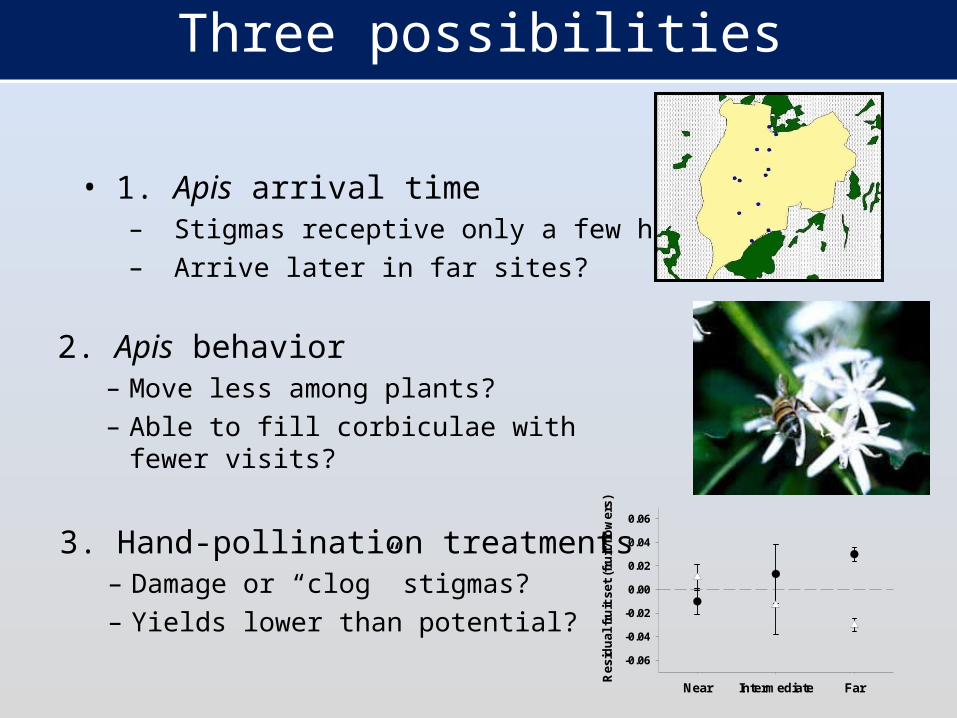
Three possibilities
• 1. Apis arrival time– Stigmas receptive only a few hours– Arrive later in far sites?
2. Apis behavior– Move less among plants?– Able to fill corbiculae with fewer
visits?
3. Hand-pollination treatments– Damage or “clog” stigmas?– Yields lower than potential?
Near Intermediate Far
Res
idual
fru
it s
et (fr
uit/fl
ow
ers)
-0.06
-0.04
-0.02
0.00
0.02
0.04
0.06

a
b
bb
c
near medium far bag hand0
500
1000
1500
3000
4000
open manipulated
Pollen manipulations

Decisions
Ecosystems
ServicesValue
Production functions
Daily et al. in press.Frontiers in Ecology & Evolution
Valuation
Incentives & Restrictions
Information
Scenarios & actions
Institutions
Big picture
Policy / Finance• How use information?• PES, gov programs• WRI collaborations?
InVEST