put your comment where your money is
TRANSCRIPT

Put Your Comment Where Your Money Is
AN ANALYSIS OF PUBLIC COMMENTS ON ANNUAL PROPOSED CHANGES TO MEDICARE
REIMBURSEMENT RATES
April 18, 2014
Prepared by:
Natalie Trebes Master of Public Policy Candidate
Faculty advisor:
Dr. Nicholas Carnes
Sanford School of Public Policy Duke University
Disclaimer: This student paper was prepared in 2014 in partial completion of the requirements for the Master’s Project, a major assignment for the Master of Public Policy Program at the Sanford School of Public Policy at Duke University. The research, analysis, and policy recommendations contained in this paper are the work of the student who authored the document, and do not represent the official or unofficial views of the Sanford School of Public Policy or of Duke University. Without the specific permission of its author, this paper may not be used or cited for any purpose.

Put Your Comment Where Your Money Is 2
TABLE OF CONTENTS
EXECUTIVE SUMMARY 4
I. INTRODUCTION 5
II. BACKGROUND 7
Notice-and-Comment Rulemaking 7 Examination of the Role of Public Comments 8 Contributions of this Research Project 10
III. DATA 11
Primary Data Sources and Retrieval 11 Extracted Data 12
Commenter Data 13 Contextual Data 14 Substantive Data 16
IV. ANALYSIS AND DISCUSSION 20
Commenter Mix 20 Commenter Domains 20 Commenter Expertise 21 Constituency Level 23
Geographic Mix 24 Trends Around Proposed Rules 27
Proposed Payment Changes Relative to National Health Expenditures 27 Number of Comments Received Relative to Contextual Factors 28 Types of Commenters Relative to Proposed Payment Changes 29
Trends Around Final Rules 31 Final Payment Changes Relative to Number of Comments 31 Length of Revision Period Relative to Contextual Factors 32 Final Payment Changes Relative to Types of Commenters 32
V. CONCLUSION 35
APPENDICES 38
Appendix A. Collected Rule Data 38 Appendix B. IPPS Rate-Setting Methodology 40 Appendix C. Summary of Variables in Dataset 43 Appendix D. Major and Irregular Changes to IPPS System 47 Appendix E. Major Diagnostic Categories 49

Put Your Comment Where Your Money Is 3
Appendix F. U.S. Census Bureau Divisions 50 Appendix G. Additional Geographic Distribution Maps 51
REFERENCES 55

Put Your Comment Where Your Money Is 4
Executive Summary This paper examines the annual Medicare acute care hospital inpatient prospective payment system (IPPS) rate update rules, which are consistent, comprehensive, and have a high impact on stakeholders. I collect a random sample of comments on IPPS rules for fiscal years 2005 to 2014, and generate a dataset with information about the types, locations, and expertise areas of authors and organizations submitting comments on these rules.
I also examine the differences between payment rate values in proposed rules and corresponding values in final rules, and observe the relationships between these outcomes and the composition of public comments across a number of categorical aspects.
Comments in the sample were predominately submitted by providers (both organizations and clinicians), which is unsurprising as these rules directly govern the payments made to these groups. Commenters usually had identifiable expertise in the areas of medicine, health, law, health administration, business administration, healthcare finance and accounting, public policy, or legislative affairs, and were largely concentrated in Washington, D.C., the Northeast, and the Midwest.
There are some discernable correlations between the percentage of comments submitted by individuals with certain areas of expertise and changes made to payment rates (both in relation to final rates from previous years and proposed rates). A crude interpretation of these relationships purports that some subsets of commenters are particularly responsive to rate changes, and that in turn CMS is responsive to some of the positions advocated by other subsets of commenters.

Put Your Comment Where Your Money Is 5
I. Introduction Rulemaking by executive and independent agencies is an extension of the policymaking power derived from Congress and the President (Furlong & Kerwin, 2005), and is effectively the “most common and instrumental form of lawmaking,” (Kerwin & Furlong, 1992). Rulemaking dwarfs legislation in volume. From 1973 to 2013, each Congress enacted an average of roughly 560 laws (GovTrack.us, 2013). Over nearly the same period, an average of almost 5,000 final rules were published annually in the Federal Register (Carey, 2013). Compared to federal legislation, rulemaking has more precise and immediate impacts on affected stakeholders: rules often take effect within one month of publication, while most statutes require the issuance and implementation of rules in order to have a real impact (Furlong & Kerwin, 2005).
With such substantial administrative power placed in the control of a large, unelected bureaucracy, Furlong and Kerwin (2005) note that the participation of the general public in rulemaking is a key source of democratic legitimacy. The notice-and-comment rulemaking process provides both a mechanism for public input on regulatory content and a mandate for agencies to respond to that input. Therefore, the extent to which public views are effectively and equitably incorporated into final rules should be a fundamental question when evaluating the democratic character of the administrative state.
Rules governing Medicare acute care hospital reimbursement rates provide a useful and substantial case study for examining this relationship between the development of rules and associate public comments. Updates to the rates and rate-setting methodology of the Medicare acute care hospital inpatient prospective payment system (IPPS) are well-suited for this study because they are issued annually, are consistent in form and content, and provide a wide range of outcome values.
Medicare payment rates have enormous implications for the U.S. federal budget, Medicare beneficiaries’ access to care, and the U.S. health care system. Medicare spending in 2013 accounts for 16% of the federal budget (KFF, 2013), and is the largest single payer in the U.S. health care system with 23% of $2.28 trillion in U.S. expenditures on personal health in 2011 (MedPAC, 2013). The majority of Medicare expenditures are for hospital inpatient care, at $139.7 billion in 2012; by comparison, the next highest Medicare expenditures were for physician services at $69.6 billion (MedPAC, 2013). Acute care hospital inpatient services are covered by Hospital Insurance (HI, “Part A” of Medicare), which is financed by dedicated payroll taxes on current workers. These receipts are held in the HI trust fund; Medicare trustees project that this fund will be exhausted in 2026 under intermediate cost assumptions (MedPAC, 2013). Of the 5,724 registered hospitals in the U.S., almost 5,000 are inpatient acute care hospitals that treat Medicare beneficiaries (AHA, 2013a, 2013b). Medicare insures over 49 million beneficiaries (KFF, 2012).
The sheer numbers of beneficiaries, providers, and dollar amounts affected by the acute care hospital IPPS rates constitute substantial incentives for stakeholders to involve themselves in the rate-setting methodology. In order to secure access to care for Medicare beneficiaries, the Centers for Medicare and Medicare Services (CMS) must update payment rates such that they

Introduction
Put Your Comment Where Your Money Is 6
adequately reflect hospital costs. CMS must simultaneously guard against improper payments and upcoding (OIG, 2001) in order to protect the trust fund. As a part of its efforts to balance these concerns when making adjustments to payment rates, CMS draws upon public comments to gain additional expertise on methodology and further understand the potential impact on stakeholders.
This research project will examine the annual Medicare acute care hospital IPPS rate update rules, which are consistent, comprehensive, and have a high impact on stakeholders. Specifically, I will examine the differences between component values in proposed rules and corresponding values in final rules, and will estimate this difference as an outcome. I will examine the relationships between these outcomes to the composition of public comments across a number of categorical aspects, in order to generate a preliminary estimate of the relationship between rule changes and the types of public commenters. To avoid invalid causal assertions, I will restrict the scope of this project to a descriptive statistical analysis.
Put Your Comment Where Your Money Is 7
II. Background
NOTICE-AND-COMMENT RULEMAKING As required by the Administrative Procedure Act (APA), federal agencies are required to provide a public notice of proposed rulemaking in the Federal Register prior to proposing or changing a rule or regulation.* This notice and the proposed policy that follows are both open to public comment for a limited period of time. The agency must respond to all comments when issuing the final rule, though it is not required to make any changes to the final rule.†
The Supreme Court has set a precedent of deference to executive agency interpretation of a statute where there is ambiguity or silence, so long as the interpretation is a reasonable conclusion from the statute. “If Congress has explicitly left a gap for the agency to fill, there is an express delegation of authority to the agency to elucidate a specific provision of the statute by regulation. Such legislative regulations are given controlling weight unless they are arbitrary, capricious, or manifestly contrary to the statute,” (Chevron U.S.A., Inc. v. NRDC, 1984).
This vast scope of agency power is tempered by the provision that “agency action made reviewable by statute and final agency action […] are subject to judicial review,” (5 U.S.C. §§704). Schmidt (2002) notes that “effective participation [in rulemaking] compels agency decisionmakers to satisfy at least the minimum demands of a firm or interest group or else attempt to defend a poor legal case for an alternative regulation.” As all available participation efforts in the public record are reviewed by courts when necessary, the threat of judicial review serves as a proverbial ‘stick’ to prompt agency responsiveness to interest group concerns.
Protection during judicial review is not the only advantage that agencies may gain from public comments. Those stakeholders closest to an issue (and thus most motivated to participate in public rulemaking avenues) are often those with the greatest expertise on the issues. Agencies stand to benefit greatly from the topical knowledge of the relevant affected groups when formulating rules (Yackee and Yackee, 2006; Croley, 1998).
* 5 U.S.C. §551(4) defines ‘rule’ as “the whole or a part of an agency statement of general or particular applicability and future effect designed to implement, interpret, or prescribe law or policy or describing the organization, procedure, or practice requirements of an agency and includes the approval or prescription for the future of rates, wages, corporate or financial structures or reorganizations thereof, prices, facilities, appliances, services or allowances therefor or of valuations, costs, or accounting, or practices bearing on any of the foregoing.” † 5 U.S.C. §553(c) provides that agencies “shall give interested persons an opportunity to participate in the rule making through submission of written data, views, or arguments with or without opportunity for oral presentation” and that “[a]fter consideration of the relevant matter presented, the agency shall incorporate in the rules adopted a concise general statement of their basis and purpose.”

Background
Put Your Comment Where Your Money Is 8
Finally, the public comment provision appeals to principles of democratic legitimacy. According to Regulations.gov (2012), public comments can help agencies respond to public needs and preferences, determine public levels of acceptance or resistance of a rule, and understand the impact on affected parties. Yet Farina et al (2012) caution that “rulemaking is not a plebiscite,” – that the democratic criterion has already been achieved through legislation. The authors assert that more participation is not necessarily a useful goal, but that we should strive for more public participation of value – specifically by commenters who are “historically undervoiced” and who have “situated knowledge” of the potential effects of a rule via personal or professional experience.
EXAMINATION OF THE ROLE OF PUBLIC COMMENTS Empirical research articles investigating responsiveness to public participation in rulemaking generally employ one of two strategies, each subject to its own limitations. The first makes use of a broad sample of proposed and final rules and their associated comments, examining changes from proposed rules. This strategy is relatively objective and generalizable, but it also raises substantial endogeneity concerns. There exists a wide range of unobservable (and arguably, more powerful) factors that influence changes in proposed rules, making it difficult to determine whether or not a change was made as a result of a comment (West, 2004; 2005). Moreover, West (2005) highlights the difficulty of determining the significance of a change: broader datasets challenge the limits of researchers’ technical expertise with respect to the subject matter of the rule. Scholars who examine rules covering many different topical areas simply cannot keep track of the true contextual meaning of any changes.
The second prominent strategy is the case study method, wherein researchers immerse themselves in particular rules or small sets of rules. Researchers investigate all other aspects of the rulemaking process specific to that rule and interview officials and lobbyists who worked on the rule(s) under study. This method addresses the causal inference concerns plaguing the previous strategy, but its usefulness is diminished by generalizability concerns. West (2005) cites Kerwin’s (2003) observation that most case studies on rulemaking focus on rules that are unique in terms of their impact and political salience.
Alternative mechanisms – both informal and formal – for influencing rulemaking exist across a full spectrum of interested actors. Furlong (1998) provides a general overview of these mechanisms. Presidential influence is exerted through political appointments within executive agencies, and through the Office of Management and Budget (OMB). Specifically, Kerwin and Furlong (1992) highlight executive branch control via Executive Order #12291, which holds that regulations must be reviewed by OMB for “consistency with regulatory principles” and that major rules must demonstrate a net benefit (as identified by a regulatory impact analysis). Congress, beyond its powers of generating the legislation that necessitates rulemaking, can hold committee hearings to review regulations; members of Congress may use informal private contact with agency staff to exert their own influence. As mentioned previously, courts may exercise judicial review of regulations if the validity of the agency’s authority to issue a rule is challenged (Furlong, 1998).

Background
Put Your Comment Where Your Money Is 9
Perhaps most significantly, interest groups conduct a number of other activities besides written public comments in order to influence rulemaking. These include participation in public hearings, membership on advisory boards of agencies, coalition-building with other interested parties, mobilization of their members, informal contacts with agency personnel prior to and after the issuance of a notice of proposed rulemaking (NPRM) by an agency, and petitions to initiate rulemaking (Furlong, 1997). Furlong (1998) mentions capture theory (wherein agencies are beholden to the industries they regulate), policy subsystems, and issue networks as models for the influence of interest groups on the bureaucracy.
Only a small number of empirical studies aim to assess the influence of public comments on rulemaking outcomes, and consensus is limited or nonexistent among these. Some authors find that commenters exert an influence over rule outcomes (Naughton et al, 2009; Yackee and Yackee, 2006; Yackee, 2006; McKay and Yackee, 2007), while others find that commenters have little to no influence (Golden, 1998; West, 2004). Those finding commenter influence tended to look at larger datasets, code content along a scale for regulatory position, and generate a mean or subgroup mean for that regulatory position. Those finding little to no commenter influence tended to evaluate a smaller set of rules with fewer comments, and evaluated statements made by the agency (either via researcher interviews or the preambles of regulatory text) about the degree to which regulatory changes were affected by comments. Golden (1998) and McKay and Yackee (2007) agree that dissention among commenters plays a role in the rule outcome, but disagree on which commenters are more influential: Golden finds that agencies tend to be more receptive to opinions that are favorable toward the agency’s position when there is dissention among the comments, while McKay and Yackee find that the more dominant commenter position has greater influence upon the final change.
When representing the changes advocated by commenters and the regulatory changes, researchers tend to code these outcomes using a 3- or 5-point scale for regulatory shift (Naughton et al, 2009; Yackee and Yackee, 2006; McKay and Yackee, 2007). Only Balla (1998) captures the magnitudes of the changes to the Medicare physician fee schedule, but he bases his analysis of commenter influence on the frequencies of comments submitted by specialty type.
Golden (1998) notes that there is a dearth of literature reviewing “normal” and “run-of-the-mill” regulations. Most research studies look at highly salient rules (which are likely to be more prominent in the public eye, and impacted by a number of other factors); notably, Balla (1998) investigates only one rule that makes a major, controversial change to physician reimbursement rates.
These studies often draw causal conclusions, and rarely control for outside lobbying and political factors. Studies running regression models on the content of comments (Naughton et al, 2009; Yackee and Yackee, 2006; McKay and Yackee, 2007), varyingly include controls for rule salience, complexity, issuing agency, OMB review, and congressional mandate of the regulation. Only West (2004) accommodates an array of other factors into his analysis, but he conducts a case study of sixteen rules and uses interviews with agency officials to assess the influence of comments rather than look at the comments themselves.

Background
Put Your Comment Where Your Money Is 10
CONTRIBUTIONS OF THIS RESEARCH PROJECT This research project aims to bridge a gap in the extant literature by aiming for a middle ground among the research strategies and techniques employed previously. Rather than restrict the estimation of regulatory change to an ordinal scale, using the actual numerical values of IPPS reimbursement components can capture more detail in the enacted change.
Additionally, this project will generate and analyze a dataset that is intermediate in terms of the number of rules evaluated (relative to other studies), but large in terms of the number of comments evaluated. The rules evaluated are regular, annual updates, and thus fall into Golden’s criterion for “run-of-the-mill” rulemaking; moreover, the standardized nature of the regulations can accommodate pseudo case study methods. However, these rules are significant in terms of stakeholders affected and the dollar amounts involved, meaning that these are highly salient regulations.
Finally, to avoid any invalid causal assertions, this study will endeavor to control for political, geographic, and economic factors that may influence the changes made to the rule. Moreover, it will not present any of its findings as causal in nature, and will be restricted to descriptive and relational statistical analysis.

Put Your Comment Where Your Money Is 11
III. Data
PRIMARY DATA SOURCES AND RETRIEVAL Updates to the Medicare IPPS reimbursement rate-setting methodology are provided annually in rules issued by CMS. Those proposed and final rules available in a searchable, electronic format via FederalRegister.gov are the annual updates to the acute care hospital IPPS rates from FY1994 to FY2014. I selected these rules by: (1) reviewing the CMS.gov list of federal regulations and notices for the Acute Inpatient PPS,* and (2) by querying [medicare "hospital inpatient prospective payment"] in the FederalRegister.gov search engine. I have downloaded all CMS-produced documentation – including notices, corrections, proposed rules, and final rules – for each annual update. These are listed in Appendix A, along with any associated notices and corrections.
All public comments associated with each annual set of rules, notices, and corrections (herein, “rule-year”) are publicly available. Public comments associated with the selected rules are available for individual download from Regulations.gov back to 2005. I used the Docket ID associated with each rule to query the Regulations.gov search engine, and retrieved lists of the comment ID numbers registered with each rule-year docket. As paper comments are grouped together as one comment entry, I generated my own list of paper comment ID numbers. I utilized these finalized lists as a sampling frame to generate a random sample of the public comments.
Following Cochran’s rule for minimum sample size (as cited in Israel, 2013) adjusted for a small, finite population,† I calculated a sample size for a population of all years taken together (at a 95% confidence level), and sample sizes for each rule-year (at the same 95% confidence level specification). I did not stratify paper and electronic comments. While the cumulative sample size of 370 represents a manageable portion of the total number of comments (5.2% of 7,038 total comments), the sum of the sample sizes for each rule-year is quite large at 2,226 (31.5% of the total comments).
* Available at http://www.cms.gov/Medicare/Medicare-Fee-for-Service-Payment/AcuteInpatientPPS/IPPS-Regulations-and-Notices.html. † A sample size of n (adjusted for the population) is calculated as:
𝑛 =𝑛!
1 + !!!!!
where N represents the total population, and n0 (the base sample size) is calculated as:
𝑛! =𝑍!𝑝𝑞𝑒!
where pq represents an estimation of the variance of sample characteristics, e represents the confidence interval precision desired, and Z represents the Z-score desired. I assume maximum variance values.

Data
Put Your Comment Where Your Money Is 12
I randomly selected a subset of comments from the intended sample, in order to reasonably accommodate researchers’ time and effort constraints. The sample sizes for each rule-year in this subset were calculated as proportions of the population sample size, relative to the rule-year sampling described above. This stratifies the subset sample by rule-year, oversampling years with smaller total comment numbers. Comments in this “first tier” subset were retrieved for use in this study, while comments in the “second tier” were identified for potential future work and analysis. Table 1 below presents frequency data for population and samples.
Table 1. Frequency data for public comment population and samples.
FY Total Number of Comments
Number and Percentage of Comments Sampled
First Tier Second Tier (cumulative)
2005 338 30 (8.9%) 181 (53.6%)
2006 1,417 50 (3.5%) 303 (21.4%)
2007 1,817 53 (2.9%) 318 (17.5%)
2008 124 16 (12.9%) 94 (75.8%)
2009 902 45 (5.0%) 270 (29.9%)
2010 474 35 (7.4%) 213 (44.9%)
2011 639 40 (6.3%) 241 (37.7%)
2012 295 28 (9.5%) 168 (56.9%)
2013 412 33 (8.0%) 200 (48.5%)
2014 620 40 (6.3%) 238 (38.4%)
TOTAL 7,038 370 (5.2%) 2,226 (31.5%)
The resultant primary, raw dataset includes 10 sets of proposed and final rules, for fiscal years 2005 to 2014, and a random, stratified sample of the comments associated with each docket totaling 370 comments. The comment-level data are representative at the 95% confidence level for analysis of the 10-year period of rules, but do not reach this confidence threshold when isolated to a particular year. Therefore, analysis on a specific rule-year can only be considered on an anecdotal basis, while analysis on the complete dataset can be considered representative.
EXTRACTED DATA I processed and combined the extracted data from the primary sources (proposed rules, final rules, and public comments) and from supplemental sources in order to form the following datasets: commenter data, containing extracted and inferred information about the organizations and authors submitting comments; contextual data, containing rule-year level information about the comment period length, political party of the President and Congressional majorities, CMS leadership, and growth in health expenditures; and substantive data, containing information about the content promulgated in the proposed and final rules (at the rule level). I also planned to extract substantive information about the positions advocated by commenters (at the comment

Data
Put Your Comment Where Your Money Is 13
level), but the complexity and time requirements of this task proved to be beyond the scope of this project. The creation of these datasets is described in the sections that follow. A summary of the consolidated data set is provided in Appendix C.
Commenter Data Three undergraduate research assistants and I accessed each individual comment included in the first tier sample. For each comment, we saved the Regulations.gov HTML data and downloaded all available attached files. Comment content is either provided as text on the web page or as an attached document, depending on how the comment was submitted by its author. We recorded the information listed in Panel A of Box 1 below for each comment, when available.
Box 1. Information collected from comments, matched corresponding data generated.
A. Collected Information B. Consolidated/Inferred Data
Primary Author Information
Position title Primary degree Additional degree(s) Certificate(s)
Expertise subject areas: • Medicine/Health – MD, MSN, DNP, DO, Pharm.D., MPH • Law – JD • Healthcare/Business Administration & Leadership – MBA,
CEO, President, Executive Director, etc. • Healthcare Finance & Accounting – CFO, CPA, Director of
Reimbursement, VP of Finance, etc. • Public Policy/Legislative – VP of Public Policy, Director of
Regulatory Affairs, etc.
Primary Organization Information
Organization name CMS-designated name CMS-designated category Researcher-inferred category
Entity category – the type of entity sponsoring the content of the comment Entity domain – the field/perspective represented by the entity Entity type – whether the entity is representing the views of an organization or the views of an individual Affiliated organization type – if entity type is ‘individual’, entity category of the affiliated organization Number of repeat occurrences – number of times organization has sponsored a comment in the sample Constituency/market level – with what location level the organization is concerned (e.g., ‘local’ for a community hospital, ‘global’ for an international pharmaceutical corporation) CMS-designated category deemed correct – indicates that the CMS-designated commenter category appears to be correct for
Location Information
State City ZIP
State Region – U.S. Census Bureau geographic designation Division – U.S. Census Bureau geographic designation

Data
Put Your Comment Where Your Money Is 14
A. Collected Information B. Consolidated/Inferred Data
Comment Information
Received date Date sent Proposed rule date (from rule) Comment due date (from rule)
Days after proposed rule – number of days between date proposed rule was issued and date comment was submitted Days before due date – number of days between date comment was submitted and date comment was due
Comment format Comment format – indicates whether comments were submitted as text or as an attachment
I use the collected information to generate the data presented in Panel B of Box 1 above. ‘Primary author’ refers to the first author listed on a comment. The author information collected is used to generate expertise indicator data, based on the author’s position, degrees, and certifications. ‘Primary organization’ refers to the first organization listed on a comment, or the first organization affiliated with a primary author.
In the event that values assigned by CMS conflict with those provided in a comment, I deferred to the value provided in the comment. The argument can be made that perspective of CMS should take precedent over that of the comment, as CMS is the organization responsible for interpreting the comment. However, I selected the comment-derived values because (1) it is likely that the individuals responsible for responding to and addressing the comments are not the same individuals responsible for cataloguing the comment in the Regulations.gov database, and (2) this study aims to describe and analyze the individuals and organizations submitting comments on IPPS rules.
Contextual Data I collected an array of contemporaneous data to represent the context in which the rulemaking process took place. This data includes factors internal to CMS and the rulemaking process (as presented in Table 2 below) and external factors (as presented in Table 3 below).

Data
Put Your Comment Where Your Money Is 15
Table 2. Internal contextual data.
FY Length of
Proposed Rule (pages)
Comment Period Length
(days)
Revision Period Length
(days)
Number of Comments CMS Administrator a
2005 622 55 30 338 Mark McClellan
2006 368 51 49 1,417 Mark McClellan
2007 477 48 67 1,817 Mark McClellan
2008 456 40 71 124 [Acting] b
2009 411 44 67 902 [Acting] c
2010 607 39 58 474 [Acting] d
2011 472 45 59 639 Donald Berwick e
2012 298 46 59 295 Donald Berwick
2013 324 45 67 412 [Acting] f
2014 339 46 55 620 Marilyn Tavenner
a. CMS, 2009; CMS, 2014; Leavitt Partners, 2014. b. Leslie Norwalk, Herb Kuhn c. Kerry Weems d. Charlene Frizzera e. Charlene Frizzera served as the Acting Administrator for some duration of the FY 2011 IPPS rulemaking period. f. Marilyn Tavenner
I do not include a variable for the CMS Chief Actuary, as Rick Foster occupied the position for all but the FY2014 rulemaking period. I omit those individuals serving as the acting administer (denoted by “[Acting]”) from the analysis under the presumption that those individuals not confirmed by Congress have a more uncertain expected length time in the office.

Data
Put Your Comment Where Your Money Is 16
Table 3. External contextual data.
FY President House Majority Party
Senate Majority Party
Growth in National Health Expenditures from Previous Year a (%)
2005 Bush Republican Republican 8.6%
2006 Bush Republican Republican 7.2%
2007 Bush Republican Republican 6.8%
2008 Bush Democrat Democrat 6.5%
2009 Bush Democrat Democrat 6.3%
2010 Obama Democrat Democrat 4.7%
2011 Obama Democrat Democrat 3.8%
2012 Obama Republican Democrat 3.8%
2013 Obama Republican Democrat 3.6%
2014 Obama Republican Democrat 3.7%
a. CMS, 2012.
Substantive Data I collected and synthesized data representing the content promulgated via the text of the rule. This includes specific numerical data on the standard federal payment base rates and relative weighting factors, as well as a summary of major and irregular policy changes implemented by the rules.
The Medicare acute care hospital IPPS rates are established by applying a set of adjustments to a standardized discharge amount, which is a standardized base payment amount set for the expected costs of furnishing inpatient services covered by Medicare. For FY2014 services, this base amount is $5,370.28. Each patient discharge is assigned to Medicare severity diagnosis-related groups (MS-DRGs), which aggregate similar clinical conditions and associated services rendered by the hospital during a patient stay (CMS, 2013a). These are grouped into Major Diagnostic Categories (MDCs) that form mutually-exclusive areas, usually corresponding to organ systems, causes of morbidities, and particular medical specialties (75 FR 50041); a list of these 25 MDCs is provided in Appendix E.
MS-DRG relative weights are established to reflect the relative cost of one MS-DRG compared to the average of all Medicare cases; these weights adjust for the differences in treatment costs required for different types of medical conditions (CMS, 2013a). A more detailed overview of the IPPS rate-setting methodology is provided in Appendix B.
A key function of IPPS update rules is to provide the annual updates to the standardized base amount and recalibrate the relative weights. CMS issues both a “full update” and a “reduced update” to the base operating payment amount, contingent on a hospital’s quality reporting

Data
Put Your Comment Where Your Money Is 17
compliance. Though the base rates are usually raised proportionately in the absence of other policy changes, CMS has discretion to alter these proposed updates when issuing the final rule (subject to budget neutrality requirements). Moreover, while the relative weights are calculated via an established methodology and using real treatment cost data, CMS may take other factors into consideration when finalizing these weights (including changes to the calculation methodology).
I retrieved the proposed and final update percentages for the standardized payment amount for operating costs for each year, as well as the final update percentage for FY 2004 (to provide a reference point for FY 2005 values). I then calculated the differences between the update percentages from (1) the proposed rule and the previous year’s final rule, and (2) the final rule and the proposed rule. Table 4 below presents these resultant data.
Table 4. Differences in updates to standardized payment amounts for operating costs, as provided in final rules and proposed rules.
FY
Δ from Update % in Previous FY Final Rule Δ from Proposed Update %
(1)
Full Update
(2)
Reduced Update
(3)
Full Update
(4)
Reduced Update
2005 -0.10% - 0.00% 0.00%
2006 -0.10% -0.10% 0.50% 0.50%
2007 -0.30% -1.90% 0.00% 0.00%
2008 -0.10% -0.10% 0.00% 0.00%
2009 -0.30% -0.30% 0.60% 0.60%
2010 -1.50% -0.50% -0.25% -1.25%
2011 0.55% 0.55% -0.05% -0.05%
2012 -0.85% -0.85% 0.40% 0.40%
2013 0.20% 0.20% -0.30% -0.30%
2014 0.00% 0.00% -0.10% -0.10%
All values are reported as differences in percentage points, not as percentage changes. Columns (1) and (2) present the differences between the update percentage provided in the proposed rule for the current FY and the update percentage provided in the final rule for the previous year. Columns (3) and (4) present the differences between the update percentage provided in the final rule for the current FY and the update percentage from the proposed rule.

Data
Put Your Comment Where Your Money Is 18
I retrieved the proposed and final MS-DRG relative weights for each year for FYs 2011-2014, as well as the final MS-DRG relative weights for FY 2010 (to provide a reference point for FY 2010 values.* For each MDC, I calculated the average differences between the MS-DRG relative weight from (1) the proposed rule and the previous year’s final rule, and (2) the final rule and the proposed rule. I also calculated the average and median differences for the same relationships across all MS-DRGs.
A survey of some of the key irregular changes made for reimbursements in each fiscal year is provided in Appendix D. I interpret ‘regular’ changes to be standard adjustments and updates to existing and recurring components of the payment policies (e.g., wage adjustment index data, occupational mix data, direct and indirect graduate medical education payments, new technology add-on payments, etc.).
By far one of the most substantial recent changes made to the acute care hospital IPPS is the severity adjustment to DRGs, in which CMS appends secondary diagnosis codes to the DRG system according to the level of complications, comorbidities, and excess resource use associated with a particular beneficiary’s stay. This new DRG system, referred to as Medicare Severity (MS)-DRGs, was introduced for a small subset of DRGs for reimbursements in FY 2006, and phased in for the full set of DRGs over FYs 2007 and 2008 (CMS, 2013a). This major change may be a key driver of the relatively high numbers of comments received on the FYs 2006 and 2007 rules (1,417 and 1,817 respectively).
For FY 2013 onward, CMS began imposing payment adjustments through the Hospital Readmissions Reduction Program and the Hospital Value-Based Purchasing (VBP) Program. The first program applies a downward adjustment to the operating base rates for hospitals with comparatively low performance on readmissions within 30 days; the second reduces the operating base rate for participating hospitals and permits higher value-based incentive payments dependent on hospital quality metrics. Both adjustments represent a substantial shift in health care reimbursement toward paying for performance, rather than traditional compensation for services rendered (CMS, 2013a), and could motivate additional comments.
Also of note is the passage of the Patient Protection and Affordable Care Act (PPACA, Public Law 111-148) on March 23, 2010. CMS noted in the FY 2011 proposed rule (published May 04, 2010) that “due to the timing of the passage of the legislation, [CMS is] unable to address those provisions in this proposed rule.” CMS indicated plans to issue separate documents and instructions for implementing provisions of P.L. 111-148 that affect the payment rate policies for FYs 2010 and 2011 (75 FR 23851). However, despite this explicit circumvention of PPACA
* While proposed MS-DRG relative weights for each FY are publicly available, only proposed weights from FY 2011 forward is available in a structured format. All final weights are available in a structured format. Manually entering the proposed weight data would be a burdensome task: as of the FY2014 final rule, there were 751 MS-DRG classifications.

Data
Put Your Comment Where Your Money Is 19
provisions in the FY 2011 rule, it is probable that the heightened public attention on health care payment issues contributed to the moderately high number of comments received for that rule (639).

Put Your Comment Where Your Money Is 20
IV. Analysis and Discussion
COMMENTER MIX This section provides an examination of the composition of the commenters within the sample according to the authors’ areas of expertise and the organizations’ perspectives.
Commenter Domains I use the term “domain” to indicate the field or perspective represented by the author or organization submitting a comment. Figure 1 below depicts the concentration of expertise across several areas. Providers (both organizations and clinicians) greatly surpass all other submissions – unsurprisingly, as these rules directly govern the payments made to these commenters. Health care industry organizations (such as device manufacturers, pharmaceutical companies, and reimbursement contractors) make up a substantial portion of the remaining comments submitted. While these organizations are not directly paid through the IPPS rules, they serve as vendors to the direct payees and are thus indirectly affected by IPPS rates.
Figure 1. Total number of comments across commenter domains.
I further examine this distribution by incorporating the internal and external contextual data retrieved for each rule. The distributions of commenter domains for various external and internal factors are presented in Figure 2 below. Noticeably, Tavenner presided over a substantially larger fraction of industry, government, academic, and public interest commenters (Panel A); this may a skewed representation, as she only presided over one year in this dataset. However, a CMS Administrator status confirmed by Congress is associated with a larger fraction of industry organizations (Panel B). It is possible that Tavenner’s role as the newly confirmed Administrator amidst the continued implementation of the PPACA is associated with the changing proportions. Additionally, Republican majority position is associated with fewer comments from provider organizations and more comments from clinicians (Panels C, D, and E).

Analysis and Discussion
Put Your Comment Where Your Money Is 21
Figure 2. Share of comments by commenter domain, across contextual factors.
Panel A: CMS Administrator; Panel B: Indicator of Congressional confirmation of CMS Administrator; Panel C: President; Panel D: Majority party of the U.S. House of Representatives; Panel E: Majority party of the U.S. Senate.
Commenter Expertise I use the term “expertise” to represent specific indicators of authors’ subject matter knowledge, via job position, degrees, and certificates. Of the 370 comments in this sample, 62% were submitted by authors with at least one form of identifiable subject matter expertise. Figure 3 below depicts the concentration of expertise across several areas. Medicine and health, by far, dominate the sample, which is to be expected given the distribution of commenter domains discussed previously.
Figure 3. Total number of comments across commenter areas of expertise.
However, given the domain distribution, it is likely that provider organizations possess a large share of these other areas of expertise. This is confirmed by examining the proportions of expertise across the domains, as depicted in Figure 4 below. Indeed, provider organizations possess a majority of the finance and accounting expertise.

Analysis and Discussion
Put Your Comment Where Your Money Is 22
Figure 4. Share of comments across commenter domains and areas of expertise.
I further examine this distribution by incorporating the internal and external contextual data retrieved for each rule. The distributions of commenter areas of expertise for various external and internal factors are presented in Figure 5 below.
Figure 5. Share of comments by commenter areas of expertise, across contextual factors.
Panel A: CMS Administrator; Panel B: Indicator of Congressional confirmation of CMS Administrator; Panel C: President; Panel D: Majority party of the U.S. House of Representatives; Panel E: Majority party of the U.S. Senate.
Noticeably, Democratic majority position is associated with more comments from authors with expertise in healthcare finance and accounting (Panels C, D, and E).

Analysis and Discussion
Put Your Comment Where Your Money Is 23
Constituency Level I use the term “constituency level” to indicate the geographic level with which an organization is concerned (e.g., e.g., ‘local’ for a community hospital, ‘global’ for an international pharmaceutical corporation). Figure 6 below depicts the distribution of comments across these levels of constituency. Local constituencies vastly outnumber all other levels, though national and state constituencies are sizeable.
Figure 6. Total number of comments across levels of constituency.
However, despite the overall dominance of local interests, national interests appear to be growing in the number of comments submitted in recent years (possibly due to the PPACA) and have surpassed local interests. Figure 7 depicts the distribution for each FY. Global and state constituencies appear to be represented at roughly the same levels across the decade, though they fluctuate from year to year without any specific trend.
Figure 7. Distribution of levels of constituency, by fiscal year.

Analysis and Discussion
Put Your Comment Where Your Money Is 24
GEOGRAPHIC MIX The distribution of comments across the U.S. Census Bureau divisions is presented in Figure 8 below (a list of the Census divisions is provided in Appendix F). The South Atlantic division, which encompasses Washington, D.C., provides the largest supply of comments, while the Midwest and Northeast regions make up most of the remaining portions. However, these regions appear to fluctuate greatly over time, as shown in Figure 9.
Figure 8. Total number of comments across U.S. Census Bureau divisions.
Figure 9. Share of comments across U.S. Census Bureau divisions, by FY.
Values reflect percentage of comments with a known location in the U.S., and do not include comments from organizations in foreign countries (count: 4) or comments with unknown locations (count: 16).

Analysis and Discussion
Put Your Comment Where Your Money Is 25
When drilling down to the total number of comments per state (as depicted in Figure 10), it becomes clear that a few areas have a clear dominance with respect to numbers: D.C., California, Illinois, and Connecticut, followed by Texas and Pennsylvania.
Figure 10. Distribution of the total number of comments, for all FYs.
Notably, Washington, D.C. is clearly the driver of the dominance of the South Atlantic division in the previous charts, as the nearby states in the division rank on the lower end of contributing states. This may be due to both the increased access to information about executive agency activities available in the city, and the presence of most national association headquarters in the city.
The relatively large populations of these dominant states may be substantially skewing their representation on this map. A per capita adjustment (using 2013 population estimates from the U.S. Census Bureau) is presented in Figure 17 of Appendix G. However, even with this adjustment, the dominance of the Northeast and Midwest persists, and D.C.’s comments per capita value is the highest above all. California, New York, and Texas all fall to the bottom of the distribution when adjusting for population.
Figure 11 below presents the state distribution of comments according to the domain of the organization. As expected, most of the providers are located in states with the higher comment numbers, as providers comprise the majority of commenters.
1+ 5+ 10+ 15+ 20+

Analysis and Discussion
Put Your Comment Where Your Money Is 26
Figure 11. Distribution of comments by domain, for all FYs. Provider (Organization) Provider (Clinician)
Patient Payer
Industry Academic / Public Interest
Government comments came from California, Illinois, Massachusetts, Tennessee, and Washington, D.C.

Analysis and Discussion
Put Your Comment Where Your Money Is 27
Figure 12 below presents the distribution of comments across states, by the level of constituency or target market of the commenting organization. Local constituencies are spread similarly to the total distribution of comments, but national constituencies have loci in D.C., Illinois, and Virginia.
Figure 12. Distribution of comments by constituency level, for all FYs. Local State
National Global
TRENDS AROUND PROPOSED RULES This section examines trends and relationships with respect to proposed rules, emphasizing the proposed changes to DRG standard update percentages and DRG relative weights as compared to the previous year, and the number of comments received in response to a proposed rule.
Proposed Payment Changes Relative to National Health Expenditures CMS updates IPPS rates with the purpose of compensating providers appropriately for services in a given fiscal year. It is therefore reasonable to assume that proposed updates to these rates should be responsive to the growth in national health expenditures. I compute an ordinary least

Analysis and Discussion
Put Your Comment Where Your Money Is 28
squares (OLS) regression estimate for the percentage growth in national health expenditures relative to the previous year in relation to proposed changes to DRG updates and weights. I report the resultant coefficients from this regression in Table 5 below.
Table 5. Ordinary least squares regression coefficients for growth in national health expenditures.
Variable (1) (2) (3) (4)
Δ from average MDC weight in Previous FY Final Rule
0.00930 (0.0304)
Δ from median MDC weight in Previous FY Final Rule
0.0325 (0.0351)
Δ from Update % in Previous FY Final Rule (full update)
0.0414 (1.120)
Δ from Update % in Previous FY Final Rule (reduced update)
-0.863 (0.739)
Constant 0.0369*** 0.0368*** 0.0551*** 0.0487*** (0.00129) (0.000655) (0.00665) (0.00553)
R2 0.045 0.300 0.000 0.163
Standard errors in parentheses. *** p<0.01, ** p<0.05, * p<0.1
While none of these coefficients are significant, the sign for the coefficient on most of these updates is positive, supporting a general trend of increasing IPPS rates with increasing expenditures.
Only the sign on the reduced update (a lesser base update rate imposed as a penalty for not providing adequate quality metrics) is negative. It is possible that as expenditures increase, CMS reduces the penalty update further in order to provide some financial relief to itself while also making the penalties stronger. It is also possible that these penalties are already intended to increase in a scheduled fashion, and this just happens to track with health expenditures (which tend to increase over time).
Number of Comments Received Relative to Contextual Factors I explore the relationship between the number of comments received relative to various internal and external contextual factors. These OLS regression estimates are provided in Table 6 below. Without political control variables added into the regression equations, the signs for the relationship between the number of comments and the growth in health expenditures, the comment period length (in days), and the length of the proposed rule (in pages) are all consistent. Growth in health expenditures is positively related to the number of comments. The length of the comment period is positively related to the number of comments, which could suggest that commenters take advantage of longer comment windows and submit more comments.

Analysis and Discussion
Put Your Comment Where Your Money Is 29
Conversely, the page length of the proposed rule is negatively related to the number of comments, which could suggest that commenters are daunted by longer proposed rules and make fewer comments on these.
Table 6. Ordinary least squares regression coefficients for number of comments received.
Variable (1) (2) (3) (4) (5) (6) (7)
Growth in National Health Expenditures
9,617 11,485 -72,683 -77,021 -79,875 (9,949) (15,865) (67,988) (46,404) (57,990)
Comment Period Length (days)
37.57 15.78 84.74 -11.28 -2.125 (37.75) (51.76) (73.36) (56.20) (81.73)
Length of Proposed Rule (pages)
-0.281 -1.262 2.598 0.591 0.578 (1.681) (2.156) (3.668) (3.149) (3.819)
Obama -2,288 -1,675 -1,685 (1,802) (1,339) (1,624)
Republican House -366.8 -402.2 (572.0) (715.1)
Republican Senate 1,990* 2,074 (702.3) (946.7)
CMS Administrator confirmed
-101.0 (497.8)
Constant 174.9 -1,021 826.6 -100.2 819.1 5,660* 5,464 (572.9) (1,741) (756.8) (2,307) (2,313) (2,256) (2,901)
R2 0.105 0.110 0.003 0.187 0.385 0.857 0.860
Standard errors in parentheses. *** p<0.01, ** p<0.05, * p<0.1
Once the dummy political control variables are incorporated into the regression equations, the signs move sporadically and speculation on these relationships is no longer possible.
Types of Commenters Relative to Proposed Payment Changes For each FY, I generated the percentage composition of commenters for areas of expertise, domains, and levels of constituency. I then estimated correlation coefficients for these composition shares and the proposed payment changes. A summary of these correlation relationships is reported in Table 7 below, with signs indicating the strength of the relationship. In general, a positive relationship indicates that the proportion of comments with a particular characteristic increases as the proposed payment change increases (or as both decrease). In other words, more comments are submitted as the payment rates improve (relative to previous FY). A negative relationship indicates that the proportion of comments with a particular characteristic increases as the proposed payment change decreases, or that the proportion of comments

Analysis and Discussion
Put Your Comment Where Your Money Is 30
decreases as the proposed payment change decreases. Restated, more comments are submitted as the payment rates get worse (relative to the previous FY). Essentially, these correlations are meant to describe the response of the commenter population to proposed rate changes. However, it is important to note that the percentage shares of commenters are by default relative, and these correlations may have numerous interpretations.
Table 7. Pearson correlation coefficient matrix for payment changes from the previous FY final rule to the proposed rule, and percentage share of commenter characteristics within the sample.
% Share within FY Sample Difference between proposed value and value from
previous FY final rule
(1) (2) (3) (4)
EXPERTISE Medicine / Health Law - - - Health and Business Administration - - * - - * - - - Healthcare Finance and Accounting ++ Public Policy / Legislative Affairs - - * - - * DOMAIN Academic or Public Interest - - - Government - - - Industry Patient + + Payer Provider (Clinician) Provider (Organization) + + CONSTITUENCY LEVEL Global Local ++ ++ National - - - - - * State -
* p<0.1. For correlation coefficient r (- -) indicates r < -0.75, (-) indicates -0.75 ≤ r < -0.5, (+) indicates 0.5 ≤ r < 0.75, and (++) indicates r > 0.75.
(1) Change from update % in previous FY Final Rule (full update); (2) Change from update % in previous FY Final Rule (reduced update); (3) Change from average MDC weight in previous FY Final Rule; (4) Change from median MDC weight in Previous FY Final Rule.
With respect to expertise, there are strong, significant negative correlations between commenters with health and business administration expertise and the update percentages (columns 1 and 2), as well as between commenters with public policy and legislative affairs expertise and the update percentages. This relationship suggests that as CMS proposes more drastic rate reductions, more commenters with expertise in these areas make submissions. Also of note are the unilaterally negative correlations for commenters with national constituencies (with one strong, significant

Analysis and Discussion
Put Your Comment Where Your Money Is 31
correlation), which might represent the responsiveness of national professional and organizational associations to rate changes that are highly salient for their members.
The lack of any strong correlations among commenters who are providers (either clinicians or organizations) may indicate adversarial interests among the provider community, as through the relative weight mechanism (columns 3 and 4) there will inevitably be winners and losers within this group of commenters. However, the lack of any strong correlations for the update percentages (columns 1 and 2) may counter this point.
TRENDS AROUND FINAL RULES This section examines trends and relationships with respect to final rules, emphasizing the final changes to DRG standard update percentages and DRG relative weights as compared to those in the proposed rule, and length of time necessary for CMS to incorporate responses to comments and issue the final rule.
Final Payment Changes Relative to Number of Comments It is possible that there is a direct relationship between the total number of comments received and the magnitude of the revision made to a proposed change, though this relationship lacks any nuance. To check this, I compute an ordinary least squares (OLS) regression estimate for the number of comments received in relation to the final changes to DRG updates and weights. I report the resultant coefficients from this regression in Table 8 below. There is no significance to any of these coefficients, nor is there any consistency in the direction of the relationship.
Table 8. Ordinary least squares regression coefficients for number of comments received.
Variable (1) (2) (3) (4)
Absolute Δ from median MDC weight in Proposed Rule
-84,815 (80,673)
Absolute Δ from average MDC weight in Proposed Rule
22,358 (134,353)
Absolute Δ from update % in Proposed Rule (full update)
34,455 (83,571)
Absolute Δ from update % in Proposed Rule (reduced update)
-5,274 (47,711)
Constant 591.8** 467.9 628.0** 720.7** (125.7) (174.2) (255.5) (235.4)
R2 0.356 0.014 0.021 0.002
Standard errors in parentheses. *** p<0.01, ** p<0.05, * p<0.1

Analysis and Discussion
Put Your Comment Where Your Money Is 32
Length of Revision Period Relative to Contextual Factors I explore the relationship between the length of the revision period (the time necessary for CMS to incorporate responses to comments and issue the final rule), the number of comments received, and various internal and external contextual factors. These OLS regression estimates are provided in Table 9 below. Though there are not statistically significant correlations, the number of comments received remains positively related to the revision period length across all regressions, a logical association considering the labor constraints of manually reviewing comments. The page length of the proposed rule is usually negatively associated with the revision period length; while an interpretation is not immediately clear, it is possible that the effects of the page length of the proposed rule are also conflated with the number of comments received (as discussed previously).
Table 9. Ordinary least squares regression coefficients for revision period length (in days).
Variable (1) (2) (3) (4) (5) (6)
Number of Comments Received
0.00204 0.00149 0.00202 0.0163 0.0148 (0.00788) (0.00769) (0.00934) (0.0102) (0.0108)
Length of Proposed Rule (pages)
-0.0442 -0.0438 -0.0421 0.000193 -0.0185 (0.0343) (0.0366) (0.0419) (0.0605) (0.0678)
Obama 1.196 -11.23 -5.258 (9.841) (11.63) (14.34)
Republican House 3.734 0.770 (16.52) (17.73)
Republican Senate -35.11 -22.25 (25.84) (31.59)
CMS Administrator confirmed
-7.845 (9.876)
Constant 56.77*** 77.53*** 76.30*** 74.59** 60.57 69.44 (6.833) (15.43) (17.63) (23.65) (30.68) (34.09)
R2 0.008 0.172 0.177 0.179 0.720 0.769
Standard errors in parentheses. *** p<0.01, ** p<0.05, * p<0.1
Final Payment Changes Relative to Types of Commenters As with previous estimates in Table 7 on page 30, I also estimated correlation coefficients for the commenter composition shares and the final payment changes. A summary of these correlation relationships is reported in Table 10 below, with signs indicating the strength of the relationship. In general, a positive relationship indicates that the final payment change increases as proportion of comments with a particular characteristic increases (or as both decrease). In other words, the payment rates improve (relative to the proposed rule) as more comments are

Analysis and Discussion
Put Your Comment Where Your Money Is 33
submitted. A negative relationship indicates that the final payment change increases as the proportion of comments with a particular characteristic decreases, or that the final payment change decreases as the proportion of comments increases. Restated, the payment rates get worse (relative to the proposed rule) as more comments are submitted. Essentially, these correlations are meant to describe the response by CMS to comments received. However, it is important to again note that the percentage shares of commenters are by default relative, and these correlations may have numerous interpretations.
Table 10. Pearson correlation coefficient matrix for payment changes from proposed rule to final rule, and percentage share of commenter characteristics within the sample.
% Share within FY Sample Difference between final value and proposed value
(1) (2) (3) (4)
EXPERTISE Medicine / Health -‐ -‐ + Law + Health and Business Administration + + -‐ Healthcare Finance and Accounting -‐ -‐ * Public Policy / Legislative Affairs ++ ++ -‐ -‐ * DOMAIN Academic or Public Interest + Government ++ Industry ++ -‐ Patient -‐ -‐ ++ Payer -‐ + Provider (Clinician) + + -‐ -‐ Provider (Organization) + CONSTITUENCY LEVEL Global ++ Local -‐ National ++ * State
* p<0.1. For correlation coefficient r (- -) indicates r < -0.75, (-) indicates -0.75 ≤ r < -0.5, (+) indicates 0.5 ≤ r < 0.75, and (++) indicates r > 0.75.
(1) Change from update % in Proposed Rule (full update); (2) Change from update % in Proposed Rule (reduced update); (3) Change from average MDC weight in Proposed Rule; (4) Change from median MDC weight in Proposed Rule.
With respect to expertise, there is a strong, significant negative correlation between commenters with healthcare finance expertise and the final median DRG relative weights (column 4), as well as between commenters with public policy and legislative affairs expertise and the average DRG relative weights (column 3). This relationship suggests comments from these experts are related

Analysis and Discussion
Put Your Comment Where Your Money Is 34
to overall decreases in payment rates in the final rule. Also of note is the strong, significant positive correlation between commenters with national constituencies and median DRG relative weights, suggesting a greater change to the final rule in relation to the presence of these commenters.
The lack of any strong correlations among commenters who are providers (either clinicians or organizations) may indicate adversarial interests among the provider community, as through the relative weight mechanism (columns 3 and 4) there will inevitably be winners and losers within this group of commenters. However, the lack of any strong correlations for the update percentages (columns 1 and 2) may counter this point.
Interestingly, patients have a slight negative correlation with update percentages, as patient comments are associated with decreases in update percentages. In contrast, clinicians have a slight positive correlation with these update percentages. These relationships can be very coarsely reduced to patient desires to pay less, and clinician desires to be paid more.

Put Your Comment Where Your Money Is 35
V. Conclusion A few clear characteristics of comments on proposed Medicare acute care hospital IPPS rules in the past decade emerge from this analysis. These comments are predominately submitted by providers (both organizations and clinicians), which is unsurprising as these rules directly govern the payments made to these groups. These comments are also usually submitted by individuals with identifiable expertise in the areas of medicine, health, law, health administration, business administration, healthcare finance and accounting, public policy, or legislative affairs. The majority of comments are concentrated in Washington, D.C., while the Northeast and Midwest supply comparatively large numbers of comments. Comments on behalf of local constituents far outnumber those of all other constituencies in the total sample, but comments for national-level constituencies have begun to overshadow local constituency numbers in recent years.
There are some discernable relationships between the number of comments received from public policy, legislative affairs, health administration, and business administration experts and the degree to which CMS proposes to reduce payments, as well as between the number of comments received from public policy, legislative affairs, and healthcare finance and accounting experts and the degree to which CMS establishes lower payment values in its final rules. This might suggest that these commenters respond to the content of proposed rules, and that CMS regularly incorporates feedback from these commenters. It might also suggest more homogeneity amongst these commenter groups, and any responsiveness relationships present among other commenter groups may be masked by heterogeneity of opinions and positions.
Comments on behalf of national constituencies are also associated with proposed reductions and final rule increases – a reductionist view of this relationship could purport that national commenters are distinctly responsive to proposed changes, and that CMS is responsive to national commenters when finalizing the changes.
Notably, there is a distinct difference between the content of comments sent by professional organizations with substantial expertise, and individual patients. Patients typically submit general, subjective, anecdotal statements; Figure 13 below presents the text of a patient’s comment as a sample.
Figure 13. Example of comment from an individual patient. I suffer from chronic pain due to Arachnoiditis. I have had a neurostimulator and because of it I was able to continue to work for 4 years. I also have an infusion pump that has enabled me to lead a semblance of a life. Without either of them I do not know what I would have done. It was difficult to get my second pump due to the remibursement rates. Almost no stimulators are being implanted in Louisville because of the reimbusement, which is irresponsible of the government and few hospitals are implanting the pump for the same reasons. It is a crime that people that would be able to have some dignity and semblance of quality of life are denied it because the govenment sees fit to cut the costs. Government employees, such as senators and representatives have their own health insurance and would never be denied these items because of costs. They might change their tunes if they had to rely on Medicare and Medicaid.
Comments from professional organizations and individuals with visible expertise take on a different form entirely, often drawing upon data to present arguments for changes to the

Conclusion
Put Your Comment Where Your Money Is 36
methodology. Figure 14 below presents an excerpt from the comment submitted by a hospital association.
Figure 14. Excerpt from a comment by a hospital association with expertise.
The provider organizations very often advocate changes to the methodology for calculating payments, and these are usually the types of changes that CMS incorporates into its final rule. However, provider organizations, as presumably rational economic actors, have estimated the outcome and impact of any advocated methodology change and likely determined that the change will deliver a net benefit to the organization.
CMS may rely on affected organizations to identify methodological mistakes, but these organizations are not necessarily incentivized to identify mistakes that help those organizations. The small number of comments from patients, academics, and public interest groups, and the relatively limited nuance of comments by patients, represents a gap in the representation of other indirectly affected parties in the notice-and-comment rulemaking process. It is possible that a counterbalance to the check that provider organizations provide on CMS proposals does not effectively exist.
Finally, the lack of clear directional relationships between commenters who are providers (either clinicians or organizations) and the changes to payment rates may indicate adversarial interests among the provider community. In the advent of restructuring payments and provider organizations through bundled payments and accountable care organizations (both CMS-led initiatives), it is possible that providers may align their interests and these new relationships may make an impact on the commenting behavior of the provider community.

Conclusion
Put Your Comment Where Your Money Is 37
This project was originally intended to examine the specific positions advocated by commenters in the text of their comments. Due to time and human resource constraints, I could not complete this undertaking. However, a deeper investigation into the relationship between the specific changes made to proposed rules and the corresponding positions advocated by commenters may provide much greater insights into the effective role of public comments in rulemaking.

Put Your Comment Where Your Money Is 38
Appendices
APPENDIX A. COLLECTED RULE DATA Table 11. Collected proposed and final rules, and any associated notices and corrections.
FY Citation Type
2005 69 FR 48915 Final Rule
2005 69 FR 60242 Final Rule - Correction or Supplemental
2005 69 FR 69536 Final Rule - Correction or Supplemental
2005 69 FR 78526 Final Rule - Correction or Supplemental
2005 70 FR 71006 Final Rule - Correction or Supplemental
2005 69 FR 28196 Proposed Rule
2005 69 FR 35920 Proposed Rule - Correction or Supplemental
2006 70 FR 47278 Final Rule
2006 70 FR 57161 Final Rule - Correction or Supplemental
2006 70 FR 57785 Final Rule - Correction or Supplemental
2006 70 FR 23306 Proposed Rule
2007 71 FR 47870 Final Rule
2007 71 FR 58286 Final Rule - Correction or Supplemental
2007 71 FR 59886 Notice
2007 72 FR 13798 Notice
2007 72 FR 569 Notice
2007 71 FR 23996 Proposed Rule
2007 71 FR 28644 Proposed Rule - Correction or Supplemental
2008 72 FR 47129 Final Rule
2008 72 FR 57634 Final Rule - Correction or Supplemental
2008 72 FR 62585 Final Rule - Correction or Supplemental
2008 72 FR 66580 Final Rule - Correction or Supplemental
2008 73 FR 9860 Final Rule - Correction or Supplemental
2008 72 FR 24680 Proposed Rule
2008 72 FR 31507 Proposed Rule - Correction or Supplemental

Appendices
Put Your Comment Where Your Money Is 39
FY Citation Type
2009 73 FR 48434 Final Rule
2009 73 FR 57541 Final Rule - Correction or Supplemental
2009 73 FR 79664 Final Rule - Correction or Supplemental
2009 73 FR 57888 Notice
2009 73 FR 73656 Notice
2009 73 FR 23528 Proposed Rule
2010 74 FR 43754 Final Rule
2010 74 FR 51496 Final Rule - Correction or Supplemental
2010 75 FR 31118 Notice
2010 75 FR 34614 Notice
2010 74 FR 24080 Proposed Rule
2010 74 FR 26600 Proposed Rule - Correction or Supplemental
2011 75 FR 50041 Final Rule
2011 75 FR 60640 Final Rule - Correction or Supplemental
2011 76 FR 19365 Notice
2011 75 FR 23851 Proposed Rule
2011 75 FR 30756 Proposed Rule - Correction or Supplemental
2011 75 FR 30917 Proposed Rule - Correction or Supplemental
2011 75 FR 34611 Proposed Rule - Correction or Supplemental
2012 76 FR 51475 Final Rule
2012 76 FR 59263 Final Rule - Correction or Supplemental
2012 77 FR 4908 Final Rule - Correction or Supplemental
2012 77 FR 23722 Notice
2012 76 FR 25787 Proposed Rule
2012 76 FR 34633 Proposed Rule - Correction or Supplemental
2012 76 FR 41178 Proposed Rule - Correction or Supplemental

Appendices
Put Your Comment Where Your Money Is 40
FY Citation Type
2013 77 FR 53257 Final Rule
2013 77 FR 60315 Final Rule - Correction or Supplemental
2013 77 FR 63751 Final Rule - Correction or Supplemental
2013 77 FR 65495 Final Rule - Correction or Supplemental
2013 78 FR 14689 Notice
2013 78 FR 15882 Notice
2013 77 FR 27869 Proposed Rule
2013 77 FR 34326 Proposed Rule - Correction or Supplemental
2014 78 FR 27485 Proposed Rule
2014 78 FR 38679 Proposed Rule - Correction or Supplemental
2014 78 FR 50495 Final Rule
2014 78 FR 61197 Final Rule - Correction or Supplemental
APPENDIX B. IPPS RATE-SETTING METHODOLOGY The Medicare IPPS for Acute Care Hospitals was established in 1983 (Social Security Amendments of 1983). The acute care hospital inpatient operating and capital-related prospective payment systems pay hospitals a “predetermined amount per discharge for inpatient hospital services furnished to Medicare beneficiaries” (42 CFR §412.62(a)) that is to be accepted as payment in full (CMS, 2013A). Schematic diagrams for the components of the operating and capital base payment rates are provided in Figure 15 and Figure 16.
IPPS payments rates are established by applying a set of adjustments to a standardized discharge amount, which is a standardized base payment amount set for “the operating and capital costs that efficient facilities are expected to incur in furnishing covered inpatient services,” (CMS, 2013A). This amount is divided into an operating costs amount and a capital costs amount. These base rates are raised proportionately via annual updates in the absence of other policy changes.
The operating base rate includes a labor-related component and a nonlabor-related component. The labor-related share is adjusted by an area wage index in order to incorporate the “expected differences in local market prices for labor” (CMS, 2013A). The wage index compares the average hourly wage for hospital workers in Core-Based Statistical Areas (as defined by OMB) to the national average (CMS, 2013A).
Each patient discharge is assigned to diagnosis-related groups (DRGs), which form a classification system that “groups similar clinical conditions (diagnoses) and the procedures furnished by the hospital during the stay,” (CMS, 2013a). DRG relative weights are established to reflect the relative cost of one DRG compared to the average of all Medicare cases; these

Appendices
Put Your Comment Where Your Money Is 41
weights are recalibrated annually (CMS, 2013a). These weights adjust for the differences in treatment costs required for different types of medical conditions.
DRG weights are reduced for transfers of beneficiaries to a hospital. Each transfer DRG case weight is multiplied by a transfer adjustment factor, equal to the lesser of 1.0 or the ratio of the case length of stay to the geometric mean length of stay for that DRG (42 C.F.R. §412.328(c)). For extremely costly cases, hospitals are paid an outlier payment that compensates them for a majority percentage of their case-specific costs exceeding a specific fixed-loss threshold established annually (CMS, 2013a).
Teaching and residency training hospitals incur higher costs relative to non-teaching hospitals. To compensate for these costs, IPPS rates are modified by an indirect cost of graduate medical education (IME) adjustment payment. IME payments are calculated for each hospital according to the ratio of the number of medical, osteopathic, dental, or podiatry residents trained to the number of inpatient beds (CMS, 2013a).
Hospitals incur higher relative costs when they treat a disproportionate share of low-income patients. To compensate for these costs, IPPS rates include a disproportionate share hospital (DSH) adjustment. This adjustment is calculated relative to the disproportionate patient percentage (DPP, equal to the sum of the percentage of Medicare inpatient days attributable to patients eligible for both Part A of Medicare and Supplemental Security Income (SSI) and the percentage of total patient days attributable to patients eligible for Medicaid but not Part A). Hospitals qualify for DSH adjustment if they exceed a specified DPP threshold, with some special exceptions (CMS, 2013a).
Hospitals utilizing new medical services and technologies that are demonstrated to be inadequately paid under the IPPS can receive a new technology add-on payment equal to a percentage of the marginal factor costs of the new technology in excess of the DRG payment (CMS, 2013b).
The readmissions adjustment amount and the hospital value-based purchasing adjustment amount will not be included in this study, as they were introduced to the IPPS rate methodology in 2012 (CMS, 2013a). The transfer adjustment factor and the new technology add-on payment are not likely to be selected for use in this study, as both represent calculations based on simple ratios and are unlikely to change. Additionally, the DSH and IME adjustments are issued by provider, and may be beyond the scope of this project.

Appendices
Put Your Comment Where Your Money Is 42
Figure 15. Acute Care Hospital Inpatient Prospective Payment System Operating Base Payment Rate.
Source: CMS, 2013a.

Appendices
Put Your Comment Where Your Money Is 43
Figure 16. Acute Care Hospital Inpatient Prospective Payment System Capital Base Payment Rate.
Source: CMS, 2013a.
APPENDIX C. SUMMARY OF VARIABLES IN DATASET Table 12. Summary of variables in consolidated dataset.
Category Variable Type Possible Values / Range
Expertise Medicine/Health Binary 1 if yes
Expertise Law Binary 1 if yes
Expertise Healthcare/Business Administration & Leadership
Binary 1 if yes
Expertise Healthcare Finance & Accounting Binary 1 if yes
Expertise Public Policy/Legislative Binary 1 if yes
Perspective Entity domain Categorical Academic or public interest Government Industry Patient Payer Provider (clinician) Provider (organization) Unknown

Appendices
Put Your Comment Where Your Money Is 44
Category Variable Type Possible Values / Range
Perspective Entity category Categorical Academic Association - Advocacy Association – Health Plan Association – Health System Association – Hospital Association – Industry Association – Professional Government – Federal Government – Local Government – State Health Plan Individual – Advocate Individual – Patient Individual – Patient’s Family
Member Individual – Unknown Industry – Device Industry – Drug Industry – Drug and Device Industry – Health Care Industry – Law Firm Industry – Media Provider (Clinician) – Health
Care Professional Provider (Clinician) – Health
Care Student Provider (Clinician) – Nurse Provider (Clinician) – Nurse
Practitioner Provider (Clinician) –
Pharmacist Provider (Clinician) –
Physician Provider (Organization) –
Critical Access Hospital Provider (Organization) –
Health System Provider (Organization) –
Home Health Provider (Organization) –
Hospital Provider (Organization) –
Long-term Care Facility Provider (Organization) –
Psychiatric Hospital
Perspective Entity type Categorical Individual Organization
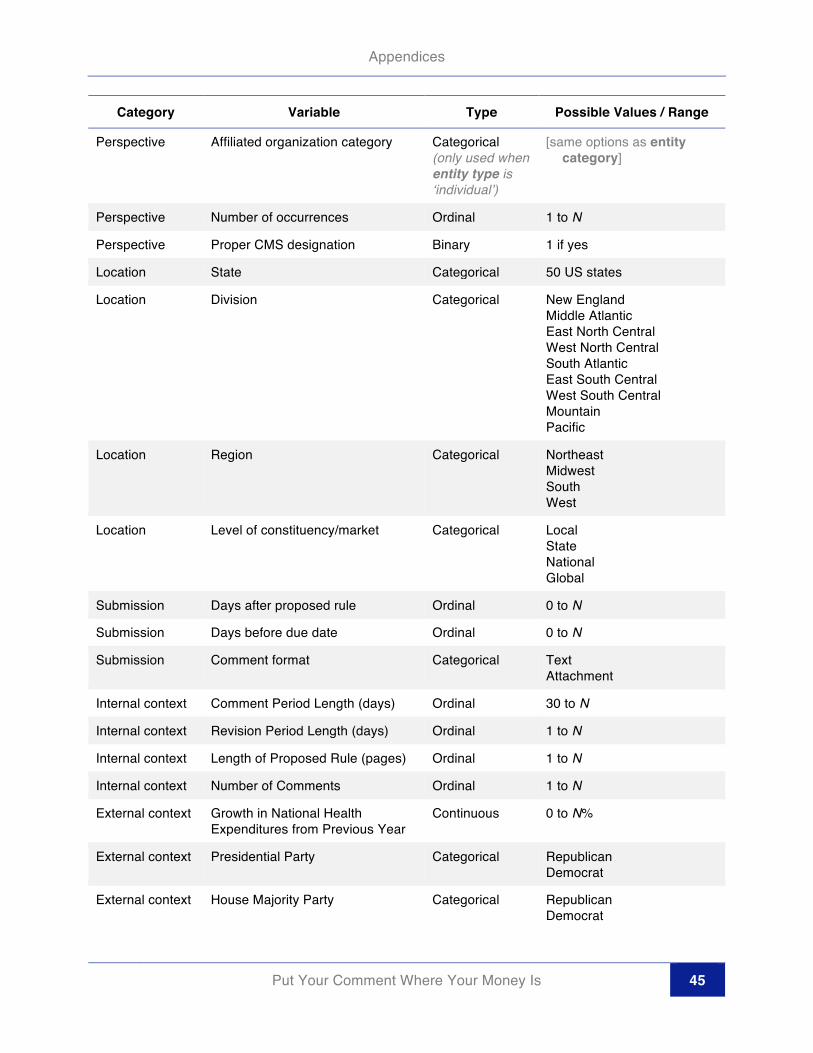
Appendices
Put Your Comment Where Your Money Is 45
Category Variable Type Possible Values / Range
Perspective Affiliated organization category Categorical (only used when entity type is ‘individual’)
[same options as entity category]
Perspective Number of occurrences Ordinal 1 to N
Perspective Proper CMS designation Binary 1 if yes
Location State Categorical 50 US states
Location Division Categorical New England Middle Atlantic East North Central West North Central South Atlantic East South Central West South Central Mountain Pacific
Location Region Categorical Northeast Midwest South West
Location Level of constituency/market Categorical Local State National Global
Submission Days after proposed rule Ordinal 0 to N
Submission Days before due date Ordinal 0 to N
Submission Comment format Categorical Text Attachment
Internal context Comment Period Length (days) Ordinal 30 to N
Internal context Revision Period Length (days) Ordinal 1 to N
Internal context Length of Proposed Rule (pages) Ordinal 1 to N
Internal context Number of Comments Ordinal 1 to N
External context Growth in National Health Expenditures from Previous Year
Continuous 0 to N%
External context Presidential Party Categorical Republican Democrat
External context House Majority Party Categorical Republican Democrat

Appendices
Put Your Comment Where Your Money Is 46
Category Variable Type Possible Values / Range
External context Senate Majority Party Categorical Republican Democrat
Internal context CMS Administrator Categorical Mark McClellan Donald Berwick Marilyn Tavenner
Substantive Difference between proposed base rate (full) update and that of previous FY final rule
Continuous -M to N percentage points
Substantive Difference between proposed base rate (reduced) update and that of previous FY final rule
Continuous -M to N percentage points
Substantive Difference between final rule base rate (full) update and that of proposed rule
Continuous -M to N percentage points
Substantive Difference between final rule base rate (reduced) update and that of proposed rule
Continuous -M to N percentage points
Substantive Average difference between final rule MS-DRG relative weight and that of proposed rule (FYs 2011-2014 only)
Continuous -M to N
Substantive Average difference between proposed MS-DRG relative weight and that of previous FY final rule (FYs 2011-2014 only)
Continuous -M to N
Substantive Median difference between final rule MS-DRG relative weight and that of proposed rule (FYs 2011-2014 only)
Continuous -M to N
Substantive Median difference between proposed MS-DRG relative weight and that of previous FY final rule (FYs 2011-2014 only)
Continuous -M to N
Substantive Average difference between final rule MS-DRG relative weight and that of proposed rule (FYs 2011-2014 only), for each MDC
Continuous -M to N (For each of 26 MDCs)

Appendices
Put Your Comment Where Your Money Is 47
Category Variable Type Possible Values / Range
Substantive Average difference between proposed MS-DRG relative weight and that of previous FY final rule (FYs 2011-2014 only), for each MDC
Continuous -M to N (For each of 26 MDCs)
a. “Base rate” refers to the standardized amount for operating costs, used as the basis for the calculation of the IPPS payment.
b. The update is a percentage, therefore the difference between the percentage updates for various FYs and rules is reported as a percentage point difference, and not as a percentage difference.
APPENDIX D. MAJOR AND IRREGULAR CHANGES TO IPPS SYSTEM A survey of some of the key irregular changes made for reimbursements in each fiscal year is provided in Box 2 below. I interpret ‘regular’ changes to be standard adjustments and updates to existing and recurring components of the payment policies, such as: geographic reclassifications, wage adjustment index data, occupational mix data, direct and indirect graduate medical education payments, new technology add-on payments, sole community hospitals (SCH), Medicare disproportionate share hospitals (DSH), Medicare-dependent hospitals (MDH), low-volume hospitals, outlier cost fixed-loss thresholds, and transfer adjustments.
Box 2. Major irregular changes to acute care hospital IPPS rate rules. Sources other than the text of the rules are noted.
FY2005 IPPS Rates
Implementation of reduction in annual update for hospitals failing to submit quality data Error! Reference source
not found.
FY2006 IPPS Rates
First severity adjustment for small subset of DRGs Error! Reference source not found.
Changes to criteria for transfer adjustment application to DRGs Error! Reference source not found.
FY2007 IPPS Rates
Changes to measures for Reporting of Hospital Quality Data for Annual Hospital Payment Update (RHQDAPU) for full annual update factor eligibility Error! Reference source not found.
Severity refinements to CMS DRGs to generate MS-DRGs; implemented via partial weighting adjustment in FY 2007
FY2008 IPPS Rates
Implementation of preventable Hospital Acquired Conditions (HACs) that are ineligible for higher payment rates Error! Reference source not found.
Complete implementation of MS-DRG system c
Reduction in document and coding payment adjustments Error! Reference source not found.
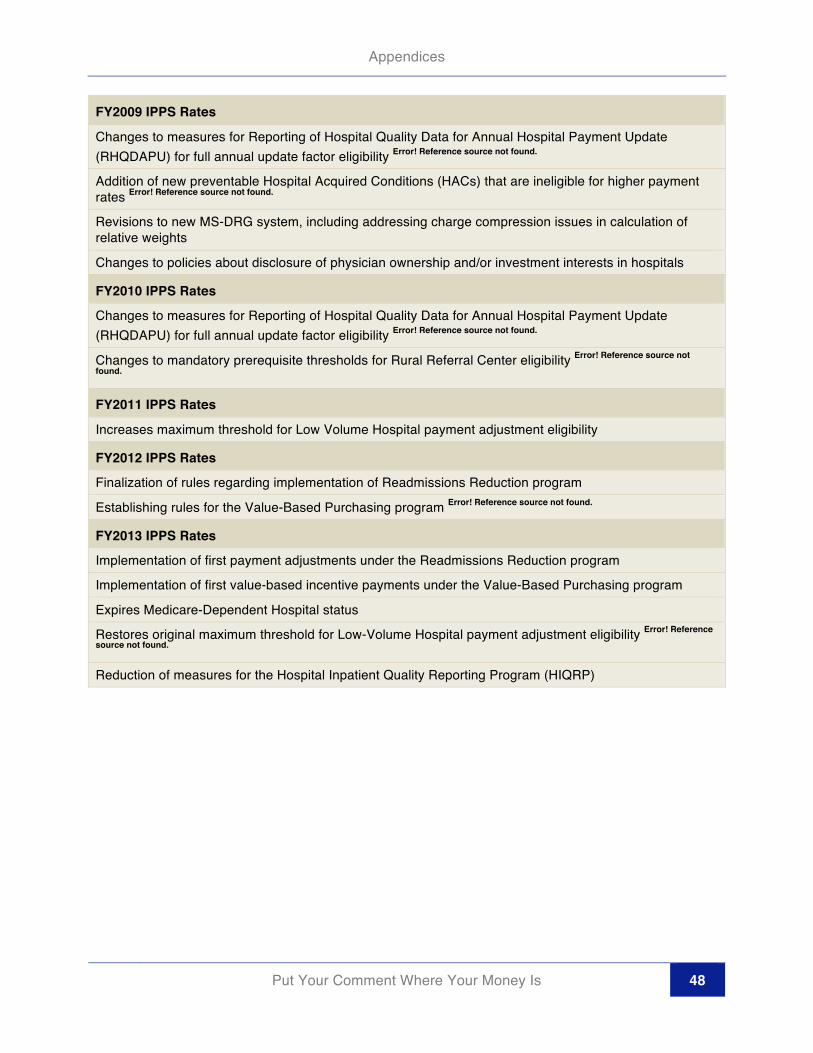
Appendices
Put Your Comment Where Your Money Is 48
FY2009 IPPS Rates
Changes to measures for Reporting of Hospital Quality Data for Annual Hospital Payment Update (RHQDAPU) for full annual update factor eligibility Error! Reference source not found.
Addition of new preventable Hospital Acquired Conditions (HACs) that are ineligible for higher payment rates Error! Reference source not found.
Revisions to new MS-DRG system, including addressing charge compression issues in calculation of relative weights
Changes to policies about disclosure of physician ownership and/or investment interests in hospitals
FY2010 IPPS Rates
Changes to measures for Reporting of Hospital Quality Data for Annual Hospital Payment Update (RHQDAPU) for full annual update factor eligibility Error! Reference source not found.
Changes to mandatory prerequisite thresholds for Rural Referral Center eligibility Error! Reference source not
found.
FY2011 IPPS Rates
Increases maximum threshold for Low Volume Hospital payment adjustment eligibility
FY2012 IPPS Rates
Finalization of rules regarding implementation of Readmissions Reduction program
Establishing rules for the Value-Based Purchasing program Error! Reference source not found.
FY2013 IPPS Rates
Implementation of first payment adjustments under the Readmissions Reduction program
Implementation of first value-based incentive payments under the Value-Based Purchasing program
Expires Medicare-Dependent Hospital status
Restores original maximum threshold for Low-Volume Hospital payment adjustment eligibility Error! Reference
source not found.
Reduction of measures for the Hospital Inpatient Quality Reporting Program (HIQRP)

Appendices
Put Your Comment Where Your Money Is 49
FY2014 IPPS Rates
Disproportionate share hospital (DSH) payment reductions and other policy changes mandated by the Affordable Care Act (ACA) Error! Reference source not found.
Time-based guidelines for inpatient admission status Error! Reference source not found.
New measures for the Value-Based Purchasing (VBP) program, the Readmissions Reduction program, and the Hospital Acquired Condition (HAC) Reduction program Error! Reference source not found.
a. Alston Bird, LLC, 2005. b. Cerner, 2007 c. CMS, 2013a. d. Health Leaders Media, 2008. e. Premier, 2009. f. SunStone, 2012. g. Wisconsin Hospital Association, 2011. h. Florida Hospital Association, 2013.
APPENDIX E. MAJOR DIAGNOSTIC CATEGORIES The 25 Major Diagnostic Categories (MDCs) are provided in Table 13 below. As of FY 2014, there were also 15 MS-DRGs designated as Pre-MDCs (for cases directly assigned on the basis of ICD-9-CM procedure codes), and 11 ungrouped MS-DRGs.
Table 13. Descriptions of Major Diagnostic Categories (MDCs)
MDC MDC Description
1 Diseases and Disorders of the Nervous System
2 Diseases and Disorders of the Eye
3 Diseases and Disorders of the Ear, Nose, Mouth, and Throat
4 Diseases and Disorders of the Respiratory System
5 Diseases and Disorders of the Circulatory System
6 Diseases and Disorders of the Digestive System
7 Diseases and Disorders of the Hepatobiliary System and Pancreas
8 Diseases and Disorders of the Musculoskeletal System and Connective Tissue
9 Diseases and Disorders of the Skin, Subcutaneous Tissue and Breast
10 Endocrine, Nutritional and Metabolic Diseases and Disorders
11 Diseases and Disorders of the Kidney and Urinary Tract
12 Diseases and Disorders of the Male Reproductive System
13 Diseases and Disorders of the Female Reproductive System

Appendices
Put Your Comment Where Your Money Is 50
MDC MDC Description
14 Pregnancy, Childbirth, and the Puerperium
15 Newborns and Other Neonates with Conditions Originating in the Perinatal Period
16 Diseases and Disorders of the Blood and Blood Forming Organs and Immunological Disorders
17 Myeloproliferative Diseases and Disorders and Poorly Differentiated Neoplasms
18 Infectious and Parasitic Diseases (Systemic or Unspecified Sites)
19 Mental Diseases and Disorders
20 Alcohol/Drug Use and Alcohol/Drug Induced Organic Mental Disorders
21 Injuries, Poisonings, and Toxic Effects of Drugs
22 Burns
23 Factors Influencing Health Status and Other Contacts with Health Services
24 Multiple Significant Trauma
25 Human Immunodeficiency Virus Infections
Source: 75 FR 50041
APPENDIX F. U.S. CENSUS BUREAU DIVISIONS Table 14. U.S. Census Bureau Divisions
Region Division States
West Pacific Alaska, California, Hawaii, Oregon, Washington
West Mountain Arizona, Colorado, Idaho, Montana, Nevada, New Mexico, Utah, Wyoming
South West South Central Arkansas, Louisiana, Oklahoma, Texas
South East South Central Alabama, Kentucky, Mississippi, Tennessee
South South Atlantic
Delaware, District of Columbia, Florida, Georgia, Maryland, North Carolina, South Carolina, Virginia, West Virginia
Midwest West North Central Iowa, Kansas, Minnesota, Missouri, Nebraska, North Dakota, South Dakota
Midwest East North Central Illinois, Indiana, Michigan, Ohio, Wisconsin
Northeast Middle Atlantic New Jersey, New York, Pennsylvania

Appendices
Put Your Comment Where Your Money Is 51
Region Division States
Northeast New England Connecticut, Maine, Massachusetts, New Hampshire, Rhode Island, Vermont
Source: U.S. Census Bureau
APPENDIX G. ADDITIONAL GEOGRAPHIC DISTRIBUTION MAPS Figure 17. Distribution of the total number of comments per capita, for all FYs.
1+ 5+ 10+ 15+ 20+

Appendices
Put Your Comment Where Your Money Is 52
Figure 18. Distribution of organizations submitting more than one comment, for all FYs.
1+ 5+ 10+ 15+ 20+

Appendices
Put Your Comment Where Your Money Is 53
Figure 19. Distribution of commenter expertise (all types), for all FYs.
1+ 5+ 10+ 15+ 20+

Appendices
Put Your Comment Where Your Money Is 54
Figure 20. Distribution of commenter expertise types, for all FYs. Medicine / Health Public Policy / Legislative Affairs / Law
Health and Business Administration Healthcare Finance and Accounting

Put Your Comment Where Your Money Is 55
References 42 CFR §412.62. “Prospective Payment Systems For Inpatient Hospital Services.”
5 U.S.C. §§500-596. “Administrative Procedure.”
5 U.S.C. §§701-706. “Judicial Review.”
5 U.S.C. §§801-808. “Congressional Review of Agency Rulemaking.”
75 FR 23851
75 FR 50041
Administrative Procedure Act of 1946, P.L 79-404.
Alston Bird, LLP. “Hospital Inpatient Changes For 2006 Finalized By CMS,” August 5, 2005 (accessed from http://www.alston.com/Files/Publication/1d11cf79-ff28-49bc-94cf-44e067b769ed/Presentation/PublicationAttachment/8f517d7f-1f63-4801-8ba2-707ed1caf614/05-256%20Hospital%20Inpatient%20Changes.pdf).
American Hospital Association, (2013a). “Fast Facts on US Hospitals,” 3 January 2013, accessed from http://www.aha.org/research/rc/stat-studies/fast-facts.shtml on 31 October 2013.
American Hospital Association, (2013b). “Inpatient PPS,” 2013, accessed from http://www.aha.org/advocacy-issues/medicare/ipps/index.shtml on 31 October 2013.
Balla, Steven J. "Administrative procedures and political control of the bureaucracy." American Political Science Review (1998): 663-673.
Carey, Maeve P., (2013). “Counting Regulations: An Overview of Rulemaking, Types of Federal Regulations, and Pages in the Federal Register,” Congressional Research Service, 1 May 2013, 7-5700.
Centers for Medicare and Medicaid Services (CMS), (2012). “NHE Tables,” National Health Expenditure Accounts (NHEA), accessed from http://www.cms.gov/Research-Statistics-Data-and-Systems/Statistics-Trends-and-Reports/NationalHealthExpendData/Downloads/tables.pdf on 15 March 2014.
Centers for Medicare and Medicaid Services (CMS), (2013a). “Acute Care Hospital Inpatient Prospective Payment System,” Medicare Learning Network, Payment System Fact Sheet Series, April 2013, ICN 006815.
Centers for Medicare and Medicaid Services (CMS), (2013b). “New Medical Services and New Technologies,” Acute Inpatient PPS, CMS.gov, accessed from http://www.cms.gov/Medicare/Medicare-Fee-for-Service-Payment/AcuteInpatientPPS/newtech.html on 1 November 2013.
Centers for Medicare and Medicaid Services (CMS), (2014). “Agency Administrators’ Tenure,” accessed http://www.cms.gov/About-CMS/Agency-Information/History/downloads/CMSAdministratorsTenure.pdf on 15 March 2014.
Centers for Medicare and Medicaid Services (CMS), (2014). “CMS Leadership,” accessed from http://www.cms.gov/About-CMS/leadership/ on 15 March 2014.
Cerner. “Assessment of Final 2008 Inpatient Prospective Payment Rule,” August 7, 2007, (accessed from http://www.cerner.com/uploadedFiles/Assessment%20of%202008%20Final%20IPPS%20Rule%20-%20Quality%20Data.pdf).

References
Put Your Comment Where Your Money Is 56
Chevron U.S.A., Inc. v. National Resources Defense Council, 467 U.S. 837, 843–845 (1984).
Croley, Steven P, (1998). "Theories of regulation: Incorporating the administrative process." Columbia Law Review (1998): 1-168.
Farina, C. R., Newhart, M. J., Heidt, J., & eRulemaking Initiative, C. (2013). Rulemaking vs. democracy: Judging and nudging public participation that counts. Michigan Journal of Environmental & Administrative Law, 2(1).
Florida Hospital Association. “Final Rule Summary: Medicare Inpatient Prospective Payment System Federal Fiscal Year 2014,” August 2013, (accessed from file:///Users/ntrebes/Downloads/MCARE_IPPSFR2014PaymentRuleBrief.pdf).
Furlong, S. R. (1997). Interest group influence on rule making. Administration & Society, 29(3), 325–347.
Furlong, S. R. (1998). Political influence on the bureaucracy: The bureaucracy speaks. Journal of Public Administration Research and Theory, 8(1), 39–65.
Furlong, Scott R., and Cornelius M. Kerwin (2005). "Interest group participation in rule making: A decade of change." Journal of Public Administration Research and Theory 15.3 (2005): 353-370.
Golden, Marissa Martino. "Interest Groups in the Rule-Making Process: Who Participates? Whose Voices Get Heard?." Journal of Public Administration Research and Theory 8.2 (1998): 245-270.
GovTrack (2013). “Statistics and Historical Comparison,” GovTrack.us, 2013 (accessed from https://www.govtrack.us/congress/bills/statistics on 31 October 2013).
Health Leaders Media. “CMS releases 2009 IPPS final rule,” August 1, 2008 (accessed from http://www.healthleadersmedia.com/page-1/LED-216269/CMS-releases-2009-IPPS-final-rule##).
Israel, G. D. (2013, June 14). Determining Sample Size. Retrieved March 17, 2014, from https://edis.ifas.ufl.edu/pd006
Kaiser Family Foundation (KFF), (2013). “Medicare and the Federal Budget: Comparison of Medicare Provisions in recent Federal debt and deficit reduction Proposals,” Issue Brief #8124-02, April 2013.
Kaiser Family Foundation. “Total Number of Medicare Beneficiaries,” 2012, http://kff.org/medicare/state-indicator/total-medicare-beneficiaries/
Kerwin, Cornelius M. 2003. Rulemaking: How Government Agencies Write Law and Make Policy. Washington, DC: Con- gressional Quarterly Press.
Kerwin, Cornelius M., and Scott R. Furlong. "Time and rulemaking: An empirical test of theory." Journal of Public Administration Research and Theory 2.2 (1992): 113-138.
Leavitt Partners. “Charlene Frizzera,” 2014, (accessed from http://leavittpartners.com/team/charlene-frizzera/ on 12 April 2014).
Medicare Payment Advisory Commission (MedPAC), (2013). “Health Care Spending and the Medicare Program,” Data Book, June 2013.
Naughton, K., Schmid, C., Yackee, S. W., & Zhan, X. (2009). Understanding commenter influence during agency rule development. Journal of Policy Analysis and Management, 28(2), 258–277.
Office of Inspector General (OIG), (2001). “Medicare Hospital Prospective Payment System: How DRG Rates Are Calculated and Update,” Office of Evaluation and Inspections, Office of Inspector General, U.S. Department of Health and Human Services, August 2001, OEI-09-00-00200.
Premier. “Medicare Hospital Inpatient Operating And Capital Payment Fiscal Year 2010 Proposed Rule,” May 8, 2009, (accessed from

References
Put Your Comment Where Your Money Is 57
https://www.premierinc.com/about/advocacy/issues/reimbursement/inpatient-pps/downloads/FY-2010-IPPS-Proposed-Rule-Premier-Summary.pdf).
Regulations.gov. “Public Comments Make a Difference,” Fact Sheet, 2012, (accessed from http://www.regulations.gov/docs/FactSheet_Public_Comments_Make_a_Difference.pdf on 18 October 2013).
Schmidt, Patrick. "Pursuing regulatory relief: Strategic participation and litigation in US OSHA rulemaking." Business and Politics 4.1 (2002): 71-89.
Social Security Amendments of 1983. P.L. 98-21.
SunStone. “Overview of the Key Provisions of FY 2013 IPPS Final Rule,” September 28, 2012, accessed from http://nepahfma.org/images/9_28_12_presentation_1.pdf).
U.S. Census Bureau. “Census Bureau Regions and Divisions with State FIPS Codes,” 2014, (accessed from https://www.census.gov/geo/maps-data/maps/docs/reg_div.txt on April 12, 2014).
West, W. (2005). Administrative rulemaking: An old and emerging literature. Public Administration Review, 65(6), 655–668.
West, William F. "Formal procedures, informal processes, accountability, and responsiveness in bureaucratic policy making: An institutional policy analysis." Public Administration Review 64.1 (2004): 66-80.
Wisconsin Hospital Association. “Payment Rule Summary,” 2011, (accessed from http://www.wha.org/Data/Sites/1/reimbursement/2012IPPSFinalRuleSummary.pdf).
Yackee, Jason Webb, and Susan Webb Yackee. "A bias towards business? Assessing interest group influence on the US bureaucracy." Journal of Politics 68.1 (2006): 128-139.
Yackee, Susan Webb. "Sweet-talking the fourth branch: The influence of interest group comments on federal agency rulemaking." Journal of Public Administration Research and Theory 16.1 (2006): 103-124.