put tsr in its place: choose the right performance … exemplary board leadership put tsr in its...
TRANSCRIPT
ADVANCING EXEMPLARY BOARD LEADERSHIP
Put TSR in Its Place: Choose the Right Performance Metrics for Value Creation
Compensation Series
March 10, 2016
2
Mary Beth Vitale (moderator) is a director of CoBiz Financial Inc., where she chairs the board’s nominating and governance committee. Previously, she was lead director for Eyeris Inc. and served as both the compensation committee chair and a member of the audit committee for Zynex Inc. She is a past president and COO of Rocky Mountain Internet and a past president and corporate officer of AT&T. She chairs NACD’s Colorado Chapter and also serves as an NACD faculty member.
Meet the Presenters
2
Matt Turner is a Managing Director in the Chicago office of Pearl Meyer, specializing in executive compensation strategy, incentive plan design, tailoring of performance measures, and assisting compensation committees in setting shareholder-focused performance targets.
Brett Herand is a Vice President in the Chicago office of Pearl Meyer, where he works with boards and management on performance measurement and value creation, incentive plan design, and technical advisory work with respect to tax, accounting, and SEC regulatory issues.
3
Housekeeping
Submit a question and receive your answer directly from Pearl Meyer. You will also be opted-in to receive future executive compensation thought leadership from Pearl Meyer.
Tweet live with @NACD and @pearlmeyer
Download the presentation and access additional resources
4
Housekeeping
Slides are available at www.pearlmeyer.com/performance-measures-for-value-creation
and within the webinar console.
4
55
You will automatically receive 1 NACD credit for your participation.
Credit may be applied to NACD Fellowship programs.Contact [email protected] for more details.
The replay and slides will be available early next week at www.NACDonline.org and www.pearlmeyer.com
5
Housekeeping
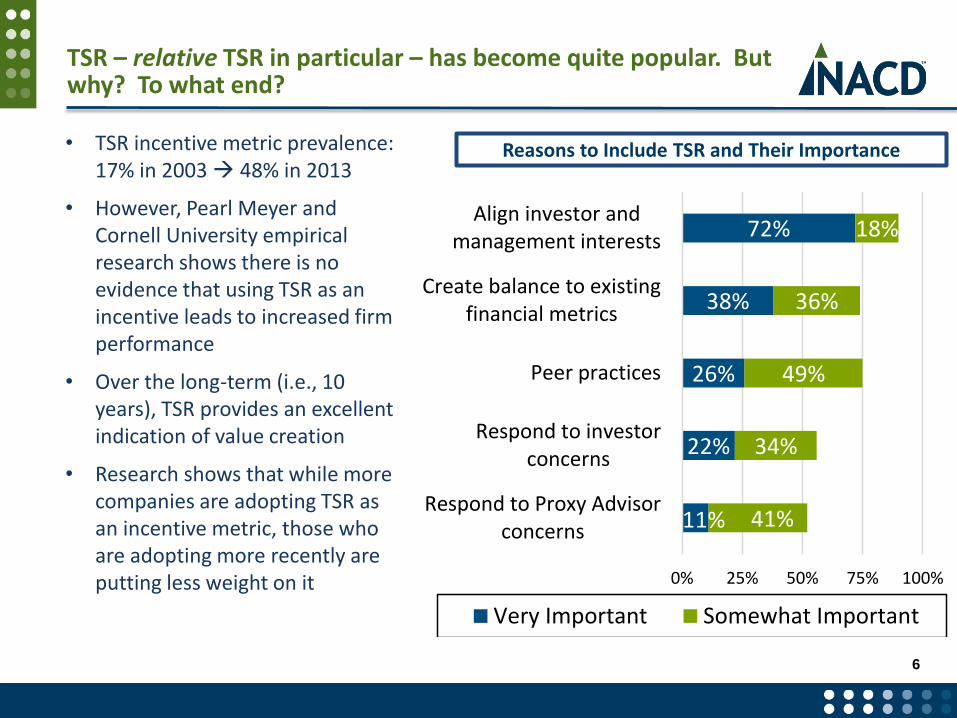
TSR – relative TSR in particular – has become quite popular. But why? To what end?
• TSR incentive metric prevalence: 17% in 2003 48% in 2013
• However, Pearl Meyer and Cornell University empirical research shows there is no evidence that using TSR as an incentive leads to increased firm performance
• Over the long-term (i.e., 10 years), TSR provides an excellent indication of value creation
• Research shows that while more companies are adopting TSR as an incentive metric, those who are adopting more recently are putting less weight on it
6
Reasons to Include TSR and Their Importance
11%
22%
26%
38%
72%
41%
34%
49%
36%
18%
0% 25% 50% 75% 100%
Respond to Proxy Advisorconcerns
Respond to investorconcerns
Peer practices
Create balance to existingfinancial metrics
Align investor andmanagement interests
Very Important Somewhat Important

The case for and against TSR
• Alignment with shareholders
• Objective performance standard
• Reflects an assessment of value creation not reflected in financial metrics
• Positive view by external stakeholders
• Provides no line-of-sight; crowds out measures that do
• Performance assessment clouded by exogenous factors outside management control
• TSR already embedded within existing equity incentives and aggregate equity ownership provides additional shareholder alignment
7
For TSR Against TSR

Case #1: Companies continue to refine how TSR is used within incentive compensation plans based on business-specific context
• LTI is 100% linked to TSR relative to industry peer group
• Several strong LTI cycles, as the company was well positioned to weather the financial downturn and capture market share in the years following
• CEO and CFO retire; internal promotions; financial performance is “topped out”
• Survivor peers’ TSR “surges” with improving financial performance
8
Manufacturing Company
• Result: Company “carves into” TSR metric with long-term growth metric relative to peers
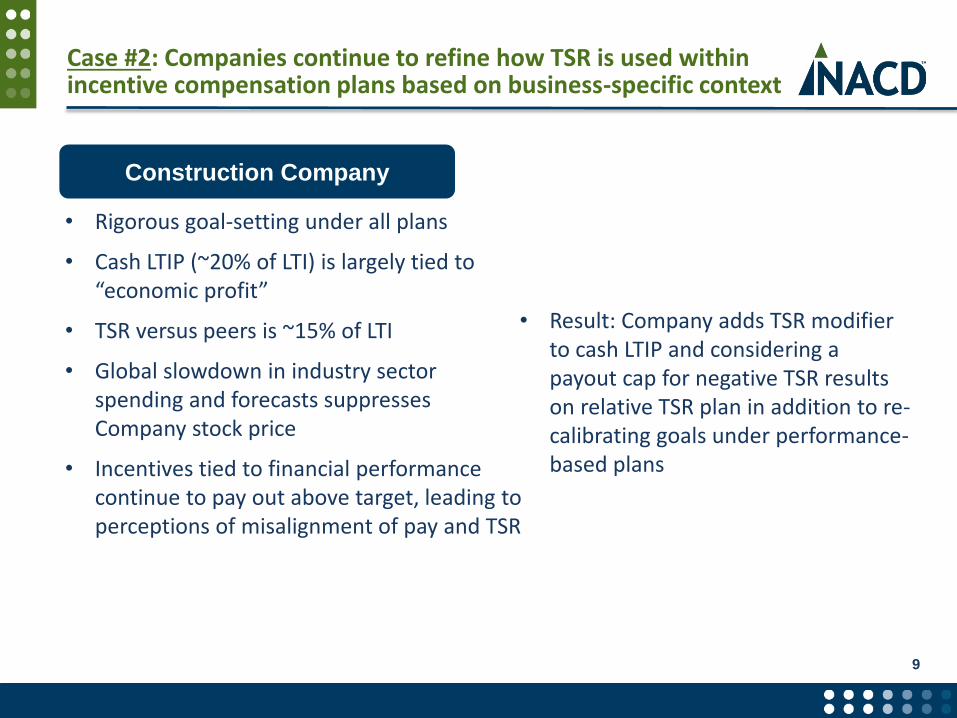
Case #2: Companies continue to refine how TSR is used within incentive compensation plans based on business-specific context
9
• Rigorous goal-setting under all plans
• Cash LTIP (~20% of LTI) is largely tied to “economic profit”
• TSR versus peers is ~15% of LTI
• Global slowdown in industry sector spending and forecasts suppresses Company stock price
• Incentives tied to financial performance continue to pay out above target, leading to perceptions of misalignment of pay and TSR
• Result: Company adds TSR modifier to cash LTIP and considering a payout cap for negative TSR results on relative TSR plan in addition to re-calibrating goals under performance-based plans
Construction Company
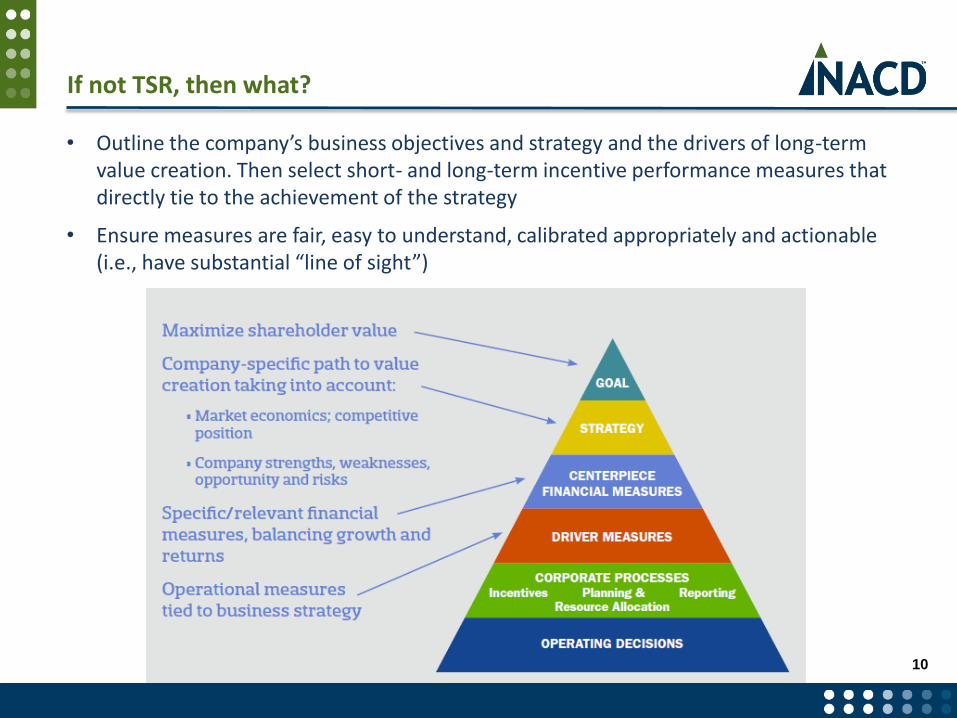
If not TSR, then what?
• Outline the company’s business objectives and strategy and the drivers of long-term value creation. Then select short- and long-term incentive performance measures that directly tie to the achievement of the strategy
• Ensure measures are fair, easy to understand, calibrated appropriately and actionable (i.e., have substantial “line of sight”)
10

Evaluation of performance measures and goals begins with business strategy and context
• Business strategy
• Value chain
• Market economics/ competitive position
• Identification of “value drivers”
What performance measures provide the
best ongoing assessment of strategy execution and success at creating value
for shareholders?
Provides Answers to the Question…
An Understanding of…
11

Companies sometimes look externally for guidance in selecting measures
• Simple prevalence surveys and performance comparisons are more common than statistical analysis or exploration of tailored measure definitions
% of Companies Reporting Factors Used to Select Performance Measures
Source: PM&P analysis 2011
0%
25%
50%
75%
100%
Employeeof Firm
OutsideDirector
Employeeof Firm
OutsideDirector
Employeeof Firm
OutsideDirector
Employeeof Firm
OutsideDirector
Review of peer companypractices
Review performanceagainst peers forpotential metrics
Correlation analysis orother statistical studies
Analysis of changes tostandard calculation ofperformance metrics(e.g., adjustments to
GAAP measures)
Sometimes
Always
12

Statistical analysis can help “ground” measures in a demonstrated link to shareholder value
• Sales and EBITDA growth demonstrate a strong link to TSR over 3 and 5 years
• ROIC also demonstrates a strong relationship
• Other measures may be important/relevant, but on a company-specific basis
13
14
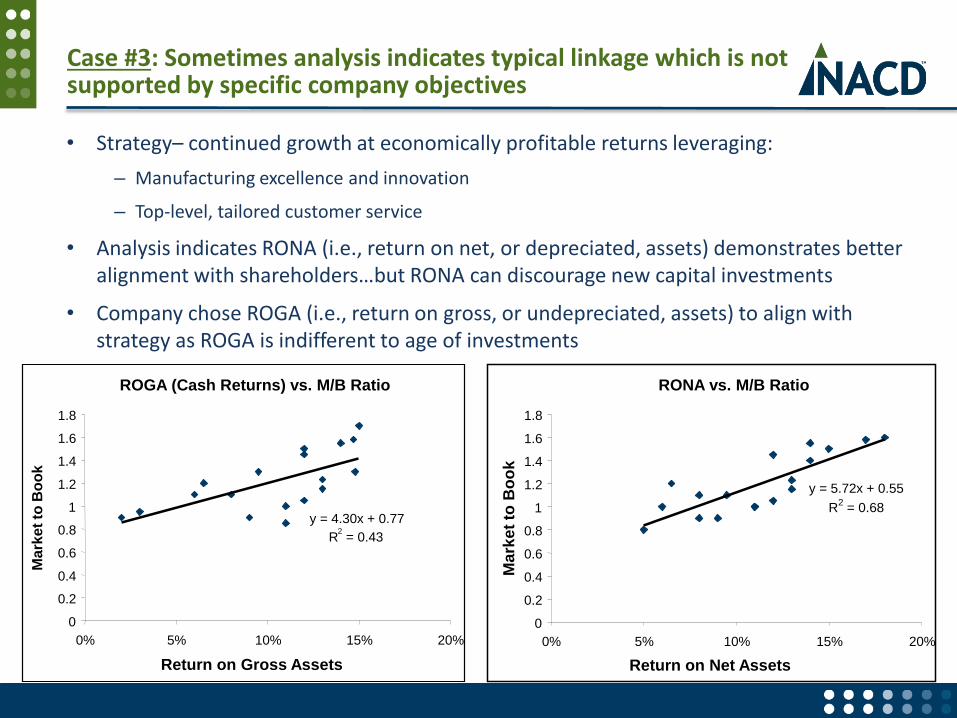
Case #3: Sometimes analysis indicates typical linkage which is not supported by specific company objectives
• Strategy– continued growth at economically profitable returns leveraging:
– Manufacturing excellence and innovation
– Top-level, tailored customer service
• Analysis indicates RONA (i.e., return on net, or depreciated, assets) demonstrates better alignment with shareholders…but RONA can discourage new capital investments
• Company chose ROGA (i.e., return on gross, or undepreciated, assets) to align with strategy as ROGA is indifferent to age of investments
ROGA (Cash Returns) vs. M/B Ratio
y = 4.30x + 0.77
R2
= 0.43
0
0.2
0.4
0.6
0.8
1
1.2
1.4
1.6
1.8
0% 5% 10% 15% 20%
Return on Gross Assets
Ma
rke
t to
Bo
ok
RONA vs. M/B Ratio
y = 5.72x + 0.55
R2
= 0.68
0
0.2
0.4
0.6
0.8
1
1.2
1.4
1.6
1.8
0% 5% 10% 15% 20%
Return on Net Assets
Ma
rke
t to
Bo
ok
Return on Gross Assets

Once the “centerpiece” financial measures are identified, balance them appropriately
• A properly balanced performance measurement framework will
– Emphasize profitable growth/returns, consistent with strategy and market economics
– Include a mix of lead and lag measures to ensure appropriate line-of-sight
– Map measures to the right incentive plans based on timeframe and participant profile
Growth Profitability ROI Stock Price/TSR
% of Target Individual Top Operating Gross NI Working Absolute Relative
Plan Type Total Pay "MBOs" Line Income Margin Margin ROIC Capital Growth to Peers
Annual Incentive
Plan35% X X X X
Cash Long-term
Incentive Plan15% X X X
Performance-
vested Restricted
Stock
15% X X X
Other 5% X X
15

Sometimes company- or industry-specific situations make the tailoring of measures worth consideration
Potential Deviations from Standard Definitions Some Considerations
Operating income vs. all “earnings” (e.g., interest income, JV’s, discontinued ops)
Employee control and influence
Actual vs. standard tax rates (or pretax earnings) Same as above; is management of a deferred tax asset part of operations?
Non-cash charges (depreciation, amortization, etc.) Unusual period of growth; management inherited goodwill; distortions to investment decisions
Effects of exchange rates Employee control and influence; financial vs. operational hedging; distortions to investment decisions
Inventory valuation Differences from peers for relative performance comparisons; large swings in actual value of inventory
Adjustment of balance sheet values (marking to market; recognizing non-GAAP assets)
Distorting investment decisions; protecting brand value
Capitalizing R&D or marketing expenses Encouraging investment without undue impact on short-term financial metrics
Suspending the impact of acquisitions for a period of time Acquisition strategy with multi-year integration
16
Once key performance measures are identified, understand their limitations and plan accordingly
• Identify potential influences on the key financial measures which may not be related to value creation or management effort
– Changes in tax position
– Share repurchase
– Unexpected swings in commodity prices
– Changes in accounting treatment
– Acquisitions and divestitures
• Agree ahead of time on how other aspects of the performance measurement framework can complement the financial measures
– Non-financial measures
– Use of discretion
– Measurement time frame
• Agree to ‘ground-rules’ at beginning of performance period to set expectations
17
Once the right measures are identified, it is critical to calibrate performance goals appropriately
• Most companies indicate that they intend for their programs to deliver pay-for-performance…
– “One of the most important principles underlying the compensation philosophy of the Compensation Committee of the Board is pay for performance. This emphasis has helped drive strong performance over both the short and the long term. In general we intend to deliver market median pay for target performance, above market pay for superior performance, and below market pay for poor performance…”
• …but some questions go unanswered:
– Does target mean the same for us as it does for our peers?
– How does superior performance impact our actual pay positioning against the market? How about threshold, or below threshold performance?
– How difficult is it for our team to reach “target” or “maximum?”
18
It is important to understand the relative difficulty of achieving performance objectives
• In general, for the average management team, a good rule of thumb is that:
– Superior performance/payout is achieved 10% - 20% of the time
– Target or better performance is achieved 50% - 60% of the time
– Threshold or better performance is achieved 80% - 90% of the time
• Industries and specific peer groups may differ
• Certainly, a superior management team may achieve high performance levels more often, but…
– Does the company’s stock price performance support such a belief?
– Are you confident that the measures of performance really matter to shareholder value?
– Is the current management team driving the performance results or exploiting the cumulative effect of economic rents developed by prior management teams?
19

Historical Incentive Payouts vs.
Relative Total Shareholder Return
0.0x
0.4x
0.8x
1.2x
1.6x
2.0x
1998 1999 2000 2001 2002 2003 2004 2005 2006 2007
Inc
en
tiv
e P
ay
ou
t
0%
20%
40%
60%
80%
100%
Re
lati
ve
TS
R %
Ra
nk
AVG of AIP/LTIP %Rank TSR
Is there a systemic disconnect between assessed performance and stock price performance?
• Understand the average performance assessment for your company and compare to long-term shareholder value performance
• Two potential interpretations to the example below:
– Wrong measures?
– Goals were too easy? 1.5x Payout
41%ile TSR
20

Goal-setting is commanding greater time and attention from Compensation Committees
Traditional Approach Today’s Required Approach
• Budget-driven
• Target-focused
• Compensation Committee involved at the end of the process
• Multiple performance perspectives
• Multiple pay/performance scenarios considered
• Consideration of HR matters
• Early, active involvement of the Compensation Committee
21

Goal-setting should incorporate multiple perspectives on performance expectations
Margins relative toComparables
ShareholderExpectations
Historical Companyand/or Industry Avg.
Bottom-up Budget
CompanyEarnings
Goals
Cost of Capital
Multiple PerformanceScenarios
Analyst Estimates
Historical Perspectives Forward-Looking Perspectives
22

However, most companies still rely heavily upon budgets and long-range plans to set goals
% of Companies Reporting Factors Used to
Set Performance Goals
Source: PM&P analysis 2011 0% 25% 50% 75% 100%
Forecasts by external analysts
Wall St. Earnings guidance
Implications of goals on stock price
Variance analysis (e.g., in determining goalranges)
Peer performance
Statistical analysis of measures and value
Value-sharing (e.g., X% of profits, etc.)
Historical performance
Business unit or "bottom-up" plans
Long-range plan or strategic plan
Annual budget
Very Important
Somewhat Important
23

Assets 2009 2010 2011 2012 2013 TV MarketValue
Va
lue
Shareholder ExpectationsAssets + Future Economic Profit
Shareholder expectations of financial performance can be inferred from share price
• From the Gordon Dividend Growth Model:
Price = EPS/(KE – g)
where KE = cost of capital and g = growth rate
• Higher (lower) price at the time of goal-setting means a higher (lower) set of shareholder expectations for next year’s earnings, or greater (lesser) growth expectations
• Discounted economic profit (EP) modeling
• Planning period growth rate different from long-term growth rate
• Assets valued separate from EP
Basic Theory A Modern Approach
24
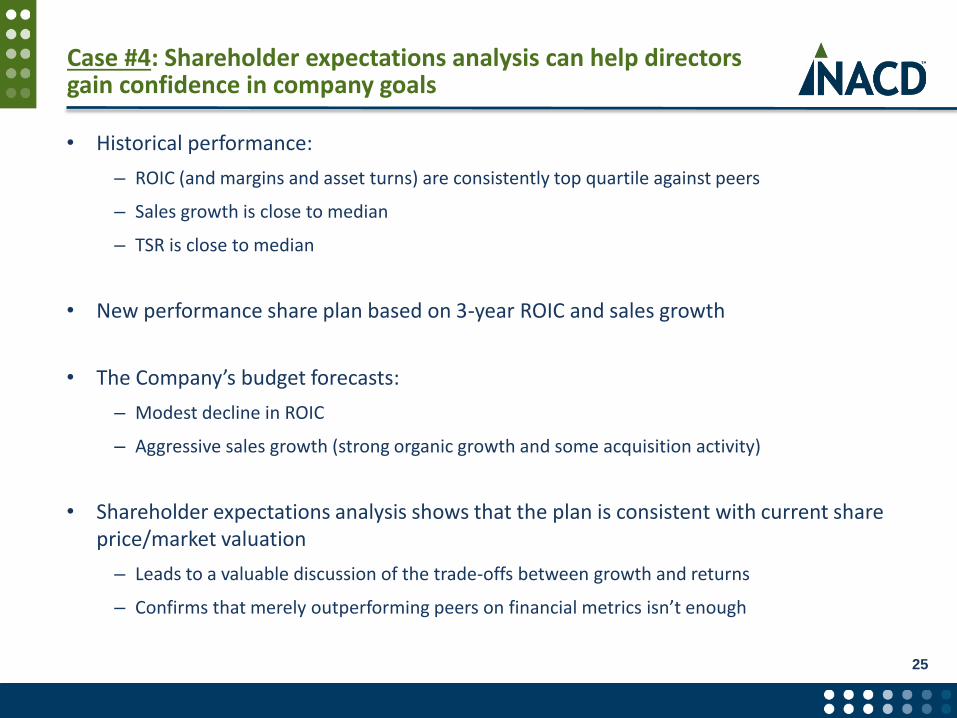
Case #4: Shareholder expectations analysis can help directors gain confidence in company goals
• Historical performance:
– ROIC (and margins and asset turns) are consistently top quartile against peers
– Sales growth is close to median
– TSR is close to median
• New performance share plan based on 3-year ROIC and sales growth
• The Company’s budget forecasts:
– Modest decline in ROIC
– Aggressive sales growth (strong organic growth and some acquisition activity)
• Shareholder expectations analysis shows that the plan is consistent with current share price/market valuation
– Leads to a valuable discussion of the trade-offs between growth and returns
– Confirms that merely outperforming peers on financial metrics isn’t enough
25
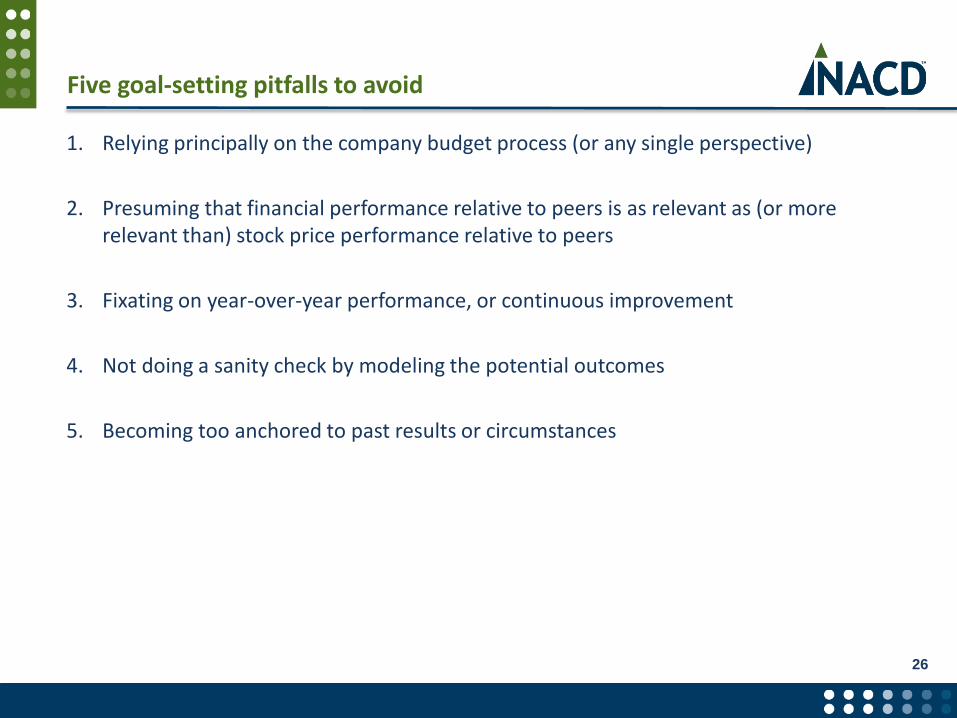
Five goal-setting pitfalls to avoid
1. Relying principally on the company budget process (or any single perspective)
2. Presuming that financial performance relative to peers is as relevant as (or more relevant than) stock price performance relative to peers
3. Fixating on year-over-year performance, or continuous improvement
4. Not doing a sanity check by modeling the potential outcomes
5. Becoming too anchored to past results or circumstances
26

In summary
• TSR has become a highly prevalent metric in incentive compensation programs of public companies
• However, companies are finding valid reasons to reassess the weight and nature of a TSR for their programs
• For all companies, incentive measures should be grounded in business strategy, tied to shareholder value creation, and calibrated to deliver appropriate pay-for-performance results
• The specific role (if any) for TSR in a Company’s incentive compensation program should be tailored to its unique business context
27

ADVANCING EXEMPLARY BOARD LEADERSHIP
Questions
29
Don’t Miss Our Next Webinar in This Series
Join NACD and Pearl Meyer for our next Compensation Series webinar:
“Compensation’s Role in a Successful M&A”
May 19, 2016 2:00 PM (ET)
To register or check out the archives of earlier webinars in this series, visit www.NACDonline.org/webinars.
To opt-in to receive future executive compensation thought leadership from Pearl Meyer, please email [email protected]
29
30
If you have any questions regarding NACD credit or the Fellowship programs, please contact:
Meghan Metzbower, Senior Fellowship Program Manager
Phone: (202) 803-6764
Email: [email protected]
To learn more about NACD Fellowships, visit us at NACDonline.org/Fellowships.
NACD Credit and Fellowship Information

31
Thank You