purpose of today’s presentation - appa · • the fundamentals ... on the road to psychrometrics...
TRANSCRIPT

APPA Institute – Session 301C EU © GLHN Architects & Engineers, Inc.
1
Utilities InfrastructureSession 301C EUUtility Master Planning (cont.)Heating & Cooling Systems Basics
APPA Institute for
Facilities Management
Bill Nelson PE
2
Purpose of Today’s Presentation
• To share information about current technologies related to central plants
• To provide some useful handout material with sizing guides
• DOE Energy Projections to 2035
• To provide a broad understanding of central heating and cooling systems (This is a core course - you may see some duplication in other classes)
3
Agenda
• The Fundamentals– Water
– Psychometrics
• Introduction– Community energy
– Advantages of a central energy system
– Efficiencies
– Pollution reduction

APPA Institute – Session 301C EU © GLHN Architects & Engineers, Inc.
4
Agenda (cont.)
• Steam and Hot Water Systems– Boilers
– Piping
– Traps & Expansion Joints
• Energy Prices – US Building Stock
• Chilled Water System– Air Handlers & Coils
– Chillers
– Cooling towers
5
Words of WisdomWords of Wisdom
Duct tape is like the force; it has a light side and a dark side, and it holds the universe together
6
Agenda
• Introduction– Community energy
– Advantages of a central energy system
– Efficiencies
– Pollution reduction
• The Fundamentals– Water
– Psychometrics

APPA Institute – Session 301C EU © GLHN Architects & Engineers, Inc.
7
Community Energy
Classrooms
Hospital
LibraryLabs
Dormitories
Central Energy System
8
Heating and Cooling Systems
• Less equipment
• Lower service cost
• Better space utilization
• Alternate technological option
Advantages
• Integrated solutions
9
Central Energy System
• Lower operating cost
• Better management and energy control
• Higher overall efficiency
• Multiple fuel capabilities
Advantages (cont)
• Aesthetic options

APPA Institute – Session 301C EU © GLHN Architects & Engineers, Inc.
10
Pollution Reduction
• Reduction by avoiding utility transmission losses
• Reduction from EMCS
• Reduction by using cogeneration for heating
• Power production shifted from mostly coal-fired utility plants to natural gas plant
11
Central Energy System Topics
• Steam and hot water systems– components
– fuels
– Combined heat and power
• Chilled water systems– components
– configurations
12
Agenda
• Introduction– Community energy– Advantages of a central energy system– Efficiencies– Pollution reduction
• The Fundamentals– Water– Psychometrics

APPA Institute – Session 301C EU © GLHN Architects & Engineers, Inc.
13
Fundamentals: Water--Ideal Heat Transfer Fluid
75ºF 76ºF
Specific Heat 1 BTU/lb
Heat of Fusion 144 BTU/lb
Heat of Vaporization 970 BTU/lb
32ºF 212ºF
14
Water On the Road to Psychrometrics
The bottom end of the steam table
The Power of Steam
15
Psychrometric FormulasStandard Air
At Sea Level
70 oF Dry Bulb
50% Relative Humidity
59 oF Wet Bulb
50 oF Dew Point
52 gr moisture/ LB
25.4 h BTU/LB
Specific Volume
13.5 ft3/LB
Specific Heat
0.244 BTU/LB oF
ONE CUBIC FOOT
Sea Level
Elevation
(feet)
0
2000
4000
6000
7500
10000
Barometric
Pressure
(inHg)
29.92
28.86
25.84
23.98
22.75
20.6

APPA Institute – Session 301C EU © GLHN Architects & Engineers, Inc.
16
Psychrometrics:Definitions
2530
4540
35
60
55
50
80
70
65
85 90 95 100 105
25 30 35 40 45 50 55 60 65 70 8580 9590 105100
75
75
180
150
140
130
120
110
160
170
100
70
60
50
40
80
90
30
20
10
0
80%
60%
40%20%
90%
30%
50%70%
10%
12
9
7
13
18
26
34
48
30
16
2222
44
38
h
WB
%RH
Grains of Moisture
Cu ftDB
ChemicalDehydration
DPOne Cubic Foot
17
Applied Psychrometrics:Properties of Moist Air
• Dry-Bulb Temperature, DB– Temperature of air as registered by an
ordinary thermometer
25 30
4540
35
6055
50
80
70
65
85 90 95 100 105
25 30 35 40 45 50 55 60 65 70 8580 9590 105100
75
75
Grains of MoisturePer Pound of Dry Air
180
150
140130120110
160
170
100
706050
40
8090
3020100
Dry-Bulbtemp. F
Dewpoint orSaturationTemp. F
DB
18
Applied Psychrometrics:Properties of Moist Air
• Wet-Bulb Temperature, WB– Temperature registered by a
thermometer whose bulb is covered by a wetted wick and exposed to a current of rapidly moving air
25 30
4540
35
6055
50
80
70
85 90 95 100 105
25 30 35 40 45 50 55 60 65 70 8580 9590 105100
75
75
Grains of MoisturePer Pound of Dry Air
180
150
140130120110
160
170
100
706050
40
8090
3020100
Dry-Bulbtemp. F
Dewpoint orSaturationTemp. F
WB

APPA Institute – Session 301C EU © GLHN Architects & Engineers, Inc.
19
Applied Psychrometrics:Properties of Moist Air
• Dew point Temperature, DP– Temp. at which condensation of
moisture begins when air is cooled
25 30
4540
35
6055
50
80
70
65
85 90 95 100 105
25 30 35 40 45 50 55 60 65 70 8580 9590 105100
75
75
Grains of MoisturePer Pound of Dry Air
180
150
140130120110
160
170
100
706050
40
8090
3020100
Dry-Bulbtemp. F
Dewpoint orSaturationTemp. F
DP
20
Applied Psychrometrics:Properties of Moist Air
• Relative Humidity, %RH– Ratio of actual water vapor
pressure in air to the pressure of saturated water vapor in air at the same temperature
25 30
454035
6055
50
80
70
65
85 90 95100105
25 30 35 40 45 50 55 60 65 70 8580 9590 105100
75
75
Grains of MoisturePer Pound of Dry Air
180
150
140130120110
160
170
100
706050
40
8090
3020100
Dry-Bulbtemp. F
Dewpoint orSaturationTemp. F
129
713
18
26
34
48
30
16
22
44
38
%RH
21
25 30
454035
6055
50
80
70
65
85 90 95100105
25 30 35 40 45 50 55 60 65 70 8580 9590 105100
75
75
Grains of MoisturePer Pound of Dry Air
180
150
140130120110
160
170
100
706050
40
8090
3020100
Dry-Bulbtemp. F
Dewpoint orSaturation
Temp. F
129
713
18
26
34
48
30
16
22
44
38
Applied Psychrometrics:Properties of Moist Air
• Specific Humidity, (W)– Moisture content
– Weight of water vapor in grains or pounds per pound of dry air
Grains of Moisture

APPA Institute – Session 301C EU © GLHN Architects & Engineers, Inc.
22
25 30
454035
6055
50
80
70
65
85 90 95 100105
25 30 35 40 45 50 55 60 65 70 8580 9590 105100
75
75
Grains of MoisturePer Pound of Dry Air
180
150
140130120110
160
170
100
706050
40
8090
3020100
Dry-Bulbtemp. F
Dewpoint orSaturationTemp. F
129
713
18
26
34
48
30
16
22
44
38
Applied Psychrometrics:Properties of Moist Air
• Enthalpy (h)– Total heat, BTU per pound of dry air
– Thermal property indicating the quantity of heat in the air above an arbitrary datum
– The datum for dry air is 0 F and, for the moisture content, 32 F water
23
25 30
454035
6055
50
80
70
65
85 90 95100105
25 30 35 40 45 50 55 60 65 70 8580 9590 105100
75
75
Grains of MoisturePer Pound of Dry Air
180
150
140130120110
160
170
100
706050
40
8090
3020100
Dry-Bulbtemp. F
Dewpoint orSaturationTemp. F
80%60%40%
20%
90%
30%50%
70%
10%
129
713
18
26
34
48
30
16
22
44
38
Applied Psychrometrics:Properties of Moist Air
• Specific Volume, (V)– Cubic feet of the mixture
per pound of dry air
Cu ft
24
2530
4540
35
6055
50
80
70
65
85 90 95 100 105
25 30 35 40 45 50 55 60 65 70 8580 9590 105100
75
75
180
150
140
130
120
110
160
170
100
70
60
50
40
80
90
30
20
10
0
12
9
7
13
18
26
34
48
30
16
22
44
38
Sensible heating
Humidifying
Evaporative cooling
Sensiblecooling
Dehumidifying
Chemical Dehydration
Psychrometrics: Processes
• Air conditioning processes may be shown graphically on the chart.

APPA Institute – Session 301C EU © GLHN Architects & Engineers, Inc.
25
Agenda (cont.)
• Chilled Water System– Air Handlers & Coils
– Chillers
– Cooling towers
– Pumps and piping
• Steam and Hot Water Systems– Boilers
– Piping
– Traps & Expansion Joints
– Combined heat and power (CHP)
26
Chilled Water System Components
• Chillers• Cooling Towers / Condensers• Pumps / Piping
• IT IS ALL ABOUT MOVING BTU’S
• Air Handlers / Coils
27
Chilled Water System
Cooling Tower
Chillers
Air Handler
Pumps & Piping

APPA Institute – Session 301C EU © GLHN Architects & Engineers, Inc.
28
Air Handling:All Air Systems
29
Chilled Water System Components: Coils
30
Chilled Water System Components
Chillers
– Centrifugal
– Screw
– Absorption
– Reciprocating
4 Types

APPA Institute – Session 301C EU © GLHN Architects & Engineers, Inc.
31
Chilled Water System Components: Chillers
• Centrifugal
Chillers
32
Centrifugal Chillers
33
Chilled Water System Components: Chillers
• Screw Chillers

APPA Institute – Session 301C EU © GLHN Architects & Engineers, Inc.
34
Chilled Water System Components: Chillers
• Single Stage
Absorption
Chillers
35
Single Stage Steam-Fired Absorption Unit
36
Chilled Water System Components: Chillers
• Two Stage Absorption Chillers

APPA Institute – Session 301C EU © GLHN Architects & Engineers, Inc.
37
Two Stage Steam-Fired Absorption Unit
38
Chilled Water System Components
• Condensers– Water Cooled
– Air Cooled
• Cooling Towers
– Forced Draft
– Induced Draft
39
25 30
4540
35
60
55
50
80
70
65
85 90 95 100 105
25 30 35 40 45 50 55 60 65 70 8580 9590 105100
75
75
Grains of MoisturePer Pound of Dry Air
180
150
140130
120
110
160
170
100
70
60
50
40
80
90
30
20
10
0
Dry-Bulbtemp. F
Dewpoint or
SaturationTemp. F
80%60%40%
20%
90%
30%50%
70%
10%
12
9
7
13
18
26
34
48
30
16
22
44
38
Sample CalculationsCooling Tower

APPA Institute – Session 301C EU © GLHN Architects & Engineers, Inc.
40
Sample CalculationsCooling Tower
200 Ton Tower Cool 600 gpm from 90 oF to 80 oF with a 70 oF wb ambient.
BTUHw = 600 gpm x 8.33 LB/gal x 60 min/hr x (90-80)DT = 3,000,000 BTUH
41
Chilled Water System Components
• Cooling Towers
– Forced Draft
– Induced Draft
42
Chilled Water System Components
• Pumps/ Piping– Primary/Secondary
– Direct Primary
– Parallel Pumping
– Series Pumping
– Variable Speed Pumping
– Reverse Return Piping System

APPA Institute – Session 301C EU © GLHN Architects & Engineers, Inc.
43
CHILLED WATER PIPING CAPACITY TONS(1000 ft2)
CapacityArea
GPM’s were selected to maintain water velocities (V) below 10 fps, and pressure drop (f) below 1’/100’ for large size pipes. The GPM values for smaller size pipes were selected to maintain water velocities below 7 fps, and pressure drop below 4’/100’. The velocities and friction drop values are according to Cameron. (C=100).
1000’s of gross sq. ft. of building are figured at 300 GSF/ton, I.e. (10,500) indicates that approximately 10,500,000 GSF can be air-conditioned with 35,000 tons. For heavy research areas use 220 GSF/ton.
This chart is intended to be used for obtaining an initial estimate of required pipe size and cost. Actual system design must be based on values obtained specifically for the project. Total installed cost per linear ft. of buried supply & return (2 pipes) piping. Price includes trenching, insulation, fittings, backfill & moderate amounts of surfacing repairs. For total project cost add A-E fees, testing, escalations, contingencies, etc.
HP values to pump the water through 1000’ return calculated using:
HP = GPM x TDH TDH = 2000 x f3940 x 7.5 100
44
Agenda (cont.)
• Chilled Water System– Air Handlers & Coils
– Chillers
– Cooling towers
– Pumps and piping
• Steam and Hot Water Systems– Boilers
– Piping
– Traps and Expansion Joints
– Combined heat and power (CHP)
45
HVAC System:Steam and Condensate
• General Arrangement
Boiler Feed Pumps Condensate Pumps
Deaerator
Condensate Tank
Boiler
Building

APPA Institute – Session 301C EU © GLHN Architects & Engineers, Inc.
46
47
• Water circulates around the tubes
• Lower cost
• Higher water volume
• Easier to maintain water level
Steam BoilersFire Tube Boiler vs. Water Tube Boiler
• Water circulates through the tubes
• Larger capacities and pressures available
• Faster start up
• Quicker response
Fire Tube Water Tube
48
• Higher initial cost
• Larger than 150,000 pph
Steam Boilers Field Erected Boiler vs. Package Boiler
Package• Manufactured in
controlled environment
• Higher quality
• Lower capital costs
Field Erected

APPA Institute – Session 301C EU © GLHN Architects & Engineers, Inc.
49
Steam Boilers Geometry: D-Type
• Flue gas travels down the furnace, turns at the back wall, and then travels back through the convection section
• The stack connection is on the side of the boiler
• Burner is offset to one side with a single row of tubes on the outside and the convection section on the other side
50
Steam Piping Design• Distribution System Types
• Walking Tunnel
• Shallow Tunnel
• Direct Buried
• Material Types
• Carbon Steel (ANSI B 16.9 A106)
• Other
51
Piping Design• Insulation Types
• Factory applied (Perma Pipe)
• Field applied
• Pitch
• Velocity/pressure limits
• Condensate Returns/Trapping
• Effect of Leaks
• Expansion devices
• Supports/guides/anchors
• Hookups/Accessories

APPA Institute – Session 301C EU © GLHN Architects & Engineers, Inc.
52
Condensate Return-Traps• Typical Application
• Types
• Thermostatic
• Liquid expansion
• Balanced pressure
• Bimetallic
53
Condensate Return-Traps• Types (cont’d)
• Mechanical
• Bucket
• Float
• Thermodynamic
• Impulse
• Disc
54
Typical Application

APPA Institute – Session 301C EU © GLHN Architects & Engineers, Inc.
55
Mechanical-Float & Thermostatic
56
Expansion-Basic Restraint
57
Expansion-Sliding Joint

APPA Institute – Session 301C EU © GLHN Architects & Engineers, Inc.
58
Expansion-Bellows
59
Hookup-Main Drips
Bad
Good
60
Hookup-Takeoff

APPA Institute – Session 301C EU © GLHN Architects & Engineers, Inc.
61
Waterhammer-Steam Induced
62
Tunnel Flooding-Condensate Generation
63
STEAM SYSTEM PIPING CAPACITY 1000 lb/hr(1000 ft2)
[HP]
Steam QuantityAreaFeedwater Pump HP
This chart is intended to be used for obtaining an initial estimate of required pipe size and cost. Actual system design must be based on values obtained specifically for the project. Total installed cost per linear ft. of buried supply & return (2 pipes) piping. Price includes trenching, insulation, fittings, backfill & moderate amounts of surfacing repairs. For total project cost add A-E fees, testing, escalations, contingencies, etc.
Building SQFT values are based on 60 Btuh/sqft peak average combined load (building heat and domestic hot water). For winter lows below +25 F: at 0 F multiply building SQFT by 0.8, at -20 F multiply building SQFT by 0.6.
Steam lines are sized to approximately 10,000 ft/min.
Condensate lines are sized to approximately yield pressure drops less than 2’/100’.
Prices shown are construction cost for a direct buried dual conduit piping system.

APPA Institute – Session 301C EU © GLHN Architects & Engineers, Inc.
64
A Barrel of Oil(42 Gallons)
• $98.00
65
Fuel Prices (est.)Natural Gas @ 80% Efficiency
• $7.00 / million Btu
Coal @ 75% Efficiency
• $2.60/million Btu
Electric @ 96% Efficiency
• $28.00/million Btu
Liquids @ 80% Efficiency
• Grade $/million BtuGasoline 28.00
Diesel 26.00
Jet Fuel 24.00
Firewood @ 50% Efficiency
• $8.00/million Btu
Corn @ 75% Efficiency
• $19.00/million Btu
www.eia.gov
U.S. Energy Information Administration Independent Statistics & Analysis
December 2013
ANNUAL ENERGY OUTLOOK Reference Case
ANNUAL ENERGY OUTLOOK Reference Case

APPA Institute – Session 301C EU © GLHN Architects & Engineers, Inc.
Key results from the AEO2014 Reference case
67
• Growing domestic production of natural gas and oil continues to reshape the U.S. energy economy, with crude oil approaching the 1970 all‐time high of 9.6 million barrels per day
• Light‐duty vehicle energy use declines sharply reflecting slowing growth in vehicle miles traveled and accelerated improvement in vehicle efficiency
• With continued growth in shale gas production, natural gas becomes the largest source of U.S. electric power generation, surpassing coal by 2035, and boosting production and natural gas consumption in manufacturing
• Strong growth in domestic natural gas production supports increased exports of both pipeline and liquefied natural gas
• With strong growth in domestic oil and gas production, U.S. dependence on imported fuels falls sharply
• Improved efficiency of energy use and a shift away from carbon‐intensive fuels keep U.S. energy‐related carbon dioxide emissions below their 2005 level through 2040
Adam Sieminski, December 16, 2013
OVERVIEW OF U.S. ENERGY SUPPLY AND DEMAND
OVERVIEW OF U.S. ENERGY SUPPLY AND DEMAND
Growth in U.S. energy production outstrips growth in consumption leading to a reduction in net imports
69
U.S. energy production and consumption
quadrillion Btu
Source: EIA, Annual Energy Outlook 2014 Early Release
History Projections2012
4%Consumption
Production
Net imports16%
Adam Sieminski, December 16, 2013
3%
2034 2040

APPA Institute – Session 301C EU © GLHN Architects & Engineers, Inc.
Growing tight oil and offshore crude oil production drive U.S. output close to historical high
70
U.S. crude oil production
million barrels per day
Source: EIA, Annual Energy Outlook 2014 Early Release
Tight oil
Alaska
Other lower 48 onshore
Lower 48 offshore
ProjectionsHistory 2012
Adam Sieminski, December 16, 2013
U.S. maximum production level of9.6 million barrels per day in 1970
Transportation sector motor gasoline demand declines, while diesel fuel accounts for a growing portion of the market
71
transportation energy consumption by fuel
quadrillion Btu
Source: EIA, Annual Energy Outlook 2014 Early Release
Adam Sieminski, December 16, 2013
ProjectionsHistory2012
59% Motor gasoline
Jet fuel
CNG/LNG
12% 13%3%
44%
31%
3% 4%Other
Diesel22%
2030
47%
13%3%
30%
1%
2040
Ethanol4%5%
5%
Shale gas leads U.S. production growth
72
U.S. dry natural gas production
trillion cubic feet
Source: EIA, Annual Energy Outlook 2014 Early Release
Associated with oilCoalbed methane
Tight gas
Shale gas
AlaskaNon-associated offshore
Non-associated onshore
ProjectionsHistory 2012
Adam Sieminski, December 16, 2013
billion cubic feet per day

APPA Institute – Session 301C EU © GLHN Architects & Engineers, Inc.
Electricity generation from natural gas surpasses coal
electricity generation by fuel
billion kilowatthours
73
History Projections
Coal
Natural gas
Adam Sieminski, December 16, 2013
2012
Source: EIA, Annual Energy Outlook 2014 Early Release
Manufacturing output and natural gas use grows with low natural gas prices, particularly in the near term
74
manufacturing natural gas consumption
quadrillion Btu
Source: EIA, Annual Energy Outlook 2014 Early Release
Adam Sieminski, December 16, 2013
AluminumGlass
Iron and steel
Paper
Food
Refining andrelated
Bulk chemicals
Other
Metal based
billion cubic feet per day
durables
manufacturing
U.S. natural gas imports and exports
trillion cubic feet per year
Alaska LNG exports
Pipeline exports to Mexico
Pipeline exports to Canada
Lower 48 states LNG exports
Pipeline imports from Canada
LNG imports
Source: EIA, Annual Energy Outlook 2014 Early Release
Adam Sieminski, December 16, 2013
75
-15
-10
-5
0
5
10
15
20
25
billion cubic feet per day
5.4 tcf of exports(14.8 bcf/day)
2.0 tcf of imports(5.4 bcf/day)
U.S. natural gas gross exports exceed 5 tcf in 2025
ProjectionsHistory 20122025

APPA Institute – Session 301C EU © GLHN Architects & Engineers, Inc.
U.S. petroleum product imports and exports
million barrels per day
Other petroleumproduct imports
Distillate exports
Motor gasoline exports
Other petroleumproduct exports
Distillate imports
Motor gasoline imports
Source: EIA, Annual Energy Outlook 2014 Early Release
Adam Sieminski, December 16, 2013
76
U.S. maintains status as a net exporter of petroleum products
ProjectionsHistory 2012
Total petroleum product net exports
Energy‐related CO2 emissions remain below the 2005 level over the projection period
77
carbon dioxide emissions
billion metric tons
Source: EIA, Annual Energy Outlook 2014 Early Release
ProjectionsHistory 20122005
Adam Sieminski, December 16, 2013
Energy‐related carbon dioxide emissions are 9% below the 2005 level in 2020 and 7% below the 2005 level in
2040.
PETROLEUM AND OTHERLIQUID SUPPLY
PETROLEUM AND OTHERLIQUID SUPPLY

APPA Institute – Session 301C EU © GLHN Architects & Engineers, Inc.
U.S. dependence on imported liquids declines, particularly in the near term
79
U.S. liquid fuel supply
million barrels per day
Source: EIA, Annual Energy Outlook 2014 Early Release
Consumption
Domestic supply
Net imports40%
32%
ProjectionsHistory 20122005
60%
Adam Sieminski, December 16, 2013
25%
2016 2040
Increased production of tight oil and greater fuel efficiency drive decline in petroleum and other liquids imports
80
Note: “Other” includes refinery gain, biofuels production, all stock withdrawals, and other domestic sources of liquid fuels
Source: EIA, Annual Energy Outlook 2014 Early Release
ProjectionsHistory
Natural gas plant liquids
Crude oil production(excluding tight)
Net petroleum and biofuel imports
32%
17%
12%
23%
12%
13%
40%
2012
Other
23%
Tight oil production
16%
12%
U.S. liquid fuels supply
million barrels per day
Adam Sieminski, December 16, 2013
14%
25%
2016
25%
12%
24%
2040
Natural gas use in the transportation sector grows rapidly with the largest share in freight trucks
81
natural gas use by mode
trillion Btu
Source: EIA, Annual Energy Outlook 2014 Early Release
Adam Sieminski, December 16, 2013
Freight trucks
Buses
Freight rail and marineLight-duty vehicles
22%
billion cubic feet per day
Approximate crude oil equivalent, (thousand barrels per day) 2040
Freight trucksFreight rail and marineBusesLight-duty vehicles
29071389

APPA Institute – Session 301C EU © GLHN Architects & Engineers, Inc.
NATURAL GASNATURAL GAS
U.S. natural gas prices remain well below crude oil prices
83
energy spot prices
2012 dollars per million Btu
Source: EIA, Annual Energy Outlook 2014 Early Release
History Projections2012
Henry Hub spot price
Adam Sieminski, December 16, 2013
Brent crude oil spot price
2018 2040
Ratio:7.1
Oil to gas price ratio:
3.4
Ratio:3.2
U.S. becomes a net exporter of natural gas in the near future
84
U.S. dry natural gas
trillion cubic feet per year
Source: EIA, Annual Energy Outlook 2014 Early Release
Adam Sieminski, December 16, 2013
ProjectionsHistory 2012
Consumption
Domestic supply
Net exports
100
75
50
25
0
-25
billion cubic feet per day
APPA Institute – Session 301C EU © GLHN Architects & Engineers, Inc.
85
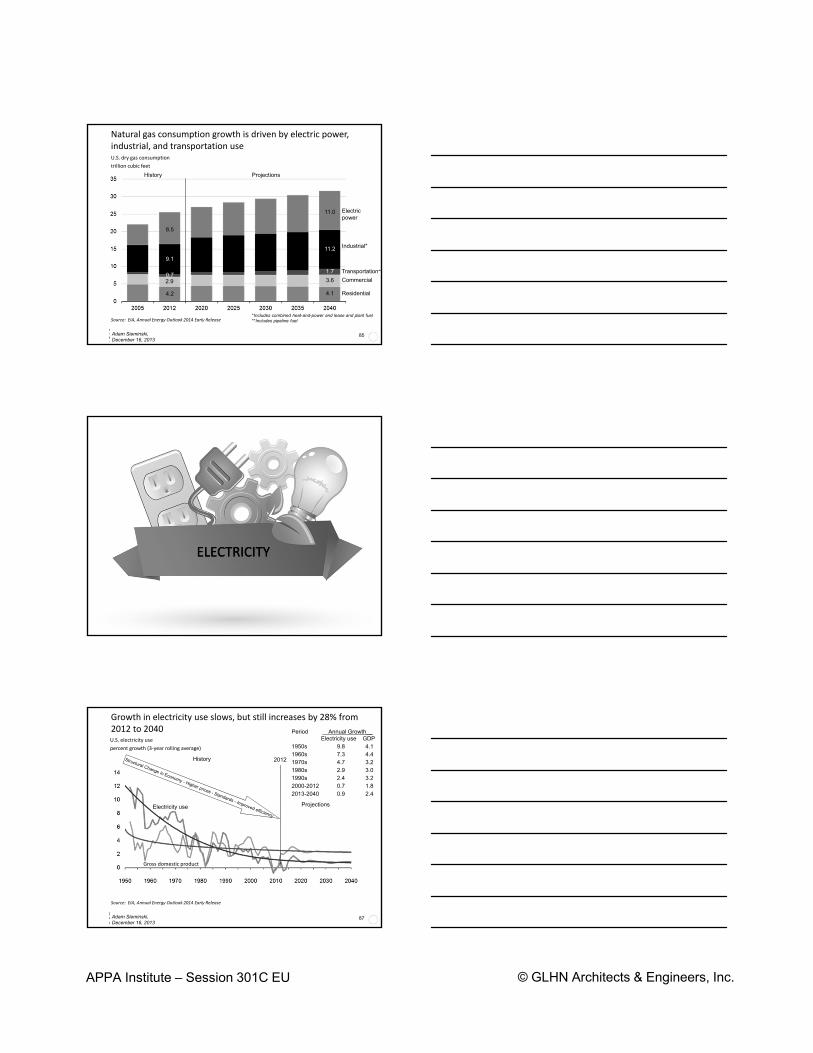
U.S. dry gas consumption
trillion cubic feet
Source: EIA, Annual Energy Outlook 2014 Early Release
ProjectionsHistory
Industrial*
Electricpower
Commercial
Residential
Transportation**
11.2
4.1
1.7
11.0
3.6
9.1
4.2
0.7
8.5
2.9
*Includes combined heat-and-power and lease and plant fuel**Includes pipeline fuel
Natural gas consumption growth is driven by electric power, industrial, and transportation use
Adam Sieminski, December 16, 2013
ELECTRICITYELECTRICITY
Growth in electricity use slows, but still increases by 28% from 2012 to 2040
87
U.S. electricity use
percent growth (3‐year rolling average)
Source: EIA, Annual Energy Outlook 2014 Early Release
Projections
History 2012
Period Annual Growth__Electricity use GDP
1950s 9.8 4.11960s 7.3 4.41970s 4.7 3.21980s 2.9 3.01990s 2.4 3.22000-2012 0.7 1.82013-2040 0.9 2.4
Adam Sieminski, December 16, 2013
Gross domestic product
Electricity use

APPA Institute – Session 301C EU © GLHN Architects & Engineers, Inc.
Over time the electricity mix gradually shifts to lower‐carbon options, led by growth in natural gas and renewable generation
88
electricity net generation
trillion kilowatthours per year
Source: EIA, Annual Energy Outlook 2014 Early Release
30%
19%
37%
12%
1% NuclearOil and other liquids
Natural gas
Coal
Renewables
2012ProjectionsHistory
16%
16%
32%
35%
<1%
Adam Sieminski, December 16, 2013
1993
11%13%
19%
53%
4%
30%
17%
37%
15%
1%
2025 2040
Non‐hydro renewable generation more than doubles between 2012 and 2040
89
non‐hydropower renewable generation
billion kilowatthours per year
Source: EIA, Annual Energy Outlook 2013 Early Release
Wind
Solar
GeothermalMunicipal waste
Biomass
Industrial CHP
Power sector
2012 ProjectionsHistory
Adam Sieminski, December 16, 2013
For more information
90
U.S. Energy Information Administration home page | www.eia.gov
Annual Energy Outlook | www.eia.gov/forecasts/aeo
Short‐Term Energy Outlook | www.eia.gov/forecasts/steo
International Energy Outlook | www.eia.gov/forecasts/ieo
Today In Energy | www.eia.gov/todayinenergy
Monthly Energy Review | www.eia.gov/totalenergy/data/monthly
State Energy Portal | www.eia.gov/state
Adam Sieminski, December 16, 2013

APPA Institute – Session 301C EU © GLHN Architects & Engineers, Inc.
U.S. Energy Flow TrendsU.S. Energy Flow Trends
Source: GLHN Architects & Engineers, Inc.
QUADRILLION BTUs (1015)
92
Fossil Fuels & Climate Change
93
Fossil Fuels & Climate Change

APPA Institute – Session 301C EU © GLHN Architects & Engineers, Inc.
94
The U.S. Built Environment
Currently the USBuilding stock is approx.200 billion sf.
95
The U.S. Built Environment
Over the next 30 years
52 billion sf will bedemolished
96
The U.S. Built Environment
150 billion sf will beRemodeled

APPA Institute – Session 301C EU © GLHN Architects & Engineers, Inc.
97
The U.S. Built Environment
150 billion sf will beNew construction
98
The U.S. Built Environment
Therefore, by the year2035, three-quartersof the building stockwill be new or renovated
99
Can We Do It- Done it before

APPA Institute – Session 301C EU © GLHN Architects & Engineers, Inc.
100
A “SMART” Goal
Over the next 5-7 years the University of Arizona will add 1
million square feet to their built environment; the
consumption of fossil fuels will remain at 2007 levels.
101