purpose of the presentation · purpose of the presentation to present the measures that must be...
TRANSCRIPT

2015/06/23
1
Presented by: Paul Herbst & Moloko RaletjenaPresented by: Paul Herbst & Moloko RaletjenaPresented by: Paul Herbst & Moloko RaletjenaPresented by: Paul Herbst & Moloko Raletjena
Purpose of the PresentationPurpose of the Presentation
To present the measures that must be implemented to ensure enough water for current and future growth based on the- findings and recommendations from
various water resource management studies,
and to present the NO DROP requirements
To present the measures that must be implemented to ensure enough water for current and future growth based on the- findings and recommendations from
various water resource management studies,
and to present the NO DROP requirements
2

2015/06/23
2
A state road sign in Sacramento. California, which is entering 4th
year of drought, is in the final steps of carrying out an executive order by Gov. Jerry Brown that imposes a 25 % state wide reduction in urban water use. Credit: Max Whittaker for The New York Times
How does the Californians secure water for the future?How does the Californians secure water for the future?
Water restrictions or cuts- the original set of four tiers, with cuts ranging from 10 percent to 35 percent, has been expanded to nine tiers, with cuts ranging from 4 percent to 36 percent. The amount of water that communities would have to conserve was reduced for some, like Los Angeles and San Francisco, and was slightly increased for others, like Beverly Hills.In the first proposal, a communities was placed in a tier based on how much water it used in September 2014. In response to criticism that this standard did not account for fluctuations in water use, the benchmark measure will now be based on how much water communities used during July, August and September last year.State officials said they intended to adopt a final order by the beginning of May, with enforcement — which includes fines of up to $10,000 a day — kicking in by the middle of July. The rush reflects an attempt to put the new rules into place as California moves into the summer, with high consumption driven in large part by outdoor watering.
Water restrictions or cuts- the original set of four tiers, with cuts ranging from 10 percent to 35 percent, has been expanded to nine tiers, with cuts ranging from 4 percent to 36 percent. The amount of water that communities would have to conserve was reduced for some, like Los Angeles and San Francisco, and was slightly increased for others, like Beverly Hills.In the first proposal, a communities was placed in a tier based on how much water it used in September 2014. In response to criticism that this standard did not account for fluctuations in water use, the benchmark measure will now be based on how much water communities used during July, August and September last year.State officials said they intended to adopt a final order by the beginning of May, with enforcement — which includes fines of up to $10,000 a day — kicking in by the middle of July. The rush reflects an attempt to put the new rules into place as California moves into the summer, with high consumption driven in large part by outdoor watering.
2015/06/23
3
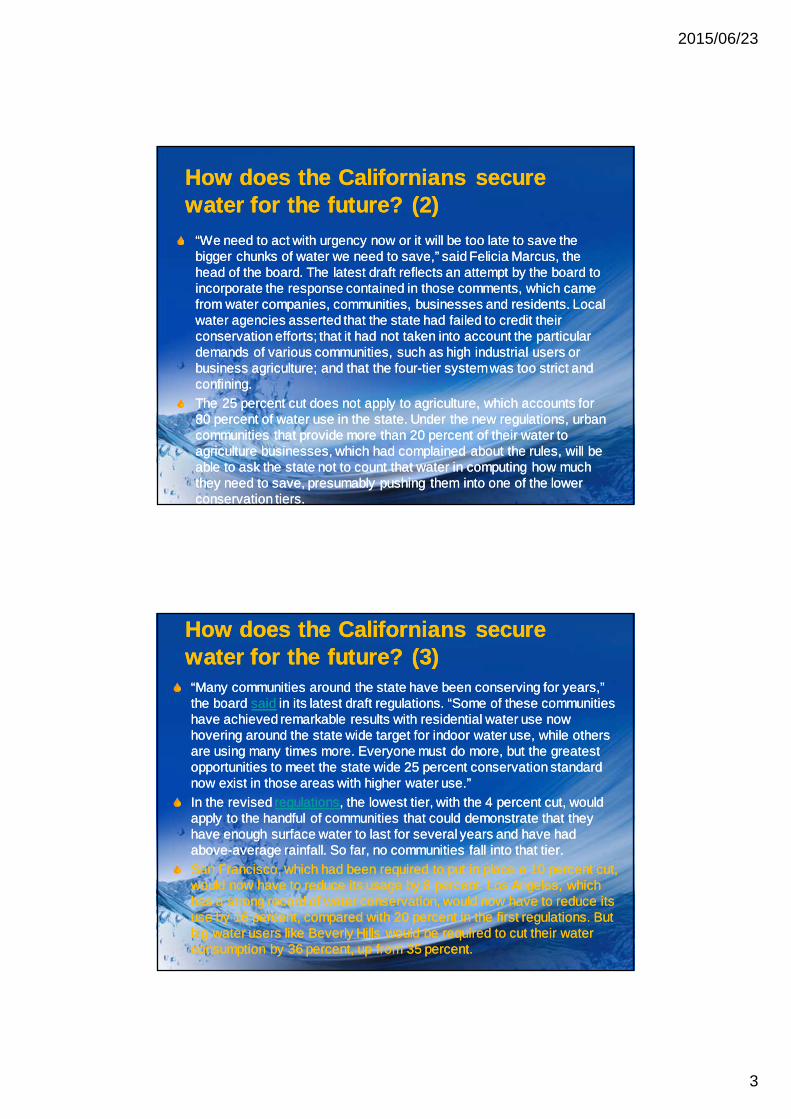
How does the Californians secure water for the future? (2)How does the Californians secure water for the future? (2)
“We need to act with urgency now or it will be too late to save the bigger chunks of water we need to save,” said Felicia Marcus, the head of the board. The latest draft reflects an attempt by the board to incorporate the response contained in those comments, which came from water companies, communities, businesses and residents. Local water agencies asserted that the state had failed to credit their conservation efforts; that it had not taken into account the particular demands of various communities, such as high industrial users or business agriculture; and that the four-tier system was too strict and confining.The 25 percent cut does not apply to agriculture, which accounts for 80 percent of water use in the state. Under the new regulations, urban communities that provide more than 20 percent of their water to agriculture businesses, which had complained about the rules, will be able to ask the state not to count that water in computing how much they need to save, presumably pushing them into one of the lower conservation tiers.
“We need to act with urgency now or it will be too late to save the bigger chunks of water we need to save,” said Felicia Marcus, the head of the board. The latest draft reflects an attempt by the board to incorporate the response contained in those comments, which came from water companies, communities, businesses and residents. Local water agencies asserted that the state had failed to credit their conservation efforts; that it had not taken into account the particular demands of various communities, such as high industrial users or business agriculture; and that the four-tier system was too strict and confining.The 25 percent cut does not apply to agriculture, which accounts for 80 percent of water use in the state. Under the new regulations, urban communities that provide more than 20 percent of their water to agriculture businesses, which had complained about the rules, will be able to ask the state not to count that water in computing how much they need to save, presumably pushing them into one of the lower conservation tiers.
“Many communities around the state have been conserving for years,” the board said in its latest draft regulations. “Some of these communities have achieved remarkable results with residential water use now hovering around the state wide target for indoor water use, while others are using many times more. Everyone must do more, but the greatest opportunities to meet the state wide 25 percent conservation standard now exist in those areas with higher water use.”In the revised regulations, the lowest tier, with the 4 percent cut, would apply to the handful of communities that could demonstrate that they have enough surface water to last for several years and have had above-average rainfall. So far, no communities fall into that tier.San Francisco, which had been required to put in place a 10 percent cut, would now have to reduce its usage by 8 percent. Los Angeles, which has a strong record of water conservation, would now have to reduce its use by 16 percent, compared with 20 percent in the first regulations. But big water users like Beverly Hills would be required to cut their water consumption by 36 percent, up from 35 percent.
“Many communities around the state have been conserving for years,” the board said in its latest draft regulations. “Some of these communities have achieved remarkable results with residential water use now hovering around the state wide target for indoor water use, while others are using many times more. Everyone must do more, but the greatest opportunities to meet the state wide 25 percent conservation standard now exist in those areas with higher water use.”In the revised regulations, the lowest tier, with the 4 percent cut, would apply to the handful of communities that could demonstrate that they have enough surface water to last for several years and have had above-average rainfall. So far, no communities fall into that tier.San Francisco, which had been required to put in place a 10 percent cut, would now have to reduce its usage by 8 percent. Los Angeles, which has a strong record of water conservation, would now have to reduce its use by 16 percent, compared with 20 percent in the first regulations. But big water users like Beverly Hills would be required to cut their water consumption by 36 percent, up from 35 percent.
How does the Californians secure water for the future? (3)How does the Californians secure water for the future? (3)

2015/06/23
4
“I only shower once a week. I do not leave the water running when brushing my teeth. I now use hand sanitizer (which I purchase) quite regularly, rather than wash my hands.”Maureen Prystas, San Diego “I've cut my shower time in half by not using very hot water — gets me in and out a lot quicker than my favourite scalding hot showers. I collect the water from the shower as its warming up in a bucket to use to water my plants or wash down my car a bit.”Kathryn Yue, Sacramento “My husband and I use our iPhones to time a three-minute shower. This includes the time it takes the water to heat up.”Teresa Brown, San Francisco “We have several buckets, containers and small garbage cans in the shower. We use one set to catch the water that is not yet heated to shower temperature and another set to capture shower water we have used. We then reuse the water. The clean pre-shower water gets used for watering plants and washing dishes (we microwave a bit of it; we don't have a dishwasher), and then used shower water gets used to water outdoor plants. ”
“I only shower once a week. I do not leave the water running when brushing my teeth. I now use hand sanitizer (which I purchase) quite regularly, rather than wash my hands.”Maureen Prystas, San Diego “I've cut my shower time in half by not using very hot water — gets me in and out a lot quicker than my favourite scalding hot showers. I collect the water from the shower as its warming up in a bucket to use to water my plants or wash down my car a bit.”Kathryn Yue, Sacramento “My husband and I use our iPhones to time a three-minute shower. This includes the time it takes the water to heat up.”Teresa Brown, San Francisco “We have several buckets, containers and small garbage cans in the shower. We use one set to catch the water that is not yet heated to shower temperature and another set to capture shower water we have used. We then reuse the water. The clean pre-shower water gets used for watering plants and washing dishes (we microwave a bit of it; we don't have a dishwasher), and then used shower water gets used to water outdoor plants. ”
What WCWDM measures does the Californians implement? What WCWDM measures does the Californians implement?
“Put in a low-flow toilet.”Lisa Thompson, Berkeley “I've been following the old saying, 'If it's yellow let it mellow, if it's brown flush it down' by flushing my toilet only every 2-3 uses.”Lena T., La Cañada “I really want to have an outdoor composting toiletand I will urge the county to get guidelines in place for that.”Pat Allen, Ojai “I launder in bio friendly soap; do laundry as little as possible by wearing clothing 2-3 times. I use gizmos in the dryer to shorten the cycle.”Anne-Marie Boyce, San Francisco “Let my sheets go for 2 weeks; I wear scrubs at work so can really cut back on laundry.”Margaret Mann, San Francisco “I worry about the water consumed by washing clothes in my 25-year-old washing machine that uses a lot of water, so I'm very careful about adjusting the water level for each load.”
“Put in a low-flow toilet.”Lisa Thompson, Berkeley “I've been following the old saying, 'If it's yellow let it mellow, if it's brown flush it down' by flushing my toilet only every 2-3 uses.”Lena T., La Cañada “I really want to have an outdoor composting toiletand I will urge the county to get guidelines in place for that.”Pat Allen, Ojai “I launder in bio friendly soap; do laundry as little as possible by wearing clothing 2-3 times. I use gizmos in the dryer to shorten the cycle.”Anne-Marie Boyce, San Francisco “Let my sheets go for 2 weeks; I wear scrubs at work so can really cut back on laundry.”Margaret Mann, San Francisco “I worry about the water consumed by washing clothes in my 25-year-old washing machine that uses a lot of water, so I'm very careful about adjusting the water level for each load.”
What WCWDM measures does the Californians implement? (2)What WCWDM measures does the Californians implement? (2)

2015/06/23
5
“I took out my lawn and planted drought resistant native plants, paying attention to those that provide sustenance for birds, bees and butterflies. It has changed my life! My yard is a wildlife emporium with birds nesting, including hummingbirds, butterflies on a regular basis, and bees humming away. This is a positive difference! And I use very little water.”Jeri Edwards, Westlake Village “I work in the landscape construction business and I have never been busier, because we specialize in the installation of drip irrigation for plants and grass. Many are fearful that food prices will sky rocket, so we have been busy installing vegetable gardens. We have figured out how to create a backyard vegetable garden that can recycle and reuse the same water over and over, resulting in water savings of over 90 percent. People are letting their lawns die, or removing their lawns altogether. We must no longer take water for granted.”Mike Garcia, Redondo Beach “I have gotten rid of my lawn and the irrigation system that was necessary to sustain it. I have replaced the grass with salvias, manzanitas, and other drought-tolerant plants. Other areas of the yard I simply leave unplanted.”Gill Doyle, Cupertino “We removed our lawn and put in hardscape and fake grass that requires no water. Other planted areas have followed the water rationing rules in San Diego for months. Our water fountain was modified to reduce evaporation and limit run time. We have reduced our usage by 56 percent.”
“I took out my lawn and planted drought resistant native plants, paying attention to those that provide sustenance for birds, bees and butterflies. It has changed my life! My yard is a wildlife emporium with birds nesting, including hummingbirds, butterflies on a regular basis, and bees humming away. This is a positive difference! And I use very little water.”Jeri Edwards, Westlake Village “I work in the landscape construction business and I have never been busier, because we specialize in the installation of drip irrigation for plants and grass. Many are fearful that food prices will sky rocket, so we have been busy installing vegetable gardens. We have figured out how to create a backyard vegetable garden that can recycle and reuse the same water over and over, resulting in water savings of over 90 percent. People are letting their lawns die, or removing their lawns altogether. We must no longer take water for granted.”Mike Garcia, Redondo Beach “I have gotten rid of my lawn and the irrigation system that was necessary to sustain it. I have replaced the grass with salvias, manzanitas, and other drought-tolerant plants. Other areas of the yard I simply leave unplanted.”Gill Doyle, Cupertino “We removed our lawn and put in hardscape and fake grass that requires no water. Other planted areas have followed the water rationing rules in San Diego for months. Our water fountain was modified to reduce evaporation and limit run time. We have reduced our usage by 56 percent.”
What WCWDM measures does the Californians implement? (3)What WCWDM measures does the Californians implement? (3)
We rinse the dishes with a water bowl rather than running water and only run the dishwasher when it's 101% full (perhaps 2x a week)."Chas Blackford, Mill Valley “Dishes are done by hand in a dishpan and the dishwater used to flush the toilet. To clean greasy dishes and pans, we first wipe them out with used napkins or paper towels, rather than having to cut the grease with hot water; the napkins go into our city's green waste cart for compostables. A bucket or basin at each sink catches the water that runs before gets hot, and that water is used for the vegetable garden. When produce is washed, the water is saved for plants."Peggy Datz, Berkeley “The dishwasher only runs when it is full and we don't wash dishes by hand anymore."
We rinse the dishes with a water bowl rather than running water and only run the dishwasher when it's 101% full (perhaps 2x a week)."Chas Blackford, Mill Valley “Dishes are done by hand in a dishpan and the dishwater used to flush the toilet. To clean greasy dishes and pans, we first wipe them out with used napkins or paper towels, rather than having to cut the grease with hot water; the napkins go into our city's green waste cart for compostables. A bucket or basin at each sink catches the water that runs before gets hot, and that water is used for the vegetable garden. When produce is washed, the water is saved for plants."Peggy Datz, Berkeley “The dishwasher only runs when it is full and we don't wash dishes by hand anymore."
What WCWDM measures does the Californians implement? (4)What WCWDM measures does the Californians implement? (4)

2015/06/23
6
“I'll go to the do-it-yourself car wash and use the vacuum — no need to clean the outside of the car.”Sarah Carvill, Santa Cruz “I no longer take my car through car washes. Instead I save my rinse water when I do my dishes by hand. I pour it from my rinse tub into a bucket which I use to wash my car. I simply dip an old washcloth into the bucket and run it over each part of the car. It successfully cleans the car of all the dust and dirt California is so well known for these days!”Edythe Corum, Clovis “Rather than wash my car weekly I use a duster and wash it monthly.”John Mulvihill, Oakland “Never washing my car. A dirty car exterior never hurt anyone.”
“I'll go to the do-it-yourself car wash and use the vacuum — no need to clean the outside of the car.”Sarah Carvill, Santa Cruz “I no longer take my car through car washes. Instead I save my rinse water when I do my dishes by hand. I pour it from my rinse tub into a bucket which I use to wash my car. I simply dip an old washcloth into the bucket and run it over each part of the car. It successfully cleans the car of all the dust and dirt California is so well known for these days!”Edythe Corum, Clovis “Rather than wash my car weekly I use a duster and wash it monthly.”John Mulvihill, Oakland “Never washing my car. A dirty car exterior never hurt anyone.”
What WCWDM measures does the Californians implement? (5)What WCWDM measures does the Californians implement? (5)
Californian StrategiesCalifornian Strategies
Water restrictions – 25% SIV reduction targetWCWDM – water saving tipsInfrastructure – dams to be enlargedSea water desalination plants
Water restrictions – 25% SIV reduction targetWCWDM – water saving tipsInfrastructure – dams to be enlargedSea water desalination plants

2015/06/23
7
National: Cumulative Annual Rainfall
0
500
1000
1500
2000
2500
3000
3500
4000
4500
5000
5500
6000
6500
7000
7500
8000
8500
9000
9500
10000
October November December January February March April May June July August September
Ra
infa
ll (m
m)
National: Cumulative Annual Rainfall Since 2009/10 and Percentiles Since October 1960
<10 th Percenti le 10-50th Percentile 50-95th Percentile 200 9/2 010 201 0/2 011 201 1/2 012
201 2/2 013 201 3/2 014 Very We t Normal Very Dry 201 4/2 015

2015/06/23
8
Eastern Cape: Cumulative Annual Rainfall
0
100
200
300
400
500
600
700
800
900
1 000
1 100
1 200
1 300
1 400
October November December January February March April May June July August September
Ra
infa
ll (m
m)
Period (Month)
Eastern Cape: Cumulative Annual Rainfall Since 2009/10 and Percentiles Since October 1960
<10 th Percenti le 10-50th Percentile 50-95th Percentile 200 9/2 010 201 0/2 011 201 1/2 012
201 2/2 013 201 3/2 014 Very Dry Normal Very We t 201 4/2 015
Northern Cape: Cumulative Annual Rainfall
0
100
200
300
400
500
600
700
October November December January February March April May June July August September
Ra
infa
ll (m
m)
Northern Cape: Cumulative Annual Rainfall Since 2009/10 and Percentiles Since October 1960
<10 th Percenti le 10-50th Percentile 50-95th Percentile 200 9/2 010 201 0/2 011 201 1/2 012
201 2/2 013 201 3/2 014 Very Dry Normal Very We t 201 4/2 015

2015/06/23
9
Free State: Cumulative Annual Rainfall
0
100
200
300
400
500
600
700
800
900
1000
1100
1200
1300
October November December January February March April May June July August September
Ra
infa
ll (m
m)
Free State: Cumulative Annual Rainfall Since 2009/10 and Percentiles Since October 1960
<10 th Percenti le 10-50th Percentile 50-95th Percentile 200 9/2 010 201 0/2 011 201 1/2 012
201 2/2 013 201 3/2 014 Very Dry Normal Very We t 201 4/2 015
Western Cape: Cumulative Annual Rainfall
0
100
200
300
400
500
600
700
800
900
1000
1100
October November December January February March April May June July August September
Ra
infa
ll (m
m)
Western Cape: Cumulative Annual Rainfall Since 2009/10 and Percentiles Since October 1960
<10 th Percenti le 10-50th Percentile 50-95th Percentile 200 9/2 010 201 0/2 011 201 1/2 012
201 2/2 013 201 3/2 014 Very Dry Normal Very We t 201 4/2 015

2015/06/23
10
Gauteng: Cumulative Annual Rainfall
0
100
200
300
400
500
600
700
800
900
1000
1100
1200
1300
1400
October November December January February March April May June July August September
Ra
infa
ll (m
m)
Gauteng: Cumulative Annual Rainfall Since 2009/10 and Percentiles Since October 1960
<10 th Percenti le 10-50th Percentile 50-95th Percentile 200 9/2 010 201 0/2 011 201 1/2 012
201 2/2 013 201 3/2 014 Very Dry Normal Very We t 201 4/2 015
Limpopo: Cumulative Annual Rainfall
0
100
200
300
400
500
600
700
800
900
1000
1100
1200
1300
1400
1500
1600
October November December January February March April May June July August September
Ra
infa
ll (m
m)
Limpopo: Cumulative Annual Rainfall Since 2009/10 and Percentiles Since October 1960
<10 th Percenti le 10-50th Percentile 50-98th Percentile 200 9/2 010 201 0/2 011 201 1/2 012
201 2/2 013 201 3/2 014 Very Dry Normal Very We t 201 4/2 015

2015/06/23
11
North West: Cumulative Annual Rainfall
0
100
200
300
400
500
600
700
800
900
1000
1100
1200
October November December January February March April May June July August September
Ra
infa
ll (m
m)
Northwest: Cumulative Annual Rainfall Since 2009/10 and Percentiles Since October 1960
<10 th Percenti le 10-50th Percentile 50-95th Percentile 200 9/2 010 201 0/2 011 201 1/2 012
201 2/2 013 201 3/2 014 Very Dry Normal Very We t 201 4/2 015
Mpumalanga: Cumulative Annual Rainfall
0
100
200
300
400
500
600
700
800
900
1000
1100
1200
1300
1400
1500
1600
1700
1800
October November December January February March April May June July August September
Ra
infa
ll (
mm
)
Mpumalanga: Cumulative Annual Rainfall Since 2009/10 and Percentiles Since October 1960
<10 th Percenti le 10-50th Percentile 50-98th Percentile 200 9/2 010 201 0/2 011 201 1/2 012
201 2/2 013 201 3/2 014 Very Dry Normal Very We t 201 4/2 015

2015/06/23
12
Kwazulu-Natal: Cumulative Annual Rainfall
0
100
200
300
400
500
600
700
800
900
1000
1100
1200
1300
1400
1500
1600
1700
October November December January February March April May June July August September
Ra
infa
ll (m
m)
Kwazulu-Natal: Cumulative Annual Rainfall Since 2009/10 and Percentiles Since October 1960
<10 th Percenti le 10-50th Percentile 50-95th Percentile 200 9/2 010 201 0/2 011 201 1/2 012
201 2/2 013 201 3/2 014 Very Dry Normal Very We t 201 4/2 015
National Dam Storage – 25 May 2015National Dam Storage – 25 May 2015

2015/06/23
13
Dam Storage Levels - 25 May 2015
2015/06/23
14
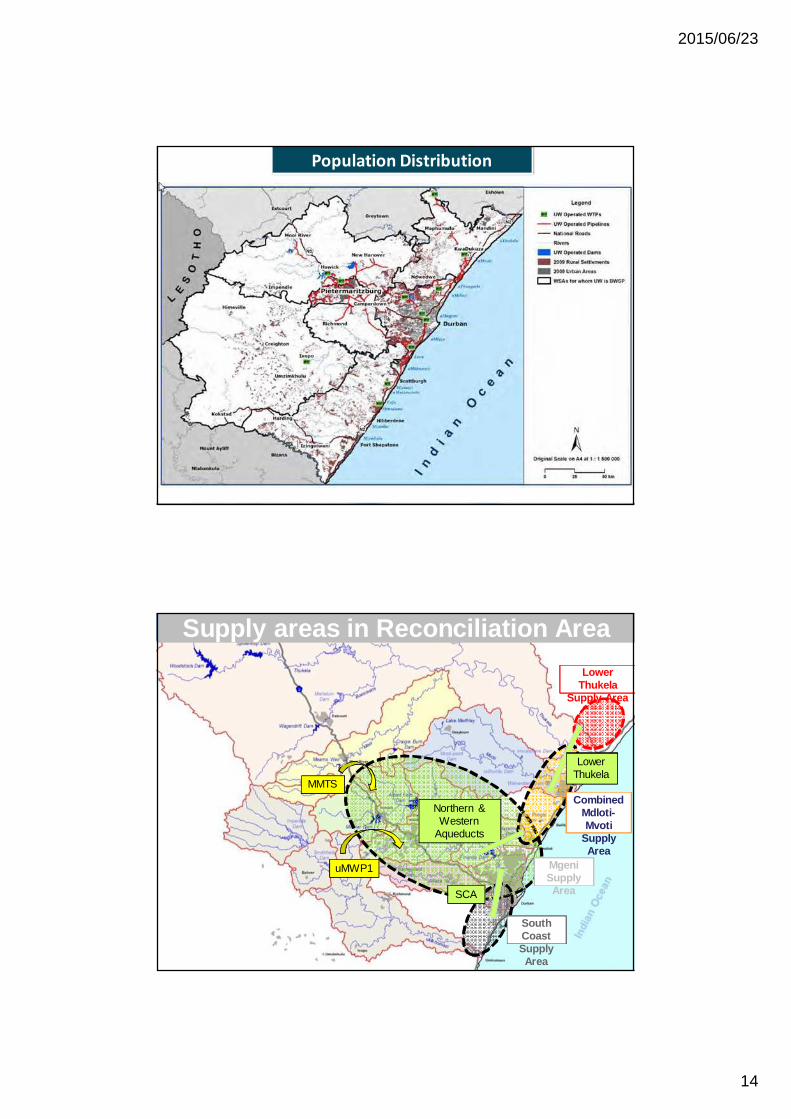
Population Distribution
Supply areas in Reconciliation Area
MgeniSupply Area
Lower Thukela
Supply Area
Combined Mdloti-Mvoti
Supply Area
South CoastSupply Area
MMTS
uMWP1
Lower Thukela
SCA
Northern & Western
Aqueducts

2015/06/23
15
• eThekwiniMetro 868
• MzunduziLM 177
• UgungundlovuDM 42
• IlembeDM&SSW 48
• UguDM 26
• HarryGwalaDM 3
• Other 10
• TOTAL 1204
Umgeni Water Supply(Ml/d)
Available Yield (Ml/d)
•MgeniSystem(MMTS1) 1079
•Hazelmere 55
•SouthCoast 12
•Other(approx) 20
•TOTAL 1156
TOTALSUPPLY 1204

2015/06/23
16
CURRENT WATER RESOURCESCURRENT WATER RESOURCES
Shortfall
Proposed Water Resources Development
Proposed Water Resources Development
Bulk Water SS
Desalination
2015/06/23
17
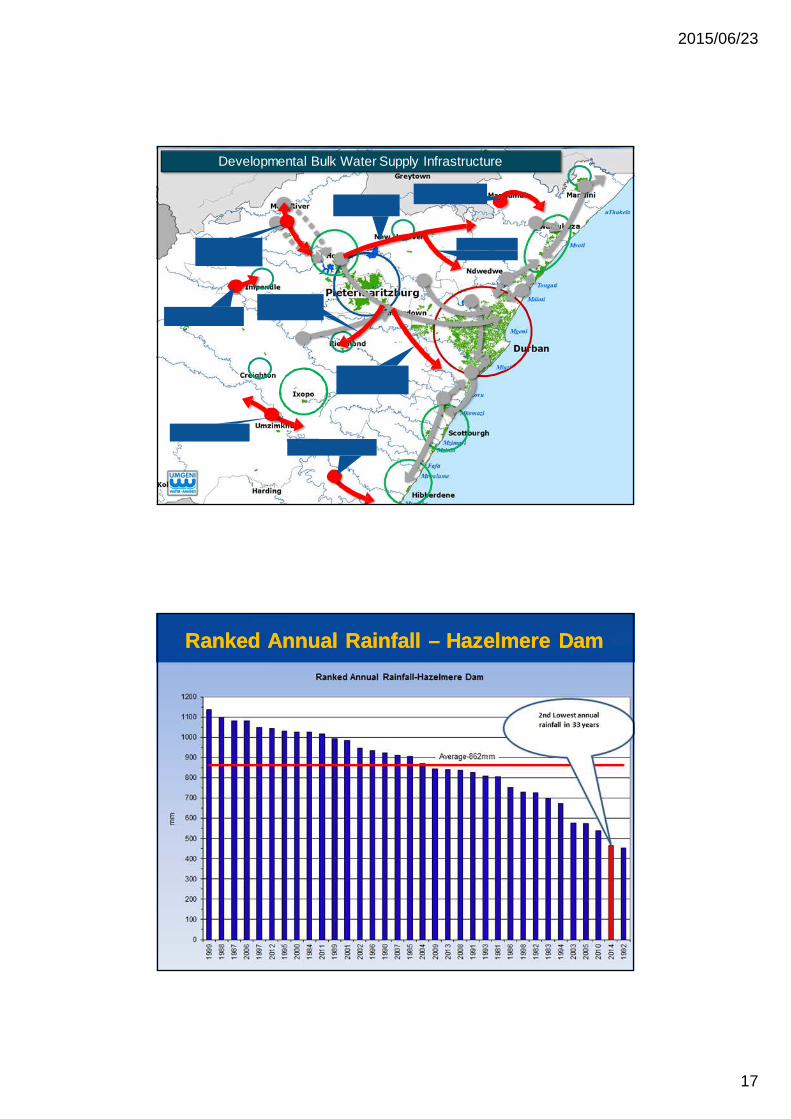
Developmental Bulk Water Supply Infrastructure
Ranked Annual Rainfall – Hazelmere DamRanked Annual Rainfall – Hazelmere Dam

2015/06/23
18
41% reduction for irrigation since Nov 2014
Hazelmere Historical Water Storage
Raw Water Abstraction 2013/2014

2015/06/23
19
Situation as on 11 June 2015
Current Situation• 250 000 People in the Hazelmere Supply Area
• Hazelmere Dam 31.69%
• Dead Storage 15%
• Number of days at current demand 66 days
Failure on the 15 August 2015
Strategy Going ForwardStrategy Going Forward

2015/06/23
20
News 24 – 21 June 2015News 24 – 21 June 2015Durban - Sunday was the first day that water rationing kicked in at a number of municipalities in KwaZulu-Natal in a bid to conserve water resources in the province.The drought is the worst that has been experienced by the province since 1992, Co-operative Governance and Traditional Affairs MEC Nomusa Dube-Ncube said.Dube-Ncube last week warned that the province was suffering water shortages and that mandatory water conservation measures would have to be implemented.eThekwini Municipality (Durban and surrounds); Ilembe (Stanger, Ballito, Ndwedwe); uThungulu (Richards Bay, uMfolozi) and Mtubatuba will be most affected.In a statement released on Sunday, Dube-Ncube said: “Today some municipalities will commence with radical water rationing programmes as part of managing the available water resources.
Durban - Sunday was the first day that water rationing kicked in at a number of municipalities in KwaZulu-Natal in a bid to conserve water resources in the province.The drought is the worst that has been experienced by the province since 1992, Co-operative Governance and Traditional Affairs MEC Nomusa Dube-Ncube said.Dube-Ncube last week warned that the province was suffering water shortages and that mandatory water conservation measures would have to be implemented.eThekwini Municipality (Durban and surrounds); Ilembe (Stanger, Ballito, Ndwedwe); uThungulu (Richards Bay, uMfolozi) and Mtubatuba will be most affected.In a statement released on Sunday, Dube-Ncube said: “Today some municipalities will commence with radical water rationing programmes as part of managing the available water resources.
News 24 – 21 June 2015 (continued)News 24 – 21 June 2015 (continued)"Water rationing means that water production will be reduced and, as a result of this water reduction, less water will be supplied to municipalities. This will have a knock-on effect on consumers who will be given a set amount of water per day and once the water quantum allocated to households is consumed, there will be no water available until the following day when a new amount is allocated.”The northern areas of eThekwini and the southern areas of Illembe, which are supplied by Hazelmere Dam, are expected to be the worst affected.Last week Dube-Ncube said Hazelmere Dam had a mere two months supply of water remaining if restrictions were not implemented.“We require major changes in policy and consumer behaviour to manage the current water crisis in our province. Today, not tomorrow, is the time to begin to change the way we treat water by conserving every drop,” she said.“Water rationing timetables will be issued on a weekly basis and consumers and municipalities are urged to take note of water allocations available and use water sparingly. The less prudent we are with water, the higher the risk of water shortages we will face,” said Dube-Ncube.
"Water rationing means that water production will be reduced and, as a result of this water reduction, less water will be supplied to municipalities. This will have a knock-on effect on consumers who will be given a set amount of water per day and once the water quantum allocated to households is consumed, there will be no water available until the following day when a new amount is allocated.”The northern areas of eThekwini and the southern areas of Illembe, which are supplied by Hazelmere Dam, are expected to be the worst affected.Last week Dube-Ncube said Hazelmere Dam had a mere two months supply of water remaining if restrictions were not implemented.“We require major changes in policy and consumer behaviour to manage the current water crisis in our province. Today, not tomorrow, is the time to begin to change the way we treat water by conserving every drop,” she said.“Water rationing timetables will be issued on a weekly basis and consumers and municipalities are urged to take note of water allocations available and use water sparingly. The less prudent we are with water, the higher the risk of water shortages we will face,” said Dube-Ncube.

2015/06/23
21
Reconciliation Study – Strategic ActionsReconciliation Study – Strategic Actions
41
1. Mooi-Mgeni Transfer Scheme (MMTS)
2. Raising of Hazelmere Dam
3. uMkhomazi Water Project (uMWP)
4. Lower Thukela Bulk Water Supply Scheme (LTBWS)
5. North Coast Pipeline and Hazelmere Supply Infrastructure
6. Lower uMkhomazi Feasibility Study
7. Desalination
8. Re-use of Water: Hazelmere dam
9. WCWDM - Ethekwini, Ilembe, Ugu, Umgungundlovu
Municipalities
Key Demand Centres/Reconciliation StrategiesKey Demand Centres/Reconciliation Strategies

2015/06/23
22
Greater Bloemfontein System
WC/WDM Requirement = ± 15 million m 3/a
Greater Bloemfontein System
WC/WDM Requirement = ± 15 million m 3/a
Drakenstein Water Demand Management
Drakenstein Water Demand Management
0
5000
10000
15000
20000
25000
30000
35000
19
89
19
90
19
91
19
92
19
93
19
94
19
95
19
96
19
97
19
98
19
99
20
00
20
01
20
02
20
03
20
04
20
05
20
06
20
07
20
08
20
09
20
10
20
11
20
12
20
13
Wa
ter
De
ma
nd
(M
l/y
ea
r)
Time (Years)
Paarl Water Demand 1989 to 2013
Actual Demand
Projected Demand @ 3.5 %
Saving of 158 600 000 000 litres
Sav ing of R790 Million @ R5/Kl

2015/06/23
23
Amatole Water Supply System
WC/WDM Requirement = ± 10million m 3/a
Amatole Water Supply System
WC/WDM Requirement = ± 10million m 3/a
WesternCapeWaterSupplySystem
WesternCapeWaterSupplySystem

2015/06/23
24
Western Cape Water Supply System
WC/WDM Requirement = ± 80million m 3/a
Western Cape Water Supply System
WC/WDM Requirement = ± 80million m 3/a
Western Cape WSS – Success of WCWDMWestern Cape WSS – Success of WCWDM
Existing System Yield
400
450
500
550
600
650
700
750
800
2003 2005 2007 2009 2011 2013 2015 2017 2019 2021 2023 2025
Annual
Requir
em
ents
(m
illion m
3/a)
Year
WCWSS : RECONCILIATION OF SUPPLY AND REQUIREMENT

2015/06/23
25
Existing Transfer Schemes
Proposed Transfer Schemes Mokolo Catchment
Crocodile CatchmentVaal Catchment
Integrated Vaal River System
Vaal GamagaraTransfer Scheme
VaalhartsIirrigationScheme
Heyshope Transfer Scheme
Zaaihoek Transfer Scheme
Sedibeng Water
Midvaal Water
Rand Water
Lephalale
Lephalale
Komati-Olifants
Upper OlifantsMainly Power Stations
Tuhkela-VaalTransfer Scheme
LHWP#1
Sasol
49
2400
2600
2800
3000
3200
3400
3600
3800
2005 2010 2015 2020 2025 2030 2035 2040 2045 2050
Yie
ld /
Wa
ter
Re
qu
ire
me
nts
(m
illi
on
m3/a
)
Vaal River Reconciliation PerspectiveVaal River Reconciliation Perspective
First transfer from LHWP Phase II
System Yield
Yield increases due to desalination of mine water
High with target WC/WDM
Desalination for urban use
Unlawful removed Re-use (Tshwane )
Short term availability due to current reservoir volumes
• High water requirement• Unlawful removed• WC/WDM• Tshwane re-use
• High water requirement• Unlawful removed
LHWP Phase II Yield
(Polihali Dam)
50

2015/06/23
26
51
Area
2008/09
Annual
Demand
(million m3/a)
2008/09
Non-Revenue
Water
(million m3/a)
2005/06
Possible
Savings
(million m3/a)
%
Reduction
of annual
demand
% Contribution
of possible
saving
Johannesburg 505.4 191.5 110.2 22% 56.2%
Tshwane 274.4 73.6 20.3 7% 10.4%
Ekurhuleni 327.9 126.5 28.3 9% 14.4%
Emfuleni 79.3 32.3 26.1 33% 13.3%
Mogale 27.8 9.3 1.7 6% 0.9%
Westonaria 6.2 1.9 0.8 13% 0.4%
Randfontein 8.7 2.7 0.4 4% 0.2%
Lesedi 5.1 0.8 0.3 7% 0.2%
Kungwini 25.0 10.5 5.0 20% 2.5%
Nokeng 2.1 0.5 0.2 11% 0.1%
Merafong City 9.8 2.2 1.4 14% 0.7%
Midvaal 10.7 2.6 1.2 11% 0.6%
Total 1282.4 454.5 195.8 15% 100.0%
Vaal River Reconciliation PerspectivesVaal River Reconciliation PerspectivesWater Conservation and Water Demand Management,
eradication of unlawful use,
desalination and re-use of mine water as well as Tshwane re-use project
are all essential to maintain balance until LHWP Phase 2 can be implemented
Water Conservation and Water Demand Management,
eradication of unlawful use,
desalination and re-use of mine water as well as Tshwane re-use project
are all essential to maintain balance until LHWP Phase 2 can be implemented
52

2015/06/23
27
SummarySummary
We have solutionsSolutions are all incorporated into various Strategies – Recon / All Town - and guidelines ...Roles and Responsibilities are clearImplementation is crucial (infrastructure / supply side and demand side measures) WCWDM is a critical measure to ensure water securityNo Drop ...
We have solutionsSolutions are all incorporated into various Strategies – Recon / All Town - and guidelines ...Roles and Responsibilities are clearImplementation is crucial (infrastructure / supply side and demand side measures) WCWDM is a critical measure to ensure water securityNo Drop ...
No Drop Certification ProgrammeNo Drop Certification Programme

2015/06/23
28
OverviewOverview
� Brief background on No Drop
� Progress to date
� 10 year planning
� An Overview of the 7 criteria
Prime risk to the municipal sector in terms of water availability and financial sustainability. This primary risk translates to direct risk to all water users.
The underlying reasons were numerous:
managerial and technical skills in municipalities; aging and dilapidated infrastructure; rapid housing developments which were not aligned to infrastructure master planning and budgets; and poor understanding of the complexities of water supply and demand management.
. Current situation regarding water use as compared to Current situation regarding water use as compared to
its available resources and Water Use Authorisations/Licenses
Inefficient water usage and water loss
2015/06/23
29
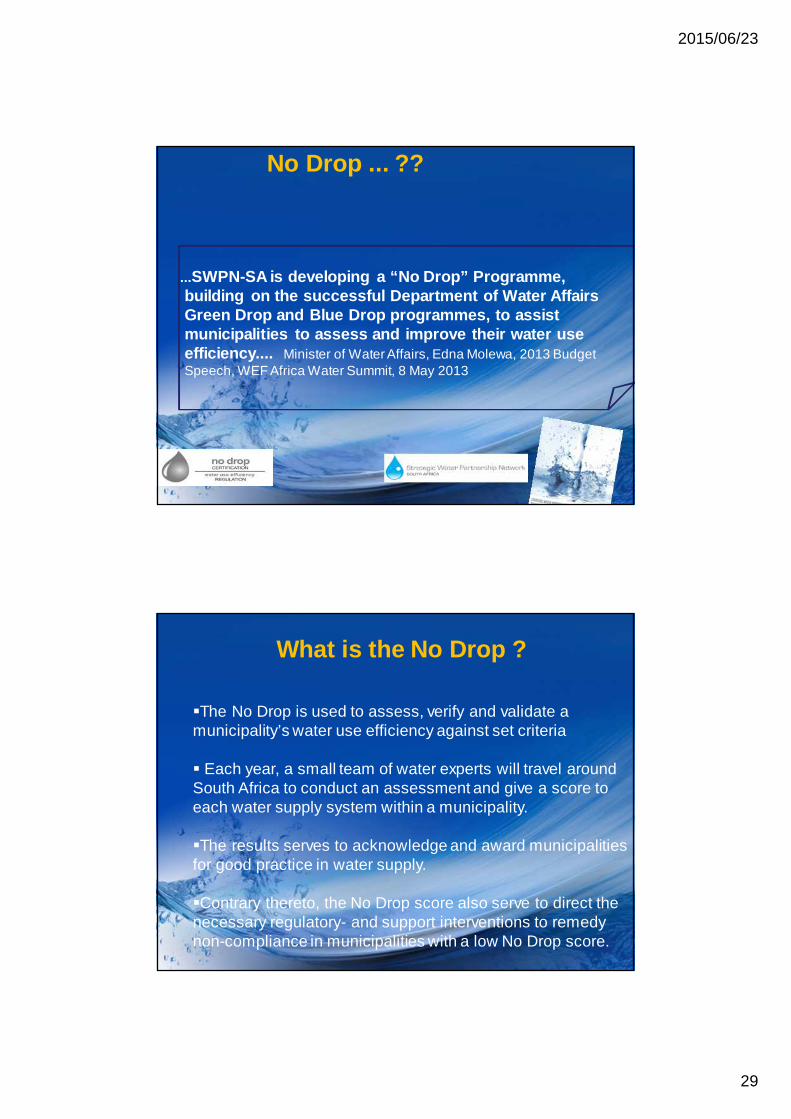
...SWPN-SA is developing a “No Drop” Programme, building on the successful Department of Water Affa irs Green Drop and Blue Drop programmes, to assist municipalities to assess and improve their water us e efficiency.... Minister of Water Affairs, Edna Molewa, 2013 Budget Speech, WEF Africa Water Summit, 8 May 2013
No Drop ... ??
What is the No Drop ?
�The No Drop is used to assess, verify and validate a municipality’s water use efficiency against set criteria
� Each year, a small team of water experts will travel around South Africa to conduct an assessment and give a score to each water supply system within a municipality.
�The results serves to acknowledge and award municipalities for good practice in water supply.
�Contrary thereto, the No Drop score also serve to direct the necessary regulatory- and support interventions to remedy non-compliance in municipalities with a low No Drop score.

2015/06/23
30
PURPOSE OF NO DROP PURPOSE OF NO DROP Minister and Industry partners (SWPN) concerned about water security;
developed an incentive and risk based regulatory programme that seeks to :� Improve service delivery and water security, whilst reducing water
losses and non revenue water
� Provides a guideline to water services institutions on what isrequired to achieve objectives.
�Incorporate the whole water services cyclePolitical and management levels, finance and technicaldepartments and customers.
�Encourage and acknowledge continuous improvement andperformance excellence in water use efficiency, water loss and NRWmanagement in South Africa�Provide the South African public with credible and transparent resultson the status of water use efficiency, and the management thereof, intheir cities and towns.
In short, DWS developed No Drop programme to draw f ocus and encourage progress in WDM, water use efficiency and water loss management in SA municipal sector
No Drop Certification will mean that the municipali ty has accomplished its WCWDM practices and receives publi c accolade and acknowledgement of its excellence in w ater supply management against a set of strict criteria

2015/06/23
31
Blue Drop 2009 – 2012 No Drop 2012 - 2015 Green Drop 2009 – 2012
1 WSP 1
WCWDM Strategy,
planning &
implementation
1 W2RAP
2 Asset management 2 Asset management 2 Asset management
3 Technical skills 3 Technical skills 3 Technical skills
4Credibility and
accountability4 Credibility 4
Credibility and
accountability
5 Compliance 5Compliance &
Performance5 Compliance
6 Local regulation 6 Local regulation (Bylaws)
7 Customer care
?
WATER USE EFFICIENCY: NO DROP Methodology
� In 2014, the programme was implemented, by introducing the following activities:
� 3% No Drop Audits (FY: 2012/13): Purpose: to establish the status of water losses in SA at all municipalities, baseline quantification, performance and status of plans, funding and priorities
� No Drop Metro (full) audit (FY: 2013/14):Purpose: to establish the status of water losses in SA at all metropolitans, including their plans to conform to national strategies
� No Drop PAT and Risk Assessments (FY: 2013/14):Purpose: to establish the risk of each municipality pertaining to the most critical risk indicators
water availability, water use (SIV), performance, technical skills, planning and resources to implement plans

2015/06/23
32
No Drop Progress Assessment Tool : FY 2013 - 2014
The No Drop PAT follows the model of the Blue Drop and Green Drop PATs, which are based on an assessment of key risks in the field of Water Conservation and Demand Management.
An indicator of progress or digressThe No Drop PAT comprise of an excel based spreadsheet which has been sent to WSAs, for self-assessment and completion. Due 23 January 2015
The WSA will have to provide specific evidence to be returned with the completed ND PAT spreadsheet.
The PAT will be moderated, and the findings shared with the WSA. The WSA will be provided with an opportunity to provide further evidence, before the final moderation process will conclude the risk-based score (Critical Risk Rating -CRR).
The No Drop PAT Progress Report will mark the commencement of a risk-based trend analysis.
No Drop PAT- 7 KRANo Drop PAT- 7 KRA
� Water availability targets� What is the water usage target for the WSA
� Current usage� Water usage v/s resource availability
� Performance indicators� Performance indicators in terms of IWA water balanc e
� WCWDM plans� Signed plans in place with implementation intervent ions
� HR Risk Rating� A sufficiently sized WCWDM technical team per munic ipal
category and population served� Top 5 WCWDM initiatives
� With reference to the plans WSA lists the Top prior ity projects aligning to the 2017 and 2022 targets as per NDP
� Water availability targets� provide target set for the WCWDM strategies and pla ns for the
2017 and 2022 horizon as per the NDP
2015/06/23
33
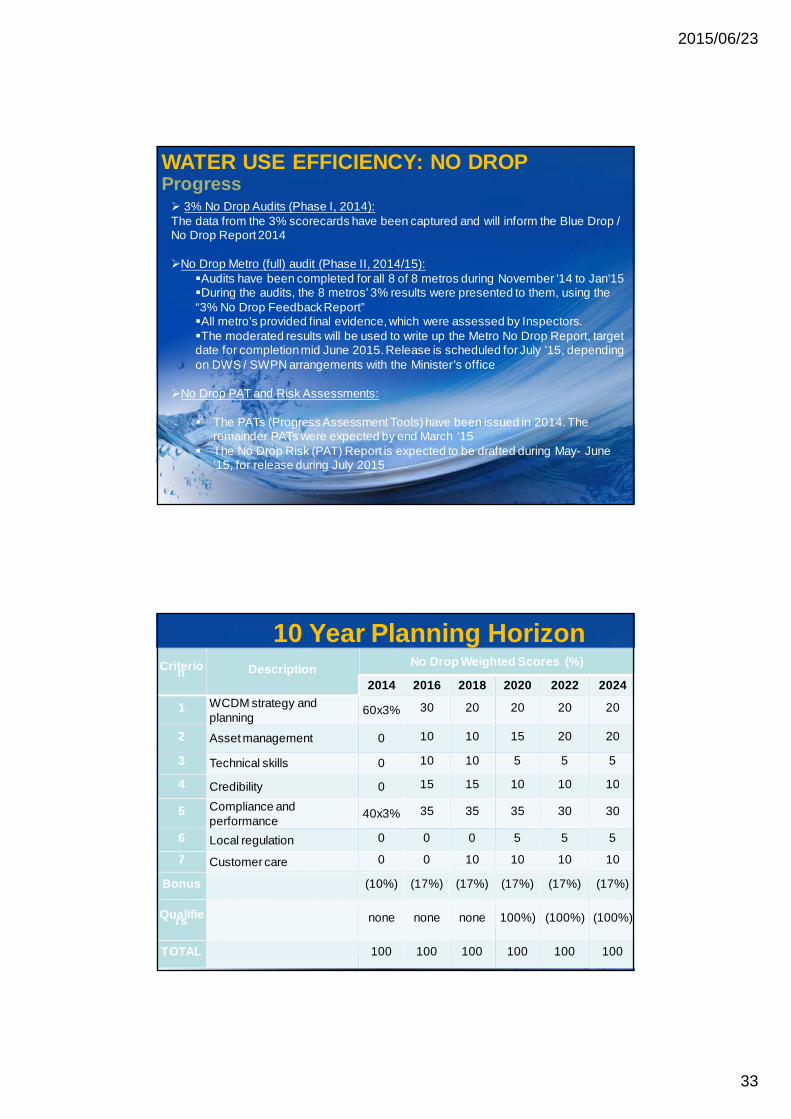
WATER USE EFFICIENCY: NO DROP Progress� 3% No Drop Audits (Phase I, 2014):The data from the 3% scorecards have been captured and will inform the Blue Drop / No Drop Report 2014
�No Drop Metro (full) audit (Phase II, 2014/15):�Audits have been completed for all 8 of 8 metros during November ’14 to Jan’15�During the audits, the 8 metros’ 3% results were presented to them, using the “3% No Drop Feedback Report”�All metro’s provided final evidence, which were assessed by Inspectors. �The moderated results will be used to write up the Metro No Drop Report, target date for completion mid June 2015. Release is scheduled for July ’15, depending on DWS / SWPN arrangements with the Minister’s office
�No Drop PAT and Risk Assessments:
� The PATs (Progress Assessment Tools) have been issued in 2014. The remainder PATs were expected by end March ‘15
� The No Drop Risk (PAT) Report is expected to be drafted during May- June ’15, for release during July 2015
Criteria 1:Criteria 1:
Criterion DescriptionNo Drop Weighted Scores (%)
2014 2016 2018 2020 2022 2024
1 WCDM strategy and planning
60x3% 30 20 20 20 20
2 Asset management 0 10 10 15 20 20
3 Technical skills 0 10 10 5 5 5
4 Credibility 0 15 15 10 10 10
5 Compliance and performance
40x3% 35 35 35 30 30
6 Local regulation 0 0 0 5 5 5
7 Customer care 0 0 10 10 10 10
Bonus (10%) (17%) (17%) (17%) (17%) (17%)
Qualifiers none none none 100%) (100%) (100%)
TOTAL 100 100 100 100 100 100
10 Year Planning Horizon

2015/06/23
34
Criteria 1:Criteria 1:
Criterion Description No Drop Weighted Scores (%)
2014 2016 2018 2020 2022 2024
1 WCDM strategy and planning
60 of 3%
30 20 20 20 20
2 Asset management 0 10 10 15 20 20
3 Technical skills 0 10 10 5 5 5
4 Credibility 0 15 15 10 10 10
5 Compliance and performance
40 of 3%
35 35 35 30 30
6 Local regulation 0 0 0 5 5 5
7 Customer care 0 0 10 10 10 10
Bonus (10%) (17%) (17%) (17%) (17%) (17%)
Qualifiers none none none (100%) (100%) (100%)
TOTAL 100 100 100 100 100 100
Year 1: Baseline
Introduction
Criteria 1:Criteria 1:
Criterion DescriptionNo Drop Weighted Scores (%)
2014 2016 2018 2020 2022 2024
1 WCDM strategy and planning
60 of 3%
30 20 20 20 20
2 Asset management 0 10 10 15 20 20
3 Technical skills 0 10 10 5 5 5
4 Credibility 0 15 15 10 10 10
5 Compliance and performance
40 of 3%
35 35 35 30 30
6 Local regulation 0 0 0 5 5 5
7 Customer care 0 0 10 10 10 10
Bonus (10%) (17%) (17%) (17%) (17%) (17%)
Qualifiers none none none (100%) (100%) (100%)
TOTAL 100 100 100 100 100 100
Years 2 - 4
Prioritising Implementation
of WDM

2015/06/23
35
Criteria 1:Criteria 1:
Criterion Description No Drop Weighted Scores (%)
2014 2016 2018 2020 2022 2024
1 WCDM strategy and planning
60 of 3%
30 20 20 20 20
2 Asset management 0 10 10 15 20 20
3 Technical skills 0 10 10 5 5 5
4 Credibility 0 15 15 10 10 10
5 Compliance and performance
40 of 3%
35 35 35 30 30
6 Local regulation 0 0 0 5 5 5
7 Customer care 0 0 10 10 10 10
Bonus (10%) (17%) (17%) (17%) (17%) (17%)
Qualifiers none none none (100%) (100%) (100%)
TOTAL 100 100 100 100 100 100
Years 4 – 10
Towards excellence
WCWDM STRATEGY, PLANNING AND IMPLEMENTATION
WCWDM STRATEGY, PLANNING AND IMPLEMENTATION
Criteria 1:Criteria 1:

2015/06/23
36
Criteria 1: WCDM Strategy, planning and implementation - OverviewCriteria 1: WCDM Strategy, planning and implementation - Overview
� 1.1: Water resource balance diagram� 1.2: Water Balance� 1.3: WDM Strategy and business plan� 1.4: Number of metered customers� 1.5: Percentage of metered connections billed� 1.6: Flat rate or deemed consumption billing rate� 1.7: Tariffs� Criteria 1 Bonus (a): Multi-year water balances� Criteria 1 Bonus (b): Household leak repair program me� Criteria 1 Penalty (a): WUL Regulatory compliance� Criteria 1 Penalty (b): Inclusion in the IDP
� 1.1: Water resource balance diagram� 1.2: Water Balance� 1.3: WDM Strategy and business plan� 1.4: Number of metered customers� 1.5: Percentage of metered connections billed� 1.6: Flat rate or deemed consumption billing rate� 1.7: Tariffs� Criteria 1 Bonus (a): Multi-year water balances� Criteria 1 Bonus (b): Household leak repair program me� Criteria 1 Penalty (a): WUL Regulatory compliance� Criteria 1 Penalty (b): Inclusion in the IDP
71
Criteria 1: Key ObjectivesCriteria 1: Key Objectives
� What is the state of water consumption, water lossesand non-revenue water in the water servicesinstitution?
� Can the WSIs equate/balance the flow of water in andout of supply system
� What are the plans of the water services institution toreduce system input volume, water losses and non-revenue water?
� What progress has been made with the implementation of these plans?

2015/06/23
37
�The municipality must demonstrate a thorough understanding of its currentsituation regarding water use as compared to its available resources andWater Use Authorisations/Licenses.
� It must further demonstrate a thorough understanding of its water usepatterns by providing credible water balance diagrams based on IWAguidelines.
� The diagrams must be prepared on a monthly basis. Using the WaterResource Balance diagrams as well as the IWA Water Balance diagrams,the municipality must present a workable Council approved Water DemandManagement strategy, along with evidence of implementation thereof,indicating how the municipality aims to achieve its own internal targets,National Reconciliation Strategy as well as Presidential targets.
Note : All underlined v alues hav e been c alculated us ing trends and / or av erages based on previous y ears.
Year endin g1 Jul 06 - 30
Ju n 07
1 Jul 07 - 30
Jun 08
1 Jul 08 - 30
Jun 09
1 Jul 09 - 30
Jun 10
1 Jul 10 - 30
Jun 11
1 Jul 11 - 30
Jun 12
1 Jan - 31
Dec 2012 Dec-13
I ndicator as % of system i nput vo lume
80. 1% 79.8% 76.7% 74. 8% 80.4% 79.5% 79. 0% 79.8%
% Non-revenue water 19. 9% 20.2% 23.3% 25. 2% 19.6% 20.5% 21. 0% 20.2%
% Water Losses 19. 9% 20.2% 23.3% 25. 2% 19.4% 15.3% 17. 9% 14.7%
System inp ut vol ume u nit consumption
259 258 265 257 219 211 272 211
29 28 29 28 24 23 29 20
46 46 47 46 41 40 49 38
Authori sed Unit Consu mp ti on
208 206 203 192 177 175 220 176
23 23 22 21 19 19 24 17
37 37 36 34 33 33 40 32
36 37 36 34 32 22 33 20
No data No data No data No data No data 312 216 No data
Water loss indicators
52 52 62 65 43 36 52 35
6 6 7 7 5 4 6 3
9 9 11 11 8 7 9 6
61 61 61 61 61 61 61 61
184 186 220 230 158 135 188 127
3. 0 3.0 3.6 3. 8 2.6 2.2 3.1 2.1
11 11 13 13 9 8 11 7
0.60% 2. 80% 0.60% 4.76% 4. 33% 4.15% -4.28% 6. 88%
4.73% 2. 31% 3.21% 1.65% -10. 93% 11.93% 17.66% -13. 15%
3. 28% 3.09% 3.09% 3. 09% 3.09% 3.14% 3. 04%
1. 62% 1.43% 1.43% 1. 43% 1.43% 0.83% 0. 83%
2.20% 2. 60% 3.32% 1.85% 3. 09%
3.21% 0. 02% 1.36% 4.24% 0. 70%
I WA Water Balance Diagram (mi lli on m3/annum) for 1 Jul 12 - 30 Ju n 13 (select year)
## ##### ##### #### ##### ### ###### ##### # ## ###### #### #### ###### ##
#### ##### ### ###### ##### # ## ###### #### #### ###### ##
###### ##### # ## ###### ####
###### ##### # ## ###### ####
## ###### ####
## ###### ####
% Water demand growth without WDM
% Water demand gro wth with WDM
Domestic m³ / connecti on / month
Non-d omesti c m³ / connection / month
CARL : Lo sses (li tres / connection / day)
I nfrastructure L eakage I ndex (I LI )
Li tres / capita / day
m³ / household / month
m³ / connection / month
Li tres / capita / day
m³ / household / month
Li tres / capita / day
m³ / connection / month
% Revenue water
Key
pe
rfo
rman
ce
ind
ica
tors
5 Y ear Annualised Water Growth
5 Year Annualised Population Growth
CARL : Losses (m3 / km mai ns / day)
% P opulati on growth
% Water demand growth
m³ / household / month
m³ / connection / month
UARL : Lo sses (li tres / connection / day)
Sys tem Input Volume =
388.315
Water losses = 69.479R eal Losses = 42. 243 R eal Losses = 42. 243
N on-rev enue w ater = 81. 527
Authoris ed cons umption =
318.836
Apparent los ses = 27. 236 Apparent los ses = 27. 236
Rev enue w ater = 306. 788
Unbilled author ised = 12. 048
Billed author ised = 306.788
Unbilled mete red = 9. 669
Billed metered = 305. 569

2015/06/23
38
ASSET MANAGEMENTASSET MANAGEMENT
Criteria 2Criteria 2
Criteria 2: Asset Management - OverviewCriteria 2: Asset Management - Overview
� 2.1: Asset register
� 2.2: Mains replacement programme
� 2.3: Consumer meter maintenance and replacement
programme
� 2.4: Control valve and Bulk meter maintenance
� 2.5: Monitoring and analysis of, and response to high water
loss supply zones
� 2.6: O&M Budgets and Expenditure
� 2.1: Asset register
� 2.2: Mains replacement programme
� 2.3: Consumer meter maintenance and replacement
programme
� 2.4: Control valve and Bulk meter maintenance
� 2.5: Monitoring and analysis of, and response to high water
loss supply zones
� 2.6: O&M Budgets and Expenditure

2015/06/23
39
Criteria 2: Key ObjectivesCriteria 2: Key Objectives
� What is the location and conditions of water servic es infrastructure that has a direct impact on water losses and non-revenue water?
� Is the water services infrastructure operated and maintained in an efficient, affordable, equitable, economical and sustainable manner?
� What is the location and conditions of water servic es infrastructure that has a direct impact on water losses and non-revenue water?
� Is the water services infrastructure operated and maintained in an efficient, affordable, equitable, economical and sustainable manner?
Asset registers must be presented which demonstrate the municipality’s understanding of the age, condition and replacement need of its complete catalogue of infrastructure related to WUE.
A Mains Replacement Programme with evidence of implementation will demonstrate whether municipalities are keeping pace with the replacement needs of its aging networks.
A Consumer Meter Replacement Programme and Valve and Bulk Meter Programme will demonstrate the same for other infrastructure components critical to WDM.
The municipality must present on its initiatives relating to the monitoring and analysis of, and response to, high water loss supply zones .
2015/06/23
40
TECHNICAL SKILLSTECHNICAL SKILLSCriteria 3 :Criteria 3 :
Criteria 3 : Technical skills - OverviewCriteria 3 : Technical skills - Overview
� 3.1 Availability and competence of the water loss manager and team
� 3.2 Water loss meeting� 3.3 Training and capacity building� 3.4 Meter readers� Criteria 3 Bonus: Demonstrated political support � Criteria 3 Penalty: Performance Targets for Senior
Officials
� 3.1 Availability and competence of the water loss manager and team
� 3.2 Water loss meeting� 3.3 Training and capacity building� 3.4 Meter readers� Criteria 3 Bonus: Demonstrated political support � Criteria 3 Penalty: Performance Targets for Senior
Officials
2015/06/23
41
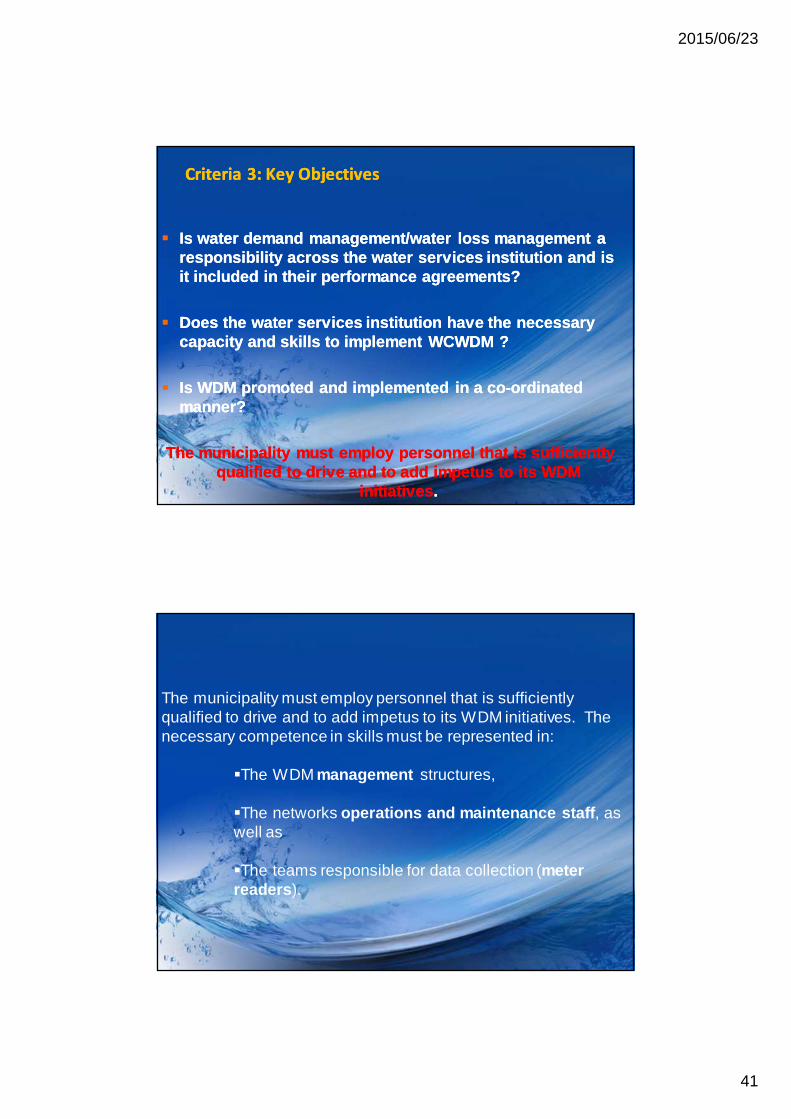
Criteria 3: Key ObjectivesCriteria 3: Key Objectives
� Is water demand management/water loss management a responsibility across the water services institutio n and is it included in their performance agreements?
� Does the water services institution have the necess ary capacity and skills to implement WCWDM ?
� Is WDM promoted and implemented in a co-ordinated manner?
The municipality must employ personnel that is suff iciently qualified to drive and to add impetus to its WDM
initiatives .
The municipality must employ personnel that is sufficiently qualified to drive and to add impetus to its WDM initiatives. The necessary competence in skills must be represented in:
�The WDM management structures,
�The networks operations and maintenance staff , as well as
�The teams responsible for data collection (meter readers ).

2015/06/23
42
CREDIBILITYCREDIBILITYCriteria 3 :Criteria 3 :
Criteria 4: Credibility-OverviewCriteria 4: Credibility-Overview
� 4.1: Meter readings and billing system� 4.2: Record keeping� 4.3: Independent Audit� 4.4: Flow meter verification� Criteria 4 Bonus: None� Criteria 4 Penalty: Inaccurate meter readings
� 4.1: Meter readings and billing system� 4.2: Record keeping� 4.3: Independent Audit� 4.4: Flow meter verification� Criteria 4 Bonus: None� Criteria 4 Penalty: Inaccurate meter readings

2015/06/23
43
Criteria 4: Key ObjectivesCriteria 4: Key Objectives
� What is the IWA water balance information provided in Criteria 1 based on in terms of?- What is metered?- Are the bulk and consumer meters accurate?- Are the monthly meter readings accurate?- Are consumers billed based on actual consumption
against the correct water tariff code?
WDM initiatives are developed based on data receive d from its network monitoring systems. It is therefore cr itical that the dataset is accurate and credible.
WDM initiatives are developed based on data received from its network monitoring systems. It is therefore critical that the dataset is accurate and credible.
Consumers also demand that the billing system employed results in billing which is consistently accurate. To this end the municipality is required to provide evidence which :
Demonstrates the systems employed in the meter reading to billing process ,Demonstrate the accuracy of systems as employed,Demonstrate how it ensures the integrity of its data, for example by way of an independent audit , and Demonstrates that flow meter data specifically, is accurate.

2015/06/23
44
COMPLIANCE AND PERFORMANCECOMPLIANCE AND PERFORMANCECriteria 5 :Criteria 5 :
Criteria 5 : Compliance and Performance -OverviewCriteria 5 : Compliance and Performance -Overview
� 5.1 Repair of reticulation leaks� 5.2 Physical water losses� 5.3 Commercial water losses� 5.4 Non-revenue water� 5.5 Water use efficiency� 5.6 Pressure Management� Criteria 5 Bonus (a): Performance� Criteria 5 Bonus (b): Additional pressure
management� Criteria 5 Penalty : Section 82
� 5.1 Repair of reticulation leaks� 5.2 Physical water losses� 5.3 Commercial water losses� 5.4 Non-revenue water� 5.5 Water use efficiency� 5.6 Pressure Management� Criteria 5 Bonus (a): Performance� Criteria 5 Bonus (b): Additional pressure
management� Criteria 5 Penalty : Section 82
2015/06/23
45
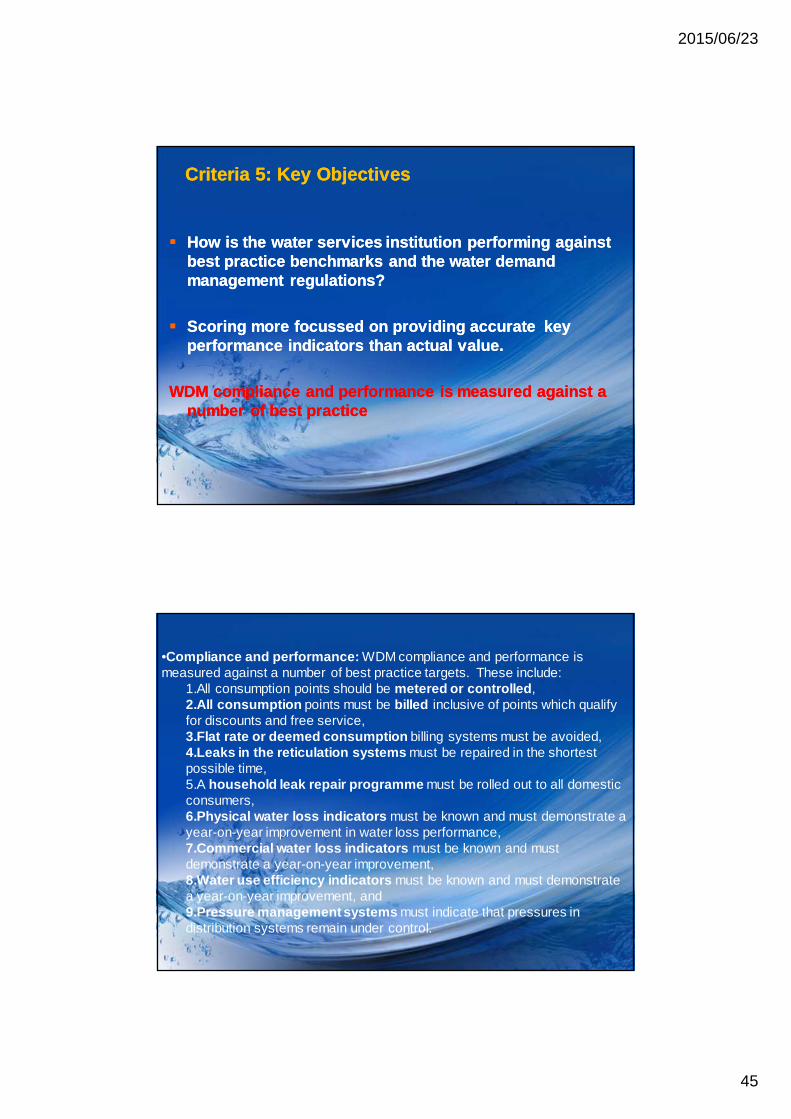
Criteria 5: Key ObjectivesCriteria 5: Key Objectives
� How is the water services institution performing ag ainst best practice benchmarks and the water demand management regulations?
� Scoring more focussed on providing accurate key performance indicators than actual value.
WDM compliance and performance is measured against a number of best practice
� How is the water services institution performing ag ainst best practice benchmarks and the water demand management regulations?
� Scoring more focussed on providing accurate key performance indicators than actual value.
WDM compliance and performance is measured against a number of best practice
•Compliance and performance: WDM compliance and performance is measured against a number of best practice targets. These include:
1.All consumption points should be metered or controlled ,2.All consumption points must be billed inclusive of points which qualify for discounts and free service,3.Flat rate or deemed consumption billing systems must be avoided,4.Leaks in the reticulation systems must be repaired in the shortest possible time,5.A household leak repair programme must be rolled out to all domestic consumers, 6.Physical water loss indicators must be known and must demonstrate a year-on-year improvement in water loss performance,7.Commercial water loss indicators must be known and must demonstrate a year-on-year improvement, 8.Water use efficiency indicators must be known and must demonstrate a year-on-year improvement, and 9.Pressure management systems must indicate that pressures in distribution systems remain under control.
2015/06/23
46
LOCAL REGULATIONLOCAL REGULATIONCriteria 6:Criteria 6:
Criteria 6 : Local Regulation-OverviewCriteria 6 : Local Regulation-Overview
� 6.1 Metering, billing and credit control policy� 6.2 Consumer meter replacement strategy� 6.3 Bylaws� 6.4 Indigent database� 6.5 Consumer installations other than meters� Criteria 6 Bonus: War on Leaks� Criteria 6 Penalty: None
� 6.1 Metering, billing and credit control policy� 6.2 Consumer meter replacement strategy� 6.3 Bylaws� 6.4 Indigent database� 6.5 Consumer installations other than meters� Criteria 6 Bonus: War on Leaks� Criteria 6 Penalty: None

2015/06/23
47
Criteria 6: Key objectivesCriteria 6: Key objectives
� Does the water services institution have the necess ary policies and bylaws in place to support their water demand management programmes?
� Do the policies and bylaws promote water use efficiency among consumers?
� Are the policies and bylaws enforced?
� Does the water services institution have the necess ary policies and bylaws in place to support their water demand management programmes?
� Do the policies and bylaws promote water use efficiency among consumers?
� Are the policies and bylaws enforced?
It is expected that municipalities will use the aut hority bestowed on it to good effect to ensure that WDM receives sufficie nt attention by all who fall under the jurisdiction of the municipality .
•Local regulation: Municipalities must apply themselves in their local authority roles as far as WDM is concerned. It is expected that municipalities will use the authority bestowed on it to good effect to ensure that WDM receives sufficient attention by all who fall under the jurisdiction of the municipality. To this end, municipalities must:
1.implement a relevant metering, billing and credit control policy. 2.implement a relevant consumer meter replacement policy .3.gazette and apply relevant and up-to-date bylaws which include and support its WDM efforts. The bylaws will, at the very least, promote the removal of wasteful devices, and address unlawful use of water, waste of water, authorised use of water fittings, use of measuring control devices and water restrictions. 4.maintain an up-to-date indigent database , and
ensure that consumer water use installations comply to the relevant SABS specification as far as water use installations are concerned

2015/06/23
48
CUSTOMER CARECUSTOMER CARECriteria 7Criteria 7
Criteria 7 : Customer care-OverviewCriteria 7 : Customer care-Overview
� 7.1 Customer Charter
� 7.2 Customer Care Centre
� 7.3 Informative Billing
� 7.4 Community awareness campaign
� 7.5 Schools awareness campaign
� Criteria 7 Bonus (a): Sector awareness campaign and
stakeholder forums
� Criteria 7 Bonus (b): Revenue enhancements
� Criteria 7 Bonus (c) : Innovative water supply
� Criteria 7 Penalty: None

2015/06/23
49
Criteria 7: Key ObjectivesCriteria 7: Key Objectives
� Is the water services institution actively promotin g water use efficiency among its customers through� Customer care and charters� Community and schools awareness campaigns� Stakeholder engagement
� What is the water services institution doing to enhance revenue?
� Does the water services institution actively repair leaks within their area of jurisdiction?
•Customer care: The municipality will engage with its customers in a constructive manner in order to ensure that WDM targets are reached and sustained. This engagement will be demonstrated through:
1.A Customer Charter which clearly defines the responsibilities of both the municipality and the consumer with respect to WUE,2.A Customer Care Centre and customer care reports through which the municipality’s dedication to the resolution of queries are demonstrated.3.The municipality will issue informative billing in line with the Municipal Systems Act 32 of 2000. 4.The municipality will run various ongoing Community Awareness Campaigns through various media channels to solicit consumer support for WDM initiatives, and5.The municipality will run an ongoing Schools Awareness Campaign to solicit support for WDM initiatives.

2015/06/23
50
� We need to “manage” our water much better than we a re currently doing!!
� Utilise the tools developed as a guideline and impl ement WCWDM -“No Drop” - measure and report progress!!
� Phases I and II of the No Drop programme is regarde d as a steep learning curve. The buy-in and commitment by local government shows the need for such a programme in SA. Results will improve over time, as municipalities invest more and more i n terms of human and financial resources towards WCWDM.
� No Drop will play an important role to change perce ptions, raise awareness, improve performance
� Preparations for 2015/16 Assessment cycle should be started.� Provincial Summits starting July 2015� Provincial workshops in July, which could assist th e WSA in
preparing the IWA water balance
ConclusionsConclusions
2015/06/23
51
�For the first time, the excellent work and years of dedication in WCWDM; of individuals are noticed and acknowledged at a national level.
�A credible baseline exist which allows private sector to identify opportunities to partner and cooperate with public sector to work towards a common objective – to use water efficiently and cost effectively
�Whilst the CONTINUOUS PROGRESS in performance is of utmost importance and a key driver behind the No Drop, it is the acknowledgement of EXCELLENCE that makes one realise ‘this is a game changer of note ’.
Conclusions cont…Conclusions cont…
‘Water has no substitute’‘Water has no substitute’
JUST IMAGINE . . . JUST IMAGINE . . .
... could I have a doggie bag for the water please!

2015/06/23
52
- Thank You -- Thank You -