purification of paak and paay from escherichia coli · purification of paak and paay from...
TRANSCRIPT

Purification of PaaK and PaaY from Escherichia coli:
Study of the possible points of acetylation of these proteins
involved in the metabolism of phenylacetic acid degradation
Joana da Silva Abreu
Thesis to obtain the Master of Science Degree in
Biological Engineering
Supervisors: Prof. Manuel Cánovas Díaz, UM
Prof. Gabriel António Amaro Monteiro, IST
Examination Committee
Chairperson: Jorge Humberto Gomes Leitão, IST
Supervisor: Maria Ângela Cabral Garcia Taipa Meneses de Oliveira, IST
Member of the Committee: Gabriel António Amaro Monteiro, IST
November of 2015

I
Purification of PaaK and PaaY from Escherichia coli:
Study of the possible points of acetylation of these proteins
involved in the metabolism of phenylacetic acid degradation

II
“Isn’t it a shame that with the tremendous
amount of work you have done you haven’t been
able to get any results?” Edison turned on me like a
flash, and with a smile replied: “Results! Why, man, I
have gotten a lot of results! I know several
thousand things that won’t work.”
In “Edison: His Life and Inventions” (1910)

III
Acknowledgments
First, I would like to thank to my supervisors: Prof. Manuel Cánovas Díaz, from Universidad de
Murcia, and Prof. Gabriel António Amaro Monteiro, from Instituto Superior Técnico, for their guidance
and supervision of this master thesis. Especially to Prof. Manuel Cánovas Díaz for having me accep-
ted in his department.
An enormous and sincere thanks to all the Department of Biochemistry and Molecular Biology B
and Immunology: Prof. Manuel Cánovas Díaz, Prof. Maria Teresa Puente, Prof. Arturo Manjon Rubio,
but mainly, to Ana Ecija Conesa, Julia Gallego Jara, Yolanda Risueño García and Laura Rincón Fru-
tos. They all supported and contributed substantially to this work. But, above all, they made me feel
welcome and I learned a lot with them. Ana, I do not know how to thank you for everything. ¡Muchas
gracias por todo!
Finally, a special thanks for my family and friends, for their unconditional support and motivation. In
particular to António and Rute for all the advices with the manuscript, I am indebted to you. Obrigada!
IV
Abstract
In order to improve bioprocesses a better understanding of metabolism and its regulation is re-
quired. Escherichia coli has a crucial importance in biotechnology. One of its characteristics is the
capability to catabolize different carbon sources. This project will study one of the pathways less
known in E. coli: phenylacetic acid catabolism.
Recent advances on proteomic techniques have highlighted the importance of post-translational
modification in bacteria. Such modifications may be involved in hitherto unknown or underappreciated
regulatory mechanisms of metabolic and signalling networks. One of the last characterized PTM is
protein acetylation. The present work is focused on the post-translational regulation of proteins by
acetylation, namely lysine acetylation.
Along this study, it was possible to overexpress and purify PaaK and PaaY, two critical proteins at
PA metabolism. The E. coli strains BL21 (DE3) and BL21 (DE3) pLysS and the plasmid pRSET-C
were used as host and overexpression vector, respectively, obtaining the gene fused with a 6 His-tag.
The purification was carried out using immobilized-metal Affinity Chromatography. PaaK and PaaY
revealed to be very unstable and sensitive proteins. Using techniques as LC-MS/MS, Western blot,
electrophoresis gel and bioinformatics tools it was possible to study these proteins. There is evidence
that both enzymes suffer chemical acetylation; PaaY has acetyltransferase activity and PatZ shows
lysine specificity to PaaY.
This is an important basis for future studies that have to be carried out to confirm the hypothesis
suggested and to clarify the importance of post-translational regulation in PaaK and PaaY.
Keywords: Escherichia coli; Phenylacetic Acid; Protein; Acetylation; PaaK; PaaY.
V
Resumo
O aparecimento da engenharia metabólica impulsionou o ramo da biotecnologia. Contudo, para se
poder melhorar os bioprocessos já utilizados é necessário uma melhor compreensão do metabolismo
e da sua regulação.
Escherichia coli tem uma importância crucial na biotecnologia. Uma característica deste organismo
é a sua capacidade para catabolizar diferentes fontes de carbono. Este estudo focar-se-á numa das
vias metabólicas menos conhecida nesta bactéria: o catabolismo do ácido fenilacético.
Recentes avanços em técnicas de proteómica revelaram a importância das modificações
pós-translacionais em bactérias. Estas aparentam estar envolvidas em mecanismos de regulação até
agora desconhecidos ou desvalorizados. Uma das últimas MPT descritas é a acetilação de proteínas
e o seu estudo será o alvo central deste trabalho, nomeadamente a acetilação de lisinas.
Desenvolveram-se técnicas para sobre-expressar e purificar PaaK e PaaY, duas proteínas críticas
no metabolismo deste ácido, usando duas estirpes de E. Coli: BL21 (DE3) e BL21 (DE3) pLysS, e
pRSET-C como vetor, obtendo-se assim os genes ligados a uma cauda de histidinas. O processo de
purificação realizou-se utilizando cromatografia de afinidade por iões metálicos imobilizados. Conclu-
iu-se que ambas as proteínas são bastante instáveis e sensíveis. Utilizaram-se ainda técnicas de LC-
MS/MS, Western blot, eletroforese em gel e ferramentas bioinformáticas e obtiveram-se evidências de
que ambas sofrem acetilação química; que PaaY apresenta atividade de acetiltransferase e que PatZ
tem especificidade para algumas lisinas de PaaY.
Este trabalho é uma base importante para futuros estudos que possam vir a ser realizados para
confirmar as hipóteses apresentadas e para esclarecer a importância da regulação pós-tradução em
PaaK e PaaY.
Palavras-Chave: Escherichia coli; Ácido Fenilacético; Proteínas; Acetilação; PaaK; PaaY.

VI
General Index
Chapter 1 – INTRODUCTION ........................................................................................................... 1
1.1 Escherichia coli – An overview ......................................................................................... 1
1.2 Post-translational Modifications - Lysine Acetylation .................................................... 2
1.3 Degradation of Phenylacetic Acid .................................................................................... 6
1.4 The PaaK Enzyme ............................................................................................................. 12
1.5 The PaaY Enzyme ............................................................................................................. 13
Chapter 2 – AIMS AND MOTIVATION ........................................................................................... 15
Chapter 3 – MATERIALS AND METHODS .................................................................................... 16
3.1 Strains ................................................................................................................................ 16
3.2 Reactants and Equipment ................................................................................................ 17
3.3 Media .................................................................................................................................. 19
3.3.1 Luria Broth Medium (LB) .............................................................................................. 19
3.3.2 Minimal Medium M9 (MM9) .......................................................................................... 19
3.4 Molecular Biology ............................................................................................................. 20
3.4.1 Agar Plates ................................................................................................................... 20
3.4.2 Agarose Gel Electrophoresis ........................................................................................ 21
3.4.3 Preparation of Competent Escherichia coli BL21 cells: Rubidium Method .................. 21
3.4.4 Expression Vector: Selection and Construction ........................................................... 21
3.4.5 Transformation of Competent Cells .............................................................................. 25
3.5 Proteomic: Overexpression and Purification of PaaK .................................................. 26
3.5.1 Cultures ........................................................................................................................ 26
3.5.2 Induction Kinetics of PaaK............................................................................................ 27
3.5.3 Overexpression and Purification of PaaK ..................................................................... 27
3.5.4 Overexpression and Purification of PaaY ..................................................................... 28
3.5.5 Quantification of Protein Concentration: Bradford Method ........................................... 28
3.5.6 Protein Electrophoresis ................................................................................................ 28
3.5.7 Liquid Chromatography: Tandem Mass Spectrometry Assay (LC-MS/MS) ................. 29
3.5.8 PaaK Activity ................................................................................................................ 30
3.6 In vitro Assays: Acetylation Studies .............................................................................. 31
3.6.1 Acetylation Reactions ................................................................................................... 31
3.6.2 Western Blot ................................................................................................................. 32
3.7 Bioinformatics: PaaK and PaaY Molecular Modelling .................................................. 32
3.8 Studies with Phenylacetic Acid ....................................................................................... 33
3.8.1 Cultures ........................................................................................................................ 33
Chapter 4 – RESULTS AND DISCUSSION .................................................................................... 35
4.1 Molecular Biology ............................................................................................................. 35
4.1.1 Expression Vector: pRSET-C+paaK ............................................................................ 35
VII
4.2 Proteomic .......................................................................................................................... 38
4.2.1 Induction Kinetic of PaaK in E. coli BL21 (DE3) ........................................................... 38
4.2.2 Purification of PaaK in E. coli BL21 (DE3) ................................................................... 40
4.2.3 Identification of PaaK by LC-MS/MS ............................................................................ 41
4.2.4 Induction Kinetic of PaaK in E. coli BL21 (DE3) pLysS ................................................ 42
4.2.5 Purification of PaaK in E. coli BL21 (DE3) pLysS ........................................................ 44
4.2.6 Purification of PaaY in E. coli BL21 (DE3) ................................................................... 47
4.3 Studies under Native Conditions .................................................................................... 48
4.4 Activity Assays ................................................................................................................. 51
4.5 Acetylation Studies of PaaK and PaaY ........................................................................... 52
4.5.1 Identification of Acetylated Lysine by Western Blot ..................................................... 52
4.5.2 Identification of Acetylated Lysine by LC-MS/MS ........................................................ 55
4.6 Bioinformatics ................................................................................................................... 56
4.6.1 PaaK Modelling ............................................................................................................ 56
4.6.2 PaaY Modelling ............................................................................................................ 58
4.6.3 Correlation Between the Proteins Models and Results Previously Described ............. 60
4.7 Studies with Phenylacetic Acid ....................................................................................... 62
4.7.1 Effect of cobB, patZ, paaX and paaY Genes Knock-out on Growth in the Presence of
Phenyl Acetic as Carbon Source ................................................................................................... 62
4.7.2 Lysine Acetylation Patterns .......................................................................................... 63
Chapter 5 – CONCLUSIONS AND FUTURE PRESPECTIVES ..................................................... 65
References ...................................................................................................................................... 68
Appendix I – Multiple Sequence Alignment
Appendix II – LC-MS/MS: More Information
Appendix III – Proteomic studies
Appendix IV – Bioinformatics: Protein Modelling

VIII
Figures Index
Figure 1-1 – Central dogma of molecular biology including reverse transcription and post-translational
modification of proteins. ................................................................................................................... 3
Figure 1-2 – Protein acetylation reaction steps using acetyl-Coenzyme A as the acetyl group donor. In
histone acetylation, a glutamate residue acts as a general base, activating the lysine ε-amino
group for nucleophilic attack on the carbonyl group of acetyl-CoA. A tetrahedral intermediate is
formed, and then collapses with the loss of coenzyme A (CoA-SH), to general acetyl lysine......... 4
Figure 1-3 – Non-enzymatic lysine acetylation with acetyl-CoA or acetyl-P as acetyl donor. ................ 5
Figure 1-4 – Enzymatic lysine acetylation of E. coli proteins. The enzymatic reaction of acetylation is
catalysed by lysine (K) acetyltransferases (KATs) and the only known in E. coli is PatZ. The
reverse reaction is catalysed by histone (H) deacetylases (HDACs) and in E. coli the enzyme
responsible for this process is CobB. KATs require acetyl-Coenzyme A as the acetyl group donor.
.......................................................................................................................................................... 5
Figure 1-5 - Organic structure of phenylacetic acid. ............................................................................... 6
Figure 1-6 – Proposed outline of the pathway of aerobic metabolism of phenylacetic acid in E. coli. ... 9
Figure 1-7 – Genetic organization of paa gene cluster in E. coli which codes for the catabolism of
phenylacetic acid (PA).................................................................................................................... 11
Figure 3-1 – Scheme of the used plasmid (pRSET-C). ........................................................................ 22
Figure 3-2 – Outline of pRSET-C double digestion with the enzymes PstI and EcoRI. ....................... 24
Figure 3-3 – Outline of E. coli BW25113 PCR to amplify the gene paaK, followed by its double
digestion with the enzymes PstI and EcoRI. .................................................................................. 24
Figure 3-4 – Outline of the ligation between pRSET-C and paaK, both double-digested, which results
in the vector named pRSET-C+paaK. ............................................................................................ 25
Figure 3-5 – Coupling reactions to determine PaaK activity. The conversion between NADH and
NADH+ is detected at a wavelength of 340 nm. ............................................................................. 31
Figure 4-1 – Agarose gel electrophoresis to demonstrate the successful pRSET-C purification and the
plasmid DNA double digestion. ...................................................................................................... 35
Figure 4-2 – Agarose gel electrophoresis to demonstrate paaK gene amplification by PCR.. ............ 36
Figure 4-3 – Agarose gel electrophoresis to demonstrate the ligation between the plasmid and the
insert. On the upper image it is shown the samples without double digestion and at the image
below are the same samples after double digestion. ..................................................................... 37
Figure 4-4 – Agarose gel electrophoresis to demonstrate the PCR amplification of the MCS where
paaK gene was cloned. .................................................................................................................. 38
Figure 4-5 – Growth curve of the strain of E. coli BL21 (DE3) overexpressing the protein PaaK (I) and
SDS-PAGE gel to demonstrate its overexpression (II). ................................................................. 39
Figure 4-6 – SDS-PAGE gel of the fractions collected during PaaK purification using immobilized
metal ion affinity chromatography. The strain used in this purification procedure was E. coli BL21
(DE3) and the culture conditions were optimized upon kinetic induction studies.. ........................ 40
Figure 4-7 – Growth curve of E. coli BL21 (DE3) pLysS overexpressing the protein PaaK (I) and SDS-
PAGE gel to demonstrate its overexpression (II).. ......................................................................... 43

IX
Figure 4-8 – SDS-PAGE gel of the fractions collected during PaaK purification using immobilized
metal ion affinity chromatography. The strain used in this purification procedure was E. coli BL21
(DE3) pLysS and the culture conditions were optimized upon kinetic induction studies. .............. 44
Figure 4-9 – SDS-PAGE gel from the protein extract, its pellet and supernatant before purification.
The samples collected result from the same culture as the samples from Figure 4-8. ................. 45
Figure 4-10 – SDS-PAGE gel of the fractions collected during PaaK purification using immobilized
metal ion affinity chromatography. The strain used in his purification procedure was E. coli BL21
(DE3) pLysS.. ................................................................................................................................. 46
Figure 4-11 – SDS-PAGE gel to demonstrate overexpression of PaaY (I). It was used the strain E. coli
BL21 (DE3) as host to the vector pRSET-C+paaY. SDS-PAGE gel of the fractions collected
during PaaY purification using immobilized metal ion affinity chromatography (II).. ..................... 47
Figure 4-12 – NATIVE gel of PaaK and PaaY obtained from different purification. ............................. 48
Figure 4-13 – SDS-PAGE gel to identify the proteins purified with PaaK and PaaY. .......................... 50
Figure 4-14 – Western blot with the reactions 1, 2, 3, 6, 4 and 5 (I) and Western blot Coomassie-
stained membrane (II). This Western blot allows to study PaaK acetylation ................................. 53
Figure 4-15 – Western blot with the reactions 7, 8, 9 and 10 (I) and Western blot Coomassie-stained
membrane (II). This Western blot allows to study PaaY. ............................................................... 54
Figure 4-16 – PaaK monomer model by Phyre2. ................................................................................. 57
Figure 4-17 – Detection of a large pocket in PaaK. .............................................................................. 57
Figure 4-18 – PaaK dimer modelled by ClusPro2. ............................................................................... 58
Figure 4-19 – PaaY monomer model by Phyre2 .................................................................................. 59
Figure 4-20 – Detection of PaaY pocket. .............................................................................................. 59
Figure 4-21 – PaaY trimer model. ........................................................................................................ 60
Figure 4-22 – PaaK lysine 424 localization .......................................................................................... 61
Figure 4-23 – Effect of deletion of patZ and cobB on the growth of E. coli BW25113. The wild type (),
patZ () and cobB (▾) deletion mutants were grown in minimal medium with 5 mM of phenylacetic
acid as carbon source allowing the determination of their growth curves. .................................... 62
Figure 4-24 – Western blot showing protein lysine acetylation in protein crude cell extract from
different strains (I) and Western blot Coomassie-stained membrane (II).. .................................... 64
Figure II-1 – LC-MS/MS spectrum of the peptide (R)AITQLILNLVEGSPIK(L) from ArnA identified from
Figure 4-6. ...................................................................................................................................... 80
Figure II-2 – LC-MS/MS spectrum of the peptide (K)AIAQVGTISANSDETVGK(L) from GroEL 60
identified from Figure 4-6 ............................................................................................................... 80
Figure II-3 – LC-MS/MS spectrum of the peptide (K)LDPIETASVDELQALQTQR(L) from PaaK
identified from Figure 4-6 ............................................................................................................... 81
Figure II-4 – LC-MS/MS spectrum of the peptide (K)KQGTHEYQVLVTR(C) from PaaY identified from
Figure 4-12. .................................................................................................................................... 81
Figure II-5 – LC-MS/MS spectrum of the peptide (K)FNVEVVAIR(E) from FKBP-type protein identified
from Figure 4-12. ............................................................................................................................ 82
Figure II-6 – LC-MS/MS spectrum of the peptide (K)AKAEMPANYLIVGSPAkAIR(E) from PaaY. ..... 82
Figure II-7 – LC-MS/MS spectrum of the peptide (R)QLGGDASGcSLRVGVFGAEPWTQAmRk(E)
from PaaK ...................................................................................................................................... 83

X
Figure III-1 – SDS-PAGE gel to demonstrate that is not observed a PaaK overexpression at 37 °C,
induced with IPTG 1 mM at an O.D.600 of 0.5 ................................................................................ 85
Figure III-2 – SDS-PAGE gel to demonstrate that is observed a PaaK overexpression. The culture
grown at 37 °C until an O.D.600 of 0.5, when was induced with IPTG 0.1 mM and the temperature
was lowered to 30 °C ..................................................................................................................... 85
Figure III-3 – SDS-PAGE gel to demonstrate that is observed a PaaK overexpression. The culture
grown at 37 °C until an O.D.600 of 0.5, when was induced with IPTG 10 mM and the temperature
was lowered to 30 °C. .................................................................................................................... 86
Figure III-4 – SDS-PAGE gel to demonstrate that is observed a PaaK overexpression at 37 °C,
induced with IPTG 1 mM at an O.D.600 of 1.0 ................................................................................ 86
Figure III-5 – SDS-PAGE gel to demonstrate that is observed a PaaK overexpression. The culture
grown at 37 °C until an O.D.600 of 1.0, when was induced with IPTG 1 mM and the temperature
was lowered to 30 °C ..................................................................................................................... 87
Figure III-6 – SDS-PAGE gel to demonstrate that is observed a PaaK overexpression. The culture
grown at 37 °C until an O.D.600 of 0.5, when was induced with IPTG 1 mM and the temperature
was lowered to 30 °C. .................................................................................................................... 87
Figure III-7 – SDS-PAGE gel to demonstrate that is observed a PaaK overexpression. The culture
grown at 37 °C until an O.D.600 of 0.5, when was induced with IPTG 1 mM and the temperature
was lowered to room temperature. ................................................................................................. 87
Figure IV-1 – Cover of the multiple alignment by the server Phyre2. ................................................... 88
Figure IV-2 – Quality model analysis by ProQ2.................................................................................... 89
Figure IV-3 – Ramachandran analysis. ................................................................................................ 89
Figure IV-4 – Conserved domains on PaaK. ........................................................................................ 89
Figure IV-5 – Phenylacetic-CoA ligase domain sequence alignment. ................................................. 90
Figure IV-6 – PA-CoA ligase multidomain alignment ........................................................................... 91
Figure IV-7– PaaK dimer model. .......................................................................................................... 92
Figure IV-8 – PaaK amino acid composition. ....................................................................................... 92
Figure IV-9 – Analysis of PaaK sequence by Predict Protein server (above) and chart with secondary
structure composition and solvent accessibility (below). ............................................................... 92
Figure IV-10 – Ramachandran diagram of PaaK dimer model developed with the Procheck server. . 93
Figure IV-11 – Cover of the multiple alignment by the server Phyre2. ................................................. 94
Figure IV-12 – Quality model analysis by ProQ2.................................................................................. 95
Figure IV-13 – Ramachandran analysis of PaaY monomer model. ..................................................... 95
Figure IV-14 – Conserved domains on PaaY. ...................................................................................... 95
Figure IV-15 – PaaY amino acid composition. ..................................................................................... 95
Figure IV-16 – Analysis of PaaY sequence by Predict Protein server (above) and chart with secondary
structure composition and solvent accessibility (below). ............................................................... 96
Figure IV-17 – Ramachandran diagram of PaaY trimer model developed with the Procheck server. . 96
Figure IV-18 – Identification of the binding site at the PaaY trimer structure. ..................................... 97

XI
Tables Index
Table 1-1 – Correspondence between original gene denomination and protein function in E. coli on
phenylacetic catabolism. ................................................................................................................ 10
Table 3-1 – Description of the strains used in this work, source and reference. .................................. 17
Table 3-2 – Buffers used in the experimental study and its composition. ............................................ 18
Table 3-3 – Antibiotics used with reference to its stock and final concentration and mode of action... 18
Table 3-4 – List of reactants used with reference to its stock and final concentration and mode of
action, when applied....................................................................................................................... 19
Table 3-5 – Composition of minimal medium used (MM9). .................................................................. 20
Table 3-6 – List of restriction enzymes used in double digestion with respective recognition sequence
and cut site. .................................................................................................................................... 23
Table 3-7 – Primers (Sigma) used to amplify paaK from Escherichia coli BW25113 genome by
polymerase chain reaction. ............................................................................................................ 23
Table 3-8 – Plasmids used in this study and constructed vectors. ....................................................... 24
Table 3-9 – Primers used to amplify paaK by polymerase chain reaction from the vector pRSET-
C+paaK, inserted in Escherichia coli TOP10F’ cells. ..................................................................... 25
Table 3-10 – List of all acetylation reactions, with indication of the reactive used and its concentration.
........................................................................................................................................................ 32
Table 4-1 – Nanodrop results................................................................................................................ 36
Table 4-2 – Identification of the proteins purified by IMAC. .................................................................. 41
Table 4-3 – Identification of the proteins correspondent to the bands observed in the native gel... .... 49
Table 4-4 – Identification of protein correspondent to band D (Figure 4-6). ......................................... 50
Table 4-5 – Acetylated lysines identification, in respect with PaaK and PaaY reactions, by mass
spectrometry. .................................................................................................................................. 55
Table 4-6 – Specific growth rate (μmax) and specific biomass yield (YX/S) from the strains growth in
minimal medium with phenylacetic acid 5 mM as carbon source. ................................................. 63
Table II-1 – Confidence criteria for peptide validation in Spectrum Mil. ............................................... 79
Table II-2 – Peptides from reaction 3 that showed acetylated lysine. All the acetylated lysines
correspond to Lys-424 from PaaK. ................................................................................................ 83
Table II-3 – Peptide from reaction 7 that showed acetylated lysine. The lysine corresponds to Lys-153
from PaaY. ..................................................................................................................................... 84
Table II-4 – Peptide from reaction 9 that showed acetylated lysine. The lysine corresponds to Lys-139
from PaaY. ..................................................................................................................................... 84
Table II-5 – Peptide from reaction 10 that showed acetylated lysines. The lysines correspond to Lys-
33, Lys-53, Lys-122, Lys-139 and Lys-153 from PaaY. ................................................................. 84
Table IV-1 – Selected templates to model PaaK by Phyre2 server. ..................................................... 88
Table IV-2 – List of PaaK residues from specific sites. ......................................................................... 93
Table IV-3 – Selected templates by Phyre2 server to model PaaY. ..................................................... 94
Table IV-4 – List of PaaY residues from specific sites .......................................................................... 97

XII
List of Abbreviations and Symbols
(NH4)2SO4 – Ammonium sulphate
°C – Temperature unit, degree Celsius
A. evansii – Azoarcus evansii
a.a. – Amino acid
A100 – Ampicillin with a concentration of 100
μg/ml
AcAMP – Acetyl-adenylate
Acetyl-AMP – Acetyl-adenosine monophos-
phate
Acetyl-CoA – Acetyl-Coenzyme A
Acetyl-P – Acetyl-phosphate
Acs – Acetyl-CoA syntethase
Amp or A – Ampicillin
ATP – Adenosine triphosphate
bp – Base pairs
BSA – Bovine serum albumin
CaCl2 – Calcium chloride
CCD – Charge-coupled device
CheY – Chemotaxis protein
Clor30 – Chloramphenicol with a concentration
of 30 μg/ml
CoA or CoA-SH – Coenzyme A
CobB – Protein-lysine deacetylase and desuc-
cinylase
Da – Atomic mass unit, Dalton
DCW - Dry cell weight
DNA – Deoxyribonucleic acid
dNTPs – High-quality deoxynucleotide triphos-
phates
DTT – Dithiothreitol
E. coli – Escherichia coli
EDTA – Ethylenediamine tetraacetic acid
Fwd – Forward
H – Histidine
h – Time unit, hour
HCl – Hydrochloric acid
HDAC - Histone deacetylase
IB – Inclusion bodies
IDA – Iminodiacetic acid
i.e. – id est
IMAC – Immobilized metal ions affinity chro-
matography
IPTG – Isopropyl-1-thio-β –D-galactoside
K – Lysine
KAT – Lysine (K) acetyltransferases
KH2PO4 – Monopotassium phosphate
LAT – Lysine acetyltransferases
LB – Luria broth medium
LC-MS – Liquid Chromatography-Mass Spec-
trometry
LDH – Lactate dehydrogenase
Lys – Lysine
MCS – Multiple cloning site
MFS – Major facilitator superfamily
MgSO4 – Magnesium sulphate
min – Time unit, minute
MM9 – Minimal medium M9
mRNA – Messenger ribonucleic acid
MK – Myokinase
MW – Molecular weight
Na2HPO4 – Disodium phosphate
NaH2PO4 – Monosodium phosphate
NaCl – Sodium chloride
NADP – Nicotinamide adenine dinucleotide
phosphate
N.I. – Not identified
O.D.x – Optical density at a wavelength of x
nm
P. putida – Pseudomonas putida
PA – Phenylacetic acid or phenylacetyl
PA-CoA – Phenylacetyl-Coenzyme A, Phe-
nylacetic acid-Coenzyme A, Phenylacetate-
Coenzyme A
PaaK – Phenylacetic-CoA ligase
PaaY – 2-hydroxycyclohepta-1, 4, 6-triene-1-
carboxyl-CoA thioesterase

XIII
PAGE – Polyacrylamide gel electrophorese
PatZ – Peptidyl-lysine acetyltransferase
PCR – Polymerase Chain Reaction
PEP – Phosphoenolpyruvate
psi – Pressure unit, Pounds per square inch
PVDF – Polyvinylidene difluoride
PK – Pyruvate kinase
RcsB – Regulator capsule synthesis B
Rev - Reverse
RNA – Ribonucleic acid
RNase R – Ribonuclease R
rpm – Rotations per minute
RT – Room temperature
SD – Standard deviation
SDS – Sodium dodecyl sulphate
sec – Time unit, second
Sol. – Solution
SSS – Solute/ sodium symporter
TAE – Traditional electrophoresis buffer
TBST – Tris-Buffered Saline and Tween 20
mixture
TCA – Tricarboxylic acid
TMS – Transmembrane-segment
TPM – Post-translational Modification
Tris – 2-Amino-2-hydroxymethyl-propane-1, 3-
diol
V – Electric potential unit, Volt
v/v – Volume per volume
wt/v – Weight per volume
wt/wt – Weight per weight
X – Biomass
Δ – Chromosomal deletion of the listed genes
YX/S – Specific biomass yield
μmax – Specific growth rate

1
1 Chapter 1 – INTRODUCTION
In this initial chapter it will be presented a current state of the art in the field, exposing all the im-
portant results and gaps that support this work. An introduction to the study and all the background to
understand it will be described as well.
1.1 Escherichia coli – An overview
Escherichia coli belongs to the family of Enterobacteriaceae and was discovered by the German
paediatrician and bacteriologist Theodor Escherich in 1885. E. coli is an enteric rod-shaped Gram-
negative bacterium with a circular genome of about 3 million base pairs (bp) long, well studied and
characterized. This organism is a facultative anaerobic, non-sporulating, non-motile or motile by perit-
richous flagella. It is known as one of the most common inhabitants of the intestinal tract of humans
and warm-blooded animals and it has an optimal growth temperature of 37 °C [1]–[3].
Despite of E. coli being a well-known intestinal tract commensal, soil, water, sediment, and per-
haps food, are other habitats of this bacterium. Pollution from human sources may be the most im-
portant source of E. coli in the environment. The fact that this bacterium was found in pristine tropical
waters, where it remained physiologically active and grew at rates depending on nutrient levels, sug-
gests that it can be a natural inhabitant in these environments and that it may be part of a previously
established community. E. coli can also replicate and survive in soil protozoa. Since protozoa are
widely distributed in soils and effluents, they may also constitute an environmental reservoir for trans-
mission of this enterobacterium. Thus, E. coli is a highly adaptable microorganism with an extensive
repertoire of metabolic and regulatory genes that facilitate the colonization of widely different environ-
ments [2].
Only a few microorganisms are as versatile as E. coli and some of the main reasons why it was
chosen as a model system to biotechnology, cellular and molecular biology are its ability to grow on
chemically defined media and its rapid growth rate. When E. coli is grown in liquid culture, a small
number of cells are first inoculated into a container of sterile medium. After a period of time (lag pe-
riod) the bacteria starts its division process. In rich medium, a culture of a typical strain will double
every 20 or 30 min. This phase of exponential growth of the cells in the culture is called log phase.
Eventually, the cell culture reaches a point where this rapid growth becomes slower or even null, due
to depletion of nutrients or oxygen, or presence of toxic compounds for the cell. At this point, called
saturation, the cells stop dividing rapidly [4]–[7].
The ease of its transformability and genetic manipulation has subsequently solidified the role of E.
coli as the host of choice for the propagation, manipulation and characterization of recombinant DNA
[8]. As a matter of fact, in the past 60 years, E. coli has been the subject of intensive research and
more is known about these bacilli than any other organisms. A wide variety of E. coli mutants have

2
been isolated and characterized. With very few exceptions, the strains currently used in recombinant
DNA experiments are derived from a single strain: E. coli K-12, isolated from the faeces of a diphtheria
patient in 1922. Most advances in molecular biology until the end of the 1960’s came from studies with
this organism and bacteriophages and plasmids that use it as a host [1].
All the reasons abovementioned make E. coli one of the organisms of choice for the production of
recombinant proteins and, because of that, it has become the most popular expression platform, being
known as a robust cell factory. Thereby, there are many molecular tools and protocols for the high
level production of heterologous proteins, such as a vast catalogue of expression plasmids and many
cultivation strategies. Thus, the ability to express and purify a chosen protein allows its biochemical
characterization, as desired in this work. From a theoretical point of view, the steps needed to obtain a
recombinant protein are pretty straightforward: it is necessary a gene of interest, which is cloned in an
overexpression vector and then transformed into the host of choice, induced and subsequently the
protein is ready to undergo purification and characterization. Nowadays, the most common expression
plasmids in use are the result of multiple combinations of replicons, promoters, selection markers,
multiple cloning sites (MCS) and fusion protein removal strategies. Due to this, the choice of the ex-
pression vector always depends on the desired result. The same can be claimed with regard the
choice of the appropriate host, once E. coli strains used as hosts will yield dozens of possible candi-
dates, all of them having advantages and disadvantages and some of them being specific to use in
certain situations [6], [7].
With the previous description in mind, the production of recombinant proteins could be described
as a non-complex process, but actually it can present serious difficulties, as well as none or low ex-
pression, inclusion body formation and protein inactivity. Each one could have one or more possible
explanations and solutions, but the main point is that a defined protocol that always works does not
exist and when coming across a difficult-to-express protein, the process can get complicated [6].
1.2 Post-translational Modifications - Lysine Acetylation
The vast number of biotechnological applications that are carried out using E. coli makes crucial to
understand properly its protein modification regulatory mechanisms, because it affects deeply the
bacteria metabolism. Thus, a better understanding of the bacteria metabolic function is the key to the
biotechnological processes optimization. Protein modifications include co-translational modifications
and post-translational modifications. The first one can be defined as the process of covalently altering
one or more amino acids in a protein at the same time as its mRNA is being translated on polyribo-
somes. Post-translational modification (PTM) of proteins is an evolutionarily conserved strategy used
by organisms for the efficient control of their biological activities, allowing them to exert rapid adaptive
responses to environmental changes [9]. PTMs confer novel properties to the modified proteins, in-
cluding changes in enzymatic activity, subcellular localization, interaction partners, protein stability and
DNA binding [10], [11].
3
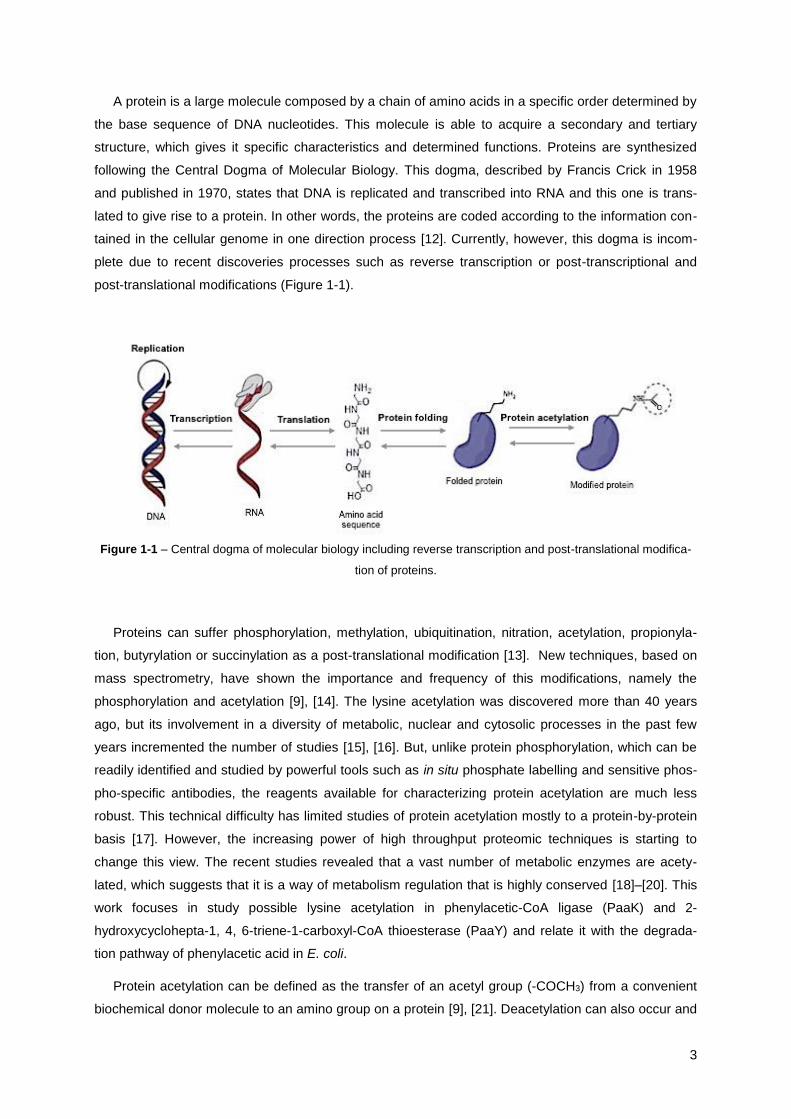
A protein is a large molecule composed by a chain of amino acids in a specific order determined by
the base sequence of DNA nucleotides. This molecule is able to acquire a secondary and tertiary
structure, which gives it specific characteristics and determined functions. Proteins are synthesized
following the Central Dogma of Molecular Biology. This dogma, described by Francis Crick in 1958
and published in 1970, states that DNA is replicated and transcribed into RNA and this one is trans-
lated to give rise to a protein. In other words, the proteins are coded according to the information con-
tained in the cellular genome in one direction process [12]. Currently, however, this dogma is incom-
plete due to recent discoveries processes such as reverse transcription or post-transcriptional and
post-translational modifications (Figure 1-1).
Figure 1-1 – Central dogma of molecular biology including reverse transcription and post-translational modifica-
tion of proteins.
Proteins can suffer phosphorylation, methylation, ubiquitination, nitration, acetylation, propionyla-
tion, butyrylation or succinylation as a post-translational modification [13]. New techniques, based on
mass spectrometry, have shown the importance and frequency of this modifications, namely the
phosphorylation and acetylation [9], [14]. The lysine acetylation was discovered more than 40 years
ago, but its involvement in a diversity of metabolic, nuclear and cytosolic processes in the past few
years incremented the number of studies [15], [16]. But, unlike protein phosphorylation, which can be
readily identified and studied by powerful tools such as in situ phosphate labelling and sensitive phos-
pho-specific antibodies, the reagents available for characterizing protein acetylation are much less
robust. This technical difficulty has limited studies of protein acetylation mostly to a protein-by-protein
basis [17]. However, the increasing power of high throughput proteomic techniques is starting to
change this view. The recent studies revealed that a vast number of metabolic enzymes are acety-
lated, which suggests that it is a way of metabolism regulation that is highly conserved [18]–[20]. This
work focuses in study possible lysine acetylation in phenylacetic-CoA ligase (PaaK) and 2-
hydroxycyclohepta-1, 4, 6-triene-1-carboxyl-CoA thioesterase (PaaY) and relate it with the degrada-
tion pathway of phenylacetic acid in E. coli.
Protein acetylation can be defined as the transfer of an acetyl group (-COCH3) from a convenient
biochemical donor molecule to an amino group on a protein [9], [21]. Deacetylation can also occur and

4
it consists in the removal of the acetyl group. Depending on the acetylated amino group, it is possible
to distinguish two main types of acetylation: the Nα-acetylation and Nε–acetylation. The first one can
be described as an irreversible modification at the terminal amino of a methionine residue. It is rare in
bacteria, but is very common in Eukaryotes and Achaea [22], [23]. In the other hand, the Nε-acetyla-
tion is the most common in bacteria and it occurs in the ε–amino of lysine residues (Figure 1-2) [24].
Figure 1-2 – Protein acetylation reaction steps using acetyl-Coenzyme A as the acetyl group donor. In histone
acetylation, a glutamate residue acts as a general base, activating the lysine ε-amino group for nucleophilic attack
on the carbonyl group of acetyl-CoA. A tetrahedral intermediate is formed, and then collapses with the loss of
coenzyme A (CoA-SH), to general acetyl lysine [25].
Acetylation can occur enzymatically, being catalysed by specific transferases, or non-enzymati-
cally, i.e., in a chemical way.
1.2.1 Non-enzymatic Acetylation
Several proteins can be non-enzymatically acetylated in the presence of reactive acetyl derivatives,
such as acetyl-phosphate (acetyl-P), acetyl-coenzyme A (acetyl-CoA) or acetyl-adenosine monophos-
phate (acetyl-AMP) (Figure 1-3) [9], [26]. But it is not clear yet whether these events are spontaneous
or autocatalytic [9]. Non-enzymatic acetylation was first observed in the 1970’s and might be particu-
larly relevant in mitochondria, where the local higher pH and high concentration of acetyl-CoA favour
the reaction. Given the slow kinetics of non-enzymatic protein acetylation, it is not likely to be relevant
for organisms such as Escherichia coli and Saccharomyces cerevisiae, which divide rapidly and dilute
their pool of acetylated proteins. Instead, non-enzymatic acetylation might be biologically more rele-
vant in post-mitotic tissues of multicellular organisms, in which acetylation of individual proteins can
progressively accumulate over extended periods of time [10]. The chemical acetylation of pro-
tein lysine residues strongly depends on pH, since, to occur the reaction, the protein’s amino group
needs to be deprotonated, and on the metabolic state of the cells, because it affects the concentration
of acetyl-CoA and acetyl-P [27]. In E. coli, CheY was the first protein that was proven to suffer chemi-
cal acetylation. Hence, the latest publications about non-enzymatic acetylation have considered it as
the major source of post-translational modification by acetylation [28], [29]. Moreover, these studies

5
revealed that acetyl-phosphate is possibly the main acetyl donor in this type of acetylation reactions
[26], [30]. Along this line, the unexpectedly high abundance of protein acetylation has highlighted the
importance of chemical acetylation of proteins in eukaryotes and prokaryotes.
Figure 1-3 – Non-enzymatic lysine acetylation with acetyl-CoA or acetyl-P as acetyl donor.
1.2.2 Enzymatic Acetylation
Enzymes belonging to the lysine acetyltransferase family can catalyse the acetylation of ε–amino
group of lysine residues. This type of reaction is an enzymatically acetylation. These lysine (K) acetyl-
transferase enzymes, also known as KATs or LATs, use acetyl-CoA as the acetyl molecule donor [31].
In E. coli, the Nɛ-acetyltransferase PatZ (previously known as YfiQ; this enzyme was named and
characterized in the department where the present work was performed [32]) is the only enzyme
known to be involved in post-translational acetylation of proteins [33]. Among these enzyme sub-
strates is important to mention the RNase R, the transcription factor RcsB and the protein acetyl-CoA
synthetize (Acs) [9], [34]–[36]. All of these acetylation reactions can be deacetylated by the sirtuin
CobB (Figure 1-4) [33], [37], [38].
Figure 1-4 – Enzymatic lysine acetylation of E. coli proteins. The enzymatic reaction of acetylation is catalysed by
lysine (K) acetyltransferases (KATs) and the only known in E. coli is PatZ. The reverse reaction is catalysed by
histone (H) deacetylases (HDACs) and in E. coli the enzyme responsible for this process is CobB. KATs require
acetyl-coenzyme A as the acetyl group donor.

6
1.3 Degradation of Phenylacetic Acid
Aromatic compounds are widely distributed in the environment, especially in soil and water, and
therefore they can constitute a normal carbon source for many microorganisms [2], [39], [40]. After
carbohydrates, they are the most abundant class of organic compounds used by nature, and their
concentrations have recently increased in many ecosystems as a consequence of human pollution
[41]. The degradation of such chemicals is accomplished mostly by microorganisms and recently there
has been a considerable interest in exploring their ability to degrade and detoxify the increasing
amounts of aromatic compounds as by-products of many industrial processes, which often contami-
nate the environment [2]. In this sense, the degradation pathways used by several microorganisms
become highly relevant as a subject of study in order to design and apply novel bioremediation strate-
gies, which use microorganisms or their enzymes to eliminate pollutants from contaminated environ-
ments [41]–[44].
Phenylacetic acid (PA) is a central compound to which pollutants, such as styrene and trans-
styrylacetic acid, as well as other aromatic compounds, such as 2-phenylethylamine, phenylacetalde-
hyde, and several phenylalkanoic acids with an even number of carbon atoms, converge through dif-
ferent peripheral catabolic pathways and are directed to the Krebs cycle [45], [46]. PA and its esters
are extensively used in plastic, textile, paper, insect repellent, pesticide and cosmetic industry and,
consequently, there has been enormous apprehension about their release into the environment and
their toxicity to living beings [47]. This compound is an organic compound containing a phenyl func-
tional group and a carboxylic acid functional group (Figure 1-5). PA and its derivatives are formed in
nature from a wide variety of natural as well as synthetic compounds. Their microbial biodegradation
and biotransformation have received the attention of many research groups for a long time. A number
of bacteria and fungi have been isolated and studied to reveal the metabolic pathways of this acid
under both aerobic and anaerobic growth conditions [48].
The relevance that has been given to this compound is also related with the fact that it is consid-
ered a model for xenobiotic compounds. Xenobiotic is a chemical which is found in an organism but is
not typically produced or expected to be present in it and it is often observed as an “artificial sub-
stance”, which did not exist in nature before its synthesis by humans: it is “foreign to the biosphere”
[49], [50]. Therefore, the fact that are known several organisms able to degrade xenobiotic compounds
has a huge importance regarding topics about environment and pollution, as it may have applications
in the field of bioremediation [50]–[52].
Figure 1-5 - Organic structure of phenylacetic acid.

7
Before 1983, most of the knowledge associated with aromatic catabolism was derived from studies
with genus Pseudomonas. The ability of Escherichia coli to degrade that class of compounds had not
been subject of previous studies, until Burlingame and Chapman reported that many laboratory strains
and clinical isolates of this organism were able to catabolize various aromatic acids [53]. Initially, the
ability of this bacterium to degrade aromatic compounds seemed to be an unexpected discovery, once
this feature has always been associated with typical soil bacteria and it was usually reported as an
inhabitant or commensal of the animal gut. But once the ecology of E. coli was reviewed, it was ob-
vious that this bacterium could easily find such compounds in its typical colonized habitats, what can
explain its catabolic potential to use aromatic compounds as carbon and energy source [2].
Despite the substantial progress made through studies with the catabolism of natural aromatic
compounds by E. coli over the past 30 years, it will be seen that there is still a lack of certainty in this
subject and the narrowing of this gap is a fertile research area. For example, the large gap between
sequence information and function of the enzymes involved in the PA catabolism and the reactions
steps that have not yet been reconstituted in vitro are the major challenges [2]. However, currently the
biodegradative abilities of this bacterium are no longer an “empty box” regarding the catabolism of
aromatic compounds and it has been shown that it is endowed with typical aerobic degradation routes
analogous to those described in environmental relevant bacteria, such as those of genus Pseudomo-
nas [2], [54].
The availability of oxygen is the key to understand how bacteria utilize such inert substrates. Under
aerobic conditions oxygen is used to hydroxylate and cleave the ring. In contrast, under anaerobic
conditions the inert substrates become activated to CoA-thioesters followed by shortening of the side
chain and energy-driven ring reduction; furthermore, ring cleavage occurs hydrolytically rather than by
oxygenation [40]. As an attempt to explain the use of aerobic catabolic pathways endowed with typical
features of anaerobic catabolism by E. coli, it was suggested that it could represent a strategy to deal
with fluctuations of oxygen supply. Because of that, this pathway is considered hybrid: although it is
aerobic, its catabolic intermediates (aryl-CoA derivatives) were, until recently, considered to be spe-
cific to anaerobic catabolic pathways [44], [55]. In this sense, the existence of a hybrid pathway for PA
catabolism in E. coli could reflect the facultative anaerobic character of this bacterium [2].
Before understanding the steps that PA undergoes inside the cell, it is important to realize how its
uptake is carried out. Despite the fact that aromatic compounds can get inside the cells by passive
diffusion when present at high (millimolar) concentrations, active transport increases the efficiency and
rate of substrate acquisition and consequently results in a growth advantage in natural environments,
where these compounds are present at low (micromolar) concentrations [2]. The transporters involved
in catabolism of aromatic compounds in E. coli usually belong to the large and diverse major facilitator
superfamily (MFS) of transport proteins, whose members generally possess 12 α-helical transmem-
brane spanners (TMS) [56]. The transport of phenylacetic acid has been studied in Pseudomonas
putida and it was observed that the responsible genes for the catabolism of PA in this organism and in
the organism in study are homologous. However, the gene that encodes for phenylacetic permease in
P. putida (phaJ) is absent in the gene cluster involved in the aerobic catabolism of PA in E. coli (paa

8
cluster) [57]. On the other hand, PhaJ from P. putida U shows significant amino acid sequence identity
to the product of the yjcG gene, found in E. coli genome. It was reported that both PhaJ permease
(520 a.a.) and the putative YjcG transporter (549 a.a.) cluster belong to the solute/sodium symporter
(SSS) family of carrier-type facilitators. Whether a permease, such as the putative YjcG protein, and a
channel-forming protein are required for the catabolism of PA in E. coli is still an unanswered question.
Another possibility is that, as it happens with the catabolism of long-chain fatty acids, the activation of
PA to PA-CoA may be due to the transport of this aromatic acid through the cytoplasmic membrane, in
this way a permease is unnecessary [2].
Once the PA molecules enter the cells, they begin to degraded. It has been established that the
aerobic metabolism of most aromatic compounds starts by ring hydroxylation reactions carried out by
mono and dioxygenases. These compounds are considered common intermediates in the aerobic
metabolism of most aromatic compounds. However, none of the possible routes, which might be ex-
pected for phenylacetic acid catabolism by analogy to those of its hydroxy derivatives, appears to op-
erate in phenylacetic-degrading bacteria. The inability to demonstrate the hydroxylation of PA by cell
extracts of different bacteria in the presence of different cofactors has been reported in several studies
and because of that there is still uncertainty about the aerobic pathway followed by bacteria for phe-
nylacetic acid metabolism [48].
So far, the best-characterized aerobic hybrid pathway is that of benzoate degradation in Azoarcus
evansii [58], in which all intermediates are CoA thioesters and the actual ring-cleavage reaction does
not require molecular oxygen. The aerobic hybrid pathway of phenylacetic acid degradation in bacteria
was initially described in Pseudomonas putida U [57], two decades ago, and in Escherichia coli W
[54]. In this pathway, PA is first activated by a phenylacetic-CoA ligase, requiring ATP, to PA-CoA
which subsequently undergoes a putative ring hydroxylation by multicomponent oxygenase, being
transformed into its ring-1, 2-epoxide that evolves to the formation of an oxepin-CoA intermediate.
Then, it suffers ring opening to form an aliphatic compound (dehydrosuberyl-CoA) and further β-oxida-
tion-type degradation through a proposed pathway that involves CoA thioesters and that converges
with the classicalβ–ketoadipate pathway at the β-ketoadipyl-CoA intermediate, ending with the syn-
thesis of acetyl-CoA and succinyl-CoA [43], [54], [57], [59]–[61]. The PA pathway is the core of the
phenylacetyl-CoA catabolon: a functional unit that integrates peripheral catabolic pathways that con-
vert several structurally related aromatic compounds, such as styrene, 2-phenylethylamine, tropic
acid, and phenylacetyl esters and amides, to the common intermediate phenylacetic acid-CoA
(PA-CoA). It is proven that succinyl-CoA is the final product of PA catabolic pathway in P. putida [57].
Once PA degradation in E. coli has been shown to follow a similar pathway to that in this organism, it
makes sense to claim that this compound is also a final product of the PA catabolic pathway in this
bacterium [39]. At this time, PA-CoA is the only intermediate of the PA pathway that has been une-
quivocally characterized in E. coli [39]. The PA pathway has also been described in several other
gram-negative bacteria, such as A. evansii, other Pseudomonas strains and even gram-positive bacte-
ria and in genus Thermus. Therefore, this pathway appears to be widely distributed in bacteria and it is
the only pathway of aerobic PA degradation reported so far in these organisms (Figure 1-6) [39]. Alt-

9
hough the first reports of aerobic phenylacetic acid-metabolizing bacteria appeared more than fifty
years ago, the pathway itself remains enigmatic [61].
Figure 1-6 – Proposed outline of the pathway of aerobic metabolism of phenylacetic acid in E. coli. Detailed infor-
mation is provided in the previous paragraph. TCA - tricarboxylic acid cycle.

10
Table 1-1 – Correspondence between original gene denomination and protein function in E. coli on phenylacetic
catabolism [44].
Protein Function Gene
Phenylacetyl-CoA ligase paaK
Ring-hydroxylating complex (protein 1) paaA
Ring-hydroxylating complex (protein 2) paaB
Ring-hydroxylating complex (protein 3) paaC
Ring-hydroxylating complex (protein 4) paaD
Ring-hydroxylating complex (protein 5) paaE
Ring-opening enzyme paaZ
Enoyl-CoA hydratase 1 paaF
Enoyl-CoA hydratase 2 paaG
3-OH-acyl-CoA dehydrogenase paaH
Putative thioesterase paaI
Ketothiolase paaJ
Repressor protein paaX
Putative regulator paaY
All aromatic catabolic routes so far reported in E. coli began to be described at a molecular level
with the molecular characterization of the paa-encoded pathway [54]. Moreover, when these dis-
coveries were made it was possible to anticipate unique features of the aerobic paa-encoded pathway,
like novel catabolic activities. This is great from the biotechnological point of view, to improve some
microorganisms for the degradation of PA-related aromatic environmental pollutants and for the syn-
thesis of pathway intermediates, which can be useful in the production of new or modified antibiotics
and plastics [40], [44], [54].
It is proven that the paa operon of E. coli encodes 14 polypeptides involved in the catabolism of PA
[62]. The genes in the paa cluster are organized in three transcriptional units: two of them, paaZ and
paaABCDEFGHIJK, encode the catabolic genes, and the third, paaXY, contains the paaX and paaY
regulator genes (Figure 1-7, Table 1-1). All genes are transcribed in the same direction with the ex-
ception of paaZ. Located downstream of paaZ, paaK, and paaY, three inverted repeat sequences may
act as transcriptional terminators [2], [63]. The expression of the divergently transcribed paaZ and
paaABCDEFGHIJK catabolic operons, which are responsible for PA degradation in E. coli, is driven by

11
the Pz and Pa promoters, respectively [45]. The paa pathway is controlled by a transcriptional re-
pressor named PaaX, the main regulator of the phenylacetic acid aerobic degradation pathway [41],
[60]. The action of PaaK inhibits PaaX, the repressor of the paa operon, i.e., PA-CoA, but not PA,
specifically inhibits the binding of PaaX to the target sequences of the promoters Pa and Pz, what
confirms that the first intermediate of the pathway is the true inducer [45], [60]. Therefore, Pz and Pa
promoters are negatively regulated by the paaX gene product that is transcribed in an adjacent operon
and, as a consequence, the paa-operon is expressed and the meta-cleavage pathway subsequently
degrades PA-CoA before it enters the tricarboxylic acid cycle [60], [64]. Besides, it was demonstrated
that, in E. coli, the paaX and paaY genes form a true operon that is auto-regulated by PaaX in a PA-
CoA dependent way [60].
Figure 1-7 – Genetic organization of paa gene cluster in E. coli which codes for the catabolism of phenylacetic
acid (PA) [61].
The complete paa cluster was cloned and efficiently expressed in different E. coli PA-deficient
strains, conferring to the latter the ability to use PA as the sole carbon and energy source. The paaK
gene and the paaABCDE functional unit (involved in the hydroxylation of the PA-CoA intermediate)
have been used to engineer efficient biocatalysts for the bioconversion of PA into 2-hydroxyphenyla-
cetic acid, a compound of interest in the pharmaceutical industry for the synthesis of different biotech-
nological products, technique that is patented [2].
PA biodegradation pathway becomes, thereby, a very interesting model of an aerobic hybrid route
for the catabolism of aromatic compounds [45]. But the use of aromatic compounds as growth sub-
strate is not ideal for the microorganisms and it exhibits a couple of problems. To start, the organisms’
biggest challenge is to overcome the stabilizing resonance energy of the aromatic ring system. The
aromatic structure of the compounds makes the substrates unreactive towards oxidation or reduction
and therefore requires elaborate degradation strategies. In the other hand, catabolism may give rise to
toxic intermediates, such as epoxide formation and its accumulation could compromise cell vitality,
being toxic for cells and their host [43], [61], [65]. This last statement can be explained taking into ac-
count the recently elucidated, and apparently universal, bacterial coenzyme A-dependent degradation
of phenylacetic acid, with very similar chemistry reactions to the ones at benzene metabolism in hu-
mans: cytochromes P450 are known to metabolize benzene to benzene-epoxide that equilibrates

12
spontaneously with the oxepin. Further ring opening yields reactive aldehydes. Those compounds and
also the spontaneous phenolic breakdown product of benzene-oxide are known to be reactive toward
proteins and DNA and are potentially carcinogenic. Of greatest interest is the demonstration that cata-
bolic gastrointestinal activities of gut bacteria leading to the formation of phenols are causal factors for
leukaemia. Therefore PA catabolism in E. coli and other microaerobic gut bacteria may contribute to
forms of de novo leukaemia [2], [61].
1.4 The PaaK Enzyme
There is experimental evidence that the gene paaK codifies the protein phenylacetyl-CoA ligase
in E. coli (PaaK, also known as phenylacetate-CoA ligase or PA-CoA ligase) (48.95 KDa), an activity
that has been detected in this bacteria when it is grown in PA-containing medium [54]. This enzyme
(EC number: 6.2.1.30) is the one responsible to catalyse the first step in an aerobic pathway of PA
degradation, which consists in the activation of PA to PA-CoA, and it is located at the 3’ end of the paa
operon [2], [54], [62], [66], [67]. PaaK is a protein with 437 amino acids, where 17 are lysine.
The PA-CoA ligase activity from E. coli is dependent on the presence of ATP, Mg2+, CoA, and PA.
Besides, in silico analysis revealed that PaaK protein shows significant amino acid sequence identity
to equivalent PA-CoA ligases involved in PA catabolism in other organisms, such as PhaE (65.6%
identity) from P. putida U and PaaK from Pseudomonas sp. Y2 (67.3% identity) and A. evansii (64.6%
identity). Putative PA-CoA ligases are Orf12 from a potential PA degradation pathway from Bacillus
halodurans and Orf03286 (PaaK) from the Deinococcus radiodurans genome, which shows about
50% amino acid sequence identity to PaaK from E. coli [2], [67]. It is known that the PA catabolism
encoding genes are present in about 16% of completely sequenced bacterial genomes and in some
archaea, what strongly indicates its relevance [60], [61], [65]. These observations are in agreement
with the fact that PA-CoA oxygenases share a common ancestor and they constitute a widespread
new enzymatic system to hydroxylate PA-CoA in bacteria [63], [67], [68].
This enzyme from E. coli has never been crystalized but the homologous proteins from A. evansii
and P. putida are both identified as monomers [48], [69]. In Thermus thermophiles, the correspondent
phenylacetyl-CoA ligase was characterized as a dimer [68]. Also, by similarity, the localization of this
protein is identified as the cytoplasm of the cell.
However, biochemical data for PaaK is lacking. To date, only phenylacetyl-CoA ligase from Pseu-
domonas putida U and from Azoarcus evansii have been purified and characterized, but unfortunately,
these enzymes are unstable, difficult to synthesize non-enzymatically and they are indispensable for
studying of all the others yet unresolved enzymes of the hybrid pathway [48], [57], [69]. Indeed, sev-
eral articles relate attempts to purify the protein phenylacetyl–CoA ligase (PaaK) from E. coli, always
without success [59]. The expression of active PaaK using E. coli as a host has also been proved to
be difficult in previous studies. An extensive investigation of the expression conditions was performed
with different host strains, culture volumes and aeration, growth temperatures, inductor concentrations

13
and time of induction, but the protein remained undetected or with stability problems [40], [48], [57],
[65], [68]–[70].
Another important aspect that increases the idea that PaaK is an instable protein is the fact that the
mutant paaK is absent in ASKA collection. Moreover, it is the only one from the paa cluster that is not
present [71]. With the purpose of understanding the reason why paaK is not present at ASKA collec-
tion, it was established a contact with Dr. Hirotada Mori, who promptly replied. Dr. Hirotada Mori clari-
fied that once paaK was inserted in the plasmids used in the study, the cultures made from it did not
show growth.
1.5 The PaaY Enzyme
The paaY gene, which codifies the protein 2-hydroxycyclohepta-1, 4, 6-triene-1-carboxyl-CoA thi-
oesterase (PaaY), is part of the gene cluster for growth on PA as the sole source of carbon and it is
still very unknown. In the first studies about PA degradation pathway, it was observed similarity be-
tween this enzyme and members of bacterial transferases family, but PaaY remains with unproven
function resembling acetyltransferases [59]. PaaY has 196 amino acids, 10 being lysines.
Previously overexpression and purification experimental tests have determined that this enzyme
has a quaternary structure. Furthermore, sedimentation studies at different concentrations of PaaY
were made and have demonstrated that the protein acts as a homotrimer in all the range of concentra-
tions studied by the 3D model [60]. The average molecular weight between different concentrations is
62 200 Da for the trimer [61], while for the monomer it is 21 325 Da [72]. Even though this protein has
never been crystallized in order to corroborate this data, there is a published bioinformatics modelling
of it [60].
Currently, the role given to PaaY is to carry out a cellular detoxification in the PA pathway [61]. It
happens when the levels of NADP+ inside the cell are too low, making the PaaZ enzyme fail. This
event triggers the spontaneous formation of an intermediate (2-hydroxyciclohepta-1, 4, 6-triene-1-
carboxyl-CoA) that inhibits PaaZ. The inhibition of this enzyme results in the accumulation of 2-oxepin-
2 (3H)-ylideneacetyl-CoA, which is converted, by the PaaG enzyme, into 1, 2-epoxyphenylacetyl-CoA.
This compound is known as an intracellular toxic. To avoid the formation of this toxic compound, PaaY
breaks the thioester bond from 2-hydroxyciclohepta-1, 4, 6-triene-1-carboxyl-CoA, reducing the inhibi-
tion effect on PaaZ. Also, other enzymes such as PaaABCE and PaaI lead to the deoxygenation of 1,
2-epoxyphenylacetyl-CoA and in this way the toxicity of that compound is reduced too. Summing up,
the action of PaaY, PaaABCE and PaaI together prevent the accumulation of toxic compounds deriva-
tives from phenylacetic acid degradation route [61], [65].
Additionally, recently it has been proposed that PaaY has a regulatory function. It is known that
PaaY activity is increased in cells grown on PA, but transposon insertions in paaY have no effect on
the ability of E. coli W to degrade it. However, a paaY mutant shows an extensive lag period when
grown on PA as the sole source of carbon [59], [60]. It is described that paaY is co-transcribed with
14
the transcriptional repressor paaX and since it is located within the same transcriptional unit as PaaX,
a role in regulation seems likely possible, perhaps by inactivating PaaK through acetylation [61]. This
claim comes to strengthen the idea already mentioned that PaaY acts as an acetyltransferase. This
will enable to reduce the degradation of PA, by varying levels of PaaK active, and thus adjust the me-
tabolism in response to the presence of high concentrations of acetyl-CoA.
It has also been determined that the optimal activity of PaaY occurs at a pH of 8.0 and 45 °C and
its thioesterase activity doubles in the presence of 5 mM of Co2+ ions. While Cu2+, Zn2+ and Mn2+ have
an inhibitory effect; Ca2+, Zn2+ and Mg2+ do not affect the activity. Conducted spectrometric analyses
revealed that the purified enzymes contained Ca2+ and Zn2+. All these features suggest that it may be
a metalloenzyme, having a metal ion as a cofactor [61], [73].

15
2 Chapter 2 – AIMS AND MOTIVATION
The present work was performed in the Department of Biochemistry and Molecular Biology B and
Immunology from Universidad de Murcia (Spain). This research group has spent several years re-
searching about Escherichia coli physiology regulation through acetylation of proteins. All the investi-
gations related to that subject make part of the project entitled "Integrating transcriptional and post-
transcriptional regulation of central metabolism in E. coli. Application to optimization of biotechnologi-
cal processes", with the code BIO2011-29233-C02-01. This research was partially supported by the
National Plan Project MICINN (Spain) and FEDER-EU. The main objective of this study is to further
understand the role of protein acetylation in the regulation of metabolic dynamics in E. coli, especially
due to changes in response to the availability of carbon sources (glucose, glycerol, acetate or phe-
nylacetic acid), what could represent a breakthrough in Synthetic Biotechnology.
The importance of E. coli to biotechnology industry is extensive. This organism is usually used as a
cell factory and due to that it is important to understand its metabolism. One phenomenon that has
recently received more importance is lysine acetylation, a post-translational modification that involves
the transfer of an acetyl group from a donor molecule to the lysine ε-amino group of a protein. En-
zymes can catalyse this reaction and in E. coli the only acetyltransferase known is PatZ, which was
characterized by the group where this work was carried out [32]. Immunoblotting and mass spec-
trometry analysis showed that Acs enzyme activity is post-translationally regulated by acetylation of
lysine-609 by PatZ [74]. In this line, an alignment of the Acs and PaaK, from E. coli, was done and it
was observed that lysine-609 from Acs is homologous to lysine-424 from PaaK (see Appendix I).
Therefore, exists the possibility that PatZ can show some specificity to this specific lysine from PaaK.
Additionally, as mentioned in the section 1.5, PaaY can have acetyltransferase activity, a possibility
that has not yet been confirmed. This way, these two assumptions are the starting point of this work.
In a general way, the target of this project is to determine the effects of protein acetylation on post-
translational regulation of the catabolism of PA in E. coli and discover how it is integrated with global
metabolic regulation. This study focuses on obtaining a conclusion about those two assumptions and
to accomplish the essential characterization of PaaK and PaaY and study the acetylation of both en-
zymes. To achieve these goals the overall aim has been divided in the following partial objectives:
1. Design and construct an overexpression vector for PaaK;
2. Optimization of suitable conditions and techniques to overexpression and purify PaaK;
3. Perform activity studies with PaaK;
4. Purify PaaY with a method already optimized;
5. Carry out in vitro acetylation studies of PaaK and PaaY and identify the acetylated lysine;
6. Perform conformation studies with PaaK and PaaY;
7. Implement a protein model to PaaK and PaaY.

16
3 Chapter 3 – MATERIALS AND METHODS
This section includes an overview of bacterial strains used in this work (Table 3-1), the most used
buffers (Table 3-2), antibiotics (Table 3-3), reactive (Table 3-4) and mediums, as well as a detailed
description of the main methods and assays applied during the experimental work. The majority of the
methods and techniques are based on “Current Protocols in Molecular Biology” [4].
3.1 Strains
To accomplish the experimental work was required different E. coli strains. On one hand, the strain
E. coli TOP10F’ (Invitrogen) was used for molecular biology procedures. TOP10F´ chemically compe-
tent cells are identical to TOP10 cells, with the addition of an F´ episome. TOP10 competent cells are
provided with high transformation efficiency and are ideal for high-efficiency cloning and plasmid prop-
agation. The F´ episome carries the tetracycline resistance gene and the lacIq, what leads to an over-
production of the lac repressor protein. Additionally, this episome has host chromosomal genes on it
from a previous recombination event and it allows isolation of single-stranded DNA from vectors that
have an f1 origin of replication [75], [76]. On the other hand, proteomics assays were made with the
strains E. coli BL21 (DE3) and E. coli BL21 (DE3) pLysS, both from Aligent Technologies. BL21
strains have been specifically constructed for high-level expression of recombinant proteins. These
strains have two important attributes that make them ideal for protein overexpression: key genetic
markers and inducibility of protein expression. The genetic markers help protein accumulation to high
levels without degradation, mainly because these strains are lacking some proteases. The fact that it
is inducible helps to minimize the toxic effects of some recombinant proteins. BL21 chemically compe-
tent cells are ideal to use with bacteriophage T7 promoter-based expression systems (for example,
pRSET) and they carry the lambda DE3 lysogen. Recombinant proteins that are nontoxic to E. coli are
generally expressed at higher levels in BL21 (DE3) cells than in BL21 (DE3) pLysS. However, the
basal expression levels of heterologous genes are significantly higher in BL21 (DE3) than in BL21
(DE3) pLysS [6], [77], [78].
All the strains were made chemically competent by rubidium method, leading to the formation of
pores which allow transformation by heat shock at 42 °C. For more information see 3.4.3 and 3.4.5
sections.

17
Table 3-1 – Description of the strains used in this work, source and reference.
Strain Description Source Reference
Escherichia
coli TOP10F’
F' [lacIq Tn10(tetR)] mcrA Δ(mrr-hsdRMS-mcrBC)
φ80lacZΔM15 ΔlacX74 deoR nupG recA1 araD139
Δ(ara-leu)7697 galU galK rpsL(StrR) endA1 λ-
Invitrogen [79]
Escherichia
coli
BL21 (DE3)
F– ompT gal dcm lon hsdSB(rB- mB-) λ(DE3 [lacI
lacUV5-T7 gene 1 ind1 sam7 nin5])
Agilent
Technologies [80]
Escherichia
coli
BL21 (DE3)
pLysS
F- ompT gal dcm lon hsdSB(rB- mB-) λ(DE3)
pLysS(cmR)
Agilent
Technologies [81]
Escherichia
coli K12
(BW25113)
F-, Δ(araD-araB)567, ΔlacZ4787(::rrnB-3), λ-, rph-
1,Δ(rhaD-rhaB)568, hsdR514
Keio
Collection [82]
Escherichia
coli K12 ΔpatZ
(JW2568)
F-, Δ(araD-araB)567, ΔlacZ4787(::rrnB-3), λ-, Δpka-
752::kan, rph-1,Δ(rhaD-rhaB)568, hsdR514
Keio
Collection [82]
Escherichia
coli K12
ΔcobB
(JW1106)
F-, Δ(araD-araB)567, ΔlacZ4787(::rrnB-3), λ-
, ΔcobB779::kan, rph-1, Δ(rhaD-rhaB)568, hsdR514
Keio
Collection [82]
Escherichia
coli K12
ΔpaaX
(JW1394)
F-, Δ(araD-araB)567, ΔlacZ4787(::rrnB-3), λ-
, ΔpaaX763::kan, rph-1, Δ(rhaD-rhaB)568, hsdR514
Keio
Collection [82]
Escherichia
coli K12
ΔpaaY
(JW1395)
F-, Δ(araD-araB)567, ΔlacZ4787(::rrnB-3), λ-
, ΔpaaY764::kan, rph-1, Δ(rhaD-rhaB)568, hsdR514
Keio
Collection [82]
3.2 Reactants and Equipment
The following tables contain a list of all the buffers, antibiotics and reactants used throughout the
experimental work. The water used to accomplish the experiments was Milli-Q Water, otherwise it is
mentioned. The equipment and its brand and model is referred along the text, whenever necessary.

18
Table 3-2 – Buffers used in the experimental study and its composition.
Buffer Characteristics
Loading buffer 30% v/v glycerol; 0.25% w/v bromophenol blue; 0.25% w/v
xylene cyanol FF
Binding buffer 50 mM NaH2PO4 (pH 7.5); 0,5 M NaCl;
20 mM Imidazole
Wash buffer 50 mM NaH2PO4 (pH 7.5); 0,5 M NaCl;
50 mM imidazole
Elution buffer 50 mM NaH2PO4 (pH 7.5); 0,5 M NaCl;
250 mM imidazole
Storage buffer to PaaK 50 mM KH2PO4 (pH 7.5); 200 mM NaCl; 20% v/v Glycerol; 5
mM PA
Storage buffer to PaaY 50 mM NaH2PO4 (pH 7.5) and 10% v/v glycerol
TAE (Tris-acetate-EDTA) buffer 40 mM Tris Acetate; 1 mM EDTA; pH 8.2
Running buffer 25 mM Tris; 192 mM glycine, 0.1% SDS
Native electrophoresis buffer 25 mM Tris; 192 mM glycine
Transfer buffer 25 mM Tris; 192 mM glycine
Mixture of tris-Buffered Saline and
Tween 20 (TBST) 50 mM Tris; 150 mM NaCl; 0,05% v/v Tween-20; pH 7.5
Blocking Buffer TBST; 2% wt/v BSA
Potassium phosphate buffer 50 mM KH2PO4 (pH 7.5)
Sodium chloride buffer 0.9 % v/v NaCl
Table 3-3 – Antibiotics used with reference to its stock and final concentration and mode of action.
Antibiotic Stock
Concentration
Final
Concentration Mode of action [4]
Ampicillin (A) 100 mg/ml 100 μg/ml
Bactericidal; inhibits cell wall synthesis by
inhibiting formation of the peptidoglycan
cross-link.
Chloramphenicol
(Clor) 30 mg/mL 30 μg/ml
Bacteriostatic; inhibits protein synthesis by
interacting with the 50S ribosomal subunit
and inhibiting the peptidyltransferase re-
action. It is prepared in methanol.

19
Table 3-4 – List of reactants used with reference to its stock and final concentration and mode of action, when
applied.
Reagent Stock concentration Description [4]
Isopropyl-1-thio-β-D-galactoside
(IPTG) 100 mM
Very effective inducer; non-metaboliza-
ble inducer
Myokinase 200 U/mL Phosphotransferase enzyme
Pyruvate kinase 300 U/mL It catalyses the transfer of a phosphate
group from phosphoenolpyruvate to ADP
Lactate dehydrogenase 1000 U/mL It catalyses the conversion of pyruvate to
lactate
Phosphoenolpyruvate 60 mM -
MgCl2 100 mM -
ATP 25 mM -
CoA 10 mM -
NADH 10 mM -
DTT 25 mM -
PA 50 mM -
3.3 Media
3.3.1 Luria Broth Medium (LB)
In the section 3.4 and 3.5 the medium used was complex Luria Broth medium (LB), otherwise it is
mentioned specifically which one. The composition of this medium is 10 g/L tryptone, 5 g/L yeast ex-
tract and 5 g/L NaCl. The reagents are combined and dissolved in Mili-Q water, until the desired vol-
ume. Before use, it is sterilized by autoclaving for 20 min at 15 psi and 121 °C on liquid cycle.
3.3.2 Minimal Medium M9 (MM9)
At section 3.8 it was used minimal medium M9 (MM9), a growth medium for cells that contains only
salts, vitamins, trace elements, and simple compounds, which works as carbon, nitrogen and phos-
phorous sources. As described in Table 3-5, MM9 is compounded by 8 different solutions. Once it is
prepared it is stored at 4 °C.

20
Table 3-5 – Composition of minimal medium used (MM9).
Solution Chemical Final Concentration Supplier
Sol. 1
(NH4)2SO4 10 mM Fluka
NaCl 8,5 mM Panreac
Na2HPO4 40 mM Fluka
KH2PO4 20 mM Sigma
Adjust pH to 7.4 and autoclave with liquid program. Store at room temperature.
Sol. 2 MgSO4 1 mM Merk
Autoclave with liquid program. Store at room temperature.
Sol. 3 CaCl2 0.1 mM Merk
Autoclave with liquid program. Store at room temperature.
Sol. 4
FeCl3 185 µM Probus
EDTA 175 µM Sigma
Sterilize by filtration. Store at 4 ºC. Protect from light covering with aluminium foil.
Sol. 5
ZnSO4 7 µM Panreac
CuSO4 7 µM Probus
MnSO4 7 µM Panreac
CoCl2 7 µM Panreac
Sterilize by filtration. Store at room temperature.
Sol. 6 Thiamine HCl 1 µM Merk
Sterilize by filtration. Store at 4 ºC.
Sol. 7
Carbon source
(PA acid) 5 mM Sigma
Autoclave with liquid program. Store at room temperature.
Sol. 8 Milli-Q Water
-
Autoclave with liquid program. Store at room temperature.
3.4 Molecular Biology
3.4.1 Agar Plates
Luria broth medium (LB) (section 3.3.1) with 1.5% agar is prepared and autoclaved. The solution is
cooled until approximately 50 °C and then poured into sterile plastic plates (petri dish) under a sterile
hood and allowed to solidify. If it is necessary to add some antibiotic, it is done once the solution is
cooler, because it is sensitive to temperature degradation, and with the desired concentration. After
21
solidification the plates are stacked, turned upside down (to avoid water condensation), sealed in plas-
tic bags and stored at 4 °C, to extend their shelf life.
3.4.2 Agarose Gel Electrophoresis
Conventional agarose gel electrophoresis was used to analyse DNA fragments. Agarose gel elec-
trophoresis is a simple, rapid, common and highly effective method for separating, identifying and
purifying DNA fragments. The protocol can be divided into 3 stages: a gel is prepared with agarose at
the concentration of 1% wt/v (the percentage depends of the size of DNA fragments that is required to
separate) by dissolution in 1x TAE buffer (Table 3-2); then the gel solution is casted into a gel tank,
any bubbles are removed, the gel comb is added and the gel is allowed to set. At last, the DNA sam-
ples are loaded into the sample wells and the gel is ran out in a horizontal tank containing 1x TAE, at a
voltage and for a time period that will achieve optimal separation, generally 100 V for 0.5 h. Redsafe at
a concentration of 5% wt/wt was incorporated into the gel, allowing its visualization directly upon UV
light illumination. Photos of the gels were taken with a CCD camera (National Electronics M900X).
3.4.3 Preparation of Competent Escherichia coli BL21 cells: Rubidium Method
E. coli is usually prepared as competent cells in large batches and stored at -80 °C. When it is
needed, the cells are taken out, mixed with DNA and given a heat shock. The method used in this
work implies the treatment of the bacteria’s cell wall with rubidium chloride [83].
3.4.4 Expression Vector1: Selection and Construction
To achieve a high-level expression of the recombinant protein of interest (PaaK) in E. coli, the plas-
mid pRSET-C [84] from InvitrogenTM was used (Figure 3-1). This plasmid allows to obtain the PaaK
linked to six histidines (His), one epitope or recognition site to antibodies and an enterokinase cleav-
age point, which permits the separation of the purified protein from the histidine tag. Furthermore, the
plasmid has a multi cloning site (MCS), a gene for ampicillin resistance and a promoter to which the
inducer, IPTG (isopropyl β-D-thiogalactopyranoside), binds to stimulate overexpression.
1 From now on, in this work, the term “vector” is a reference to the plasmid that was engineered to make it a
more useful tool in the overexpression of the desired proteins. To be more explicit, the term “plasmid” is always
related to pRSET-C and the “vector” could be related to pRSET-C+paaK or pRSET-C+paaY.

22
Figure 3-1 – Scheme of the used plasmid (pRSET-C). Source: pRSET-C user manual (Invitrogen).
Extraction and Purification of Plasmid DNA
In order to purify the plasmid, the process starts by growing overnight the strain E. coli TOP10F’
(Invitrogen), which contain the plasmid pRSET-C, in LB plates with Ampicillin at 100 μg/ml (A100).
Once the colonies are grown, one isolated colony is picked to grow in liquid medium. For that it is re-
quired 10 mL of LB medium, 10 µL of A100 plus one isolated colony from the plate; this is prepared in
a falcon (50 mL) and then it is left to grow overnight at 37 °C and under orbital shaking (250 rpm).
Next, the purification of pRSET-C is done, using the commercial GeneJET Plasmid Miniprep Kit
(Thermo Scientific), following the manufacturer’s instructions. Before the purification step, it is essen-
tial to harvest the bacterial culture by centrifugation (15 min, 4000 rpm, 4 °C).
Double Digestion of Plasmid DNA
Inserting the gene in the plasmid implies to open it using restriction enzymes. Since it is needed to
open the vector in 2 distinct sites, it is required 2 restriction enzymes: EcoRI and PstI, which carry out
a double digestion. The protocol specifies that it is needed 5 µL of each restriction enzyme, plus 5 µL
of each fast digest enzyme buffer (Thermo scientific), 30 µL of the purified vector (pRSET-C) and 5 µL
of microbiological water. The mixture is then exposed to 37 °C, over 15 min. It is necessary to
dephosphorylate the ends of the digested plasmid, with alkaline phosphatase enzyme (Thermo Scien-
tific) (Figure 3-2).
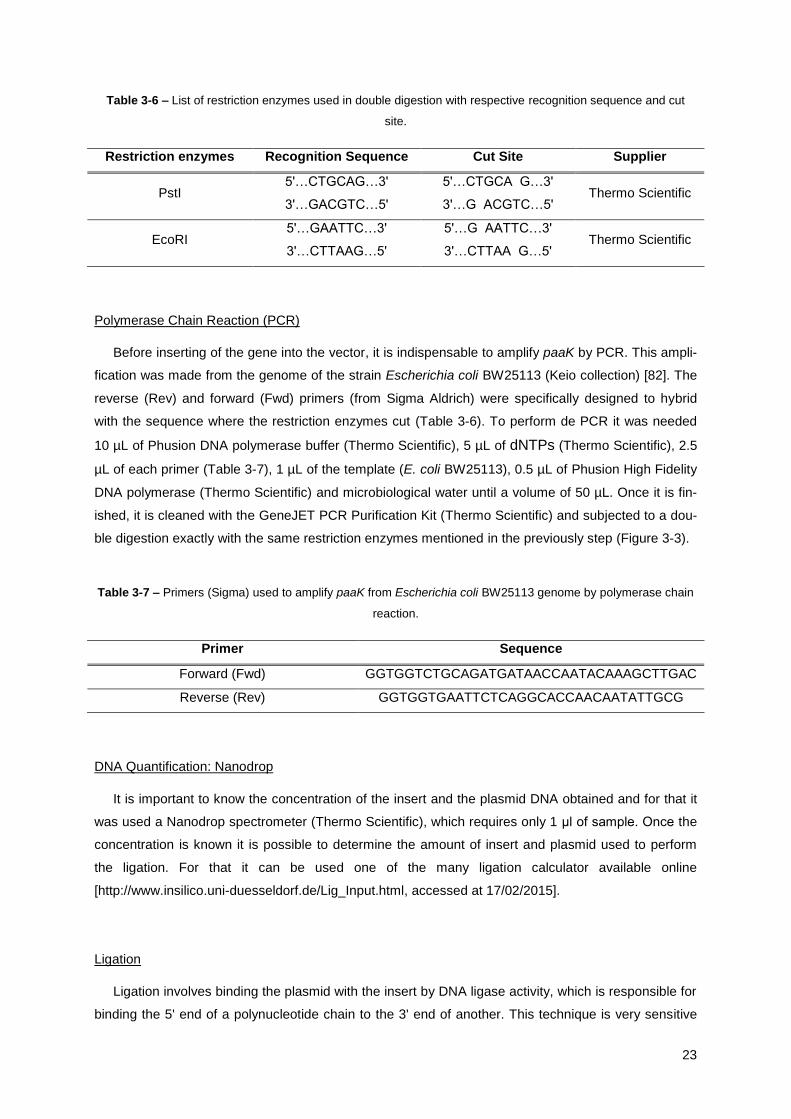
23
Table 3-6 – List of restriction enzymes used in double digestion with respective recognition sequence and cut
site.
Restriction enzymes Recognition Sequence Cut Site Supplier
PstI 5'…CTGCAG…3'
3'…GACGTC…5'
5'…CTGCA G…3'
3'…G ACGTC…5' Thermo Scientific
EcoRI 5'…GAATTC…3'
3'…CTTAAG…5'
5'…G AATTC…3'
3'…CTTAA G…5' Thermo Scientific
Polymerase Chain Reaction (PCR)
Before inserting of the gene into the vector, it is indispensable to amplify paaK by PCR. This ampli-
fication was made from the genome of the strain Escherichia coli BW25113 (Keio collection) [82]. The
reverse (Rev) and forward (Fwd) primers (from Sigma Aldrich) were specifically designed to hybrid
with the sequence where the restriction enzymes cut (Table 3-6). To perform de PCR it was needed
10 µL of Phusion DNA polymerase buffer (Thermo Scientific), 5 µL of dNTPs (Thermo Scientific), 2.5
µL of each primer (Table 3-7), 1 µL of the template (E. coli BW25113), 0.5 µL of Phusion High Fidelity
DNA polymerase (Thermo Scientific) and microbiological water until a volume of 50 µL. Once it is fin-
ished, it is cleaned with the GeneJET PCR Purification Kit (Thermo Scientific) and subjected to a dou-
ble digestion exactly with the same restriction enzymes mentioned in the previously step (Figure 3-3).
Table 3-7 – Primers (Sigma) used to amplify paaK from Escherichia coli BW25113 genome by polymerase chain
reaction.
Primer Sequence
Forward (Fwd) GGTGGTCTGCAGATGATAACCAATACAAAGCTTGAC
Reverse (Rev) GGTGGTGAATTCTCAGGCACCAACAATATTGCG
DNA Quantification: Nanodrop
It is important to know the concentration of the insert and the plasmid DNA obtained and for that it
was used a Nanodrop spectrometer (Thermo Scientific), which requires only 1 μl of sample. Once the
concentration is known it is possible to determine the amount of insert and plasmid used to perform
the ligation. For that it can be used one of the many ligation calculator available online
[http://www.insilico.uni-duesseldorf.de/Lig_Input.html, accessed at 17/02/2015].
Ligation
Ligation involves binding the plasmid with the insert by DNA ligase activity, which is responsible for
binding the 5' end of a polynucleotide chain to the 3' end of another. This technique is very sensitive
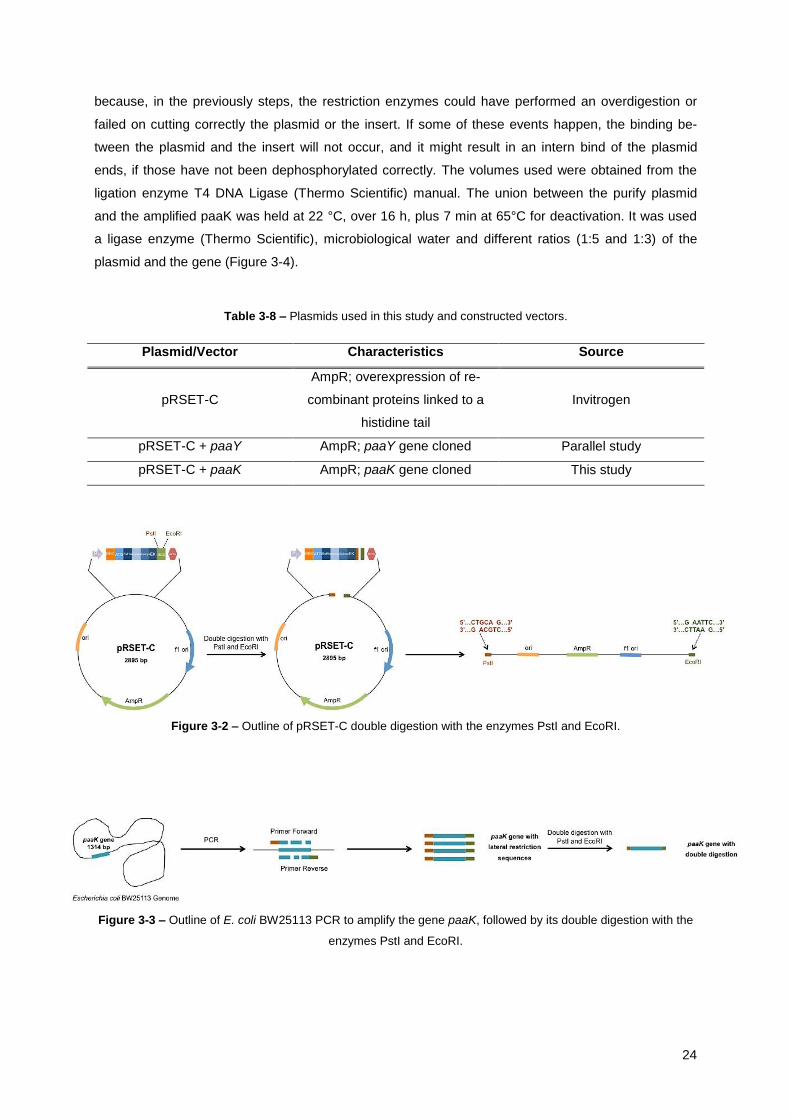
24
because, in the previously steps, the restriction enzymes could have performed an overdigestion or
failed on cutting correctly the plasmid or the insert. If some of these events happen, the binding be-
tween the plasmid and the insert will not occur, and it might result in an intern bind of the plasmid
ends, if those have not been dephosphorylated correctly. The volumes used were obtained from the
ligation enzyme T4 DNA Ligase (Thermo Scientific) manual. The union between the purify plasmid
and the amplified paaK was held at 22 °C, over 16 h, plus 7 min at 65°C for deactivation. It was used
a ligase enzyme (Thermo Scientific), microbiological water and different ratios (1:5 and 1:3) of the
plasmid and the gene (Figure 3-4).
Table 3-8 – Plasmids used in this study and constructed vectors.
Plasmid/Vector Characteristics Source
pRSET-C
AmpR; overexpression of re-
combinant proteins linked to a
histidine tail
Invitrogen
pRSET-C + paaY AmpR; paaY gene cloned Parallel study
pRSET-C + paaK AmpR; paaK gene cloned This study
Figure 3-2 – Outline of pRSET-C double digestion with the enzymes PstI and EcoRI.
Figure 3-3 – Outline of E. coli BW25113 PCR to amplify the gene paaK, followed by its double digestion with the
enzymes PstI and EcoRI.

25
Figure 3-4 – Outline of the ligation between pRSET-C and paaK, both double-digested, which results in the vec-
tor named pRSET-C+paaK.
3.4.5 Transformation of Competent Cells
Escherichia coli TOP10F’ cells were transformed by heat shock. This method implies to subject the
cells (50 µL) and the vector (10 µL) to a drastic temperature change, from ice during 15 min to 42 °C,
over 90 sec and then ice again. Once it is performed, the cells were plated in LB-agar with ampicillin
100 µg/ml and the plates are let to grow overnight at 37 °C [85].
Vector Purification and PCR
The plasmid with the insert (pRSET-C+paaK) was extracted and purified from the colonies that had
grown in plate, using the same kit mentioned before (GeneJET Plasmid Miniprep Kit). To amplify the
paaK once it was inserted into the vector, it is necessary to do PCR where the primers (Table 3-9) are
specific for the plasmid and they bind to the MCS region, but all the process is similar to the previously
PCR described.
Table 3-9 – Primers used to amplify paaK by polymerase chain reaction from the vector pRSET-C+paaK, inserted
in Escherichia coli TOP10F’ cells.
Sequencing
Posteriorly, to check if the cloned insert maintains the correct sequence without any errors, it was
sequenced with a 4 capillaries sequencer model AB Prism 3130 from Applied Biosystems at SACE
(Servicio de Apoyo a la Investigación, Universidad de Murcia). The results from the sequence were
Primer Sequence Supplier
Forward (Fwd) TAATACGACTCACTATAGGG Sigma
Reverse (Rev) CTTCCTTTCGGGCTTTGTT Sigma
26
analysed by the program Sequence Scanner v1.0, a software from Applied Biosystems (Life Technol-
ogiesTM).
Stock of pRSET-C+paaK
Perform a plasmid stock is essential to keep copies of the constructed vector inside E. coli
TOP10F' cells. This procedure involves the transformation of the vector into the bacterium chemical
competent cells and subsequent plate it. Finally, an isolated colony obtained from the plate is placed
in LB with A100 and grown at 37 °C with orbital shaking. After this, the culture is aliquoted into a la-
belled cryotube and added 40% of glycerol. Finally it is stored in freeze at -80 °C.
The PCRs, double digestions and ligations were performed on a MJ Research thermocycler PTC-
200 (Biorad) and were checked by restriction analysis and agarose gel electrophoresis.
3.5 Proteomic: Overexpression and Purification of PaaK
Proteomics experiments were carried out using the strains E. coli BL21 (DE3) and E. coli BL21
(DE3) pLysS. Consequently, the first step was the transformation of the cells used with the vector built
in the previously section. The process is similar to the one described in the section 3.4.5. The suc-
ceeding experiments are going to be described as performed in the strain E. coli BL21 (DE3), taking
into account that the process to E. coli BL21 (DE3) pLysS cells is similar, if not, the differences are
listed in the end of the description. It is important to mention also that the vector pRSET-C+paaY was
only transformed into the strain E. coli BL21 (DE3).
3.5.1 Cultures
The competent cells of E. coli BL21 (DE3) transformed with the vector were plated into LB-agar
A100 plates and once it has grown, one isolated colony was selected to prepare the pre-inoculum with
LB and A100, which is allowed to grow 12 h at 37 °C and 250 rpm. Flasks with a ratio of 1:5 of oxygen
to the contained volume were inoculated with the pre-inoculum volume necessary for an initial O.D.
(optical density), at a wavelength of 600 nm, of 0.05 units. The volume of pre-inoculum was calculated
based on the expression: (O.D.600 x V)i = (O.D.600 x V)f. Cultures were incubated at 37 °C, always
maintaining orbital shaking (250 rpm). Ampicillin at a final concentration of 100 µg/mL was always
used.
To E. coli BL21 (DE3) pLysS is also required the use of Clor30, as well as A100.
The O.D.600 value was measured using the visible light spectrophotometer Novaspec Plus (Amer-
sham Biosciences). It was taken in attention the linearity limitations of Lambert-Beer Law’s and be-
cause of that the adequate dilutions were used. Culture samples were taken under sterile conditions.
27
3.5.2 Induction Kinetics of PaaK
Cultures of 100 mL with LB medium were carried out as described above. The overexpression was
induced with IPTG 1mM when the O.D. 600 reach the value of 0.5 and the temperature was lowered to
30 °C. To follow the induction kinetic of cultures, samples were taken every hour until the culture reach
a plateau where it stops growing. It was collected a sample of 1 mL from the culture and it was centri-
fuged at 3000 rpm during 5 min, then the supernatant was discarded and the pellet was suspended in
a solution of NaCl at 0,9%. The O.D.600 and protein concentration of each sample were measured and
quantified.
To the strain E. coli BL21 (DE3) pLysS the overexpression was induced at an O.D.600 between 0.5
and 1 and after induction the temperature was lowered to room temperature (RT).
3.5.3 Overexpression and Purification of PaaK
Cultures of 400 mL were performed in LB medium with ampicillin (100 µg/mL) and the volume of
pre-inoculum to permit an initial O.D.600 of 0.05. When the O.D.600 is 0.5 it is added IPTG 1mM to in-
duce overexpression. Initially the culture start growing at 37 °C, but after the induction the temperature
was changed to 30 °C and it was allowed to grow for 4 more hours. After incubation, the cultures were
harvested by centrifugation and thoroughly washed with 0.9% NaCl.
To E. coli BL21 (DE3) pLysS the overexpression was induced at an O.D.600 between 0.5 and 1 and
after induction the temperature was lowered to RT and it was allowed to grow in this condition for 3 h.
To start the process of purification, the cells were re-suspended in 10 mL of binding buffer (Table
3-2), which is supplemented with EDTA-free protease inhibitor (SigmaFAST Protease Inhibitor Cock-
tail Tablet, from Sigma Aldrich). Cells were lysed by sonication using a Vibra Cell (Sonicator Sonics &
Materials) that performs six cycles of 20 sec each, with vibration amplitude of 3 microns and a probe
diameter of 1.5 mm. During sonication the cells were kept on ice, what keeps the temperature lower
than 20 °C. The next step was the lysates’ centrifugation to clarify them (10000 xg, 20 min at 4 ºC)
and finally the proteins of interest contained in the supernatants were purified by IMAC (immobilized
metal ions affinity chromatography) using the HisGraviTrap columns [86] (GE Healthcare). These colu-
mns contain agarose bound to iminodiacetic acid (IDA), which binds to Ni2+ ions through 3 focal
points. The HisGraviTrap columns were specifically designed to purify proteins bound to a "tail" of six
histidines, through binding the amino acid with an imidazole functional group to Ni2+ ions. Elution was
accomplished by applying a gradient of increasing imidazole concentration, which competed with the
histidines for binding to the support. The protein extract in the column had an initial imidazole concen-
tration of 20 mM, whereby the specific bindings to Ni2+ from the bracket (fraction 1) were minimized.
Subsequently, imidazole concentration was increased to 50 mM (Wash buffer, Table 3-2) and 10 mL
of wash buffer was passed through the column 3 times (fraction 2-4). Finally, the imidazole concentra-
tion was increased to 250 mM (Elution buffer, Table 3-2) and 2.5 mL of this buffer was passed in the

28
column (Fraction 5). All the fractions were collected and 15 µL were taken to make a SDS-PAGE gel
to demonstrate the protein purification.
After purification, the salt and imidazole from protein-containing fractions were removed using the
gel permeation column PD-10 Sephadex G-25 [87] (GE Healthcare). Purified proteins were kept in
storage buffer (Table 3-2), aliquoted and saved at -80 ºC until used. The purification process was
made as fast as possible and always with the buffers and samples kept on ice.
3.5.4 Overexpression and Purification of PaaY
The process of overexpression and purification of PaaY had already been optimized by a
co-worker and it is similar to what was described to PaaK. The E. coli strain used to obtain PaaY was
BL21 (DE3), as mentioned before. The only difference between the purification processes of the two
enzymes is that in PaaY the culture is stopped after 5 h of the induction.
3.5.5 Quantification of Protein Concentration: Bradford Method
To determine the protein concentration of the samples it was used the Bradford method [88] (Sig-
ma Aldrich). This method is a colorimetric method that proclaims to be very sensitive (0.5-10 µg of pro-
tein) and it is one of the quantification proteins methods with least interferences. It depends on the
binding quantification of a dye (Coomassie brilliant blue) to an unknown concentration protein and
comparing this binding to that of different amounts of a standard protein: BSA. The protein bovine
serum albumin (BSA) was used to construct the respective calibration lines with 7 standards with
known concentration: 1.0 mg/mL; 0.75 mg/mL; 0.50 mg/mL; 0.25 mg/mL; 0.125 mg/mL; 0.025 mg/mL
and 0 mg/mL (blank). The samples were prepared with 250 µL of Coomassie brilliant blue plus 5 µL of
the sample with unknown protein concentration. The absorbance at 595 nm was measured in a Micro-
plate Spectrophotometer Synergy HT (BIO-TEK) and it was used a standard curve, built with the 7
standards, to determine the unknown concentration. If the unknown protein concentration is too high
(out of the standard curve), the protein is diluted.
3.5.6 Protein Electrophoresis
It was used two different types of electrophoresis: electrophoresis under denaturing conditions
(SDS-PAGE) and electrophoresis in native conditions (NATIVE-PAGE).
SDS-PAGE Electrophoresis
SDS-PAGE means sodium dodecyl sulphate (SDS) polyacrylamide gel electrophoresis (PAGE)
and this technique is useful for molecular weight analysis of proteins. SDS is a detergent that disso-

29
ciates and unfolds oligomeric proteins into its subunits by binding to the polypeptides to form com-
plexes with fairly constant charge to mass ratios. The electrophoretic migration rate of the proteins
through a gel is determined by the pore size of the gel matrix and charge, size, and shape of the pro-
tein, but the principal factor is the molecular charge. This procedure is used to determine protein subu-
nit composition, verify homogeneity of the protein sample and purify proteins. Molecular weights of
unknown proteins are determined by simultaneously running marker proteins of known molecular
weight.
To prepare the samples to run in the gel, it is needed 15 μL of protein plus 5 μL of loading buffer
and this mixture is subjected to denaturalization during 5 min at 100 °C. The SDS-PAGE acrylamide
gels used had a concentration of 10% and they are divided in two parts: the stacking gel and the run-
ning gel. Electrophoresis was performed in a Mini-PROTEAN 3 kit (BioRad) using running buffer (Ta-
ble 3-2). The compaction step was performed at 70 V and the separation step at 140 V. The molecular
weight marker used was the Prestained Protein molecular weight marker (Thermo Scientific), with a
range between 20 and 120 kDa.
Once electrophoresis was finished, to detect the proteins, the gels were stained with Coomassie
blue, PageBlue (Thermo Scientific) [89].
NATIVE Gel Electrophoresis
"Native" or "non-denaturing" gel electrophoresis, opposite to SDS-PAGE gels, it is run in the ab-
sence of SDS. Once the electrophoresis occurs under native conditions the mobility depends on both
the protein's charge and its hydrodynamic size. As main applications, it can be used to study confor-
mation, self-association or aggregation, and the binding to others proteins or compounds. As well as, it
allows to recover proteins in their native state after the separation.
For native electrophoresis, NativePAGE 4-16% Bis-Tris gels (BioRad) and NativeMarkTM Unstained
Protein Standard (Life Technologies) were used. The Electrophoresis was performed in a Mini-PRO-
TEAN 3 cuvette (BioRad) using Native electrophoresis buffer (Table 3-2). The separation was made at
200 V. Likewise with SDS-Page, when finish the electrophoresis, the gels were stained with the Coo-
massie method [89].
3.5.7 Liquid Chromatography: Tandem Mass Spectrometry Assay (LC-MS/MS)
The bands of interest obtained in SDS-PAGE gels and Native gels were cut and analysed by
LC-MS/MS at SAI (Servicio de apoyo a la investigación, Universidad de Murcia).
The first step is a trypsin digestion, and the protocol used depends if the samples are from an elec-
trophoresis gel (In-gel Trypsin digestion) or liquid (In-solution Trypsin digestion). The protocol for both
digestions is similar, this way for more specific details see Appendix II.

30
Trypsin Digestion
Samples were alkylated with 100 mM iodoacetamide (IAA) during 30 min at room temperature in
the dark. Proteins were digested with 0.5-1 µg of Trypsin Gold Proteomics Grade (Promega) for 3 h at
37 ºC. Reaction was stopped with 0.1% formic acid and samples were dried using a vacuum evapora-
tor.
LC-MS/MS Analysis
The separation and analysis of the tryptic digests of the samples were performed with a LC-MS
system. An Agilent 1100 (Agilent Technologies) was equipped with a Zorbax SB-C18 HPLC column
(Agilent Technologies), and connected to an Agilent Ion Trap XCT Plus mass spectrometer (Agilent
Technologies) using an electrospray (ESI) interface. Two mobile phases were used: phase A, com-
posed by water/acetonitrile/formic acid (94.9:5:0.1, v/v) and phase B, consisting in wa-
ter/acetonitrile/formic acid (10:89.9:0.1, v/v). The digested peptides were re-suspended in 20 µl of
phase A and eluted using a linear gradient from 0-80% phase B for 180 min and at a flow rate of 10
µl/min. The mass spectrometer was operated in the positive mode with a capillary spray voltage of
3500 V, and a scan speed of 8100 (m/z)/sec from 50 to 2200 m/z, with a target mass of 1000 m/z, and
3 spectra averaging. The nebulizer gas pressure was set to 15 psi, whereas the drying gas was set to
a flow of 5 L/min at a temperature of 350 ºC. MS/MS data were collected in an automated
data-dependent mode (AutoMS mode). Data processing was performed with Data Analysis program
for LC/MSD Trap Version 3.3 (Bruker Daltonik) and Spectrum Mill MS Proteomics Workbench (Agilent
Technologies) [90], [91]. After an automatic validation of the results, a summary of the identified pro-
teins with the sequence of the digested peptides was reported. Peptides were considered valid with a
score threshold above 5, and percentage-scored peak intensity higher than 70% (for more information
see Appendix II).
3.5.8 PaaK Activity
The PaaK activity was determined based on the coupled assay reported by Williamson and Corkey
[92]. AMP production was detected via a coupled-enzyme assay in which myokinase (MK) (Sigma-
Aldrich), pyruvate kinase (PK) (Sigma-Aldrich) and lactate dehydrogenase (LDH) (Sigma-Aldrich) cou-
ple AMP production to NADH oxidation. Standard PaaK activity assays (0.2 mL) were performed at 37
°C in 50 mM potassium phosphate buffer at pH 7.5 containing 3 mM phosphoenolpyruvate (PEP), 5
units MK, 1 unit PK, 1.5 units LDH, 5 mM MgCl2, 2.5 mM ATP, 1.5 mM CoA, 0.1 mM NADH, 5 mM PA
and 1 mM dithiothreitol (DTT). The study was proceeded with a concentration range of PaaK between
50 nM and 500 nM. All reactions were performed in triplicate. Specific activity was calculated from the
extinction coefficient of 6.22 mM-1 cm-1 for the oxidation of two molecules of NADH for each AMP re-
leased. One unit of PaaK activity is defined as 1 μmol of acetyl-CoA formed per minute at pH 7.5 and
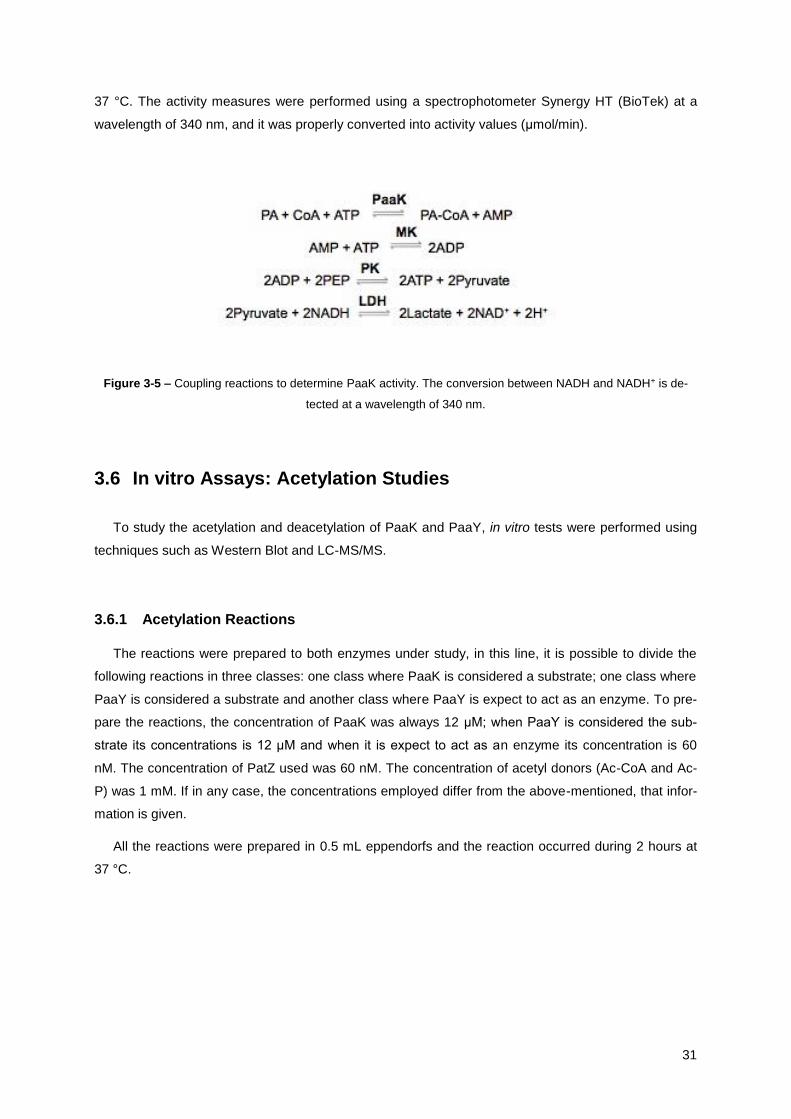
31
37 °C. The activity measures were performed using a spectrophotometer Synergy HT (BioTek) at a
wavelength of 340 nm, and it was properly converted into activity values (μmol/min).
Figure 3-5 – Coupling reactions to determine PaaK activity. The conversion between NADH and NADH+ is de-
tected at a wavelength of 340 nm.
3.6 In vitro Assays: Acetylation Studies
To study the acetylation and deacetylation of PaaK and PaaY, in vitro tests were performed using
techniques such as Western Blot and LC-MS/MS.
3.6.1 Acetylation Reactions
The reactions were prepared to both enzymes under study, in this line, it is possible to divide the
following reactions in three classes: one class where PaaK is considered a substrate; one class where
PaaY is considered a substrate and another class where PaaY is expect to act as an enzyme. To pre-
pare the reactions, the concentration of PaaK was always 12 μM; when PaaY is considered the sub-
strate its concentrations is 12 μM and when it is expect to act as an enzyme its concentration is 60
nM. The concentration of PatZ used was 60 nM. The concentration of acetyl donors (Ac-CoA and Ac-
P) was 1 mM. If in any case, the concentrations employed differ from the above-mentioned, that infor-
mation is given.
All the reactions were prepared in 0.5 mL eppendorfs and the reaction occurred during 2 hours at
37 °C.

32
Table 3-10 – List of all the acetylation reactions, with indication of the reactive used and its concentration. The
symbol means that the reactive is used in the reaction; otherwise the symbol is used.
Reaction Identification
Reactive 1 2 3 4 5 6 7 8 9 10
PaaK (12 μM)
PaaY (12 μM)
PaaY (60 nM)
PatZ (60 nM)
Ac-CoA (1 mM)
Ac-P (1 mM)
3.6.2 Western Blot
Lysine acetylated proteins were separated by SDS-PAGE gel electrophoresis (10% acrylamide).
The proteins were transferred to PVDF (polyvinylidene difluoride) membranes, previously wetted in
methanol to activate them. The process was carried out using a semidry transfer unit (Trans-Blot® SD
Semi-Dry Transfer Cell, Bio-Rad), a voltage of 20 V for 20 min was applied and it was also used a
transfer buffer (Table 3-2). After being transferred, the membrane was blocked through incubation
during 1 h with blocking buffer (Table 3-2), to remove non-specific binding sites.
When the blocking step was finished, it was added the primary rabbit monoclonal anti-acetyl-lysine
antibody (Inmunechem Pharmaceuticals), at a dilution of 1:750, and it was left stirring overnight at 4
°C. In order to remove the excess primary antibody, 6 washes of 10 min each were performed with
TBST buffer (Table 3-2). The next step, once finished the washes, was to incubate the membrane with
goat anti-rabbit IgG secondary antibody coupled to a peroxidase (Santa Cruz Biotechnology), at a
dilution of 1:5000, over one hour. Then 10 washes were performed, 6 minutes each. Finally, the mem-
brane was incubated for 10 min with Amersham ECL Western blotting detection reagent (chemilumi-
nescent substrate for peroxidase) (Thermo Scientific). The signal detection was made with Im-
ageQuant LAS 500 (GE Healthcare Life Sciences).
3.7 Bioinformatics: PaaK and PaaY Molecular Modelling
With the aim of studying the tertiary structure of PaaK and PaaY, a model for both enzymes was
built. The servers and software used to model the proteins tertiary structure are given below:
Phyre2: it is a server used to predict a monomer three-dimensional structure based on the
multiple sequence alignment, using principles and techniques of homology modelling; it selects
proteins with known structure to model the unknown ones [93].
33
ProQ2: it is a server computer tool used to evaluate the monomer model quality. It is an algo-
rithm of quality assessment that uses a support vector to predict both the local quality, and the
overall quality of the protein models [94].
fpocket2: it is a program from the Phyre2 server used to locate the protein hydrophobic pocket
(cavity). It is an algorithm used for detecting protein ligand binding pockets [95], [96].
CDD (NCBI’s conserved domain database): it is a database of conserved protein domain
models, which utilizes 3D structure to provide insights into sequence/structure/function relation-
ships. The domain’s characterization is carried out by sequence homology with known proteins
[97].
ClusPro2: it is a server used to model the docking of protein structures. This server uses a
method of automated docking algorithm for the prediction of protein complexes, evaluating bil-
lions of putative complexes and retaining a present number with favourable surface comple-
mentarities. A filtering method is then applied to this set of structures, selecting those with good
electrostatic and de-solvation free energies for further clustering. To execute this process,
three calculation steps are performed: determining a rigid coupling body using as correlation
approach the Fourier transform; calculating the root mean square deviation (RMSD) from the
protein group based on the generated structures to find the most likely complex models; and
making a refinement of the selected structures. The program output is a short list of putative
complexes ranked according to their clustering properties [98], [99].
Predict Protein: server used to analyse the amino acid sequence protein and it can also be
used to predict the protein subcellular localization [100], [101].
Procheck: checks the stereochemical quality of a protein structure. Server used to obtain Ra-
machandran representation of the models [102].
3.8 Studies with Phenylacetic Acid
3.8.1 Cultures
To analyse the specific growth rate, cultures were grown in minimal medium 9 (Table 3-5) with 5
mM of PA as the only carbon source. The strains used were E. coli K12 BW25113 (Wild-type), E. coli
K12 PatZ, E. coli K12 cobB, E. coli PaaX and E. coli PaaY. The pre-inoculum was prepared in
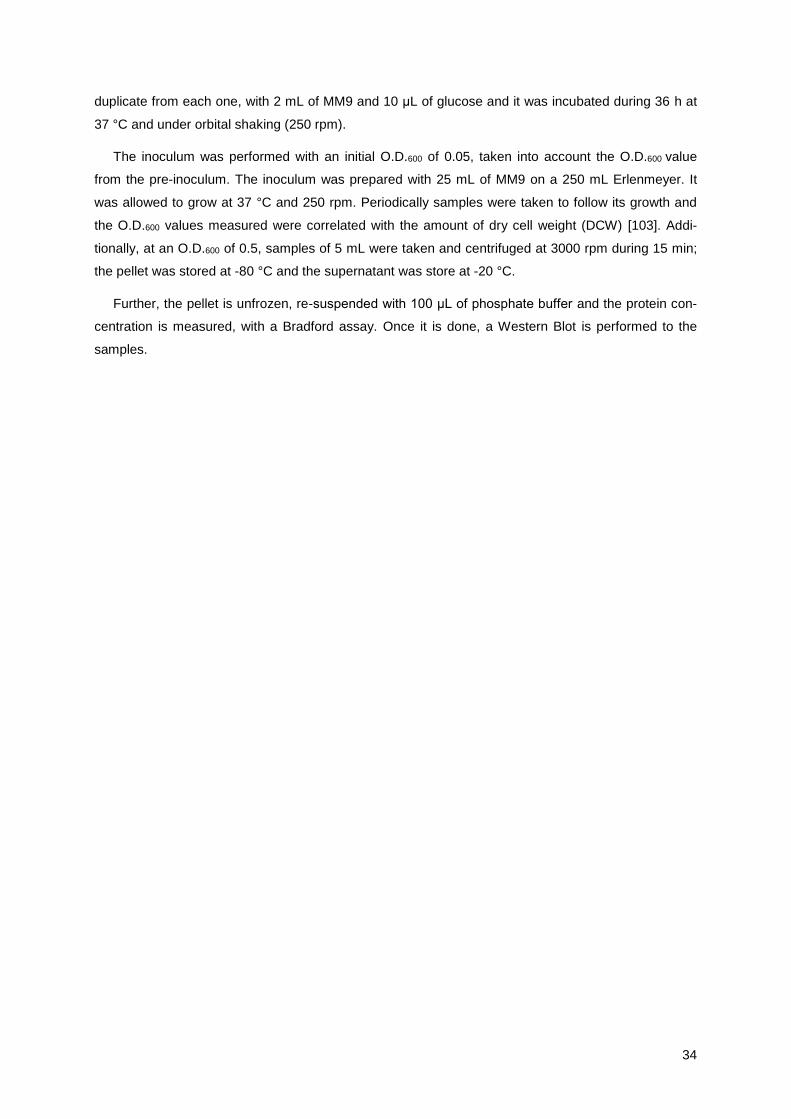
34
duplicate from each one, with 2 mL of MM9 and 10 μL of glucose and it was incubated during 36 h at
37 °C and under orbital shaking (250 rpm).
The inoculum was performed with an initial O.D.600 of 0.05, taken into account the O.D.600 value
from the pre-inoculum. The inoculum was prepared with 25 mL of MM9 on a 250 mL Erlenmeyer. It
was allowed to grow at 37 °C and 250 rpm. Periodically samples were taken to follow its growth and
the O.D.600 values measured were correlated with the amount of dry cell weight (DCW) [103]. Addi-
tionally, at an O.D.600 of 0.5, samples of 5 mL were taken and centrifuged at 3000 rpm during 15 min;
the pellet was stored at -80 °C and the supernatant was store at -20 °C.
Further, the pellet is unfrozen, re-suspended with 100 μL of phosphate buffer and the protein con-
centration is measured, with a Bradford assay. Once it is done, a Western Blot is performed to the
samples.
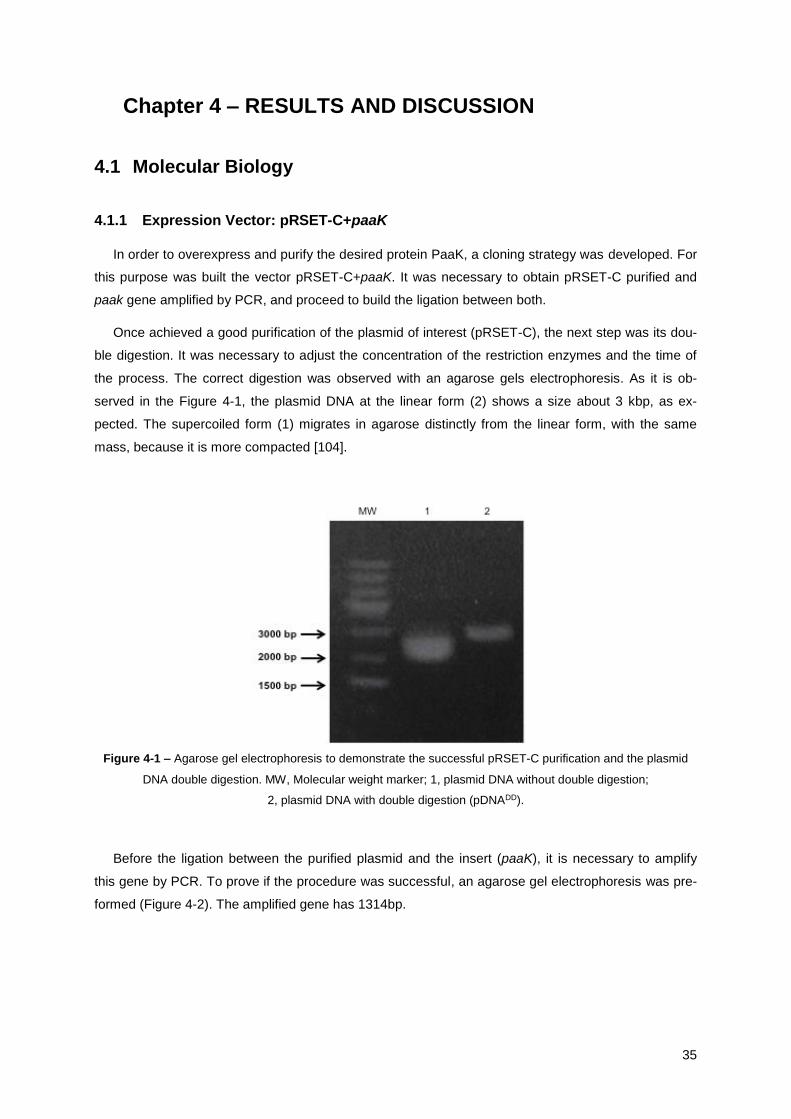
35
4 Chapter 4 – RESULTS AND DISCUSSION
4.1 Molecular Biology
4.1.1 Expression Vector: pRSET-C+paaK
In order to overexpress and purify the desired protein PaaK, a cloning strategy was developed. For
this purpose was built the vector pRSET-C+paaK. It was necessary to obtain pRSET-C purified and
paak gene amplified by PCR, and proceed to build the ligation between both.
Once achieved a good purification of the plasmid of interest (pRSET-C), the next step was its dou-
ble digestion. It was necessary to adjust the concentration of the restriction enzymes and the time of
the process. The correct digestion was observed with an agarose gels electrophoresis. As it is ob-
served in the Figure 4-1, the plasmid DNA at the linear form (2) shows a size about 3 kbp, as ex-
pected. The supercoiled form (1) migrates in agarose distinctly from the linear form, with the same
mass, because it is more compacted [104].
Figure 4-1 – Agarose gel electrophoresis to demonstrate the successful pRSET-C purification and the plasmid
DNA double digestion. MW, Molecular weight marker; 1, plasmid DNA without double digestion;
2, plasmid DNA with double digestion (pDNADD).
Before the ligation between the purified plasmid and the insert (paaK), it is necessary to amplify
this gene by PCR. To prove if the procedure was successful, an agarose gel electrophoresis was pre-
formed (Figure 4-2). The amplified gene has 1314bp.

36
Figure 4-2 – Agarose gel electrophoresis to demonstrate paaK gene amplification by PCR. MW, Molecular weight
marker; 1, paaK PCR product 1 (PCR_1); 2, paaK PCR product 2 (PCR_2).
As it is possible to analyse, both PCR results show a molecular weight similar to what is expected.
In the next step, it was necessary to quantify the concentration of both samples and also the plasmid
DNA with double digestion using a Nanodrop system (see section 3.4.4).
Table 4-1 – Nanodrop results.
Sample Concentration (ng/μL) A260/280 A260/230 A320
pDNADD 66.50 1.70 0.80 0.06
PCR_1 37.94 1.70 0.10 0.02
PCR_2 45.63 1.70 0.40 0.02
Nucleic acids have maximum absorbance at 260 nm. The value of absorbance at 280 nm and 230
nm correspond to proteins and organic compounds, respectively. To measure the sample’s purity, the
absorbance rations A260/280 and A260/230 were analysed. The first one should be between 2.10 and 1.80
for pure DNA and for the second ration it is desired a value between of 2.00 and 2.20. A320 is also im-
portant since it provides the turbidity measure of the sample. Excessive values here may indicate non-
specific contamination, due to the lack of absorbance by nucleic acids or proteins, so the value should
be close to 0,00 [105]–[107]. With this in mind, it is possible to claim that the samples present at Table
4-1 have a reasonable ratio A260/280, what could mean a low protein contamination. In the other hand,
the ratio A260/230 is low for all the samples and values below 1.80 are considered to have a significant
amount of organic contaminants, which is in agreement with the A320 value. Therefore, all the samples
show a low protein contamination but a high organic contamination, what may be due to the reagents
used in the isolation step.
The next procedure was to determine the amount of pDNADD and insert (PCR_1 or PCR_2) need-
ed. It was prepared ligations with a molar ratio between the insert and the vector of 5:1 and 3:1, to test

37
which one allows better results. It was used as insert the PCR_2, because its nanodrop values are
better (considering the reasons abovementioned).
The ligations were transformed into chemically competent cells of the E. coli strain TOP10F’ and
plates, containing ampicillin, were plated with cells from each ligation to prove if the ligation was suc-
cessful. In both plates, isolated colonies were obtained, which leads to state that ligations were well
achieved, but in the plate with cells from 3:1 ligation it was possible to observe more colonies than in
the 5:1. It is worthy to mention that both plates’ colonies seemed to be really small but with an uniform
appearance. As a way to prove the ligation success between the vector and the insert, three isolated
colonies from the agar plate with 3:1 and 5:1 ligation were picked, purified and an agarose electropho-
resis gel was done with the samples both with and without double digestion.
Figure 4-3 – Agarose gel electrophoresis to demonstrate the ligation between the plasmid and the insert. On the
upper image it is shown the samples without double digestion and at the image below are the same samples after
double digestion. MW, Molecular weight marker; 1, plasmid DNA (pRSET-C); 2, 3 and 4 are different ligations
with the ratio 3:1; 5, 6 and 7 are different ligations with the ratio 5:1.
As it is possible to analyse at Figure 4-3, the sample 4 shows the same weight as the control (1),
what permits to claim that it does not have the insert connected to the plasmid, so it was discarded. All
the other samples show a correct ligation, but with different concentrations (different band thickness).
Furthermore, in the gel with the samples submitted to double digestion there are 2 bands visible: one
band with exactly the same weight as the control (1) and another band that corresponds to the insert.
The size of the plasmid pRSET-C is about 2.9 Kbp and the gene paak has 1314 bp, thereby the vector
of expression pRSET-C+paaK presents 4214 bp.

38
The following step was the amplification of the insert cloned in the plasmid, in order to sequence
and analyse it. The primers used at this step are specific for the plasmid and they anneal with the ad-
jacent region to the MCS. Because of that, the amplified sequence is slightly bigger that the paaK
gene: it will include a portion from the plasmid where the primers needed to bind.
Figure 4-4 – Agarose gel electrophoresis to demonstrate the PCR amplification of the MCS where paaK gene
was cloned. MW, Molecular weight marker; 1; PCR_2; 2 and 3, PCR amplification of paaK from ligations 3:1; 4 to
6, PCR amplification of paaK from ligations 5:1.
The samples obtained by the PCR amplification of the MCS were sequenced. The results were an-
alysed with the program Sequence Scanner v1.0 and compared with the known sequence of paaK.
Only the second ligation from 5:1 (sample number 5 at Figure 4-4) showed mistakes and was dis-
carded. All the others presented a good match with the correct sequence of paaK. All the following
steps were performed with sample 2 (Figure 4-4).
With these results it is possible to confirm the ligation between the vector pRSET-C and the insert
paaK, with both ratios. The previous steps were also performed to construct the vector
pRSET-C+paaY, but by a co-worker. Therefore, in the present work it will not be given any data about
it. To perform the experiments where the use of pRSET-C+paaY was required, it was used its stock
stored at -80 °C. Thus, it was possible to continue with the project to a proteomic study level.
4.2 Proteomic
4.2.1 Induction Kinetic of PaaK in E. coli BL21 (DE3)
Before carrying out protein purification it is required to execute previous induction kinetics experi-
ments. This way, it is possible to understand the culture moment when an overexpression of the de-
sired protein occurs and if the expression vector responds to the inductor properly. Thus, it allows to
optimize the culture time, temperature and inductor concentration.
This stage is meant to optimize the culture condition to overexpress and purify PaaK, what requires
controlling the time and temperature of incubation of the pre-culture and culture and the concentration

39
of the inducer IPTG. Usually the optimization of the culture incubation temperature is not needed,
since the optimal growth temperature for E. coli is 37 °C, however within the literature reviews this
protein is difficult to overexpress. Several articles mentioned that PaaK is a thermal sensitive and un-
stable protein, therefore that instability could lead to a non-expression and non-purification, loss of
activity or protein denaturation [40], [55], [69], [70]. Based on this, it was decided to test the effect of
lowering the temperature when the culture is inducted.
Several studies were made to determine the optimum conditions for the protein overexpression
and they are described in this section, as well as at Appendix III (Induction kinetic of PaaK in E. coli
BL21 (DE3) section). In the different experiments the samples’ processing was always carried out in
the same way. Before the gel SDS-PAGE, a Bradford was realized to determine the protein concentra-
tion and it enables to load the same protein concentration at all the gel’s wells.
At 37 °C and with IPTG 1 mM as inductor, several experiments were conducted and an overex-
pression of PaaK was never observed. On the other hand, it was studied if the IPTG concentration
had any effect on overexpression. Based on the results shown on Appendix III, it is possible to claim
that the change of temperature affects the overexpression, but the concentration of IPTG does not.
From now on, all the induction kinetics and purifications of PaaK were performed under the circum-
stances described, since they were found to be better ones: the inoculum is done at an O.D.600 of 0.05
and the culture is incubated at 37 °C. When it is time to induce, at an O.D.600 of 0.5 and with an IPTG
concentration of 1 mM, the culture temperature is changed to 30 °C and let to grow for 4 more hours.
Figure 4-5 – Growth curve of the strain of E. coli BL21 (DE3) overexpressing the protein PaaK (I) and SDS-PAGE
gel to demonstrate its overexpression (II). The point marked on I as the moment of induction (2 h) corresponds to
the lane 1 on II and the following lanes on II correspond to the subsequent points on I.

40
It is noticeable an overexpression of three proteins on II (Figure 4-5): one with around 70 kDa, one
close to 50 kDa and a smaller one with 45 kDa. From the nuclear sequence, PaaK is expected to have
48.953 KDa. A possibility it is that the desired protein is the one in the middle and the others are pro-
teins possibly inducible by the induction of PaaK.
4.2.2 Purification of PaaK in E. coli BL21 (DE3)
Hereupon, it was possible to purify the PaaK several times under the same optimized conditions
during the kinetic induction studies, but always with low concentration due to its instability.
As mentioned in the section 3.5.3, the purification is carried out by HisGraviTrap columns, to which
the protein binds because of its histidine tail. Once the purification process is finished, a SDS-PAGE
gel is done to confirm if PaaK was successfully purified and isolated from the proteins pool present in
the extract. In the gel (Figure 4-6) are presented all the purification fractions to attest that the protein is
eluted exclusively in the elution fraction, which allows to prove the binding specificity of the histidine
tag to the resin column.
Figure 4-6 – SDS-PAGE gel of the fractions collected during PaaK purification using immobilized metal ion affini-
ty chromatography. The strain used in this purification procedure was E. coli BL21 (DE3) and the culture con-
ditions were optimized upon kinetic induction studies. MW, Molecular weight marker; 1, protein extract; 2, flow
through; 3, wash 1; 4, wash 2; 5, wash 3; 6, elution.
The first fraction (1) regards the protein extract, after sonication but before passing through the col-
umn. The second lane (2) corresponds to the protein-extract without any affinity to the support and
eluted at an imidazole concentration of 20 mM. Section 3 to 5, called “washing fractions”, include
those with an intermediate affinity, eluting at 50 mM of imidazole. The last lane (6), called “elution”
contains the proteins with the greater affinity for the support, eluting at 250 mM of imidazole.
From the analysis of lane 6, it was visible that 4 proteins are purified together: A, B, C and D.
Comparing the band thickness, the band labelled as C is bigger than the others and also shows a
molecular size close to the desired protein, which suggests it may be PaaK. All the marked bands (A,
41
B, C and D) were cut and analysed by mass spectrometry, and C revealed to be PaaK (see section
4.2.3 for more details). Therefore, PaaK eluted in the last fraction, as expected. It was possible to
quantify the protein concentration, as described at 3.5.5 section, using the Bradford method. The pro-
tein concentration corresponding to the purification process shown at Figure 4-6 was 0.27 mg/mL. A
really small concentration to proceed with the studies, thus it is required to optimize the method.
4.2.3 Identification of PaaK by LC-MS/MS
The four bands mentioned in the previous section were cropped from the acrylamide gel and sent
to Servicio de Biología Molecular del SAI-CAID (University of Murcia) to be analysed and to deter-
mine, by mass spectrometry, the protein’s peptide sequence. Data analysis was performed with the
software for Data Analysis LC/MSD Version 3.3 (Bruker Daltonik) and Spectrum Mill MS Proteomics
Workbench (Aligent). After comparison between the results obtained from this technique and the
known sequence of PaaK it was confirmed that the band C, indeed, corresponds to the protein of in-
terest. The identification of 2 more bands was also revealed (Table 4-3).
Table 4-2 – Identification of the proteins purified by IMAC. A, B, C and D correspond to the bands labelled on
Figure 4-6. N.I., not identified.
Band Protein Name Score Cover % Intensity
A Bifunctional polymyxin resistance protein ArnA 68.73 8 5.20x10⁵
B 60 kDa chaperonin 134.33 26 3.52x10⁵
C Phenylacetyl-coenzyme A ligase 185.83 41 8.70x10⁶
D N.I. - - -
The mass spectrum corresponding to each identified protein is available at Appendix II.
The fact that PaaK proves to be difficult to purify with reasonable concentrations and it is obtained
with more three different proteins indicates something. In this manner, it is important to understand the
biological and molecular function of the others proteins.
ArnA (band A) is a bi-functional enzyme that acts within a pathway that modifies lipid A phosphates
with 4-amino-4-deoxy-L-arabinose (L-Ara4N), which causes increased resistance to the antibiotic poly-
myxin and it is involved in lipopolysaccharide biosynthesis pathway, that is part of bacterial outside
membrane biogenesis [108], [109]. In the other hand, band B was identified as a chaperonin with 60
kDa, also known as GroEL-60. The main functions of this protein are to prevent misfolding and pro-
mote the refolding and proper assembly of unfolded polypeptides generated under stress conditions. It
is essential for the bacteria growth and the assembly of several bacteriophages. Also plays a role in
coupling between replication of the F plasmid and cell division [110]. The forth protein was not identi-
fied, because it showed a low score and cover when analysed by LC-MS/MS.
42
The method chosen to isolate the required recombinant protein from the cell lysate was immobi-
lized metal ion affinity chromatography, as already described. This method only required a single puri-
fication step, because the target protein was design to contain a polyhistidine sequence, which binds
to the chromatography column support. However, additional studies have demonstrated that peptides
with non-consecutive histidines are also capable of binding to immobilized divalent metal ions [111]. E.
coli, the bacteria being studied, has several host proteins that contain non-consecutive histidine resi-
dues exposed to the surface of their ternary structure. Such host proteins are usually co-purified dur-
ing IMAC procedures and are consequently indicated as contaminants. Both ArnA and GroEL-60 are
identified as common contaminants proteins [111]–[113]. What occurs is that most of the proteins con-
taminants are eluted only when the imidazole concentration is increased to a level that elutes the his-
tidine-tagged protein of interest. This is what was verified in PaaK purification. It is known that the
amount of host protein contaminants detected depends on the expression system used and the cul-
ture conditions employed. Moreover, the majority of E. coli protein contaminants are critical for cell
viability, especially under the stressed conditions caused by high-yield protein expression [111].
Thus, design E. coli knockout strains for those particular contaminants was not considered as a solu-
tion to avoid contamination. Optimize the culture conditions did not seem to be the correct approach,
because it was already tried and PaaK revealed to be highly sensitive to it. The possibilities could be
to overthink the whole overexpression and purification process or, once the vector pRSET-C+paaK
was already constructed, modify the expression system by changing the strain used. Thereby, the
strain BL21 (DE3) pLysS from E. coli was selected, because it is capable to suppress basal expres-
sion of toxic target proteins prior to induction, stabilizing the overexpression of recombinant proteins
that affect cell growth and viability [80].
4.2.4 Induction Kinetic of PaaK in E. coli BL21 (DE3) pLysS
As described in the previous sections, the overexpression and purification of PaaK in BL21 (DE3)
was not satisfactory due to protein instability and presence of contaminant proteins upon the purifica-
tion procedure. As a consequence, it was decided to realize the same experiments but using the strain
BL21 (DE3) pLysS. Similarly to what was done with BL21 (DE3), it was conducted different kinetic
induction experiments, which allows to understand the best way to grow the cells and overexpress the
protein. At Appendix III (Induction kinetic of PaaK in E. coli BL21 (DE3) pLysS section) are shown all
the different conditions studied with this strain and the corresponding SDS-PAGE gels. The decision to
study the change of the temperature once the culture is induced came from the studies realized with
BL21 (DE3). The temperature upon induction was kept the cooler possible due to protein instability.
The results permit to conclude that with this strain it is obtained a more noticeable overexpression.
It was established that with this strain the best conditions to overexpress PaaK are to start the
inoculum with an O.D.600 of 0.05 and incubate the culture at 37 °C. Induce it when the culture reaches
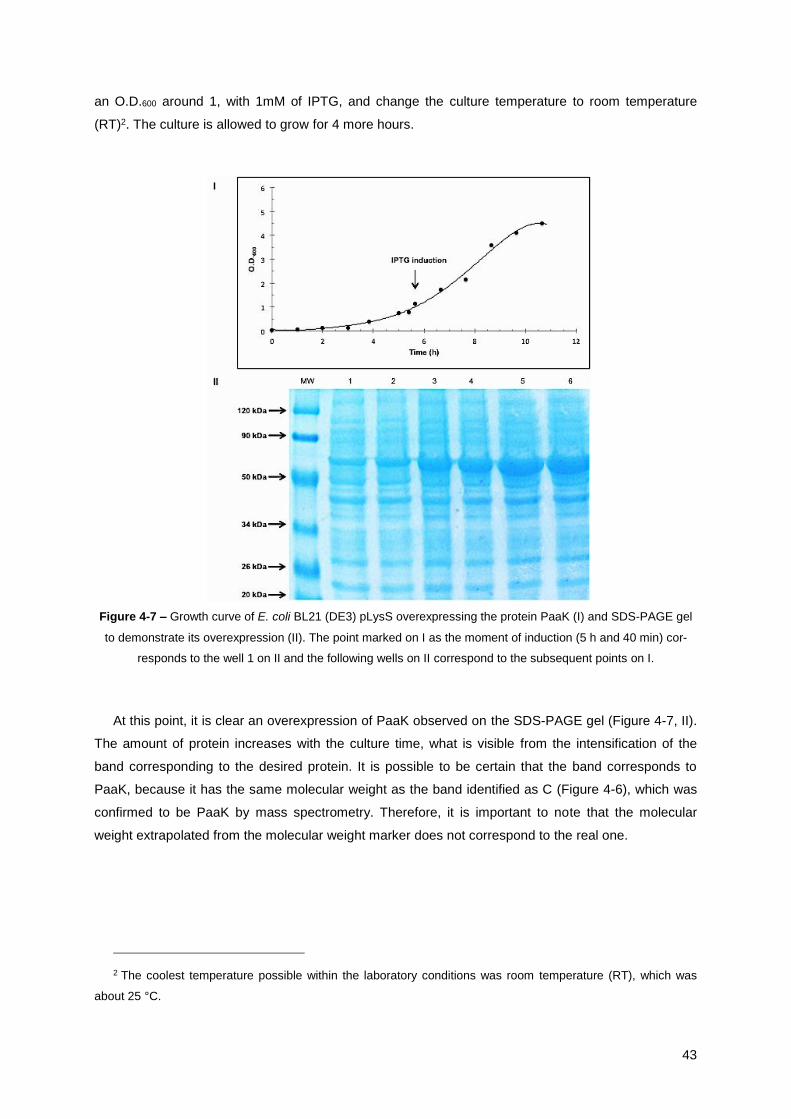
43
an O.D.600 around 1, with 1mM of IPTG, and change the culture temperature to room temperature
(RT)2. The culture is allowed to grow for 4 more hours.
Figure 4-7 – Growth curve of E. coli BL21 (DE3) pLysS overexpressing the protein PaaK (I) and SDS-PAGE gel
to demonstrate its overexpression (II). The point marked on I as the moment of induction (5 h and 40 min) cor-
responds to the well 1 on II and the following wells on II correspond to the subsequent points on I.
At this point, it is clear an overexpression of PaaK observed on the SDS-PAGE gel (Figure 4-7, II).
The amount of protein increases with the culture time, what is visible from the intensification of the
band corresponding to the desired protein. It is possible to be certain that the band corresponds to
PaaK, because it has the same molecular weight as the band identified as C (Figure 4-6), which was
confirmed to be PaaK by mass spectrometry. Therefore, it is important to note that the molecular
weight extrapolated from the molecular weight marker does not correspond to the real one.
2 The coolest temperature possible within the laboratory conditions was room temperature (RT), which was
about 25 °C.

44
4.2.5 Purification of PaaK in E. coli BL21 (DE3) pLysS
With the optimum conditions to purify PaaK from E. coli BL21 (DE3) pLysS established, the proce-
dure to purify the protein was executed as described in the section 3.5.3 and similarly to what was
made with the previous strain.
Figure 4-8 – SDS-PAGE gel of the fractions collected during PaaK purification using immobilized metal ion affini-
ty chromatography. The strain used in this purification procedure was E. coli BL21 (DE3) pLysS and the culture
conditions were optimized upon kinetic induction studies. MW, Molecular weight marker; 1, protein extract; 2, flow
through; 3, wash 1; 4, wash 2; 5, wash 3; 6, elution.
The first observation that needs to be made it is that in the purification gel using E. coli BL21 (DE3)
pLysS (Figure 4-8) it is not possible to visualize the contaminant proteins identified previously in the
elution fraction (section 4.2.3). Moreover, PaaK is the only protein identifiable in the last fraction (6).
Consequently, the concentration of PaaK was measured. To the specific purification step pre-
sented at Figure 4-8, it was obtained a concentration of 0.067 mg/mL, even less that the concentra-
tions obtained with the purification from E. coli BL21 (DE3). In this case, it is visible a small loss of the
protein of interest in wash fractions, particularly at 3, but it was not too significant. In addition, the ki-
netic induction studies with this strain proved a strong overexpression of PaaK, more accentuated
than with E. coli BL21 (DE3). Thus, it must be considered the hypothesis that the protein of interest
was being lost. To analyse it, from the same culture that allowed to perform the purification described
at Figure 4-8, it was taken samples from the steps previous to IMAC purification.
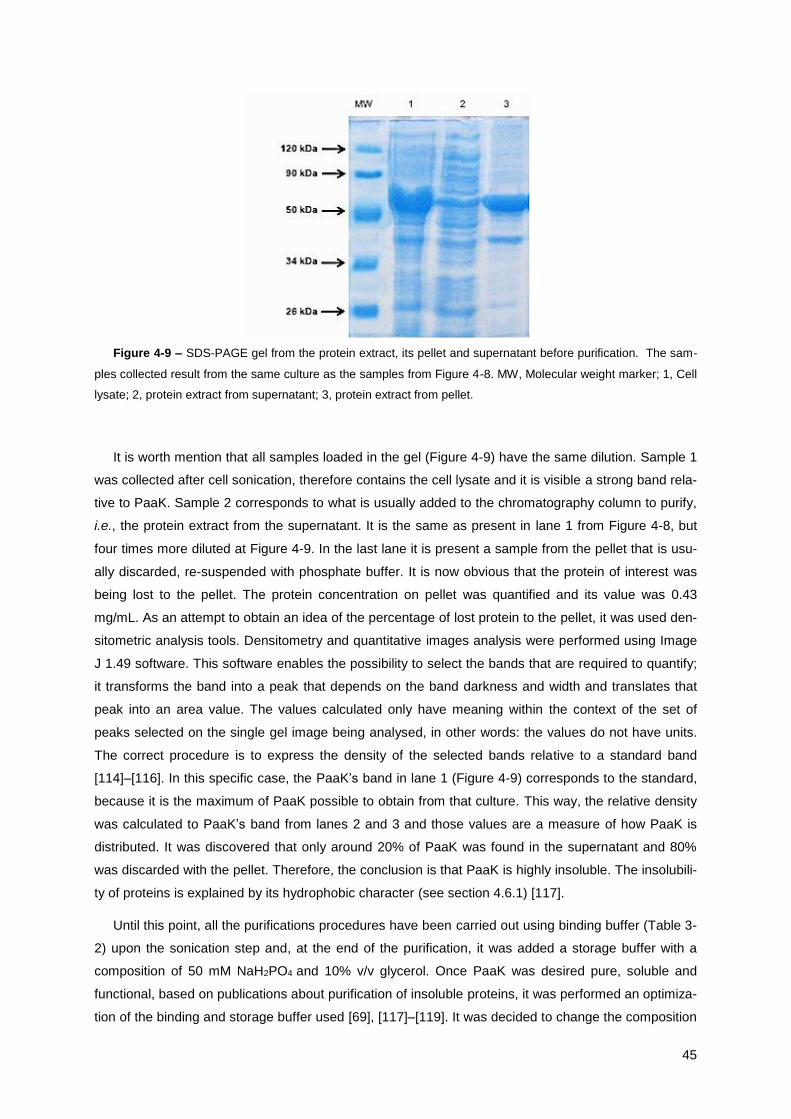
45
Figure 4-9 – SDS-PAGE gel from the protein extract, its pellet and supernatant before purification. The sam-
ples collected result from the same culture as the samples from Figure 4-8. MW, Molecular weight marker; 1, Cell
lysate; 2, protein extract from supernatant; 3, protein extract from pellet.
It is worth mention that all samples loaded in the gel (Figure 4-9) have the same dilution. Sample 1
was collected after cell sonication, therefore contains the cell lysate and it is visible a strong band rela-
tive to PaaK. Sample 2 corresponds to what is usually added to the chromatography column to purify,
i.e., the protein extract from the supernatant. It is the same as present in lane 1 from Figure 4-8, but
four times more diluted at Figure 4-9. In the last lane it is present a sample from the pellet that is usu-
ally discarded, re-suspended with phosphate buffer. It is now obvious that the protein of interest was
being lost to the pellet. The protein concentration on pellet was quantified and its value was 0.43
mg/mL. As an attempt to obtain an idea of the percentage of lost protein to the pellet, it was used den-
sitometric analysis tools. Densitometry and quantitative images analysis were performed using Image
J 1.49 software. This software enables the possibility to select the bands that are required to quantify;
it transforms the band into a peak that depends on the band darkness and width and translates that
peak into an area value. The values calculated only have meaning within the context of the set of
peaks selected on the single gel image being analysed, in other words: the values do not have units.
The correct procedure is to express the density of the selected bands relative to a standard band
[114]–[116]. In this specific case, the PaaK’s band in lane 1 (Figure 4-9) corresponds to the standard,
because it is the maximum of PaaK possible to obtain from that culture. This way, the relative density
was calculated to PaaK’s band from lanes 2 and 3 and those values are a measure of how PaaK is
distributed. It was discovered that only around 20% of PaaK was found in the supernatant and 80%
was discarded with the pellet. Therefore, the conclusion is that PaaK is highly insoluble. The insolubili-
ty of proteins is explained by its hydrophobic character (see section 4.6.1) [117].
Until this point, all the purifications procedures have been carried out using binding buffer (Table 3-
2) upon the sonication step and, at the end of the purification, it was added a storage buffer with a
composition of 50 mM NaH2PO4 and 10% v/v glycerol. Once PaaK was desired pure, soluble and
functional, based on publications about purification of insoluble proteins, it was performed an optimiza-
tion of the binding and storage buffer used [69], [117]–[119]. It was decided to change the composition

46
of the storage buffer to 50 mM NaH2PO4, 200 mM NaCl; 20% v/v glycerol and 5 mM PA, as described
at Table 3-2. Also, at the beginning of the purification procedure, when the binding buffer is used, it is
now added 20% v/v glycerol and 5 mM PA to it. The addition of a co-solvent (such as glycerol), salt
(for example, NaCl) and the presence of the enzyme substrate (for PaaK it is PA) is described to im-
prove the stability of proteins in aqueous solution [120]–[123]. With these conditions, a last purification
was conducted.
Figure 4-10 – SDS-PAGE gel of the fractions collected during PaaK purification using immobilized metal ion
affinity chromatography. The strain used in his purification procedure was E. coli BL21 (DE3) pLysS. MW, Mo-
lecular weight marker; 1, protein extract; 2, flow through; 3, wash_1; 4, wash_2; 5, wash_3; 6, elution.
On the Figure 4-10 it is noticeable a strong band correspondent to PaaK purified from the culture
supernatant (lane 6). Taking into account that the sample at lane 6 is twice concentrated compara-
tively to the protein extract (lane 1), it was used the same software used to quantify the relative density
between bands from the Figure 4-9. From this method, it was reached that the relative density from
the band at 6 is around 70%. This means that 70% of the PaaK present at the protein extract is now
soluble and, probably, 30% was lost in the pellet. This implies that the addition of glycerol and sub-
strate (PA) from the beginning of the purification and the change of the storage buffer was enough to
cause a variation between 80% of PaaK that was being lost with the pellet (Figure 4-9) to only 30%,
what is a huge improvement. However, once purified the problem was that PaaK begins to aggregate,
resulting in protein precipitation.
This phenomenon of protein aggregation could result in the formation of inclusion bodies (IB),
which is considered a pathway alternative to protein folding where intermolecular, rather than intramo-
lecular, interactions are favoured. The molecular basis of protein aggregation is protein misfolding,
where a specific polypeptide chain loses or is unable to reach its native, closely packed three-
dimensional structure protein [124]. At this point, it is possible to recognize essentially two different
ways to follow: try to optimize the purification process, by adjusting the binding and storage buffer, in
such a way that the majority of the desired protein becomes soluble, without forming inclusion bodies.
Or, in the other hand, design and optimize a technique to purify the protein from the inclusion bodies.
To perform the first option is required to understand how the protein interacts with salts, glycerol and

47
with its own substrate; it is important to study the protein hydrophobic domains. Different studies sug-
gest another alternatives, as proceed to protein cultures and purifications around 20 °C or co-express
the desired protein with molecular chaperones [117], [119], [123], [125], [126]. The purification of the
desired protein from IB is a possibility and there are published studies with practical considerations
about purification and refolding of proteins from inclusion bodies [118], [125], [127]–[129]. Both of the
processes would require time and their optimization is an empirical process, once there is not a specif-
ic solution. Hereupon, PaaK was already purified; the different concentrations obtained are not the
desired but could allow to study the possible acetylation points, which is the main focus of this work.
The decision was to study the stability and activity of PaaK purified under the different conditions men-
tioned and proceed with acetylation studies.
4.2.6 Purification of PaaY in E. coli BL21 (DE3)
The procedure to obtain PaaY purified was already aimed of study in the department where this
work was conducted. The protein is known to show instability, but its purification process is simpler
than what was described to PaaK. To purify PaaY was followed the procedure described at section
3.5.4. To verify if an overexpression is achieved was made an induction kinetics study to follow the
culture growth.
Figure 4-11 – SDS-PAGE gel to demonstrate overexpression of PaaY (I). It was used the strain E. coli BL21
(DE3) as host to the vector pRSET-C+paaY. SDS-PAGE gel of the fractions collected during PaaY purification
using immobilized metal ion affinity chromatography (II). I: MW, Molecular weight marker; 1, culture sample col-
lected upon induction with IPTG; 2, culture sample taken 1 h after induction; 3, culture sample taken 2 h after
induction; 4, culture sample taken 3 h after induction; 5, culture sample taken 4 h after induction. II: MW, Molecu-
lar weight marker; 6, protein extract; 7, flow through; 8, wash_1; 9, wash_2; 10, wash_3; 11, elution.
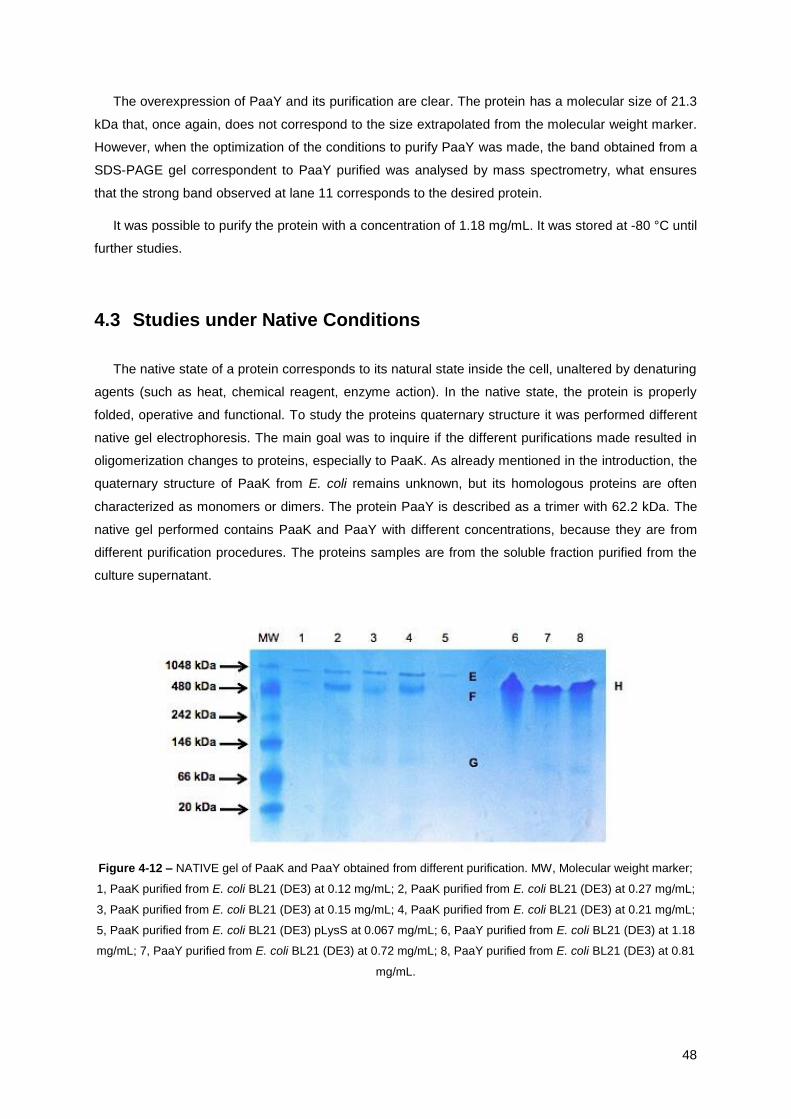
48
The overexpression of PaaY and its purification are clear. The protein has a molecular size of 21.3
kDa that, once again, does not correspond to the size extrapolated from the molecular weight marker.
However, when the optimization of the conditions to purify PaaY was made, the band obtained from a
SDS-PAGE gel correspondent to PaaY purified was analysed by mass spectrometry, what ensures
that the strong band observed at lane 11 corresponds to the desired protein.
It was possible to purify the protein with a concentration of 1.18 mg/mL. It was stored at -80 °C until
further studies.
4.3 Studies under Native Conditions
The native state of a protein corresponds to its natural state inside the cell, unaltered by denaturing
agents (such as heat, chemical reagent, enzyme action). In the native state, the protein is properly
folded, operative and functional. To study the proteins quaternary structure it was performed different
native gel electrophoresis. The main goal was to inquire if the different purifications made resulted in
oligomerization changes to proteins, especially to PaaK. As already mentioned in the introduction, the
quaternary structure of PaaK from E. coli remains unknown, but its homologous proteins are often
characterized as monomers or dimers. The protein PaaY is described as a trimer with 62.2 kDa. The
native gel performed contains PaaK and PaaY with different concentrations, because they are from
different purification procedures. The proteins samples are from the soluble fraction purified from the
culture supernatant.
Figure 4-12 – NATIVE gel of PaaK and PaaY obtained from different purification. MW, Molecular weight marker;
1, PaaK purified from E. coli BL21 (DE3) at 0.12 mg/mL; 2, PaaK purified from E. coli BL21 (DE3) at 0.27 mg/mL;
3, PaaK purified from E. coli BL21 (DE3) at 0.15 mg/mL; 4, PaaK purified from E. coli BL21 (DE3) at 0.21 mg/mL;
5, PaaK purified from E. coli BL21 (DE3) pLysS at 0.067 mg/mL; 6, PaaY purified from E. coli BL21 (DE3) at 1.18
mg/mL; 7, PaaY purified from E. coli BL21 (DE3) at 0.72 mg/mL; 8, PaaY purified from E. coli BL21 (DE3) at 0.81
mg/mL.
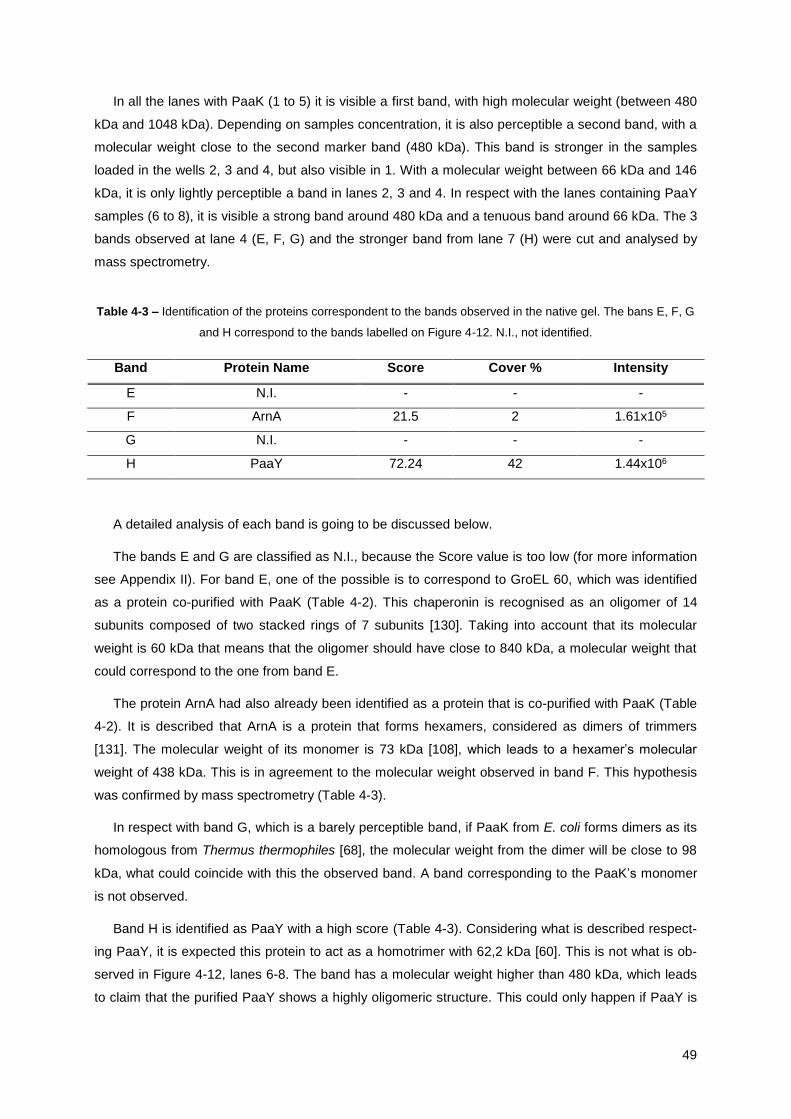
49
In all the lanes with PaaK (1 to 5) it is visible a first band, with high molecular weight (between 480
kDa and 1048 kDa). Depending on samples concentration, it is also perceptible a second band, with a
molecular weight close to the second marker band (480 kDa). This band is stronger in the samples
loaded in the wells 2, 3 and 4, but also visible in 1. With a molecular weight between 66 kDa and 146
kDa, it is only lightly perceptible a band in lanes 2, 3 and 4. In respect with the lanes containing PaaY
samples (6 to 8), it is visible a strong band around 480 kDa and a tenuous band around 66 kDa. The 3
bands observed at lane 4 (E, F, G) and the stronger band from lane 7 (H) were cut and analysed by
mass spectrometry.
Table 4-3 – Identification of the proteins correspondent to the bands observed in the native gel. The bans E, F, G
and H correspond to the bands labelled on Figure 4-12. N.I., not identified.
Band Protein Name Score Cover % Intensity
E N.I. - - -
F ArnA 21.5 2 1.61x10⁵
G N.I. - - -
H PaaY 72.24 42 1.44x10⁶
A detailed analysis of each band is going to be discussed below.
The bands E and G are classified as N.I., because the Score value is too low (for more information
see Appendix II). For band E, one of the possible is to correspond to GroEL 60, which was identified
as a protein co-purified with PaaK (Table 4-2). This chaperonin is recognised as an oligomer of 14
subunits composed of two stacked rings of 7 subunits [130]. Taking into account that its molecular
weight is 60 kDa that means that the oligomer should have close to 840 kDa, a molecular weight that
could correspond to the one from band E.
The protein ArnA had also already been identified as a protein that is co-purified with PaaK (Table
4-2). It is described that ArnA is a protein that forms hexamers, considered as dimers of trimmers
[131]. The molecular weight of its monomer is 73 kDa [108], which leads to a hexamer’s molecular
weight of 438 kDa. This is in agreement to the molecular weight observed in band F. This hypothesis
was confirmed by mass spectrometry (Table 4-3).
In respect with band G, which is a barely perceptible band, if PaaK from E. coli forms dimers as its
homologous from Thermus thermophiles [68], the molecular weight from the dimer will be close to 98
kDa, what could coincide with this the observed band. A band corresponding to the PaaK’s monomer
is not observed.
Band H is identified as PaaY with a high score (Table 4-3). Considering what is described respect-
ing PaaY, it is expected this protein to act as a homotrimer with 62,2 kDa [60]. This is not what is ob-
served in Figure 4-12, lanes 6-8. The band has a molecular weight higher than 480 kDa, which leads
to claim that the purified PaaY shows a highly oligomeric structure. This could only happen if PaaY is

50
aggregated with itself, probably because of its hydrophobicity (see section 4.6.2). The formation of this
highly oligomeric structure should be verified by other techniques, such as analytical ultracentrifuga-
tion or size-exclusion chromatography. As already mentioned, there is a possibility that a band present
at lanes 7 and 8, around 66 kDa, could correspond to a trimer conformation of PaaY, but the result
was not confirmed.
Samples from the same purification as the samples in lane 4 and 7 (Figure 4-12) were selected
and a SDS-PAGE gel electrophoresis was performed to verify if the result obtained was the same as
that observed in the purification step, i.e., the only proteins present at lane 4 are the ones identified as
A, B, C and D (Table 4-2) and from lane 7 it is only possible to obtain PaaY.
Figure 4-13 – SDS-PAGE gel to identify the proteins purified with PaaK and PaaY. MW, Molecular weight
marker; 1, PaaK purified from E. coli BL21 (DE3) at 0.21 mg/mL; 2, PaaY purified from E. coli BL21 (DE3) at
0.72 mg/mL.
To be sure that the proteins present in the native gel from Figure 4-12 could only be the same as
previous identified, the four bands observed at lane 1 and the one at lane 2 (Figure 4-13) were cut and
analysed by mass spectrometry. As expected, the first 3 bands correspond to A, B and C, respectively
(Table 4-2). The fourth band, already labelled as D had not been possible to identify previously, but
this time the values obtained by the technique are safe enough to assume that D is FKBP-type pep-
tidyl-prolyl cis-trans isomerase.
Table 4-4 – Identification of protein correspondent to band D (Figure 4-6).
Band Protein Name Score Cover % Intensity
D FKBP-type peptidyl-prolyl cis-trans isomerase 14.87 4 1.6x10⁵

51
Some proteins from the family (FKBP) are also identified as common protein contaminants after
purification by IMAC [112].
Thereby, it is confirmed that from PaaK purifications it can only be possible to detect four proteins:
ArnA, GroEL 60, PaaK and FKBP-type peptidyl-prolyl cis-trans isomerase. Taking into account that all
the samples loaded at lanes 1 to 5 from Figure 4-12 are from different purifications, but all show a
similar behaviour in a native gel, it means that when together these proteins always behave the same
way. It is important to consider a possible existence of a connection between some of the proteins,
because the native gel (Figure 4-12) only allows the identification of three distinct bands and it is prov-
en the existence of four different proteins. Another hypothesis is that the protein concentration is not
enough to tolerate a clear identification of the bands.
As expected, the band from lane 2 (Figure 4-13) was identified as PaaY.
The principal conclusions that can be taken from this section are that PaaK is not clearly identified
in the native gel; PaaK is purified with ArnA, GroEL 60 and FKBP-type peptidyl-prolyl cis-trans iso-
merase and that PaaY shows a highly oligomeric conformation. As mentioned, to understand the qua-
ternary structure of the different proteins observed in the native gel (Figure 4-12), further studies are
required.
4.4 Activity Assays
At this point, PaaK and PaaY were purified and it was studied their native conformation. However,
there was not a clue if the proteins were active. Therefore, it was required to measure protein activity.
The assay applied to PaaK was described at section 3.5.8 and it is frequently used by the department
were this work was conducted to measure the acetyltransferase activity in other enzymes. Once the
technique is optimized to similar procedures, it was found to be the most suitable way to determine
PaaK activity. Nevertheless, to PaaY it was not settled a procedure that allows to determine its activi-
ty, neither was it considered a priority to do so. First because it would be time consuming and second
because its purification did not show as many problems as PaaK. Even knowing that it is not a justifi-
cation to obtain PaaY active, were not spent resources to obtain its activity.
When PaaK activity was measured, once it was observed at section 4.2.5 that PaaK tends to pre-
cipitate, it was decided to determine the activity from its supernatant and pellet, separately. The assay
was conducted with the PaaK from the purification procedure shown at Figure 4-8. The protein from
the supernatant and from the pellet was studied at a protein concentration range between 50 nM and
500 nM. It was found that PaaK purified from the culture supernatant, at the conditions of the purifica-
tion shown at Figure 4-8, does not show activity in a concentration range between 50 nM and 500 nM.
On the other hand, for the PaaK present in the pellet it was possible to obtain its specific activity. This
activity was defined as the amount of product or substrate per milligram of total protein and time (ex-
pressed in mmol min−1mg−1) and it is characteristic of an enzyme in particular conditions. Consequent-
ly, to PaaK purified from the culture pellet under the conditions described at section 4.2.5, its specific

52
activity was 270.33 ± 5.23 mmol min−1mg−1. It was also possible to determine the enzyme deactivation
after 24 hours: the enzyme activity was measured 24 hours after the first assay and the values were
compared. Between both measures, the protein was stored at 4 °C. It was obtained that, in 24 h, the
percentage of enzyme deactivation was 39.9 %. Also, it was clearly observed that past 24 h, the pro-
tein from the pellet that had been solubilized was precipitated.
It is evident that PaaK is extremely unstable and sensitive. Not only the protein with enzymatic ac-
tivity tends to aggregate and precipitate, but it also losses its activity quickly.
Even thought it was not determined protein activity to PaaK purified from the supernatant, in the
next section it will be observed the identification of acetylated lysines from the protein purified from
culture’s supernatant. It could mean that, in fact, both enzymes are purified with enzymatic activity
from the supernatant and the technique described to determine PaaK activity required further optimi-
zation.
4.5 Acetylation Studies of PaaK and PaaY
4.5.1 Identification of Acetylated Lysine by Western Blot
In order to study the acetylation level and mechanism (enzymatic and/or chemical acetylation) of
PaaK and PaaY an assay using western blot analysis of both proteins was performed under different
acetylation conditions. The reactions and its identification are described in section 3.6.1 (see Table
3-10). To understand the level of acetylation that the protein has when purified, it was exanimated
samples of the protein alone, without the addiction of any reagent (reactions 1 and 7). To study a pos-
sible chemical acetylation were prepared reactions with each of the proteins, separately, and acetyl-
CoA or acetyl-P (reactions 2, 3, 8 and 9). It was also carried out reactions with acetyl-CoA 1 mM in the
presence of 60 nM of the acetyltransferase PatZ, to study a possible enzymatic acetylation of PaaK or
PaaY (reactions 6 and 10). It was not tested the enzymatic acetylation of PaaK and PaaY by PatZ in
the presence of acetyl-P, because the only known acetyl group donor used by acetyltransferases is
acetyl-CoA [38]. To test the possibility described in the introduction (section 1.5), that probably PaaY
acts as an acetyltransferase under PaaK [61], reactions where PaaY had a concentration of 60 nM in
the presence of PaaK and acetyl-CoA or acetyl-P were prepared (reactions 4 and 5).
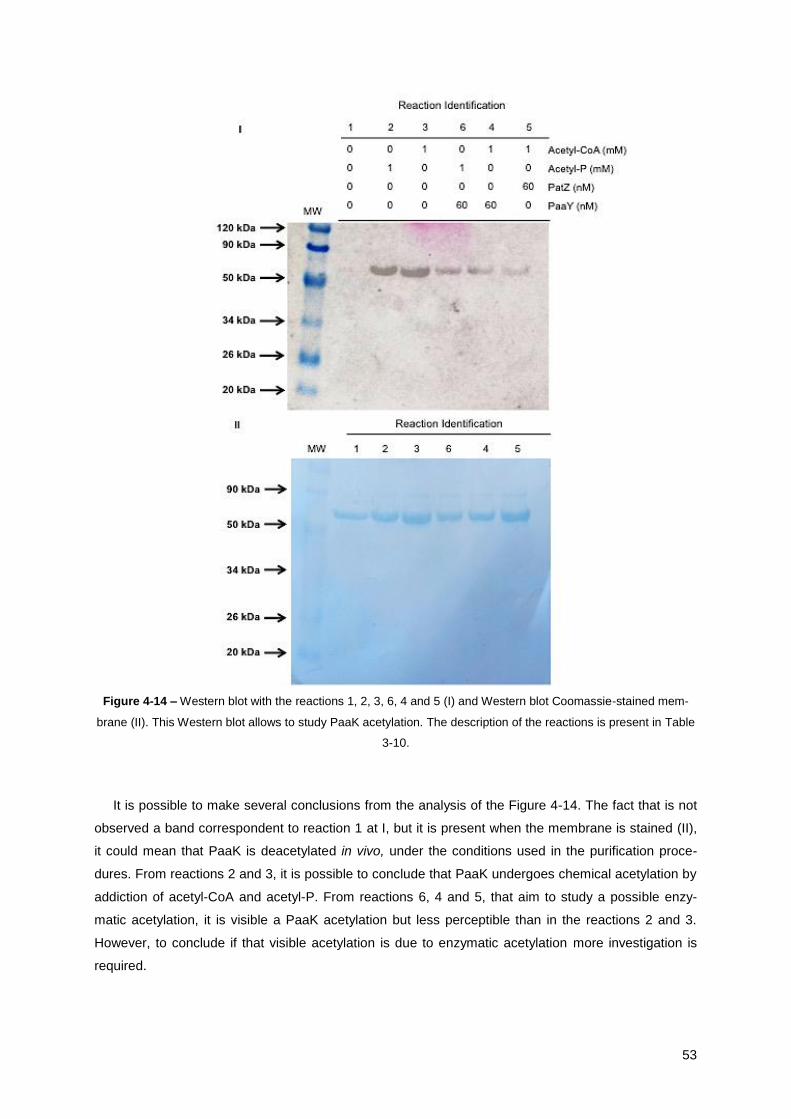
53
Figure 4-14 – Western blot with the reactions 1, 2, 3, 6, 4 and 5 (I) and Western blot Coomassie-stained mem-
brane (II). This Western blot allows to study PaaK acetylation. The description of the reactions is present in Table
3-10.
It is possible to make several conclusions from the analysis of the Figure 4-14. The fact that is not
observed a band correspondent to reaction 1 at I, but it is present when the membrane is stained (II),
it could mean that PaaK is deacetylated in vivo, under the conditions used in the purification proce-
dures. From reactions 2 and 3, it is possible to conclude that PaaK undergoes chemical acetylation by
addiction of acetyl-CoA and acetyl-P. From reactions 6, 4 and 5, that aim to study a possible enzy-
matic acetylation, it is visible a PaaK acetylation but less perceptible than in the reactions 2 and 3.
However, to conclude if that visible acetylation is due to enzymatic acetylation more investigation is
required.
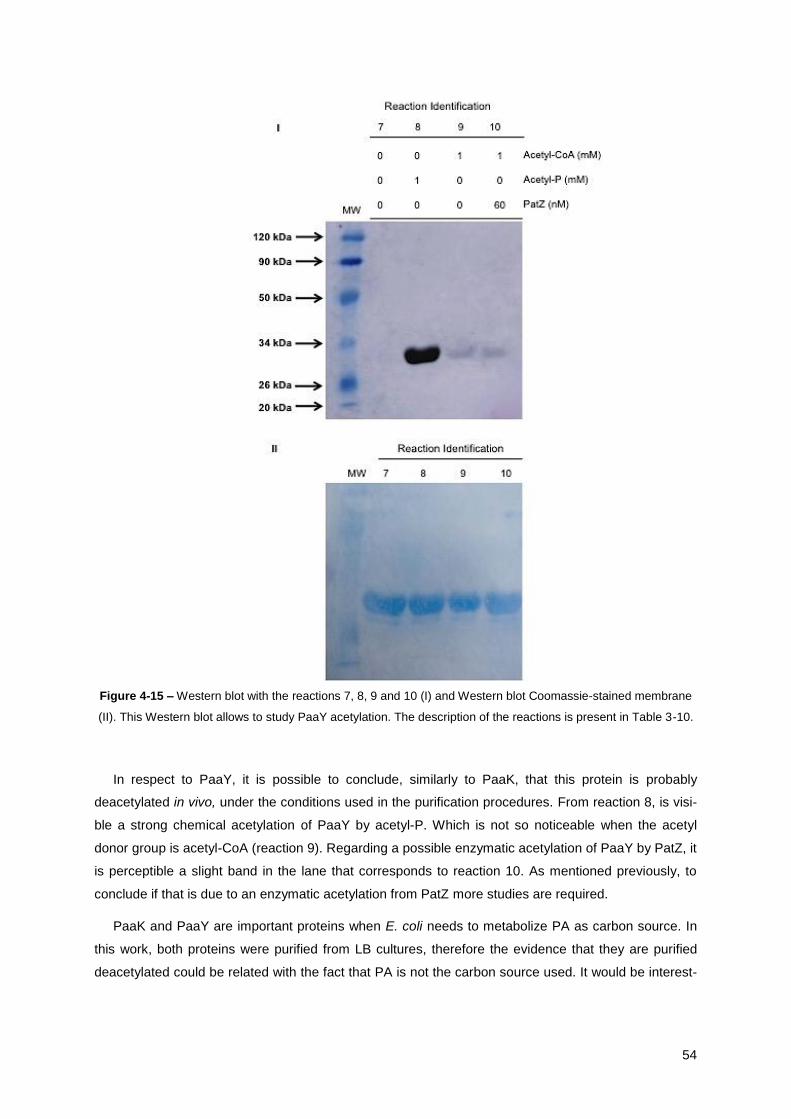
54
Figure 4-15 – Western blot with the reactions 7, 8, 9 and 10 (I) and Western blot Coomassie-stained membrane
(II). This Western blot allows to study PaaY acetylation. The description of the reactions is present in Table 3-10.
In respect to PaaY, it is possible to conclude, similarly to PaaK, that this protein is probably
deacetylated in vivo, under the conditions used in the purification procedures. From reaction 8, is visi-
ble a strong chemical acetylation of PaaY by acetyl-P. Which is not so noticeable when the acetyl
donor group is acetyl-CoA (reaction 9). Regarding a possible enzymatic acetylation of PaaY by PatZ, it
is perceptible a slight band in the lane that corresponds to reaction 10. As mentioned previously, to
conclude if that is due to an enzymatic acetylation from PatZ more studies are required.
PaaK and PaaY are important proteins when E. coli needs to metabolize PA as carbon source. In
this work, both proteins were purified from LB cultures, therefore the evidence that they are purified
deacetylated could be related with the fact that PA is not the carbon source used. It would be interest-

55
ing to purify those proteins from a culture using PA as carbon source. However, the BL21 E. coli
strains could not be used, because the paa operon is not present on its genome [132].
4.5.2 Identification of Acetylated Lysines by LC-MS
Lysine acetylation study by Western blot technique shows some limitations regarding the difficulty
in measuring the proportion of lysine residues that are acetylated and identifying any specificity. In
order to overcome those limitations, the reactions used to obtain the Western blots from Figures 4-14
and 4-15 were analysed by mass spectrometry.
Table 4-5 – Acetylated lysines identification, in respect with PaaK and PaaY reactions, by mass spectrometry.
N.I., not identified.
Reaction Identification Acetylated lysine number
1 N.I.
2 N.I.
3 N.I.
4 424
5 N.I.
6 N.I.
7 153
8 N.I.
9 139
10 33, 53, 122, 139, 153
From the reactions 1 to 6, which regards to PaaK acetylation, it was only possible to identify within
the limits of Score and SPI (see Table II-1, Appendix II) one lysine that suffers acetylation. The reac-
tion 4 corresponds to PaaK in the presence of PaaY and Ac-CoA, where is expected PaaY to act as
acetyltransferase. As a matter of fact, the identification of Lys-424 as being acetylated in reaction 4 is
an evidence that PaaY could act as an acetyltransferase. Moreover, Lys-424 was identified as the
lysine from PaaK homologous to the lysine in Acs that PatZ shows specificity. The fact that others
acetylated lysines were not identified does not mean that it does not happen. Once the concentration
of PaaK was low, to improve the results it is required to obtain PaaK with a higher concentration.
Therefore, the identification of acetylated lysines from PaaK requires to be the target of further studies.
The identification of acetylated lysines in PaaY allowed to obtain more satisfactory results. It was
identified that PaaY is purified with the lysine 153 acetylated. Thus, even if not identified, it is expected
to find Lys-153 acetylated in all the others reactions of PaaY. Regarding chemical acetylation, it was
possible to detect that lysine 139 is acetylated in the presence of acetyl-CoA as acetyl group donor.
This is not in the agreement with the observed at Figure 4-15, where the band correspondent to lysine
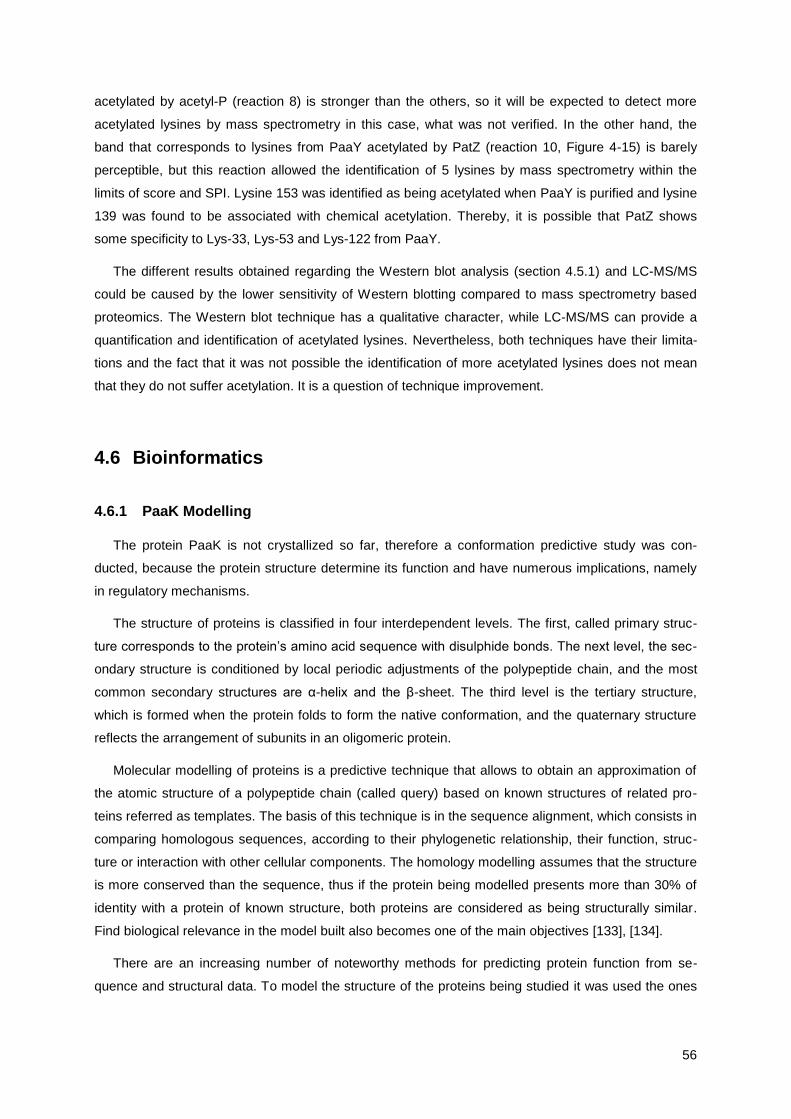
56
acetylated by acetyl-P (reaction 8) is stronger than the others, so it will be expected to detect more
acetylated lysines by mass spectrometry in this case, what was not verified. In the other hand, the
band that corresponds to lysines from PaaY acetylated by PatZ (reaction 10, Figure 4-15) is barely
perceptible, but this reaction allowed the identification of 5 lysines by mass spectrometry within the
limits of score and SPI. Lysine 153 was identified as being acetylated when PaaY is purified and lysine
139 was found to be associated with chemical acetylation. Thereby, it is possible that PatZ shows
some specificity to Lys-33, Lys-53 and Lys-122 from PaaY.
The different results obtained regarding the Western blot analysis (section 4.5.1) and LC-MS/MS
could be caused by the lower sensitivity of Western blotting compared to mass spectrometry based
proteomics. The Western blot technique has a qualitative character, while LC-MS/MS can provide a
quantification and identification of acetylated lysines. Nevertheless, both techniques have their limita-
tions and the fact that it was not possible the identification of more acetylated lysines does not mean
that they do not suffer acetylation. It is a question of technique improvement.
4.6 Bioinformatics
4.6.1 PaaK Modelling
The protein PaaK is not crystallized so far, therefore a conformation predictive study was con-
ducted, because the protein structure determine its function and have numerous implications, namely
in regulatory mechanisms.
The structure of proteins is classified in four interdependent levels. The first, called primary struc-
ture corresponds to the protein’s amino acid sequence with disulphide bonds. The next level, the sec-
ondary structure is conditioned by local periodic adjustments of the polypeptide chain, and the most
common secondary structures are α-helix and the β-sheet. The third level is the tertiary structure,
which is formed when the protein folds to form the native conformation, and the quaternary structure
reflects the arrangement of subunits in an oligomeric protein.
Molecular modelling of proteins is a predictive technique that allows to obtain an approximation of
the atomic structure of a polypeptide chain (called query) based on known structures of related pro-
teins referred as templates. The basis of this technique is in the sequence alignment, which consists in
comparing homologous sequences, according to their phylogenetic relationship, their function, struc-
ture or interaction with other cellular components. The homology modelling assumes that the structure
is more conserved than the sequence, thus if the protein being modelled presents more than 30% of
identity with a protein of known structure, both proteins are considered as being structurally similar.
Find biological relevance in the model built also becomes one of the main objectives [133], [134].
There are an increasing number of noteworthy methods for predicting protein function from se-
quence and structural data. To model the structure of the proteins being studied it was used the ones
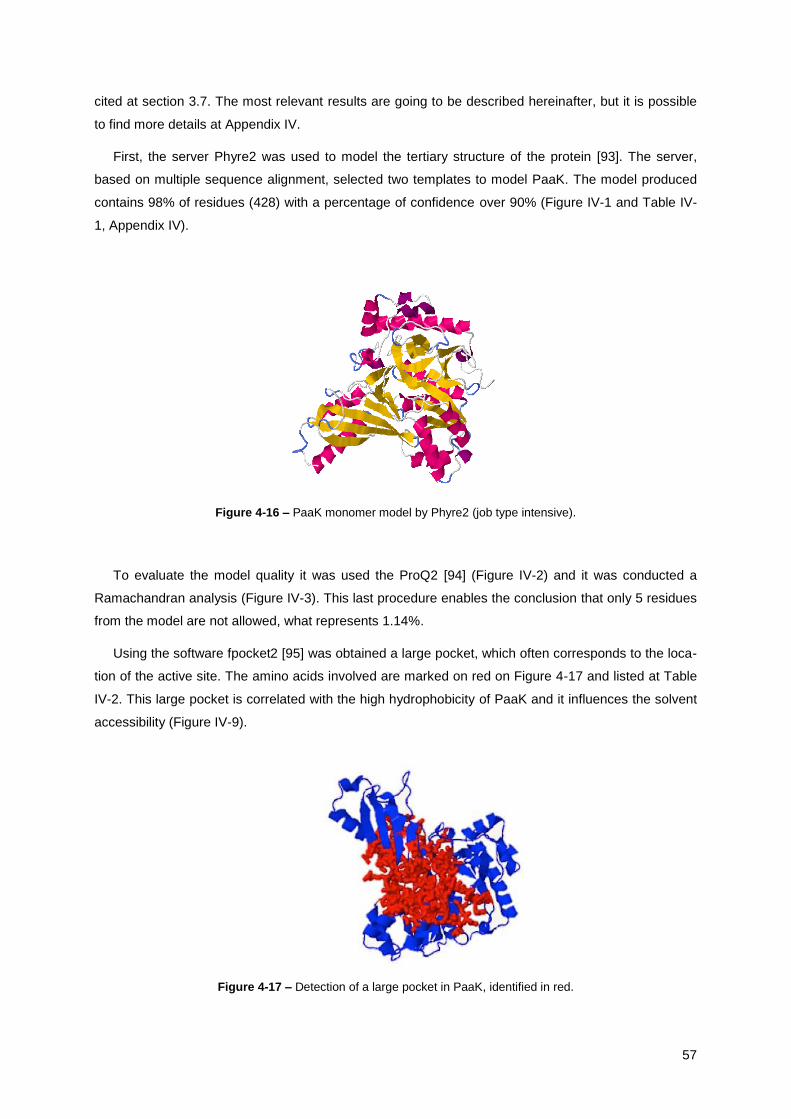
57
cited at section 3.7. The most relevant results are going to be described hereinafter, but it is possible
to find more details at Appendix IV.
First, the server Phyre2 was used to model the tertiary structure of the protein [93]. The server,
based on multiple sequence alignment, selected two templates to model PaaK. The model produced
contains 98% of residues (428) with a percentage of confidence over 90% (Figure IV-1 and Table IV-
1, Appendix IV).
Figure 4-16 – PaaK monomer model by Phyre2 (job type intensive).
To evaluate the model quality it was used the ProQ2 [94] (Figure IV-2) and it was conducted a
Ramachandran analysis (Figure IV-3). This last procedure enables the conclusion that only 5 residues
from the model are not allowed, what represents 1.14%.
Using the software fpocket2 [95] was obtained a large pocket, which often corresponds to the loca-
tion of the active site. The amino acids involved are marked on red on Figure 4-17 and listed at Table
IV-2. This large pocket is correlated with the high hydrophobicity of PaaK and it influences the solvent
accessibility (Figure IV-9).
Figure 4-17 – Detection of a large pocket in PaaK, identified in red.

58
With a server of conserved domains [97] it was determined that the sequence of PaaK has a con-
served domain and a domain that can be considered a multidomain and it belongs to the superfamily
Class I (Figure IV-4). The first domain is called Phenylacetate-CoA ligase (also known as PaaK) and
the second one is the Phenylacetate-coenzyme A ligase domain. More details are discussed at Ap-
pendix IV.
As already described, PaaK homologous to E. coli are monomers in Azoarcus evansii, Pseudomo-
nas sp. KB 740 and Pseudomonas putida, and a dimer in Thermus thermophilus. Once the three di-
mensional structure of PaaK monomer was studied, the next step was to use the server ClusPro2 [98]
to model the dimer (Figure 4-18). PaaK was modelled as a dimer because of the result obtained at
section 4.3.
From all the dimeric structures modelled, it was selected the one that showed lower Gibbs energy
(-1706.2 kJ/mol), which is the most probable conformation. The ligation between the two subunits is
made by hydrophobic interactions.
Figure 4-18 – PaaK dimer modelled by ClusPro2. The different colours specify different monomers.
Similarly to what was made with the monomer, the next step is the validation of the model. To as-
sess the reliability of the dimer model it could be used the server PROSA-Web [135], however it did
not have supported the PaaK dimer. To confirm the results was obtained a Ramachandran diagram,
with the server Procheck [102]. This diagram (Figure IV-10) shows a structure with acceptable disper-
sion values of the torsion angles from the peptide bonds. Therefore, it can be concluded that the mod-
el built is a reliably predictive model for PaaK dimer.
4.6.2 PaaY Modelling
The protein PaaY, similarly to PaaK, is not crystalized yet. Therefore, the use of bioinformatics
tools represents an enormous advantage in order to study its 3D structure and using the same tech-
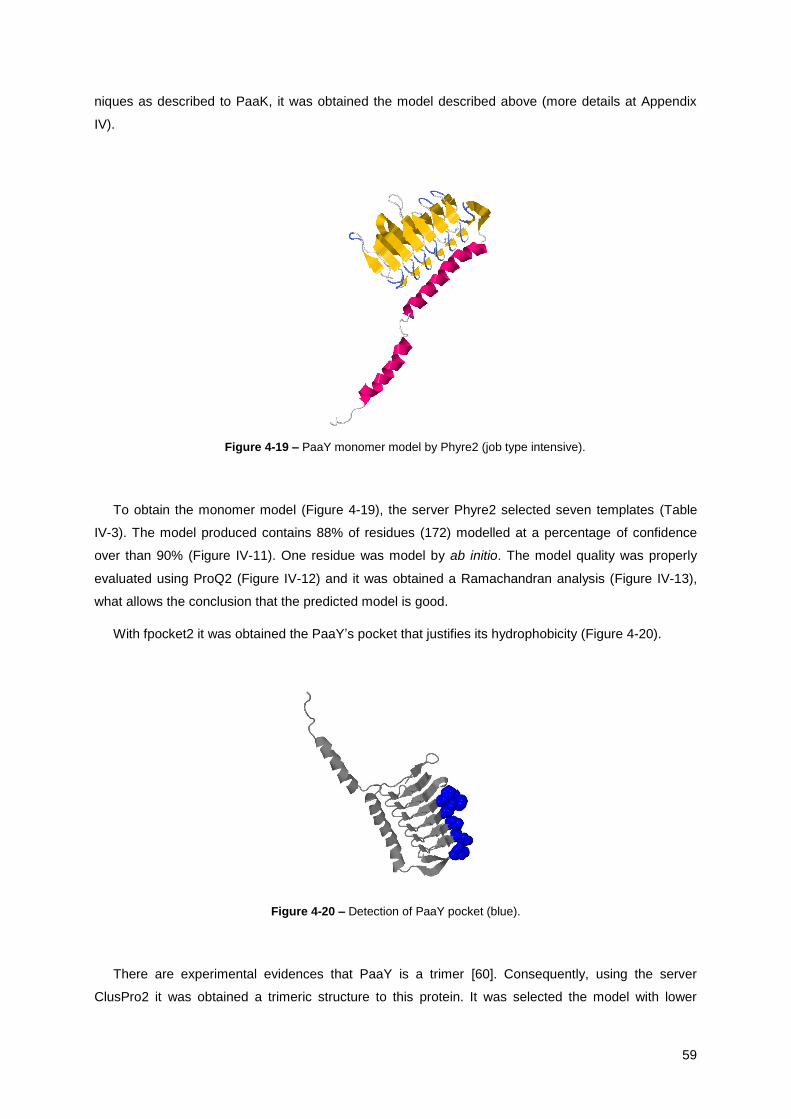
59
niques as described to PaaK, it was obtained the model described above (more details at Appendix
IV).
Figure 4-19 – PaaY monomer model by Phyre2 (job type intensive).
To obtain the monomer model (Figure 4-19), the server Phyre2 selected seven templates (Table
IV-3). The model produced contains 88% of residues (172) modelled at a percentage of confidence
over than 90% (Figure IV-11). One residue was model by ab initio. The model quality was properly
evaluated using ProQ2 (Figure IV-12) and it was obtained a Ramachandran analysis (Figure IV-13),
what allows the conclusion that the predicted model is good.
With fpocket2 it was obtained the PaaY’s pocket that justifies its hydrophobicity (Figure 4-20).
Figure 4-20 – Detection of PaaY pocket (blue).
There are experimental evidences that PaaY is a trimer [60]. Consequently, using the server
ClusPro2 it was obtained a trimeric structure to this protein. It was selected the model with lower

60
Gibbs energy (-1181.2 kJ/mol) and where the ligation between the units are hydrophobic interactions
(Figure 4-21).
Figure 4-21 – PaaY trimer model.
This model was validated by the Procheck server (Figure IV-17).
The article that showed experimental evidences that PaaY has a trimeric structure also come up
with a 3D model for it. When compared, side by side, the model described here and the model from
the article [60] (Figure S10, A and B), there are clear differences. This way, it was carried out adjusts
in the PaaY model above in order to reach the one described on the article. PaaY has 196 residues,
but it was concluded that to obtain the model from the article it can only be used 136 residues in the
modelling procedures. This allows to extend to 100% the number of residues (136) modelled at a per-
centage of confidence over 90%, instead of the 88% of confidence determined before. Furthermore,
the trimeric structure suggested do not corresponds to the one with lower Gibbs energy and that fa-
vours hydrophobic interactions between the three monomers. The article does not provide further ex-
planations about the PaaY modelling procedure. At this point, in this work, the model described in
Figure 4-21 will be considered as more predictive of what happens with PaaY native structure.
4.6.3 Correlation Between the Proteins Models and Results Previously Described
With the data obtained by protein modelling it is possible to correlate and explain some experi-
mental evidences previously described.
At sections 4.2.2 and 4.2.5 was verified that PaaK is a protein difficult to purify and it leads to pro-
tein aggregation. It is described that protein aggregation and the formation of IB is driven by interac-
tions between solvent-exposed hydrophobic surfaces that are usually buried within the protein's inte-
rior [136], [137]. During PaaK modelling it was found that this protein has a large hydrophobic pocket

61
(Figure 4-17) and 58.35% of solvent accessibility is buried (Figure IV-9), what explains the difficulties
encountered to purify this protein properly.
At section 4.3, from Figure 4-12 analysis, it was suggested that band G could correspond to a pos-
sible PaaK dimer. In fact, it was possible to build a reliably predictive model for PaaK dimer (Figure 4-
18). Therefore, there is evidence that PaaK from E. coli have a dimeric structure, however more ex-
perimental data are required to corroborate it.
The PaaK acetylation studies identified the lysine 424 as being acetylated by PaaY (Figure 4-22).
As it is possible to understand from Table IV-2, this lysine is part of the AMP binding site and the ac-
tive site.
Figure 4-22 – PaaK lysine 424 localization. At orange it is identified the AMP binding site and at blue the CoA
binding site.
From the native gels analysis (section 4.3) it was concluded that the band labelled as H (Figure 4-
12) corresponds to PaaY. From the molecular weight marker is possible to infer that H shows more
than 480 kDa. However, there are experimental evidences that PaaY acts as a homotrimer [60] and in
this work it was built a suitable 3D model for its homotrimer (Figure 4-20). Moreover, the server does
not allow to construct models more complex than pentamers, and because of that it was not tested
highly oligomeric structures.
At Table IV-4, it is listed all the residues present at PaaY binding site. None of the lysines identified
as acetylated (Table 4-5) belongs to the binding site.
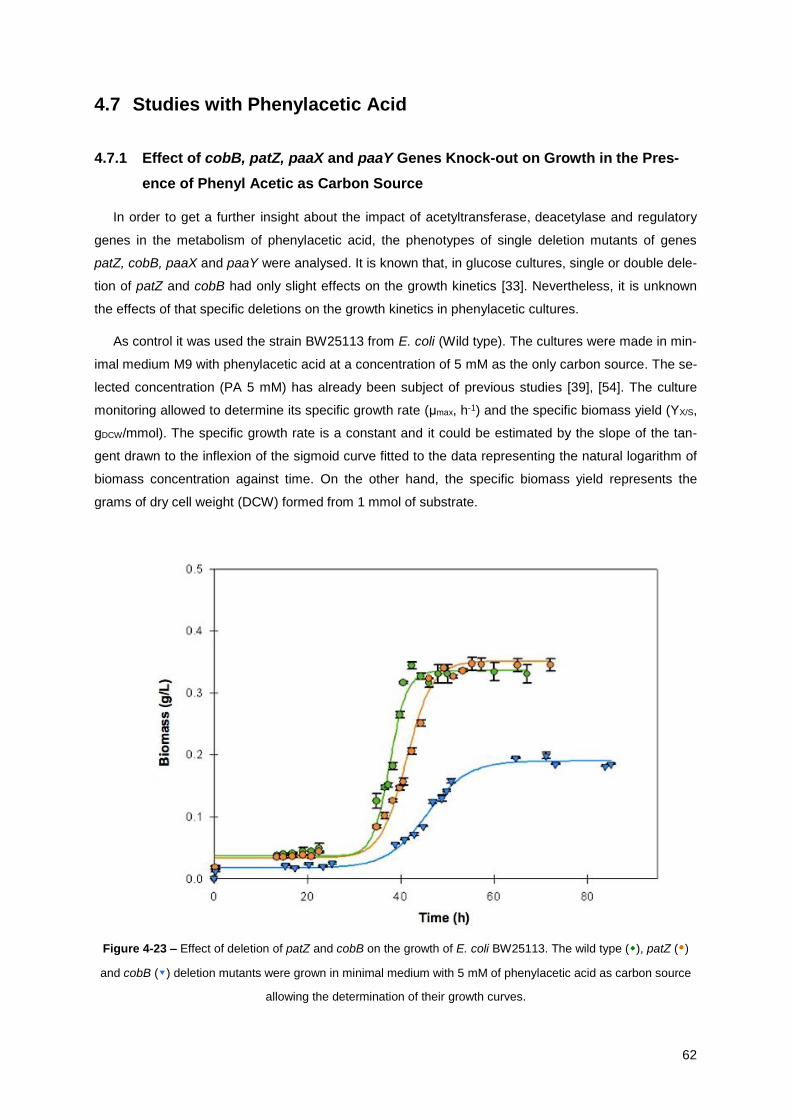
62
4.7 Studies with Phenylacetic Acid
4.7.1 Effect of cobB, patZ, paaX and paaY Genes Knock-out on Growth in the Pres-
ence of Phenyl Acetic as Carbon Source
In order to get a further insight about the impact of acetyltransferase, deacetylase and regulatory
genes in the metabolism of phenylacetic acid, the phenotypes of single deletion mutants of genes
patZ, cobB, paaX and paaY were analysed. It is known that, in glucose cultures, single or double dele-
tion of patZ and cobB had only slight effects on the growth kinetics [33]. Nevertheless, it is unknown
the effects of that specific deletions on the growth kinetics in phenylacetic cultures.
As control it was used the strain BW25113 from E. coli (Wild type). The cultures were made in min-
imal medium M9 with phenylacetic acid at a concentration of 5 mM as the only carbon source. The se-
lected concentration (PA 5 mM) has already been subject of previous studies [39], [54]. The culture
monitoring allowed to determine its specific growth rate (μmax, h-1) and the specific biomass yield (YX/S,
gDCW/mmol). The specific growth rate is a constant and it could be estimated by the slope of the tan-
gent drawn to the inflexion of the sigmoid curve fitted to the data representing the natural logarithm of
biomass concentration against time. On the other hand, the specific biomass yield represents the
grams of dry cell weight (DCW) formed from 1 mmol of substrate.
Figure 4-23 – Effect of deletion of patZ and cobB on the growth of E. coli BW25113. The wild type (), patZ ()
and cobB (▾) deletion mutants were grown in minimal medium with 5 mM of phenylacetic acid as carbon source
allowing the determination of their growth curves.
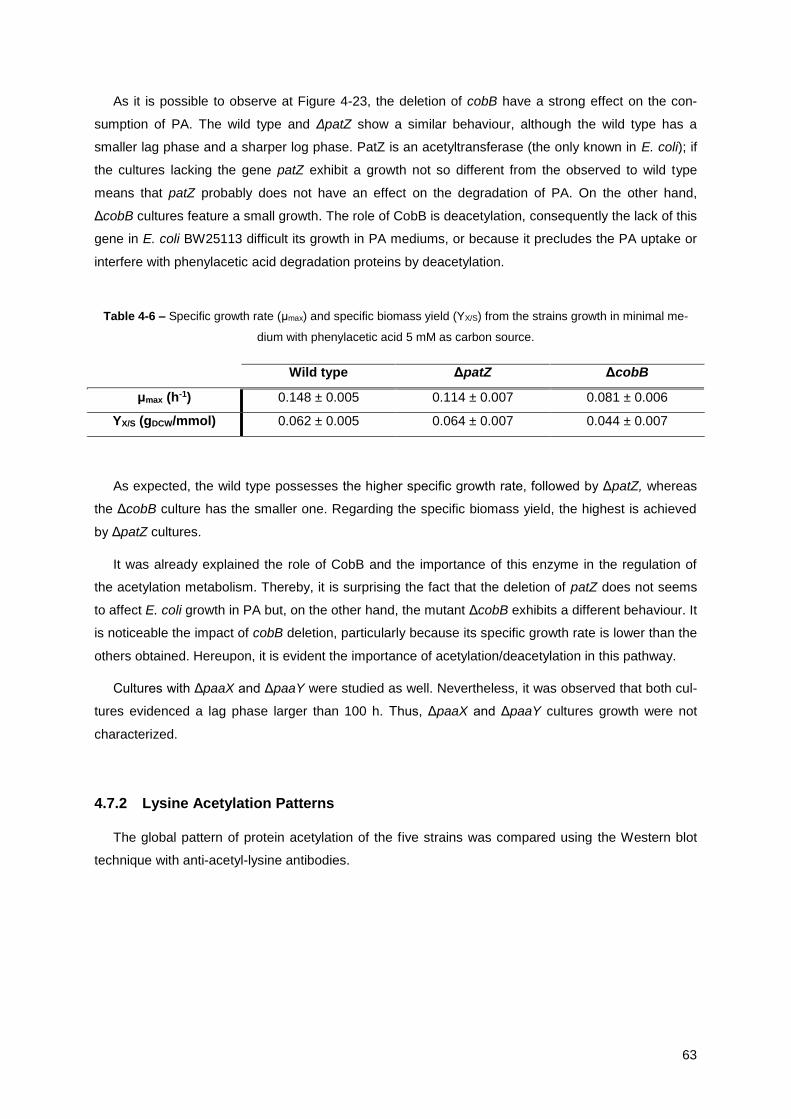
63
As it is possible to observe at Figure 4-23, the deletion of cobB have a strong effect on the con-
sumption of PA. The wild type and ΔpatZ show a similar behaviour, although the wild type has a
smaller lag phase and a sharper log phase. PatZ is an acetyltransferase (the only known in E. coli); if
the cultures lacking the gene patZ exhibit a growth not so different from the observed to wild type
means that patZ probably does not have an effect on the degradation of PA. On the other hand,
ΔcobB cultures feature a small growth. The role of CobB is deacetylation, consequently the lack of this
gene in E. coli BW25113 difficult its growth in PA mediums, or because it precludes the PA uptake or
interfere with phenylacetic acid degradation proteins by deacetylation.
Table 4-6 – Specific growth rate (μmax) and specific biomass yield (YX/S) from the strains growth in minimal me-
dium with phenylacetic acid 5 mM as carbon source.
Wild type ΔpatZ ΔcobB
μmax (h-1) 0.148 ± 0.005 0.114 ± 0.007 0.081 ± 0.006
YX/S (gDCW/mmol) 0.062 ± 0.005 0.064 ± 0.007 0.044 ± 0.007
As expected, the wild type possesses the higher specific growth rate, followed by ΔpatZ, whereas
the ΔcobB culture has the smaller one. Regarding the specific biomass yield, the highest is achieved
by ΔpatZ cultures.
It was already explained the role of CobB and the importance of this enzyme in the regulation of
the acetylation metabolism. Thereby, it is surprising the fact that the deletion of patZ does not seems
to affect E. coli growth in PA but, on the other hand, the mutant ΔcobB exhibits a different behaviour. It
is noticeable the impact of cobB deletion, particularly because its specific growth rate is lower than the
others obtained. Hereupon, it is evident the importance of acetylation/deacetylation in this pathway.
Cultures with ΔpaaX and ΔpaaY were studied as well. Nevertheless, it was observed that both cul-
tures evidenced a lag phase larger than 100 h. Thus, ΔpaaX and ΔpaaY cultures growth were not
characterized.
4.7.2 Lysine Acetylation Patterns
The global pattern of protein acetylation of the five strains was compared using the Western blot
technique with anti-acetyl-lysine antibodies.

64
Figure 4-24 – Western blot showing protein lysine acetylation in protein crude cell extract from different strains (I)
and Western blot Coomassie-stained membrane (II). MW, Molecular weight marker; 1, E. coli BW25113 (wild
type); 2, E. coli ΔcobB; 3, E. coli ΔpatZ; 4, E. coli ΔpaaX; 5, E. coli ΔpaaY.
The objective of this experiment was to observe the general acetylome of these five strains. Due to
problems with the Western blot technique, the revealed (Figure 4-23, I) has too much noise, however
it is possible to take some interesting observations from it. Post-translational modification by acetyla-
tion is more abundant in ΔpatZ and ΔpaaY cultures. In fact, the acetylation behaviour is similar be-
tween this two, what is in accordance with predict acetyltransferase role to PaaY.
The acetylation pattern between ΔcobB (lane 2) and ΔpaaX (lane 4) are also similar. PaaX is a
regulator protein: it acts as transcriptional repressor of the paa pathway [60]. For this reason, it is sur-
prising that the acetylation in ΔpaaX cultures is similar to the acetylation from ΔcobB cultures. It was
already reported that the deletion of cobB have a strong effect on the consumption of PA, result that
was not expected. Thus, this observation raises the hypothesis of an acetylation role to PaaX. But it is
important to mention that PaaX has not been related with any acetylation function, until this moment.
Another possibility is that this protein is responsible to regulate some acetyltransferase, and in the
manner of the facts, PaaX is responsible by the regulation of PaaY.
The wild type (lane 1) seems to have an acetylation pattern slightly different from the others four
strains.

65
5 Chapter 5 – CONCLUSIONS AND FUTURE PRESPECTIVES
The main objective of this dissertation was to investigate the involvement of lysine acetylation in
the metabolism of phenylacetic acid in E. coli. The experimental work was planned with the aim to
prove if PatZ can show some specificity to lysine-424 from PaaK (or another) and verify if PaaY have
acetyltransferase activity, in particular by some specific lysine from PaaK. This two were the main
goals desired to acquire with this project. As explained at chapter 2, to achieve these goals the overall
aim was divided into partial objectives.
The first objective was to design and construct an overexpression vector for PaaK, once it is the
only gene from paa operon that is not present at Aska Collection. It is possible to claim that this was
successfully accomplished and it was possible to obtain the vector named as pRSET-C+paaK.
To be able to study the proteins with proteomic techniques and characterize both, it was required
to purify the proteins pure, soluble and functional. Therefore, it is essential to optimize the overexpres-
sion conditions. In what regards PaaY, this particular part of the study is not described in this work,
once it was perform by a co-worker, but it was properly validated. On the other hand, it was clearly
possible to overexpress PaaK from E. coli BL21 (DE3) and E. coli BL21 (DE3) pLysS. However, the
optimization of the conditions (within the laboratory possibilities) was difficult and time consuming. It
was found that culture temperature and the O.D.600 value at induction time are the most important var-
iables, whereas the inductor concentration not so much. In the future, it should be conducted studies
of kinetic induction of PaaK at lower temperatures, such as 20 °C, often recommended [138], [139]. It
was also visible that the strain E. coli BL21 (DE3) pLysS carries out a more pronounced overexpres-
sion, because of its ability to reduce basal expression of toxic target proteins.
Using the optimized conditions to overexpress PaaK, it was possible to purify it with immobilized-
metal affinity chromatography. This step was the limiting factor of all work, because PaaK revealed to
be a difficult protein to purify: being highly temperature sensitive and extremely instable in aqueous
solutions, factors that are confirmed by studying its structure with bioinformatics tools. Similarly to
kinetic induction studies, it was verified that the use of the strain E. coli BL21 (DE3) pLysS leads to
better results. However, the purification procedure needs to be made as cooler and faster as possible,
and once the protein is obtained it is essential to aliquot and store it quickly. Further optimizations
need to be made in the purification step. In order to improve protein stability in aqueous solutions it
could be used a maltose-binding protein, similarly to what was made to purify phenylacetic acid-CoA
ligase from Penicillium chysogenum [70]. It will be important to optimize the storage buffer as well.
Hereupon, in future studies regarding PaaK it is essential to focus and make an effort to optimize the
overexpression and purification procedures. In this work, once it was essential to continue with the
study, it was not improved.
In the other hand, PaaY is an easily protein to purify. Although it also demonstrate some instability
and insolubility in aqueous solutions, it was possible to purify it with acceptable concentrations. In
future studies regarding PaaY overexpression and purification it will be important to adjust the storage
66
buffer composition and it could be interesting to study the effect of overexpressing this protein in E.
coli BL21 (DE3) pLysS, as well.
Taking into account the results from native gels and bioinformatics studies it is possible to suggest
that PaaK from E. coli forms dimers. About PaaY, despite of previous studies that demonstrate that it
forms trimers and in this work it is suggested a structure to its trimers, the native gels do not confirm
those data. Native gels show that PaaY native form is a highly oligomeric structure.
From the acetylation studies performed it was possible to conclude that both PaaK and PaaY suffer
chemical acetylation. About PaaK, the result from LC-MS/MS allows to have evidence that PaaY has
acetyltransferase activity and shows specificity to Lys-424. However, in what regards the action of
PatZ on PaaK it was not possibly to take further conclusions from LC-MS/MS data. In the other hand,
PatZ seems to show specificity to some lysines from PaaY, a not so expected result. Once it was sug-
gested that PaaY could have acetyltransferase activity, therefore it was not expected that it would be
the substrate of an acetyltransferase. It is important to consider that “the absence of evidence is not
evidence of absence”, thus in future studies it will be essential to identify all the lysines from PaaK and
PaaY that could suffer chemical and enzymatic acetylation, in order to identify enzymatic specificity.
For that, it is required to optimize the purification method and improve the concentration of purified
proteins, but most of all it is mandatory to obtain these proteins soluble and active. When this goal has
been achieved, the acetylation study should be repeated. However, bear in mind that in vitro specifici-
ties may not mirror what happens in vivo. To overcome this obstacle, in vivo studies should be per-
formed.
Further studies were conducted in minimal medium with phenylacetic acid 5 mM as carbon source
and it is possible to claim that the deletion of patZ does not affect the growth in PA; the deletion of
cobB affects the growth in PA and the deletion of paaY and paaX strongly affects the growth in PA.
Furthermore, it was observed that the acetylation pattern from ΔpatZ and ΔpaaY cultures is similar,
which strengthens the fact that PaaY has acetyltransferase activity. It was also observed that the
acetylation pattern from ΔcobB and ΔpaaX cultures is similar, what is curious because PaaX has not
been related with acetylation previously. Furthermore, it is paradoxical that the acetylation pattern from
ΔcobB shows less acetylation than the acetylation pattern from ΔpatZ. It will be expected to have a
stronger acetylation in cultures without cobB, because the deacetylase enzyme is not present. In the
opposite, when the enzyme responsible for acetylation is not in the cell, acetylation should not be ob-
served.
New answers provided by this study result in even more questions to be investigated. There is no
doubt that more studies are required and this is an important basis for future studies that have to be
carried out to confirm all the hypothesis suggested and to unveil in the PaaK and PaaY post-transla-
tional regulation. In future studies, the first step is to optimize the purification of both proteins; namely
to PaaK, it should pass by cloning this gene with a maltose-binding protein. A method to determine
PaaY activity needs to be found and when purified it is essential to ensure that both proteins are solu-
ble and active. Native studies should also be carried out, to confirm the native structure of both pro-
teins and to observe if acetylation leads to conformational changes. Mainly because studies about

67
PatZ have demonstrated that this protein has the ability to change conformation when suffers acetyla-
tion, from a tetramer to an octameric structure [32]. Thus, with PaaY a similar event could occur. Stud-
ies with deacetylation by CobB should also be conducted. But first, it is necessary to confirm irrefuta-
bly the acetylatilated lysines by mass spectrometry. It will also be interesting to purify both proteins
from cultures with PA as carbon source and performed the same studies above mentioned.
The findings of this study contribute to a better understanding of post-translational modifications by
acetylation and its impact in E. coli’s metabolism. It is clear that there is still a long way to go. But
breakthrough ideas emerge from small discoveries.
68
6 References
[1] N. Casali, et al. “Escherichia coli Host Strains”. Methods Mol. Biol. Vol. 235, no. 4. 2003.
[2] E. Díaz, et al. “Biodegradation of Aromatic Compounds by Escherichia coli”. Microbiol. Mol.
Biol. Rev. Vol. 65, no. 4. 2001.
[3] M. A. Croxen, et al. “Recent advances in understanding enteric pathogenic Escherichia coli”.
Clin. Microbiol. Rev. Vol. 26, no. 4. 2013.
[4] F. M. Ausubel, et al. Current Protocols in Molecular Biology. 2003.
[5] J. B. Kaper, J. P. Nataro and H. L. Mobley. “Pathogenic Escherichia coli”. Nat. Rev. Vol. 2, no.
2. 2004.
[6] G. L. Rosano and E. A. Ceccarelli. “Recombinant protein expression in Escherichia coli:
Advances and Challenges”. Front. Microbiol. Vol. 5, no. 172. 2014.
[7] H. P. Sørensen and K. K. Mortensen. “Advanced genetic strategies for recombinant protein
expression in Escherichia coli”. J. Biotechnol. Vol. 115, no. 2. 2005.
[8] M. Papagianni. “Recent advances in engineering the central carbon metabolism of industrially
important bacteria”. Microb. Cell Fact. Vol. 11, no. 1. 2012.
[9] V. Bernal, et al. “Regulation of bacterial physiology by lysine acetylation of proteins”. N.
Biotechnol. Vol. 31, no. 6. 2014.
[10] E. Verdin and M. Ott. “50 Years of protein acetylation: from gene regulation to epigenetics,
metabolism and beyond”. Nat. Rev. Vol. 16, no. 4. 2014.
[11] O. N. Jensen. “Modification-specific proteomics: characterization of post-translational
modifications by mass spectrometry”. Curr. Opin. Chem. Biol. Vol. 8, no. 1. 2004.
[12] F. Crick. “Central dogma of molecular biology”. Nature. vol. 227, no. 5258. 1970.
[13] J. Seo and K. J. Lee. “Post-translational modifications and their biological functions: proteomic
analysis and systematic approaches”. J. Biochem. Mol. Biol. Vol. 37, no. 1. 2004.
[14] V. Chubukov, L. Gerosa, K. Kochanowski, and U. Sauer. “Coordination of microbial
metabolism”. Nat. Rev. Vol. 12, no. 5. May 2014.
[15] M. A. Glozak, N. Sengupta, X. Zhang, and E. Seto. “Acetylation and deacetylation of non-
histone proteins”. Gene. Vol. 363, no. 19. 2005.
[16] G. W. Kim and X. J. Yang. “Comprehensive lysine acetylomes emerging from bacteria to
humans”. Trends Biochem. Sci. Vol. 36, no. 4. 2011.
[17] K. L. Norris, J. Y. Lee, and T. P. Yao. “Acetylation goes global: the emergence of acetylation
biology”. Sci. Signal. Vol. 2, no. 97. 2009.
[18] C. Choudhary, et al. “The growing landscape of lysine acetylation links metabolism and cell
signalling”. Nat. Rev. Mol. Cell Biol. Vol. 15, no. 8. Jul. 2014.
[19] S. Zhao, et al. “Regulation of cellular metabolism by protein lysine acetylation”. Science. Vol.
327, no. 5968. 2011.
[20] Q. Wang, et al. “Acetylation of metabolic enzymes coordinates carbon source utilization and
metabolic flux”. Science. Vol. 327, no. 5968. 2010.
[21] C. Choudhary, et al. “Lysine acetylation targets protein complexes and co-regulates major
cellular functions”. Science. Vol. 325, no. 5942. 2009.
[22] B. Polevoda and F. Sherman. “N-terminal acetyltransferases and sequence requirements for
N-terminal acetylation of eukaryotic proteins”. J. Mol. Biol. Vol. 325, no. 4. 2003.
[23] J. Soppa. “Protein acetylation in archaea, bacteria, and eukaryotes”. Archaea. Vol. 2010, no.
10. 2010.
[24] A. Li, Y. Xue, C. Jin, M. Wang, and X. Yao. “Prediction of Nε-acetylation on internal lysines
implemented in bayesian discriminant method”. Biochem. Biophys. Res. Commun. Vol. 350,
no. 4. 2006.

69
[25] B. C. Smith and J. M. Denu. “Chemical mechanisms of histone lysine and arginine
modifications”. Biochim. Biophys. Acta. Vol. 1789, no. 1. 2009.
[26] M. L. Kuhn, et al. “Structural, kinetic and proteomic characterization of acetyl phosphate-
dependent bacterial protein acetylation”. PLoS One. Vol. 9, no. 4. 2014.
[27] G. R. Wagner and R. M. Payne. “Widespread and enzyme-independent Nε-acetylation and Nε-
succinylation of proteins in the chemical conditions of the mitochondrial matrix”. J. Biol. Chem.
Vol. 288, no. 40. 2013.
[28] R. Barak, M. Welch, A. Yanovsky, K. Oosawa, and M. Eisenbach. “Acetyladenylate or its
derivative acetylates the chemotaxis protein CheY in vitro and increases its activity at the
flagellar switch”. Biochemistry. Vol. 31, no. 41. 1992.
[29] R. Barak, K. Prasad, A. Shainskaya, A. J. Wolfe, and M. Eisenbach. “Acetylation of the
chemotaxis response regulator CheY by acetyl-CoA synthetase purified from Escherichia coli”.
J. Mol. Biol. Vol. 342, no. 2. 2004.
[30] K. S. Fritz. “Chemical acetylation and deacetylation”. Methods Mol. Biol. Vol. 1077. 2013.
[31] D. R. Friedmann and R. Marmorstein. “Structure and mechanism of non-histone protein
acetyltransferase enzymes”. FEBS J. Vol. 280, no. 22. 2013.
[32] T. Diego Puente, et al. “The protein acetyltransferase PatZ from Escherichia coli is regulated
by autoacetylation-induced oligomerization”. J. Biol. Chem. Vol. 10, no. 1074. 2015.
[33] S. Castaño-Cerezo, V. Bernal, J. Blanco-Catalá, J. L. Iborra, and M. Cánovas. “cAMP-CRP co-
ordinates the expression of the protein acetylation pathway with central metabolism in
Escherichia coli”. Mol. Microbiol. Vol. 82, no. 5. 2011.
[34] W. Liang and M. P. Deutscher. “Post-translational modification of RNase R is regulated by
stress-dependent reduction in the acetylating enzyme Pka (YfiQ)”. RNA. Vol. 18, no. 1. 2012.
[35] S. Thao, C.-S. Chen, H. Zhu, and J. C. Escalante-Semerena. “Nε-lysine acetylation of a
bacterial transcription factor inhibits Its DNA-binding activity”. PLoS One. Vol. 5, no. 12. 2010.
[36] S. Castaño-cerezo, et al. “Protein acetylation affects acetate metabolism, motility and acid
stress response in Escherichia coli”. Mol. Syst. Biol. Vol. 10, no. 11. 2014.
[37] K. Zhao, X. Chai, and R. Marmorstein. “Structure and substrate binding properties of cobB, a
Sir2 homolog protein deacetylase from Escherichia coli”. J. Mol. Biol. Vol. 337, no. 3. 2004.
[38] A. AbouElfetouh, et al. “The E. coli sirtuin CobB shows no preference for enzymatic and
nonenzymatic lysine acetylation substrate sites”. Microbiologyopen. Vol. 4, no. 1. 2015.
[39] J. Nogales, et al. “Characterization of the last step of the aerobic phenylacetic acid degradation
pathway”. Microbiology. Vol. 153, no. 2. 2007.
[40] R. Teufel, C. Gantert, M. Voss, W. Eisenreich, W. Haehnel, and G. Fuchs. “Studies on the
mechanism of ring hydrolysis in phenylacetate degradation: a metabolic branching point”. J.
Biol. Chem. Vol. 286, no. 13. 2011.
[41] A. Rojas-Altuve, et al. “Crystallization and preliminary X-ray diffraction studies of the
transcriptional repressor PaaX, the main regulator of the phenylacetic acid degradation
pathway in Escherichia coli W”. Acta Crystallogr. Sect. F Struct. Biol. Cryst. Commun. Vol. 67,
no. 10. 2011.
[42] E. Díaz and M. A. Prieto. “Bacterial promoters triggering biodegradation of aromatic pollutants”.
Curr. Opin. Biotechnol. Vol. 11, no. 5. 2000.
[43] G. Fuchs, M. Boll, and J. Heider. “Microbial degradation of aromatic compounds — from one
strategy to four”. Nat. Rev. Vol. 9, no. 11. 2011.
[44] J. M. Luengo, J. L. García, and E. R. Olivera. “The phenylacetyl-CoA catabolon: a complex
catabolic unit with broad biotechnological applications”. Mol. Microbiol. Vol. 39, no. 6. 2001.
[45] A. Ferrández, J. L. García, and E. Díaz. “Transcriptional regulation of the divergent paa
catabolic operons for phenylacetic acid degradation in Escherichia coli”. J. Biol. Chem. Vol.
275, no. 16. 2000.

70
[46] J. N. R. Hamlin, R. A. M. Bloodworth, and S. T. Cardona. “Regulation of phenylacetic acid
degradation genes of Burkholderia cenocepacia K56-2”. BMC Microbiol. Vol. 9, no. 222. 2009.
[47] N. Prasad Niraula, P. Shrestha, T. J. Oh, and J. Kyung Sohng. “Identification and
characterization of a NADH oxidoreductase involved in phenylacetic acid degradation pathway
from Streptomyces peucetius”. Microbiol. Res. Vol. 165, no. 8. 2010.
[48] M. E. Mohamed. “Biochemical and molecular characterization of phenylacetate-coenzyme A
ligase, an enzyme catalyzing the first step in aerobic metabolism of phenylacetic acid in
Azoarcus evansii”. J. Bacteriol. Vol. 182, no. 2. 2000.
[49] D. K. Patel and D. J. Sen, “Xenobiotics: an essential precursor for living system”. Am. J. Adv.
Drug Deliv. Vol. 1, no. 3. 2013.
[50] S. Fetzner. “Biodegradation of xenobiotics”. Encyclopedia of Life Support Systems. 2002.
[51] H. J. Knackmuss. “Basic knowledge and perspectives of bioelimination of xenobiotic
compounds”. J. Biotechnol. Vol. 51, no. 3. 1996.
[52] E. Díaz. “Bacterial degradation of aromatic pollutants: a paradigm of metabolic versatility”. Int.
Microbiol. Vol. 7, no. 3. 2004.
[53] R. Burlingame and P. J. Chapman. “Catabolism of phenylpropionic acid and its 3-hydroxy
derivative by Escherichia coli”. J. Bacteriol. Vol. 155, no. 1. 1983.
[54] A. Ferrrandez, et al. “Catabolism of phenylacetic acid in Escherichia coli”. J. Biol. Vol. 273, no.
40. 1998.
[55] A. Law and M. J. Boulanger. “Defining a structural and kinetic rationale for paralogous copies
of phenylacetate-CoA ligases from the cystic fibrosis pathogen Burkholderia cenocepacia
J2315”. J. Biol. Chem. Vol. 286, no. 17. 2011.
[56] S. S. Pao, I. T. Paulsen, and M. H. Saier. “Major facilitator superfamily”. Microbiol. Mol. Biol.
Rev. Vol. 62, no. 1. 1998.
[57] E. R. Olivera, et al. “Molecular characterization of the phenylacetic acid catabolic pathway in
Pseudomonas putida U: the phenylacetyl-CoA catabolon”. Proc. Natl. Acad. Sci. U. S. A. Vol.
95, no. 11. 1998.
[58] R. Rost, S. Haas, E. Hammer, H. Herrmann, and G. Burchhardt. “Molecular analysis of aerobic
phenylacetate degradation in Azoarcus evansii”. Mol. Genet. Genomics. Vol. 267, no. 5. 2002.
[59] A. Ferrrandez, et al. “Catabolism of phenylacetic acid in Escherichia coli”. J. Biol. Chem. Vol.
273, no. 40. 1998.
[60] C. Fernández, E. Díaz, and J. L. García. “Insights on the regulation of the phenylacetate
degradation pathway from Escherichia coli”. Environ. Microbiol. Rep. Vol. 6, no. 3. 2014.
[61] R. Teufel, et al. “Bacterial phenylalanine and phenylacetate catabolic pathway revealed”. Proc.
Natl. Acad. Sci. U. S. A. Vol. 107, no. 32. 2010.
[62] W. Ismail, et al. “Functional genomics by NMR spectroscopy. Phenylacetate catabolism in
Escherichia coli”. Eur. J. Biochem. Vol. 270, no. 14. 2003.
[63] C. Fernández, A. Ferrández, B. Miñambres, E. Díaz, and J. L. García. “Genetic
characterization of the phenylacetyl-coenzyme A oxygenase from the aerobic phenylacetic acid
degradation pathway of Escherichia coli”. Appl. Environ. Microbiol. Vol. 72, no. 11. 2006.
[64] H. S. Kim, T. S. Kang, J. S. Hyun, and H. S. Kang. “Regulation of penicillin G acylase gene
expression in Escherichia coli by repressor PaaX and the cAMP-cAMP receptor protein
complex”. J. Biol. Chem. Vol. 279, no. 32. 2004.
[65] R. Teufel, T. Friedrich, and G. Fuchs. “An oxygenase that forms and deoxygenates toxic
epoxide”. Nature. Vol. 483, no. 7389. 2012.
[66] “Escherichia coli K-12 substr. MG1655 Enzyme: phenylacetate-CoA ligase.” [Online].
Available: http://ecocyc.org/ECOLI/NEW-IMAGE?type=GENE&object=G6719. [Accessed: 15-
Feb-2015].

71
[67] R. Abe-Yoshizumi, U. Kamei, A. Yamada, M. Kimura, and S. Ichihara. “The evolution of the
phenylacetic acid degradation pathway in bacteria”. Biosci. Biotechnol. Biochem. Vol. 68, no. 3.
2004.
[68] T. J. Erb, W. Ismail, and G. Fuchs. “Phenylacetate metabolism in Thermophiles:
characterization of phenylacetate-CoA ligase, the initial enzyme of the hybrid pathway in
Thermus thermophilus”. Curr. Microbiol. Vol. 57, no. 1. 2008.
[69] H. Martinez-Blanco, A. Reglero, L. B. Rodriguez-Aparicio, and J. M. Luengo. “Purification and
biochemical characterization of phenylacetyl-CoA ligase from Pseudomonas putida: a specific
enzyme for the catabolism of phenylacetic acid”. J. Biol. Chem. Vol. 265, no. 12. 1990.
[70] M. J. Koetsier, et al. “Characterization of a phenylacetate-CoA ligase from Penicillium
chrysogenum”. Biochem. J. Vol. 417, no. 2. 2009.
[71] M. Kitagawa, et al. “Complete set of ORF clones of Escherichia coli ASKA library (a complete
set of E. coli K-12 ORF archive): unique resources for biological research”. DNA Res. Vol. 12,
no. 5. 2005.
[72] I. M. Keseler, et al. “EcoCyc: Fusing model organism databases with systems biology”. Nucleic
Acids Res. Vol. 41, no. 1. 2013.
[73] C. C. Lee, Y. Hu, and M. W. Ribbe. “Insights into hydrocarbon formation by nitrogenase
cofactor homologs”. MBio. Vol. 6, no. 2. 2015.
[74] V. J. Starai, I. Celic, R. N. Cole, J. D. Boeke, and J. C. Escalante-Semerena. “Sir2-dependent
activation of acetyl-CoA synthetase by deacetylation of active lysine”. Science. Vol. 298, no.
5602. 2002.
[75] K. Bodin, et al. “Metabolism of 4 beta-hydroxycholesterol in humans”. J. Biol. Chem. Vol. 277,
no. 35. 2002.
[76] F. Khodabakhsh, Z. Dehghani, M. F. Zia, M. Rabbani, and H. M. M. Sadeghi. “Cloning and
expression of functional reteplase in Escherichia coli TOP10”. Avicenna J. Med. Biotechnol.
Vol. 5, no. 3. 2013.
[77] J. Shiloach, J. Kaufman, A. S. Guillard, and R. Fass. “Effect of glucose supply strategy on
acetate accumulation, growth, and recombinant protein production by Escherichia coli BL21
(λDE3) and Escherichia coli JM109”. Biotechnol. Bioeng. Vol. 49, no. 4. 1996.
[78] P. Daegelen, F. W. Studier, R. E. Lenski, S. Cure, and J. F. Kim. “Tracing ancestors and
relatives of Escherichia coli B, and the derivation of B strains REL606 and BL21(DE3)”. J. Mol.
Biol. Vol. 394, no. 4. 2009.
[79] T. Durfee, et al. “The complete genome sequence of Escherichia coli DH10B: insights into the
biology of a laboratory workhorse”. J. Bacteriol. Vol. 190, no. 7. 2008.
[80] F. W. Studier and B. A. Moffatt. “Use of bacteriophage T7 RNA polymerase to direct selective
high-level expression of cloned genes”. J. Mol. Biol. Vol. 189, no. 1. 1986.
[81] S. Wagner, et al. “Tuning Escherichia coli for membrane protein overexpression”. Proc. Natl.
Acad. Sci. U. S. A. Vol. 105, no. 38. 2008.
[82] T. Baba, et al. “Construction of Escherichia coli K-12 in-frame, single-gene knockout mutants:
the Keio collection”. Mol. Syst. Biol. Vol. 2, no. 1. 2006.
[83] A. Roychoudhury, S. Basu, and D. N. Sengupta. “Analysis of comparative efficiencies of
different transformation methods of E. coli using two common plasmid vectors”. Indian J.
Biochem. Biophys. Vol. 46, no. 5. 2009.
[84] Invitrogen life technologies. “pRSET A, B and C. For high-level of recombinant proteins in E.
coli” 2010. [Online]. Available: http://tools.lifetechnologies.com/content/sfs/manuals/prset_man.pdf.
[Accessed: 12-Mar-2015].
[85] D. Hanahan. “Studies on transformation of Escherichia coli with plasmids”. J. Mol. Biol. Vol.
166, no. 4. 1983.
72
[86] GE Healthcare. “His GraviTrap”. 2006. [Online]. Available:
https://www.gelifesciences.com/gehcls_images/GELS/RelatedContent/Files/1314750913712/lit
doc11003689AC_20110831031636.pdf. [Accessed: 21-Mar-2015].
[87] GE Healthcare. “PD-10 from Sephadex G-25”. [Online]. Available:
https://www.gelifesciences.com/gehcls_images/GELS/RelatedContent/Files/1314723116657/lit
doc52130800BB_20110830191706.pdf. [Accessed: 21-Mar-2015].
[88] M. M. Bradford. “A rapid and sensitive method for the quantitation of microgram quantities of
protein utilizing the principle of protein-dye binding”. Anal. Biochem. Vol. 72, no. 1–2. 1976.
[89] B. J. Smith. “SDS polyacrylamide gel electrophoresis of proteins”. Proteins. 1984.
[90] R. Moulder, et al. “A comparative evaluation of software for the analysis of liquid
chromatography-tandem mass spectrometry data from isotope coded affinity tag experiments”.
Proteomics. Vol. 5, no. 11. 2005.
[91] E. A. Kapp, et al. “An evaluation, comparison, and accurate benchmarking of several publicly
available MS/MS search algorithms: sensitivity and specificity analysis”. Proteomics. Vol. 5, no.
13. 2005.
[92] J. R. Williamson and B. E. Corkey. “Assays of intermediates of the citric acid cycle and related
compounds by fluorometric enzyme methods”. Methods Enzymol. Vol. 12. 1969.
[93] L. A. Kelley and M. J. E. Sternberg. “Protein structure prediction on the Web: a case study
using the Phyre server”. Nat. Protoc. Vol. 4, no. 3. 2009.
[94] A. Ray, E. Lindahl, and B. Wallner. “Improved model quality assessment using ProQ2”. BMC
Bioinformatics. Vol. 13, no. 1. 2012.
[95] P. Schmidtke, A. Bidon-Chanal, F. J. Luque, and X. Barril. “MDpocket: open-source cavity
detection and characterization on molecular dynamics trajectories”. Bioinformatics. Vol. 27, no.
23. 2011.
[96] V. Le Guilloux, P. Schmidtke, and P. Tuffery. “Fpocket: an open source platform for ligand
pocket detection”. BMC Bioinformatics. Vol. 10, no. 1. 2009.
[97] A. Marchler-Bauer, et al. “CDD: NCBI’s conserved domain database”. Nucleic Acids Res. Vol.
43. 2014.
[98] D. Kozakov, et al. “How good is automated protein docking?”. Proteins. Vol. 81, no. 12. 2013.
[99] D. Kozakov, R. Brenke, S. R. Comeau, and S. Vajda. “PIPER: an FFT-based protein docking
program with pairwise potentials”. Proteins. Vol. 65, no. 2. 2006.
[100] B. Rost, G. Yachdav, and J. Liu. “The PredictProtein server”. Nucleic Acids Res. Vol. 32, suppl
2. 2004.
[101] T. Goldberg, T. Hamp, and B. Rost. “LocTree2 predicts localization for all domains of life”.
Bioinformatics. Vol. 28, no. 18. 2012.
[102] R. A. Laskowski, M. W. MacArthur, D. S. Moss, and J. M. Thornton. “PROCHECK: a program
to check the stereochemical quality of protein structures”. J. Appl. Crystallogr. Vol. 26, no. 2.
1993.
[103] M. Cánovas, V. Bernal, T. Torroglosa, J. L. Ramirez, and J. L. Iborra. “Link between primary
and secondary metabolism in the biotransformation of trimethylammonium compounds by
Escherichia coli”. Biotechnol. Bioeng. Vol. 84, no. 6. 2003.
[104] C. Aaij and P. Borst. “The gel electrophoresis of DNA”. Biochim. Biophys. Acta. Vol. 269, no. 2.
1972.
[105] Thermo Scientific. “Assessment of Nucleic Acid Purity”. [Online]. Available:
http://www.nanodrop.com/Library/T042-NanoDrop-Spectrophotometers-Nucleic-Acid-Purity-
Ratios.pdf. [Accessed: 03-Mar-2015].
[106] Thermo Scientific. “260/280 and 260/230 Ratios”. [Online]. Available:
http://www.nanodrop.com/Library/T009-NanoDrop 1000-&-NanoDrop 8000-Nucleic-Acid-
Purity-Ratios.pdf. [Accessed: 03-Mar-2015].

73
[107] W. W. Wilfinger. “Short technical reports: effect of pH and ionic strength on the spectro-
photometric assessment of nucleic acid purity”. Biotechniques. Vol. 22, no. 3. 1997.
[108] S. D. Breazeale, A. A. Ribeiro, and C. R. H. Raetz. “Oxidative decarboxylation of UDP-
glucuronic acid in extracts of polymyxin-resistant Escherichia coli. Origin of lipid a species
modified with 4-amino-4-deoxy-L-arabinose”. J. Biol. Chem. Vol. 277, no. 4. 2002.
[109] A. Yan, Z. Guan, and C. R. H. Raetz. “An undecaprenyl phosphate-aminoarabinose flippase
required for polymyxin resistance in Escherichia coli”. J. Biol. Chem. Vol. 282, no. 49. 2007.
[110] S. E. Radford. “GroEL: more than just a folding cage”. Cell. Vol. 125, no. 5. 2006.
[111] V. M. Bolanos-Garcia and O. R. Davies. “Structural analysis and classification of native
proteins from E. coli commonly co-purified by immobilised metal affinity chromatography”.
Biochim. Biophys. Acta. Vol. 1760, no. 9. 2006.
[112] C. Robichon, J. Luo, T. B. Causey, J. S. Benner, and J. C. Samuelson. “Engineering
Escherichia coli BL21(DE3) derivative strains to minimize E. coli protein contamination after
purification by immobilized metal affinity chromatography”. Appl. Environ. Microbiol. Vol. 77,
no. 13. 2011.
[113] G. Kozlov, R. Vinaik, and K. Gehring. “Triosephosphate isomerase is a common crystallization
contaminant of soluble His-tagged proteins produced in Escherichia coli”. Acta Crystallogr.
Sect. F Struct. Biol. Cryst. Commun. Vol. 69, no. 5. 2013.
[114] M. Gassmann, B. Grenacher, B. Rohde, and J. Vogel. “Quantifying Western blots: pitfalls of
densitometry”. Electrophoresis. Vol. 30, no. 11. 2009.
[115] P. Rehbein and H. Schwalbe. “Integrated protocol for reliable and fast quantification and
documentation of electrophoresis gels”. Protein Expr. Purif. Vol. 110. 2015.
[116] G. Kumar, P. Tajpara, A. B. Bukhari, A. G. Ramchandani, A. De, and G. B. Maru. “Dietary
curcumin post-treatment enhances the disappearance of B(a)P-derived DNA adducts in mouse
liver and lungs”. Toxicol. Reports. Vol. 1. 2014.
[117] H. P. Sørensen and K. K. Mortensen. “Soluble expression of recombinant proteins in the
cytoplasm of Escherichia coli”. Microb. Cell Fact. Vol. 4, no. 1. 2005.
[118] I. Palmer and P. T. Wingfield. “Preparation and extraction of insoluble (inclusion-body) proteins
from Escherichia coli”. Curr. Protoc. protein Sci. Vol. 6, no. 3. 2004.
[119] C. H. Schein. “Production of soluble recombinant proteins in bacteria”. Nat. Biotechnol. Vol. 7,
no. 11. 1989.
[120] V. Vagenende, M. G. S. Yap, and B. L. Trout. “Mechanisms of protein stabilization and
prevention of protein aggregation by glycerol”. Biochemistry. Vol. 48, no. 46. 2009.
[121] Z. S. Hendsch and B. Tidor. “Do salt bridges stabilize proteins? A continuum electrostatic
analysis”. Protein Sci. a Publ. Protein Soc. Vol. 3, no. 2. 1994.
[122] A. Lejeune, et al. “Quantitative analysis of the stabilization by substrate of Staphylococcus
aureus PC1 β-lactamase”. Chem. Biol. Vol. 8, no. 8. 2001.
[123] S. E. Bondos and A. Bicknell. “Detection and prevention of protein aggregation before, during,
and after purification”. Anal. Biochem. Vol. 316, no. 2. 2003.
[124] M. Stefani. “Protein misfolding and aggregation: new examples in medicine and biology of the
dark side of the protein world”. Biochim. Biophys. Acta. Vol. 1739, no. 1. 2004.
[125] R. R. Burgess and M. P. Deutscher. Guide to protein purification, 2th ed. 2009.
[126] A. P. Golovanov, G. M. Hautbergue, S. A. Wilson, and L. Y. Lian. “A simple method for
improving protein solubility and long-term stability”. J. Am. Chem. Soc. Vol. 126, no. 29. 2004.
[127] L. D. Cabrita and S. P. Bottomley. “Protein expression and refolding - a practical guide to
getting the most out of inclusion bodies”. Biotechnol. Annu. Rev. Vol. 10. 2004.
[128] N. Shimamoto, T. Kasciukovich, H. Nagai, and R. S. Hayward. “Efficient solubilization of
proteins overproduced as inclusion bodies by use of an extreme concentration of glycerol”.
Tech. Tips Online. Vol. 3, no. 1. 1998.
74
[129] K. Tsumoto, D. Ejima, I. Kumagai, and T. Arakawa. “Practical considerations in refolding
proteins from inclusion bodies”. Protein Expr. Purif. Vol. 28, no. 1. 2003.
[130] L. A. Svensson, B. P. Surin, N. E. Dixon, and M. D. Spangfort. “The symmetry of Escherichia
coli cpn60 (GroEL) determined by X-ray crystallography”. J. Mol. Biol. Vol. 235, no. 1. 1994.
[131] P. Z. Gatzeva-Topalova, A. P. May, and M. C. Sousa. “Structure and mechanism of ArnA:
conformational change implies ordered dehydrogenase mechanism in key enzyme for
polymyxin resistance”. Structure. Vol. 13, no. 6. 2005.
[132] M. Oelschlägel, C. Heiland, M. Schlömann, and D. Tischler. “Production of a recombinant
membrane protein in an Escherichia coli strain for the whole cell biosynthesis of phenylacetic
acids”. Biotechnol. Reports. Vol. 7. 2015.
[133] D. Lee, O. Redfern, and C. Orengo. “Predicting protein function from sequence and structure”.
Nat. Rev. Vol. 8, no. 12. 2007.
[134] A. Pavlopoulou and I. Michalopoulos. “State-of-the-art bioinformatics protein structure
prediction tools (Review)”. Int. J. Mol. Med. Vol. 28, no. 3. 2011.
[135] M. Wiederstein and M. J. Sippl. “ProSA-web: interactive web service for the recognition of
errors in three-dimensional structures of proteins”. Nucleic Acids Res. Vol. 35, suppl 2. 2007.
[136] R. S. Rajan, M. E. Illing, N. F. Bence, and R. R. Kopito. “Specificity in intracellular protein
aggregation and inclusion body formation”. Proc. Natl. Acad. Sci. U. S. A. Vol. 98, no. 23.
2001.
[137] A. L. Fink. “Protein aggregation: folding aggregates, inclusion bodies and amyloid”. Fold. Des.
Vol. 3, no. 1. 1998.
[138] Y. Xie and D. B. Wetlaufer. “Control of aggregation in protein refolding: the temperature-leap
tactic”. Protein Sci. a Publ. Protein Soc. Vol. 5, no. 3. 1996.
[139] S. Gräslund, et al. “Protein production and purification”. Nat. Methods. Vol. 5, no. 2. 2008.
[140] P. Di Tommaso, et al. “T-Coffee: a web server for the multiple sequence alignment of protein
and RNA sequences using structural information and homology extension”. Nucleic Acids Res.
Vol. 39. 2011.
[141] M. Mann, R. C. Hendrickson, and A. Pandey. “Analysis of proteins and proteomes by mass
spectrometry”. Annu. Rev. Biochem. Vol. 70, no. 1. 2001.
[142] F. Forner, L. J. Foster, and S. Toppo. “Mass spectrometry data analysis in the proteomics era”.
Curr. Bioinform. Vol. 2, no. 1. 2007.
[143] B. M. Zee and B. A. Garcia. “Validation of protein acetylation by mass spectrometry”. Protein
acetylation. Vol. 981, no. 10. 2013.
[144] M. N. Wass, L. A. Kelley, and M. J. E. Sternberg. “3DLigandSite: predicting ligand-binding sites
using similar structures”. Nucleic Acids Res. Vol. 38. 2010.

75
7 Appendix I – Multiple Sequence Alignment
The server T-Coffee (Tree-based Consistency Objective Function For alignment Evaluation)
[140][140] was used to obtain a multiple sequence alignment (MSA) between the proteins Acs (identi-
fied as gnl|ECOLI|ACS-M) and PaaK (gnl|ECOLI|G6719), both from E. coli genome. To execute
this procedure is required the proteins FASTA sequence and both were obtained from the database
EcoCyc [72].[72]. The results from the T-Coffee alignment are shown below. However, before ana-
lysing the obtained data it is important to understand how the server returns the results: essentially, it
gives the alignment score and the conservation level. The score value depends on the length of the
most-similar segments that occur between two sequences, i.e., the similarly the sequences are, the
bigger is the score value. In the other hand, symbols and colours reflect the conservation level (shown
in cons line). The symbols are 3 and with a very precise meaning: (*) - a star indicates an entirely con-
served column; (:) - a colon indicates columns where all the residues have roughly the same size and
the same hydropathy index; (.) - a period indicates columns where the size or the hydropathy has
been preserved in the course of evolution. The colour code starts with blue, where the conservation
level between the amino acids is low, followed by the colours green, yellow and red. The last one is
the colour that reflects more conservation.
T-COFFEE, Version_11.00.8cbe486 (2014-08-12 22:05:29 Revi-
sion 8cbe486 - Build 477) Cedric Notredame SCORE=769 * BAD AVERAGE GOOD * gnl|ECOLI|G6719 : 83 gnl|ECOLI|ACS-M : 66 cons : 76
gnl|ECOLI|G6719 1 MITNTK-----------------LDPIETASV- 15 gnl|ECOLI|ACS-M 1 MSQIHKHTIPANIADRCLINPQQYEAMYQQSIN 33
cons 1 * * :.: *: 33
gnl|ECOLI|G6719 16 --DELQALQTQRLKWTLK--------------- 31 gnl|ECOLI|ACS-M 34 VPDTFWGEQGKILDWIKPYQKVKNTSFAPGNVS 66
cons 34 * : . * : *.* 66
gnl|ECOLI|G6719 32 ---------------------HAYENVPMYRRK 43 gnl|ECOLI|ACS-M 67 IKWYEDGTLNLAANCLDRHLQENGDRTAIIWEG 99
cons 67 . :...: . 99
gnl|ECOLI|G6719 44 FDAAGVHPDDFRELS-DLRKFP----------- 64 gnl|ECOLI|ACS-M 100 DDASQSKHISYKELHRDVCRFANTLLELGIKKG 132

76
cons 100 **: : .::** *: :*. 132
gnl|ECOLI|G6719 65 --------------------------------- 64 gnl|ECOLI|ACS-M 133 DVVAIYMPMVPEAAVAMLACARIGAVHSVIFGG 165
cons 133 165
gnl|ECOLI|G6719 65 ------------------CTTK----------- 68 gnl|ECOLI|ACS-M 166 FSPEAVAGRIIDSNSRLVITSDEGVRAGRSIPL 198
cons 166 *:. 198
gnl|ECOLI|G6719 69 -------------------------------QD 70 gnl|ECOLI|ACS-M 199 KKNVDDALKNPNVTSVEHVVVLKRTGGKIDWQE 231
cons 199 *: 231
gnl|ECOLI|G6719 71 LRDNYPFDT----------FAVPMEQVVRIHAS 93 gnl|ECOLI|ACS-M 232 GRDLWWHDLVEQASDQHQAEEMNAEDPLFILYT 264
cons 232 ** : .* : *: : * : 264
gnl|ECOLI|G6719 94 SGTTGKPTVVGYTQNDIDNWANIVARSLRAAGG 126 gnl|ECOLI|ACS-M 265 SGSTGKPKGVLHTTGGYLVYAALTFKYV--FDY 295
cons 265 **:****. * :* .. :* :. : : . 297
gnl|ECOLI|G6719 127 SPKDKIHVAYGYGLFTGGLGAHYGAERLGATVI 159 gnl|ECOLI|ACS-M 296 HPGDIYWCTADVGWVTGHSYLLYGPLACGATTL 328
cons 298 * * : . * .** **. ***.: 330
gnl|ECOLI|G6719 160 PMSGG----QTEKQAQLIRDFQPDMIMVTPSYC 188 gnl|ECOLI|ACS-M 329 MFEGVPNWPTPARMAQVVDKHQVNILYTAPTAI 361
cons 331 :.* . : **:: ..* ::: .:*: 363
gnl|ECOLI|G6719 189 LNLIEELERQLGGDASGCSLRVGVFGAEPWTQA 221 gnl|ECOLI|ACS-M 362 RALMAEGDKAIEGTD-RSSLRILGSVGEPINPE 393
cons 364 *: * :: : * .***: .** . 396
gnl|ECOLI|G6719 222 MRKEIERRLG---ITALDIYGLSEVMGPGVA-- 249 gnl|ECOLI|ACS-M 394 AWEWYWKKIGNEKCPVVDTWWQTETGGFMITPL 426
cons 397 : :::* ..:* : :*. * :: 429
gnl|ECOLI|G6719 250 MECLETTDGPT-IWEDHFYPEIVNPHDGTPLAD 281 gnl|ECOLI|ACS-M 427 PGATELKAGSATRPFFGVQPALVD-NEGNPLEG 458
cons 430 . * . *.: . * :*: ::*.** . 462
gnl|ECOLI|G6719 282 GEHGELLFTTLTKEALPVIRYRTRDLTRLLPGT 314
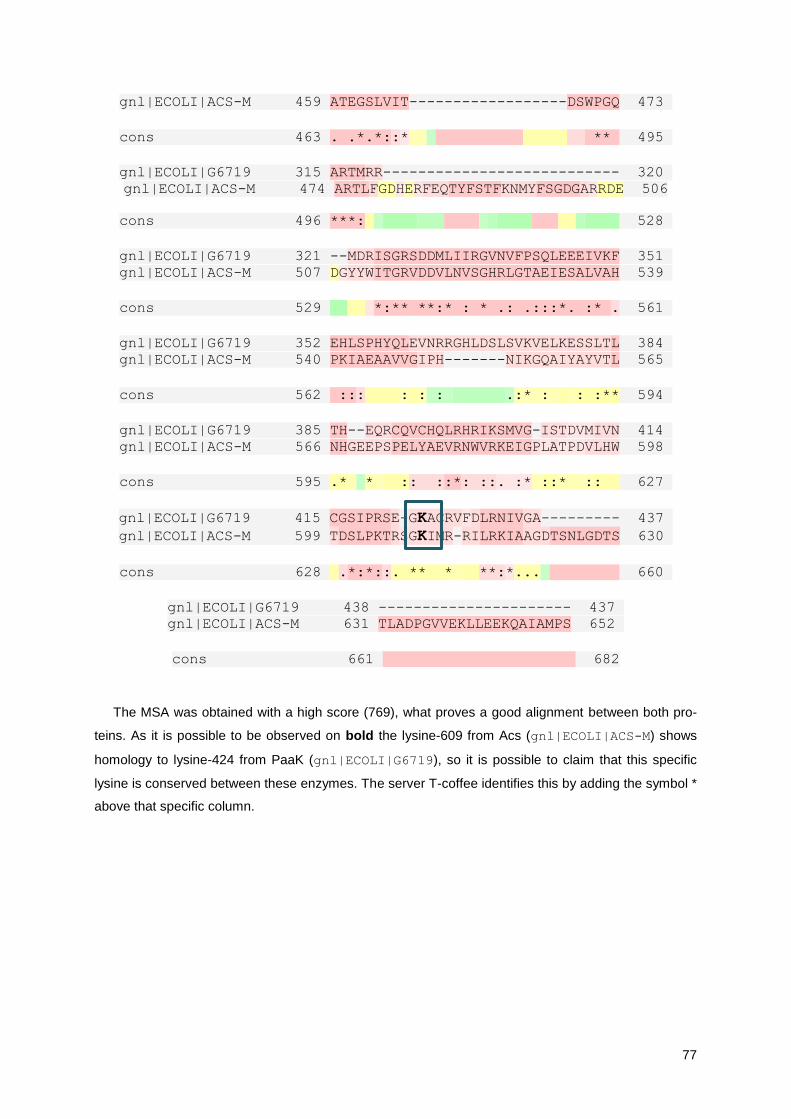
77
gnl|ECOLI|ACS-M 459 ATEGSLVIT------------------DSWPGQ 473
cons 463 . .*.*::* ** 495
gnl|ECOLI|G6719 315 ARTMRR--------------------------- 320 gnl|ECOLI|ACS-M 474 ARTLFGDHERFEQTYFSTFKNMYFSGDGARRDE 506
cons 496 ***: 528
gnl|ECOLI|G6719 321 --MDRISGRSDDMLIIRGVNVFPSQLEEEIVKF 351 gnl|ECOLI|ACS-M 507 DGYYWITGRVDDVLNVSGHRLGTAEIESALVAH 539
cons 529 *:** **:* : * .: .:::*. :* . 561
gnl|ECOLI|G6719 352 EHLSPHYQLEVNRRGHLDSLSVKVELKESSLTL 384 gnl|ECOLI|ACS-M 540 PKIAEAAVVGIPH-------NIKGQAIYAYVTL 565
cons 562 ::: : : : .:* : : :** 594
gnl|ECOLI|G6719 385 TH--EQRCQVCHQLRHRIKSMVG-ISTDVMIVN 414 gnl|ECOLI|ACS-M 566 NHGEEPSPELYAEVRNWVRKEIGPLATPDVLHW 598
cons 595 .* * :: ::*: ::. :* ::* :: 627
gnl|ECOLI|G6719 415 CGSIPRSE-GKACRVFDLRNIVGA--------- 437 gnl|ECOLI|ACS-M 599 TDSLPKTRSGKIMR-RILRKIAAGDTSNLGDTS 630
cons 628 .*:*::. ** * **:*... 660
gnl|ECOLI|G6719 438 ---------------------- 437 gnl|ECOLI|ACS-M 631 TLADPGVVEKLLEEKQAIAMPS 652
cons 661 682
The MSA was obtained with a high score (769), what proves a good alignment between both pro-
teins. As it is possible to be observed on bold the lysine-609 from Acs (gnl|ECOLI|ACS-M) shows
homology to lysine-424 from PaaK (gnl|ECOLI|G6719), so it is possible to claim that this specific
lysine is conserved between these enzymes. The server T-coffee identifies this by adding the symbol *
above that specific column.

78
8 Appendix II – LC-MS/MS: More Information
In this appendix will be provided more detailed information about Liquid Chromatography-Tandem
Mass Spectrometry assay. The technique was described in the section 3.5.7.
Liquid chromatography (LC) coupled to tandem mass spectrometry is a powerful technique for the
analysis of peptides and proteins. This methodology combines efficient separations of biological mate-
rials and sensitive identification of the individual components by mass spectrometry. Therefore, it is a
fundamental platform for proteomic research, thanks to its unsurpassed capacity for accurate protein
identification and quantitation. In its simplest description a mass spectrometer measures the mass-to-
charge ratio (m/z) of ionized molecules [141], [142].
Peptides are introduced into a mass spectrometer at the ion source in the form of liquid solutions
(or solid mixtures), then de-solvated (or desorbed from the matrix) and transferred into the gas phase
as gas-phase ions. This ionization process is of primary importance since mass spectrometers can
only measure charged species. In the present work was used electrospray ionization (ESI) as the
method for ionizing peptides. The most common ion types are the b and the y ions, which denote
fragmentation at the amide bond with charge retention on the N or C terminus, respectively. In what
regards peptides acetylation, its identification by LC-MS considers the difference in mass between
peptide fragments sharing either a common N- or C-terminus essentially corresponds to the residue
mass of a single additional amino acid between the fragments. When that difference cannot be ac-
counted by the residue mass of lysine alone but rather by the mass of lysine plus a nominal mass shift
of 42.010 Da, the possibility of an acetylated rather than unmodified lysine becomes highly likely [142],
[143].
After electrophoresis and Blue Coomassi, staining samples were digested according the descrip-
tion correspondent to in-gel trypsin digestion. Otherwise, if the sample is in solution, it will suffer in-
solution trypsin digestion. At section 3.5.7 it was described briefly the trypsin digestion procedure, here
it is given more details.
In-gel Trypsin Digestion
The bands were washed with milli-Q water and then with 25 mM ammonium bicarbonate buffer (pH
8.5) with 50% acetonitrile during 30 min at 37 C. After removing the supernatant, bands were dried
for 15 min using an Eppendorf 5301 vacuum evaporator, and then they were incubated with 50 μl of
25 mM ammonium bicarbonate buffer (pH 8.5) with 20 mM dithiothreitol (DTT) at 56 C for 20 min.
The supernatant was removed and samples were alkylated by adding 50 μl of 25 mM ammonium bi-
carbonate buffer (pH 8.5) with 100 mM iodoacetamide (IAA), during 30 min at room temperature, in
the dark. The supernatant was again removed and gel spots were washed, first with 25 mM ammo-
nium bicarbonate buffer (pH 8.5), and then with 25 mM ammonium bicarbonate buffer (pH 8.5) with
50% acetonitrile during 15 min at 37 C. After washing, spots were dried again and then incubated
with 25 mM ammonium bicarbonate buffer (pH 8.5) containing 0.5 μg of Trypsin Gold Proteomics

79
Grade (Promega Corporation) and 0.01 % ProteaseMax surfactant (Promega Corporation), during 10
min at 4 C. This surfactant enhances the trypsin digestion. Finally, samples were submitted to diges-
tion during 3 h at 37 C. The supernatant was collected in a new tube, and the spots were washed
with 50 μl of a solution containing 50% acetonitrile and 0.5% TFA and then with 50 μl of acetonitrile
during 30 min at 37 C. These washes enhanced the extraction of digested fragments from the gel
spots and both supernatants after washing were collected in the same tube and dried using the vacu-
um evaporator.
In-solution Trypsin Digestion
Samples were dissolved in 100 μl of 50 mM ammonium bicarbonate buffer (pH 8.5) with 0.01 %
ProteaseMax (Promega). This surfactant enhances the trypsin digestion. Protein samples were re-
duced with the addition of 20 mM DTT at 56 C for 20 min. Then, samples were alkylated by adding
100 mM IAA through 30 min at room temperature, in the dark. Finally, digestion was performed by
addition of 1 μg of Trypsin Gold Proteomics Grade (Promega) during 3 h at 37 C. Reaction was
stopped with 0.1% formic acid and filtered through 0.2 μm. Finally, samples were dried using an Ep-
pendorf Vacuum Concentrator model 5301.
Data analysis is made with the software Spectrum Mill. The Spectrum Mill score is based on a
points system: points are added for each peak assigned to an allowed fragment ion type for a candi-
date peptide sequence and different types of fragment ions are worth different points. This scoring
scheme is composed of three main components: the protein score, the peptide score and the Scored
Peak Intensity (SPI). The score value reflects the score based on signal strength. Besides the scores,
the SPI is an important attribute: it is a measure of how much of the spectrum is explained by the data-
base match. In Spectrum Mill, any spectrum with an SPI lower than 70% is questionable, because this
indicates a significant unassigned current that does not correspond to peptide fragment ions.
The protein score is obtained by adding the scores of the single peptides. A protein valid result is
considered for scores greater than 20. Sometimes, a score higher than 13 is enough for considering
valid a result, depending on the peptide results.
Table II-1 – Confidence criteria for peptide validation in Spectrum Mil.
Peptide Score SPI % Interpretation Confidence
> 10 > 70 Very likely to be valid Excellent
8-10 > 70 Likely to be valid Good
5-8 > 70 Further review, manual validation Modest
< 5 > 70 Little to no fragmentation Mediocre
< 5 < 70 Significant unassigned ion current Poor

80
Figure II-1 – LC-MS/MS spectrum of the peptide (R)AITQLILNLVEGSPIK(L) from ArnA identified from Figure 4-6.
The b fragments (red) and y fragments (blue) resulting from the fragmentation of this peptide are shown. Above
the peaks it is indicated the value of ion charge (z) and the ratio mass/charge (m/Z). At the top it is shown the
peptide analysed and the position of b and y fragments.
Figure II-2 – LC-MS/MS spectrum of the peptide (K)AIAQVGTISANSDETVGK(L) from GroEL 60 identified from
Figure 4-6. The b fragments (red) and y fragments (blue) resulting from the fragmentation of this peptide are
shown. Above the peaks it is indicated the value of ion charge (z) and the ratio mass/charge (m/Z). At the top it is
shown the peptide analysed and the position of b and y fragments.
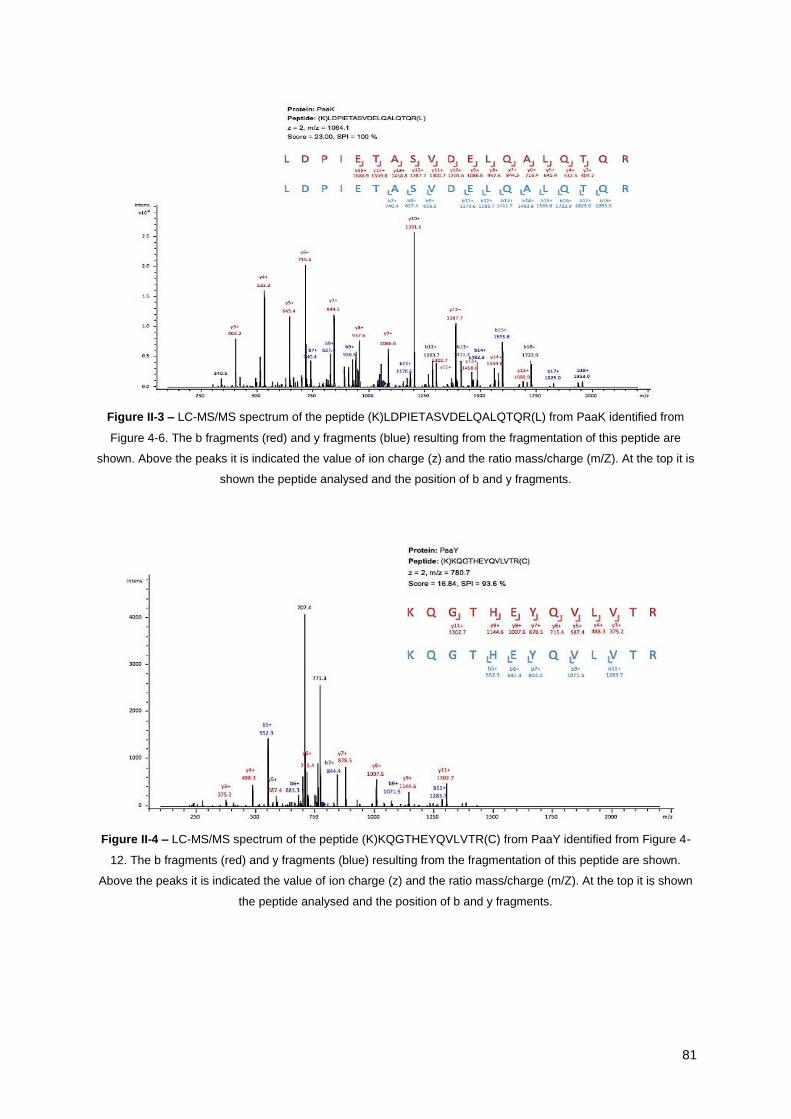
81
Figure II-3 – LC-MS/MS spectrum of the peptide (K)LDPIETASVDELQALQTQR(L) from PaaK identified from
Figure 4-6. The b fragments (red) and y fragments (blue) resulting from the fragmentation of this peptide are
shown. Above the peaks it is indicated the value of ion charge (z) and the ratio mass/charge (m/Z). At the top it is
shown the peptide analysed and the position of b and y fragments.
Figure II-4 – LC-MS/MS spectrum of the peptide (K)KQGTHEYQVLVTR(C) from PaaY identified from Figure 4-
12. The b fragments (red) and y fragments (blue) resulting from the fragmentation of this peptide are shown.
Above the peaks it is indicated the value of ion charge (z) and the ratio mass/charge (m/Z). At the top it is shown
the peptide analysed and the position of b and y fragments.

82
Figure II-5 – LC-MS/MS spectrum of the peptide (K)FNVEVVAIR(E) from FKBP-type protein identified from Fig-
ure 4-12. The b fragments (red) and y fragments (blue) resulting from the fragmentation of this peptide are shown.
Above the peaks it is indicated the value of ion charge (z) and the ratio mass/charge (m/Z). At the top it is shown
the peptide analysed and the position of b and y fragments.
Figure II-6 – LC-MS/MS spectrum of the peptide (K)AKAEMPANYLIVGSPAkAIR(E) from PaaY. The b fragments
(red) and y fragments (blue) resulting from the fragmentation of this peptide are shown. Above the peaks it is
indicated the value of ion charge (z) and the ratio mass/charge (m/Z). At the top it is shown the peptide analysed
and the position of b and y fragments. k* represents acetylated lysines and in this specific case corresponds to
Lys-139 from PaaY. The analysis of these ion series suggests mass increments of 42 Da for ion+ and 21 Da for
ion2+ compared with the unmodified peptides ion series what suggests lysine acetylation.

83
Figure II-7 – LC-MS/MS spectrum of the peptide (R)QLGGDASGcSLRVGVFGAEPWTQAmRk(E) from PaaK.
The b fragments (red) and y fragments (blue) resulting from the fragmentation of this peptide are shown. Above
the peaks it is indicated the value of ion charge (z) and the ratio mass/charge (m/Z). At the top it is shown the
peptide analysed and the position of b and y fragments. k* represents acetylated lysines and in this specific case
corresponds to Lys-424 from PaaK. The analysis of these ion series suggests mass increments of 42 Da for ion+
and 21 Da for ion2+ compared with the unmodified peptides ion series what suggests lysine acetylation.
Table II-2 – Peptides from reaction 3 that showed acetylated lysine. All the acetylated lysines correspond to Lys-
424 from PaaK. The Score and SPI have not a higher level of confidence, therefore was required manual valida-
tion, which is justified because all the peptides identify the same Lys.
z Score SPI Intensity m/z Modification Sequence
2 3.86 87.8 5.14x10⁴ 1469.10 k acetyl (R)QLGGDASGcSLRVGVFGAEPWTQAmRk(E)
3 6.08 41.0 1.30x10⁸ 991.22 k acetyl (R)HRIKSmVGISTDVMIVNCGSIPRSEGk(A)
3 5.99 40.3 9.95x10⁷ 991.34 k acetyl (R)HRIKSmVGISTDVMIVNCGSIPRSEGk(A)
3 5.61 44.8 9.15x10⁷ 991.21 k acetyl (R)HRIKSmVGISTDVMIVNCGSIPRSEGk(A)

84
Table II-3 – Peptide from reaction 7 that showed acetylated lysine. The lysine corresponds to Lys-153 from PaaY.
z Score SPI Intensity m/z Modification Sequence
2 6.74 72.9 1.55x10⁵ 1408.49 k acetyl (R)ELSEQELAWKkQGTHEYQVLVTR(C)
Table II-4 – Peptide from reaction 9 that showed acetylated lysine. The lysine corresponds to Lys-139 from PaaY.
z Score SPI Intensity m/z Modification Sequence
3 6.86 76.4 1.25x10⁵ 715.30 k acetyl (K)AKAEMPANYLIVGSPAkAIR(E)
Table II-5 – Peptide from reaction 10 that showed acetylated lysines. The lysines correspond to Lys-33, Lys-53,
Lys-122, Lys-139 and Lys-153 from PaaY.
z Score SPI Intensity m/z Modification Sequence
3 6.33 73.9 4.42x10⁵ 1569.41 k Acetyl MPIYQIDGLTPVVPEESFVHPTA
VLIGDVILGkGVYVGPNASLR(G)
3 5.84 73.5 1.95x10⁵ 1547.93 k Acetyl (R)IVVkDGANIQDNCVMHGFPEQD
TVVGEDGHIGHSAILHGCIIR(R)
3 5.19 70.3 2.51x10⁵ 1667.89 k Acetyl (R)NALVGMNAVVMDGAVIGENSIV
GASAFVkAKAEMPANYLIVGSPAkAIR(E)
3 5.08 73.9 4.60x10⁵ 1647.56 k Acetyl (K)AKAEMPANYLIVGSPAkAIREL
SEQELAWKkQGTHEYQVLVTR(C)
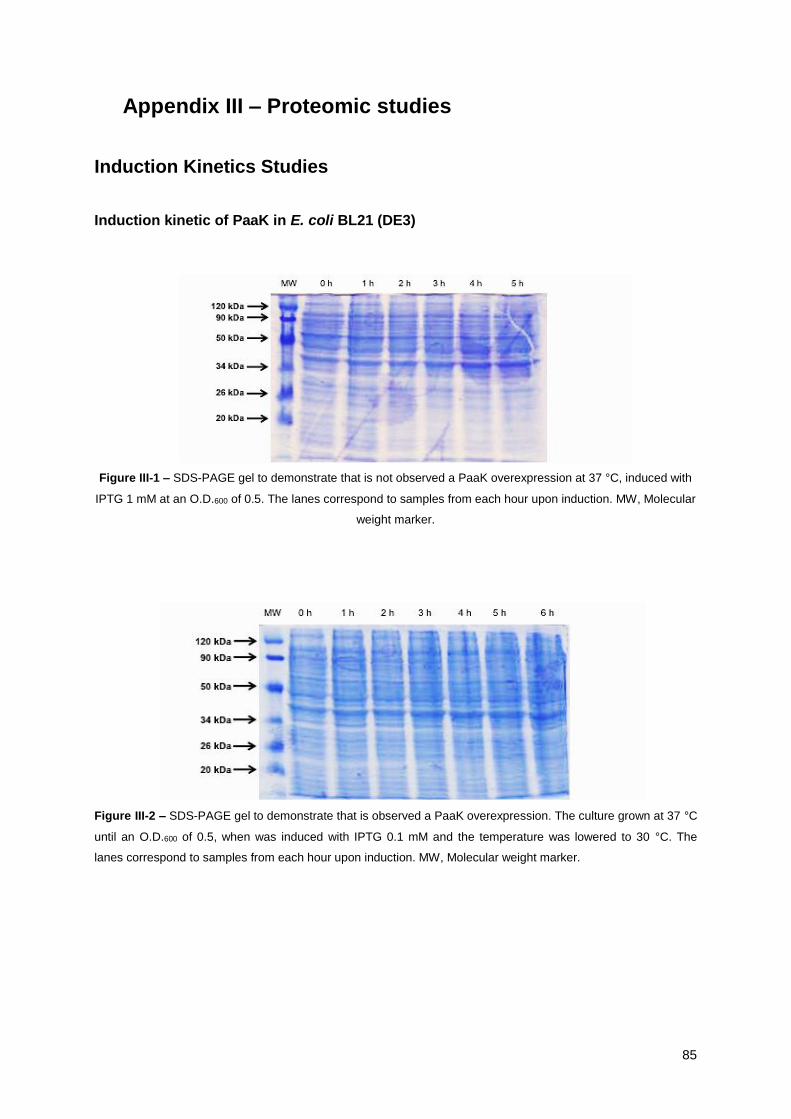
85
9 Appendix III – Proteomic studies
Induction Kinetics Studies
Induction kinetic of PaaK in E. coli BL21 (DE3)
Figure III-1 – SDS-PAGE gel to demonstrate that is not observed a PaaK overexpression at 37 °C, induced with
IPTG 1 mM at an O.D.600 of 0.5. The lanes correspond to samples from each hour upon induction. MW, Molecular
weight marker.
Figure III-2 – SDS-PAGE gel to demonstrate that is observed a PaaK overexpression. The culture grown at 37 °C
until an O.D.600 of 0.5, when was induced with IPTG 0.1 mM and the temperature was lowered to 30 °C. The
lanes correspond to samples from each hour upon induction. MW, Molecular weight marker.

86
Figure III-3 – SDS-PAGE gel to demonstrate that is observed a PaaK overexpression. The culture grown at 37 °C
until an O.D.600 of 0.5, when was induced with IPTG 10 mM and the temperature was lowered to 30 °C. The lanes
correspond to samples from each hour upon induction. MW, Molecular weight marker.
Induction kinetic of PaaK in E. coli BL21 (DE3) pLysS
Figure III-4 – SDS-PAGE gel to demonstrate that is observed a PaaK overexpression at 37 °C, induced with
IPTG 1 mM at an O.D.600 of 1.0. The lanes correspond to samples from each hour upon induction. MW, Molecular
weight marker.
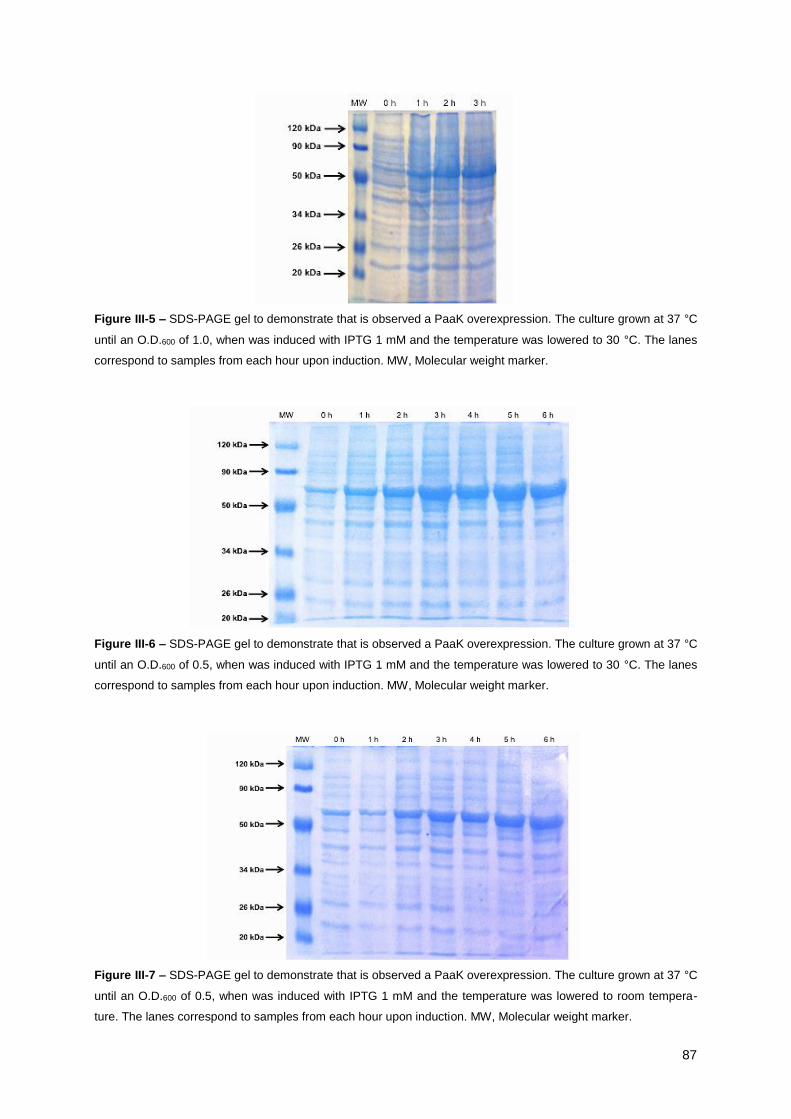
87
Figure III-5 – SDS-PAGE gel to demonstrate that is observed a PaaK overexpression. The culture grown at 37 °C
until an O.D.600 of 1.0, when was induced with IPTG 1 mM and the temperature was lowered to 30 °C. The lanes
correspond to samples from each hour upon induction. MW, Molecular weight marker.
Figure III-6 – SDS-PAGE gel to demonstrate that is observed a PaaK overexpression. The culture grown at 37 °C
until an O.D.600 of 0.5, when was induced with IPTG 1 mM and the temperature was lowered to 30 °C. The lanes
correspond to samples from each hour upon induction. MW, Molecular weight marker.
Figure III-7 – SDS-PAGE gel to demonstrate that is observed a PaaK overexpression. The culture grown at 37 °C
until an O.D.600 of 0.5, when was induced with IPTG 1 mM and the temperature was lowered to room tempera-
ture. The lanes correspond to samples from each hour upon induction. MW, Molecular weight marker.

88
10 Appendix IV – Bioinformatics: Protein Modelling
PaaK Model
The PaaK model for its monomer and dimer it is presented at section 4.6.1, but more details and
complementary information are given below.
Figure IV-1 – Cover of the multiple alignment by the server Phyre2. Red colour corresponds to modelling by
homology and blue colour is ab initio.
Table IV-1 – Selected templates to model PaaK by Phyre2 server.
Template
(PDB ID) Template Information
Confidence
(%)
Identity
(%)
C2y4oA
PDB header: Ligase
Molecule: Phenylacetate-Coenzyme A ligase
PDB Title: Crystal structure of paak2 in complex with
phenylacetyl adenylate
100 67
C2y27B
PDB header: Ligase
Molecule: Phenylacetate-Coenzyme A ligase
PDB Title: Crystal structure of paak1 in complex with
ATP from Burkholderia cenocepacia
100 63
From the 437 amino acid sequence of PaaK, 10 residues were modelled by ab initio (see Figure 4-
16). The ab initio method is used when there are no templates of structures that allow the prediction
by homology. Thus, the server tries to predict the protein conformation without the support of known
protein structures, i.e., de novo. This method is based on physicochemical laws and only uses the
protein primary sequence as input. It searches the conformation of the polypeptide chain that fits the
principle of energy minimization, once that is associated with the native structure. However, it still has
a limited capability to predict the protein structure. Nonetheless, ab initio modelling is unreliable, but in
PaaK model it only represents 2.3 % of the total prediction.
The quality of the model was analysed using the ProQ2. This bioinformatics tool is an algorithm to
assess the model quality that uses vector support to predict the local and the overall quality of the
model. ProQ2 is based on the z-score, which is a statistic parameter calculated according the average
and standard deviations of known crystallography models.

89
Figure IV-2 – Quality model analysis by ProQ2.
The Ramachandran analysis offers a distribution of acceptable values to the torsion angles of pep-
tide bonds (Phi and Psi). To the model built it was obtained that Leu208, Met204, Pro356, Lys378,
Glu422 are not allowed.
Figure IV-3 – Ramachandran analysis.
Figure IV-4 – Conserved domains on PaaK.
PaaK catalyses the first step in the aromatic degradation pathway, by converting phenylacetic acid
(PA) into phenylacetic-CoA (PA-CoA). Phenylacetic-CoA ligase has been found in proteobacteria as
well as gram positive prokaryotes. The enzyme is specifically induced after aerobic growth in a chemi-

90
cally defined medium containing PA or phenylalanine (Phe) as the sole carbon source. PaaK is a
member of adenylate-forming enzyme (AFE) family. However, sequence comparison reveals diver-
gent features of PaaK with respect to the superfamily, including a novel N-terminal sequence.
Figure IV-5 – Phenylacetic-CoA ligase domain sequence alignment. 2Y27_A, crystal structure of Paak1 in com-
plex with ATP from Burkholderia Cenocepacia; 2Y4O_A, crystal structure of Paak2 In complex with Phenylacetyl
Adenylate; 3QOV_A, crystal structure of a hypothetical Acyl-Coa Ligase (Bt_0428) from Bacteroides Thetaiota-
omicron; gi 13632704, PaaK from E. coli.
The second domain corresponds to Phenylacetate-coenzyme A ligase domain: Phenylacetate-CoA
ligase (PA-CoA ligase) catalyses the first step in aromatic catabolism of phenylacetic acid (PA) into
phenylacetyl-CoA (PA-CoA). Often located in a conserved gene cluster with enzymes involved in phe-
nylacetic acid activation, phenylacetate-CoA ligase has been found among the proteobacteria as well
as in gram-positive prokaryotes. In the B-subclass proteobacterium Azoarcus evansii, phenylacetate-
CoA ligase has been shown to be induced under aerobic and anaerobic growth conditions. It remains
unclear however, whether this induction is due to the same enzyme or to another isoenzyme restricted
to specific anaerobic growth conditions. This domain model may include others and be considered a
multidomain.

91
Figure IV-6 – PA-CoA ligase multidomain alignment. gi 671511; PA-CoA ligase from Azoarcus evansii; gi
27351154, PA-CoA ligase from Bradyrhizobium diazoefficiens USDA 110; gi 13632704, PA-CoA ligase from E.
coli; gi 499198837, PA-CoA ligase from Bacillus halodurans; gi 499191975, PA-CoA ligase from Deinococcus
radiodurans.
Taking into account the complete sequence of PaaK, this protein belongs to the class I superfamily
(Adenylate forming domain). This family includes acyl- and aryl-CoA ligases, as well as the adenyla-
tion domain of non-ribosomal peptide synthetases and firefly luciferases. The adenylate-forming en-
zymes catalyse an ATP-dependent two-step reaction to first activate a carboxylate substrate as an
adenylate and then transfer the carboxylate to the pantetheine group of either coenzyme A or an acyl-
carrier protein. The active site of the domain is located at the interface of a large N-terminal subdo-
main and a smaller C-terminal subdomain.

92
Figure IV-7– PaaK dimer model.
PaaK sequence was examined with the Predict Protein server [100]. It revealed a large number of
hydrophobic residues in the sequence end, what could explain the fact that the interactions between
the monomers are from hydrophobic character. This server also permits to determine the protein sub-
cellular localization and it determined that the protein is found in the cytoplasm.
Figure IV-8 – PaaK amino acid composition.
Figure IV-9 – Analysis of PaaK sequence by Predict Protein server (above) and chart with secondary structure
composition and solvent accessibility (below). From what concerns solvent accessibility, the intermediate factions
represents 10.3%; the exposed fraction 31.35% and the buried fractions is the larger one with 58.35%.

93
Figure IV-10 – Ramachandran diagram of PaaK dimer model developed with the Procheck server.
Table IV-2 – List of PaaK residues from specific sites [144].
List of PaaK residues
AMP Binding Site
Lys68, Ser93, Ser94, Gly95, Thr96, Thr97,
Phe141, Gly214, Ala215, Glu216, Pro217,
Asp236, Ile237, Tyr238, Gly239, Leu240, Ser241,
Glu242, Asp306, Ile324, Arg327, Lys424
Active Site
Lys68, Ser93, Ser94, Gly95, Thr96, Thr97,
Ala135, Tyr136, Gly137, Phe141, Gly163,
Gly164, Gln165, Thr166, Met182, Thr184,
Tyr187, Asn190, Gly214, Ala215, Glu216,
Pro217, Asp236, Ile237, Tyr238, Gly239, Leu240,
Ser241, Glu242, Asp306, Ile324, Arg327, Ile333,
Arg335, Gly336, Val337, Asn338, Leu368,
Gly405, Ile406, Ser407, Lys424
CoA Binding Site
Ala135, Tyr136, Gly137, Phe141, Gly163,
Gly164, Gln165, Thr166, Met182, Thr184,
Tyr187, Asn190, Ala215, Arg335, Val337,
Gly405, Ile406, Ser407
Acyl-activating Enzyme (AAE) Consensus
Motif
Ile90, Ser93, Ser94, Gly95, Thr96, Thr97, Gly98,
Pro100, Thr101
Homodimer Interface
Tyr75, Pro76, Phe77, Val87, Val88, Arg89, Ile90,
His91, Val102, Lys131, Tyr138, Gly139, Leu140,
Leu145, His148, Tyr149, Glu152, Ala156,
Thr157, Val158, Pro160, Met161, Leu172,
Asp175, Phe176

94
PaaY Model
Figure IV-11 – Cover of the multiple alignment by the server Phyre2. Red colour corresponds to modelling by
homology and blue colour is ab initio.
Table IV-3 – Selected templates by Phyre2 server to model PaaY.
Template
(PDB ID) Template Information
Confidence
(%)
Identity
(%)
d1v3wa
Fold: single-stranded left-handed beta-helix
Superfamily: trimeric LpxA-like enzymes
Family: gamma-carbonic anhydrase-like
100 37
c4n27D
PDB header: transferase
CPDB Molecule: bacterial transferase hexapeptide repeat
PDBTitle: x-ray structure of Brucella abortus rica
100 35
d1xhda
Fold: single-stranded left-handed beta-helix
Superfamily: trimeric LpxA-like enzymes
Family: gamma-carbonic anhydrase-like
100 31
c3r3rA
PDB header: transferase
PDB Molecule: ferripyochelin binding protein
PDBTitle: structure of the yrda ferripyochelin binding pro-
tein from Salmonella enterica
100 32
c3ixcA
PDB header: transferase
PDB Molecule: hexapeptide transferase family protein
PDBTitle: crystal structure of hexapeptide transferase
family protein from Anaplasma phagocytophilum
100 37
c3r1wA
PDB header: lyase
PDB Molecule: carbonic anhydrase
PDBTitle: crystal structure of a carbonic anhydrase from a
crude oil degrading psychrophilic library
100 34
c4mfgA
PDB header: transferase
PDB Molecule: putative acyltransferase
PDBTitle: 2.0 angstrom resolution crystal structure of puta-
tive carbonic anhydrase from Clostridium difficile
100 35
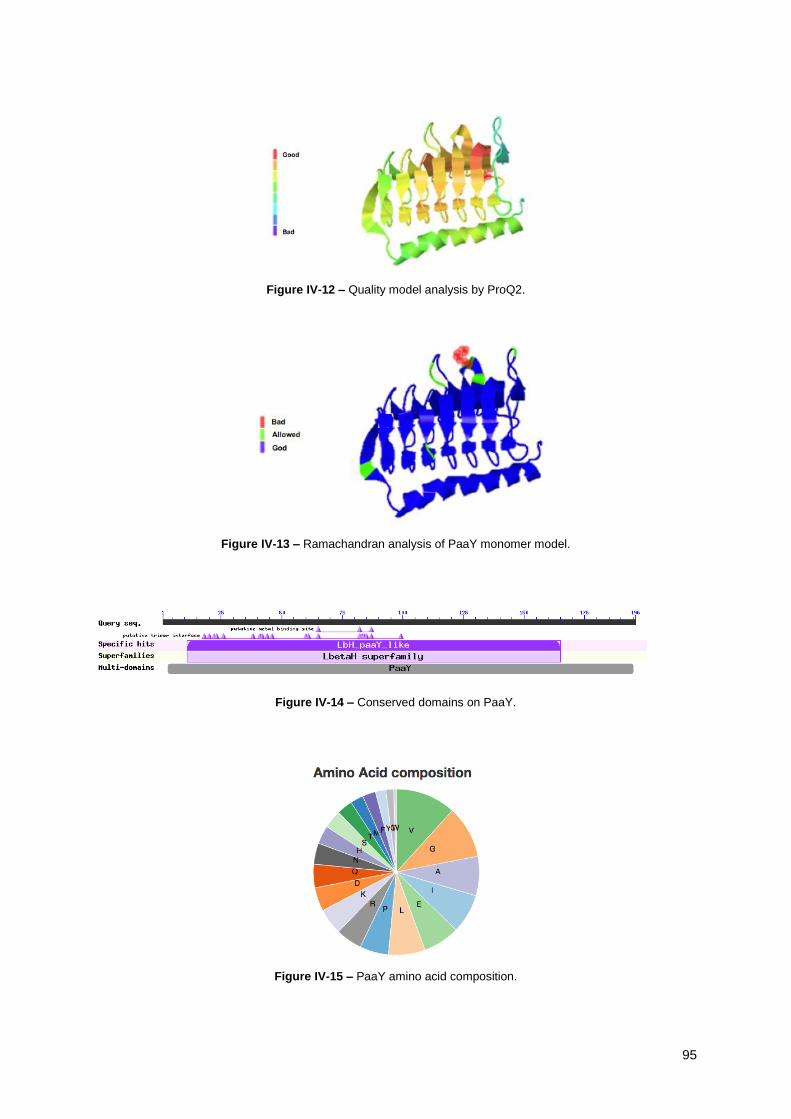
95
Figure IV-12 – Quality model analysis by ProQ2.
Figure IV-13 – Ramachandran analysis of PaaY monomer model.
Figure IV-14 – Conserved domains on PaaY.
Figure IV-15 – PaaY amino acid composition.

96
Figure IV-16 – Analysis of PaaY sequence by Predict Protein server (above) and chart with secondary structure
composition and solvent accessibility (below). From what concerns solvent accessibility, the intermediate factions
represents 11.22%; the exposed fraction 43.37% and the buried fractions 45.41%.
Figure IV-17 – Ramachandran diagram of PaaY trimer model developed with the Procheck server.

97
Table IV-4 – List of PaaY residues from specific sites [144].
List of PaaY residues
Binding Site His65, Phe67, His87, Met104, Lys122, Ser136,
Pro137
Figure IV-18 – Identification of the binding site at the PaaY trimer structure (blue).