purification and characterization of heparin lyases from ... · pdf filepurification and...
TRANSCRIPT

THE JOURNAL OF BIOLOGICAL CHEMISTRY (cl 1992 by The American Society for Biochemistry and Molecular Biology, Inc
Vol. 267, No. 34, Issue of December 5, pp. 24347-24355,1992 Printed in U. S. A.
Purification and Characterization of Heparin Lyases from Flavobacterium heparinurn”
(Received for publication, June 17, 1992)
Daniel L. Lohse and Robert J. Linhardtg From the Division of Medicinal and Natural Products Chemistry, College of Pharmacy, The University of Iowa, Iowa City, Iowa 52242
Heparin lyase I has been purified from Flavobacter- ium heparinum and has been partially characterized (Yang, V. C., Linhardt, R. J., Berstein, H., Cooney, C. L., and Langer, R. (1985) J. Biol. Chem. 260, 1849- 1857). There has been no report of the purification of the other polysaccharide lyases from this organism. Although all three of these heparinlheparan sulfate lyases are widely used, with the exception of heparin lyase I, there is no information on their purity or their physical and kinetic characteristics. The absence of pure heparin lyases and a lack of understanding of the optimal catalytic conditions and substrate specificity has stood in the way of the use of these enzymes as reagents for the specific depolymerization of heparin and heparan sulfate into oligosaccharides for structure and activity studies.
This paper describes a single, reproducible scheme to simultaneously purify all three of the heparin lyases from F. heparinum to apparent homogeneity. Heparin lyase I (heparinase, EC 4.2.2.7), heparin lyase I1 (no EC number), and heparin lyase I11 (heparitinase, EC 4.2.2.8) have molecular weights (by sodium dodecyl sulfate-polyacrylamide gel electrophoresis) and iso- electric points (by isoelectric focusing) of M, 42,800,
10.1, respectively. Their amino acid analyses and pep- tide maps demonstrate that while these proteins are different gene products they are closely related. The kinetic properties of the heparin lyases have been de- termined as well as the conditions to optimize their activity and stability. These data should improve the application of these important enzymes in the study of heparin and heparan sulfate.
PI 9.1-9.2, Mr 84,100, PI 8.9-9.1, Mr 70,800, PI 9.9-
Heparin and heparan sulfate represent a class of glycosa- minoglycans characterized by a linear polysaccharide of D- glucosamine ( 1 4 ) linked to hexuronic acid (1, 2). Much of the current understanding of heparin and heparan sulfate sequence has relied on studies of their biosynthesis (3-6). Recent efforts by our group (7 ,8 ) have focused on the appli- cation of enzymatic methods to depolymerize these complex polysaccharides into oligosaccharides that could then be struc- turally characterized (3, 7 ,9) .
Enzymatic methods for heparin and heparan sulfate depo- lymerization are very specific and require mild conditions giving oligosaccharide products that closely resemble the gly-
* This work was funded by National Institutes of Health Grant GM 38060. The costs of publication of this article were defrayed in part by the payment of page charges. This article must therefore be hereby marked “advertisement” in accordance with 18 U.S.C. Section 1734 solely to indicate this fact.
$ TO whom correspondence should be addressed.
cosaminoglycans from which they were derived. Two types of enzymes that degrade heparin and heparan sulfate glycosa- minoglycans are the polysaccharide lyases from prokaryotic sources that act through an eliminative mechanism (lo), and the glucuronidases (hydrolases) from eukaryotic sources that act through a hydrolytic mechanism.
Prokaryote degradation of heparin and heparan sulfate has primarily been studied using enzymes derived from Flauobac- terium heparinurn (11-14). This bacterial degradation begins with the action of three (or possibly more) eliminases. These heparin lyases produce oligosaccharides with A4.s-unsaturated uronic acid residues at their non-reducing termini. These eliminases probably act in concert to convert heparin and heparan sulfate to disaccharides. There are three major pol- ysaccharide lyases that are capable of acting on linkages present in heparin and heparan sulfate (15): heparin lyase I (heparinase), heparin lyase I1 (heparitinase 11), and heparin lyase I11 (heparitinase). Although the specificities of these enzymes are not completely known, studies using partially purified enzymes with heparin, heparan sulfate, and structur- ally characterized heparin oligosaccharides have led to an understanding of the linkages susceptible to enzymatic cleav- age (8,15,16). This paper focuses on the purification of these major Flavobacterial heparin lyases to apparent homogeneity and their physical-chemical and kinetic properties.
EXPERIMENTAL PROCEDURES
Materials
Enzyme assays and absorbance measurements were done on a UV- 160 spectrophotometer from Shimadzu connected to a Fisher Scien- tific Isotemp model 9100 refrigerated circulating water bath. Fermen- tations were performed in a 2-liter stirred tank fermenter from Applikon. Centrifugation was done on a Sorval RC-5 refrigerated centrifuge in a GSA rotor from Du Pont. HPLC’ used a LDC Milton- Roy Constametric IIIG pump, a Rheodyne 7125 injector, a Jule Linear Gradient Former, and an ISCO model UA-5 absorbance monitor with a 280-nm filter. The hydroxylapatite HPLC column 1 X 30 cm connected in series with a 1 X 5 cm guard column was from Regis, the Mono-S FPLC column was from Pharmacia LKB Biotechnology Inc., the C18 column was from Vydac, and the Bio-Si1 gel permeation HPLC column was from Bio-Rad. The capillary zone electrophoresis system and the silica capillaries were from Dionex. The Mini-Protein I1 electrophoresis chamber, a model 1405 horizontal electrophoresis cell, and a model 1420B power source were from Bio-Rad. The tube gel electrophoresis equipment was from E-C Apparatus Corp. The precast agarose IEF gels were from Iso-Labs, and the prestained
The abbreviations used are: HPLC, high performance liquid chro- matography; FPLC, fast protein liquid chromatography; IEF, isoelec- tric focusing; CAPS, 3-(cyclohexylamino)propanesulfonic acid; TES, 2 - 1 [2 - hydroxy - 1 , l - bis(hydroxymethyl)ethyl]amino]ethanesulfonic acid MOPS, 4-morpholinepropanesulfonic acid; HA, hydroxylapa- tite; GPC, gel permeation chromatography; PAGE, polyacrylamide gel electrophoresis; RP, reversed-phase; BTP, bis-Tris propane; BSA, bovine serum albumin.
24347
24348 Heparin Lyases from Flavobacterium heparinum
molecular weight markers and the Rapid CoomassieTM stain were from Diversified Biotech. The Bio-Gel HT hydroxylapatite was from Bio-Rad and the QAE-Sephadex was from Sigma. Pressure filtration units and 25- and 43-mm PM-10 filters were from Amicon. Heparin (porcine mucosal sodium salt) was from Celsus, heparan sulfate, dermatan sulfate, and chondroitin sulfate A, C, D, and E were from Seikagaku. Bovine serum albumin, lactose, protamine (free base), bromphenol blue, naphthol red, cytochrome c (bovine heart type VA), hyaluronic acid, CAPS, bis-Tris propane, Tris, HEPES, TES, dithi- othreitol, MOPS, mercaptoethanol, iodoacetamide, and trypsin were from Sigma. Coomassie reagent for protein assay was from Bio-Rad. All water used in reagents was deionized and distilled in glass.
Assays The spectrophotometer was adjusted to the optimum temperature
of the particular lyase being assayed. A 700-pl quartz microcuvette containing 400 pg of substrate in 50 mM sodium phosphate buffer (containing 100 mM sodium chloride for heparin lyase I) was ther- mally equilibrated. A measured quantity of lyase was added, bringing the final volume to 400 p1 and the cuvette was gently mixed. The microcuvette was then immediately returned to the spectrophotome- ter and the change of absorbance a t 232 nm was measured at 10-s intervals over 3 min. The activity was measured from the change of absorbance/unit time using an extinction coefficient of 3800 M" for products. The specific activity was then calculated by dividing the micromoles of product produced per minute by the milligrams of protein in the cuvette. The molecular weights used for heparin, heparan sulfate, and the chondroitin sulfates were 14,000,20,000 and 25,000, respectively (16). Protein concentration was measured by the Bradford assay (17) based on a bovine serum albumin standard curve.
Fermentation and Enzyme Recovery F. heparinum (18) (ATCC 13, 125, obtained from Prof. R. Langer,
Massachusetts Institutes of Technology, Cambridge, MA) was stored at -70 "C in a defined medium containing dimethyl sulfoxide (Me2SO) (19). The organism was grown in a 2-liter stirred tank fermenter on heparin as the sole carbon source in defined medium by the method of Galliher et al. (20). From 5 liters of fermentation broth, a n 80-g wet cell pellet was obtained by centrifugation for 15 min at 12,000 X g at 4 "C. This pellet was suspended in 500 ml of 10 mM sodium phosphate buffer a t pH 7.0 and 4 "C. Cell suspension (20 ml at a time) was placed into a 50-ml stainless steel cup and sonicated with cooling for 10 min at 100 watts using a 40% pulsed mode. The disrupted cells were centrifuged a t 12,500 X g for 30 min a t 4 "C and the pellet discarded. The 500 ml of supernatant, obtained by sonifi- cation and centrifugation, contained 16.3 mg/ml protein. Protamine free base (2.0 g) was dissolved in 20 ml of 10 mM sodium phosphate buffer, pH 7.0, and added dropwise with stirring to the 500 ml of supernatant. Centrifugation a t 10,000 x g, a t 4 "C for 20 min, removed the precipitated DNA and gave 510 ml of supernatant.
Purification of Heparin Lyases from F. heparinum Batch Hydroxylapatite Adsorption and Release-The 510 ml of
supernatant containing 15.6 mg/ml protein (used directly without freezing) was divided equally into four 250-ml polypropylene centri- fuge containers and placed in an ice bath. Dry hydroxylapatite (HA) (20 g) was added to each container, gently stirred, lightly compacted by centrifugation a t 1000 X g for 2 min a t 4 "C, and the supernatant was decanted away from the HA matrix. The HA-bound protein was then resuspended in buffers having increasing concentrations of sodium phosphate and sodium chloride and recompacted by centrif- ugation. The supernatants were again decanted away from the matrix and assayed for enzyme activity and protein concentration. The buffers used to wash the HA matrix were prepared by mixing a solution of 10 mM sodium phosphate buffer a t pH 6.8, with a solution of 250 mM sodium phosphate buffer a t pH 6.8, containing 500 mM sodium chloride in ratios of 6:0,51,4:2,33, 2:4, and 0:6 (v/v) at 4 "C. The protein supernatant solutions were placed in dialysis tubing having a molecular weight cut-off of 14,000 and dialyzed overnight a t 4 "C against 50 mM sodium phosphate buffer a t pH 7.0.
QAE-Sephadex Chromatography-Lyase activity purified by batch HA was used immediately without freezing. A quaternary ammonium ethyl (QAE)-Sephadex chromatography step was performed at 4 "C. Three batch HA-purified fractions (4:2, 3:3, and 2:4), having a total volume of 1.5 liters, containing more than 89% of the activity toward heparin and 88% of the activity toward heparan sulfate were consol- idated (1.81 mg/ml protein and 1.72 units/ml toward heparin and
2.16 units/ml toward heparan sulfate) and applied directly in equal portions to three columns (2.5 X 20 cm) containing 600 ml of QAE- Sephadex. The QAE-Sephadex columns had been previously equili- brated with 50 mM sodium phosphate buffer, pH 7.0, a t 4 "C. Each column was then washed with 1-column volume of 50 mM phosphate buffer, pH 7.0, a t 4 "C. The lyase activity passed through the columns without interaction were collected and combined. The 2.6 liters of eluent was then concentrated to 63 ml (containing 8.23 mg/ml of protein) by Amicon pressure filtration a t 60 psi and 4 "C using a 43- mm PM-10 membrane (10,000 molecular weight cut-off).
Hydroxylapatite HPLC-The 63 ml of QAE-Sephadex-purified and concentrated solution was divided into twelve 5-ml aliquots and stored a t -70 "C until needed. A 5-ml sample (43 mg of protein) was removed from the freezer, allowed to thaw at room temperature, and, using a 5-ml loop, injected onto a HA HPLC column. The HA-HPLC column had been equilibrated with 50 mM sodium phosphate buffer, pH 7.0. After loading the sample, the column was washed with 50 mM sodium phosphate buffer, pH 7.0, at 0.5 ml/min, for 20 min. A 60-ml linear gradient, from 50 mM sodium phosphate, pH 7.0, to 50 mM sodium phosphate buffer containing 750 mM sodium chloride, pH 7.0, was used to elute the column. The elution was monitored continuously at 280 nm. After the gradient was complete, the column was washed with 5.0 ml of 50 mM sodium phosphate containing 1 M sodium chloride, pH 7.0, to remove tightly bound proteins, and then re- equilibrated with the 50 mM sodium phosphate buffer, pH 7.0. This fractionation step was repeated with the 11 remaining aliquots. The fractions corresponding to heparin lyase I, heparin lyase 11, and heparin lyase 111 from each of the 12 fractionations were pooled, dialyzed against 20 volumes of 50 mM sodium phosphate buffer, pH 7.0, for 12 h a t 4 "C, and concentrated a t 60 psi and 4 "C using Amicon pressure filtration equipped with PM-10 membranes. The three lyase preparations were each divided into 1-ml aliquots and frozen a t
Mono-S FPLC of Heparin Lyases I and III-The concentrated heparin lyase I and heparin lyase 111 preparations, isolated from HA- HPLC, were taken from the -70 "C freezer, thawed at room temper- ature, and applied to a Mono-S FPLC HR 5/5 cation-exchange column equilibrated with 50 mM sodium phosphate buffer, pH 7.0. A portion of each lyase preparation, 350 pl containing 1.75 mg of protein, was injected and the column washed a t 1 ml/min for 5 min with 50 mM sodium phosphate buffer, pH 7.0, to elute non-interacting proteins. A linear gradient from 50 mM sodium phosphate buffer, pH 7.0, to 50 mM sodium phosphate containing 500 mM sodium chloride, pH 7.0, was used and the elution was monitored a t 280 nm. The active heparin lyase I and heparin lyase 111 fractions were dialyzed a t 4 "C against 200 mM sodium phosphate buffer, pH 7.0, for 12 h and concentrated using Amicon Pressure Filtration with a PM-10 mem- brane (molecular weight cut-off 10,000).
Gel Permeation HPLC-The heparin lyase I and 111 preparation obtained from Mono-S FPLC and the heparin lyase I1 preparation obtained from HA-HPLC were applied to a Bio-Si1 gel permeation chromatography (GPC) HPLC column (1 X 25 cm) that had been equilibrated with 200 mM sodium phosphate buffer, pH 7.0. Each lyase was injected (250-pl samples containing 800 pg of protein for heparin lyases I and 111; 20O-pl samples containing 1.5 mg of protein for heparin lyase II), eluted at a flow rate of 1 ml/min and absorbance at 280 nm was measured. This separation was repeated 5 times for heparin lyases 1-111. The active fractions were pooled together and assayed for lyase activity and protein concentration. Each heparin lyase was dialyzed against 50 mM sodium phosphate buffer, pH 7.0, concentrated a t 60 psi and 4 "C using pressure filtration with 25-mm PM-10 membranes (molecular weight cut-off lO,OOO), and subdivided into 10-pl aliquots and stored at -70 "C.
-70 "C.
Characterization of the Three Heparin Lyases Assessment of Purity by Electrophoresis-Discontinuous SDS-
PAGE was performed on the three heparin lyases using a modification of a procedure previously described by Laemmli (21). The gels were fixed with a 12% (w/v) trichloroacetic acid, rinsed with deionized, distilled water and stained with a Rapid Coomassie Stainl" solution, and destained.
IEF gel electrophoresis was run on pre-cast agarose gels (85 X 100 mm). Two electrode wicks were wetted with 1 M phosphoric acid (anolyte) and 1 M sodium hydroxide (catholyte). Electrophoresis was a t 5 watts for 5 min, then at 10 watts for 1 h until the voltage was constant a t 1200 V. The gel was immediately fixed in 15% aqueous trichloroacetic acid, blotted and rinsed with water, dried overnight,

Heparin Lyases from Flavobacterium heparinum 24349
stained by using Coomassie G-250, and destained. Continuous acid-urea gel electrophoresis was performed in 10%
polyacrylamide tube gels (22). Heparin lyase 1-111 samples (10 pg) were prepared in acetic acid-urea buffer containing glycerol and naphthol red as a tracking dye. Electrophoresis was a t a constant current of 2.5 mA/tube gel. The proteins were run toward the cathode for approximately 2 h, until the 100 Kg of cytochrome c standard (a brown band) was at the bottom of its tube. Staining and destaining were accomplished as described for SDS-PAGE.
Capillary zone electrophoresis on the three heparin lyases used a Dionex Capillary Electrophoresis System on a 375 pm X 70-cm capillary by a previously published method for protein analysis (23) in 20 mM CAPS containing 10 mM potassium chloride, pH 11.0, a t 20 kV at room temperature and detection was by absorbance a t 280 nm. Heparin lyase 1-111 samples (20 nl), each containing 2.74, 2.07, and 2.45 mg/ml, respectively, were analyzed.
Reuersed-phase HPLC-Reversed-phase (RP) HPLC used a Vydac CIS column (24). One nmol of each purified enzyme was injected onto the RP-HPLC column and eluted using a gradient from 0 to 80% acetonitrile in 120 min. These elution profiles a t 280 nm were used to guide the fractionation, and the ones with highest absorbance were used for amino acid compositional analysis and tryptic digest peptide mapping.
Tryptic Peptide Mapping-A nanomole of each RP-HPLC-frac- tionated enzyme was denatured in 50 p1 of 8 M urea containing 400 mM ammonium carbonate and 5 mM dithiothreitol a t 50 "C (24). After cooling to room temperature, the proteins were alkylated with 10 mM iodoacetamide for 15 min in the dark. The total reaction volume was 200 pl. Trypsin (4%, w/w) was added to each lyase solution, and the proteins were digested a t 37 "C for 24 h. Proteolysis was terminated by heating a t 65 "C for 2 min. The peptides formed in each digest were completely soluble and were injected onto RP- HPLC column and were eluted using a gradient from 0 to 80% acetonitrile in 120 min. The tryptic peptide maps were monitored by ultraviolet absorbance a t 280 nm.
Amino Acid Compositional and N-terminal Analysis-Amino acid compositional analysis was performed at the Biopolymers Laborato- ries at the Massachusetts Institute of Technology on an Applied Biosystems model 420/130 Derivatizer/Amino Acid Analyzer using phenylisothiocyanate pre-column derivatization chemistry. Gas- phase hydrolysis of samples was performed using a Waters Pic0 Tag Hydrolysis Workstation. In pre-column derivatization, free amino acids are coupled with phenylisothiocyanate to form phenylthiocar- bamyl amino acids that were detected a t 254 nm as they eluted from the reversed-phase column. Hydrolysis used 6 N hydrochloric acid, 0.1% phenol a t either 155 "C for 1 h or 100 "C for 22 b. Hydrolysis times of 36 and 48 h were also examined to ensure that the protein was being fully hydrolyzed with minimum destruction of amino acid residues. N-terminal analysis was done on 1 nmol of heparin lyase I- 111.
Affect of pH on Actiuity-The activity pH optimum for each of the lyases was obtained by using succinic acid (4.0-6.5), bis-tris propane (BTP)-HCI (6.5-9.0) and both Tris-HC1 and sodium phosphate (6.0- 7.5). Heparin lyase 1-111 assay solutions were made by diluting a 10- pl sample of the purified lyase (2-3 mg/ml protein concentration) with 90 pI of sodium phosphate buffer at 50 rnM, pH 7.0, and placed on ice until required for assay. The activities of each lyase (I acting on heparin, I1 acting on both heparin and heparan sulfate, and 111 acting on heparan sulfate) were then determined a t different pH values.
Buffer Selection for Optimum Actiuity-The buffer giving optimum activity for each heparin lyase was selected by testing buffers with buffering capacity near the pH optima calculated in the previous experiments. These buffers were: Tris-HCI, sodium phosphate, HEPES, MOPS, TES, and BTP-HCI. Each buffer was prepared at 50 mM, and its pH was adjusted with hydrochloric acid or sodium hydroxide to 6.9 for heparin lyase I1 acting on heparin, 7.15 for heparin lyase I, 7.3 for heparin lyase I1 acting on heparan sulfate, and 7.6 for heparin lyase 111. The heparin lyase assay solutions were made by diluting enzyme in 50 mM sodium phosphate buffer adjusted to the appropriate pH as previously described. Heparin lyase activity was determined in each buffer. Activity was assayed both immediately after addition to each buffer and following incubation for 24 h at 37 "C.
Affect of Divalent Metals and Added Salt on Activity-BTP-HC1 buffer (50 mM) was prepared containing either 10 mM calcium chlo- ride, 10 p M or 1 mM copper(I1) chloride, 10 p M and 1 mM mercury(I1) chloride, and 1 mM zinc(I1) chloride. Each solution was adjusted to
the optimum pH for the lyase being tested, and the activity of the heparin lyases was measured in the presence and absence of divalent metals.
The salt concentration for optimum activity was investigated. Sodium chloride, potassium chloride, and sodium and potassium acetate were used to differentiate between ionic strength and specific ion affects. Added salt concentrations varied between 0 and 500 mM and were prepared in 50 mM sodium phosphate buffer after which the pH was adjusted to each enzyme's optimum and the heparin lyase activity was measured.
Temperature for Optimum Actiuity-Temperature for optimum activity was determined for the heparin lyases a t their optimum pH in sodium phosphate buffer (the heparin lyase I assay buffer contained 100 mM sodium chloride) in 5" increments at temperatures between 15 and 55 "C. The temperature was adjusted in a temperature-regu- lated spectrophotometer and equilibrated for 10 min before the assay was started.
Temperature Stability Optima-Lyase assay stock solutions were prepared in the appropriate buffer (as previously described) and placed in water baths at the following temperatures: heparin lyase I a t 30 "C, heparin lyase I1 at 35 "C, and heparin lyase I11 at both 35 and 40 "C. Small aliquots were taken out a t various time intervals (1-22 h) to measure remaining enzyme activity.
Determination of Kinetic Constants-Michaelis-Menten constants were determined using the optimized conditions. The final absorbance value for total depolymerization was divided by 20 to find a value that represented 5% reaction completion. The purified lyase prepa- rations were diluted so that 5% of total depolymerization would be reached only at the end of a 3-min assay. The reaction velocities at specific molar concentrations for each lyase and their substrates were used for kinetic analysis using EZ-FIT hyperbolic curve-fitting pro- gram (25). Substrate solutions were prepared from 50 mg/ml heparin and 40 mg/ml for heparan sulfate stock solutions. These constants were determined a t 30 "C in 50 mM sodium phosphate buffer at pH 7.15 containing 100 mM sodium chloride for heparin lyase I and 35 "C for heparin lyase I1 in 50 mM sodium phosphate buffer at pH 7.3 for heparin and pH 6.9 for heparan sulfate and at 35 "C in 50 mM sodium phosphate buffer at pH 7.6 for heparin lyase 111.
Actiuity of the Heparin Lyases on Complex Polysaccharides-Each heparin lyase was added to a solution of complex polysaccharides (1 mg/ml) under optimized assay conditions, and the reaction was monitored at 232 nm for 30 min. The amount of purified lyase used was sufficient for complete depolymerization of heparin or heparan sulfate substrates within 30 min. The initial rate of depolymerization of each polysaccharide was measured, the reaction was then continued for 24 h, and the final level of polysaccharide depolymerization was assessed by measuring the final absorbance a t 232 nm and expressed as percent activity.
Stability of the Heparin Lyases-Heparin lyase stabilities toward freeze thawing and lyophilization were investigated using two excip- ients, bovine serum albumin (BSA) at 2 mg/ml and lactose a t 0.5 wt %. Each lyase was either dissolved in 50 mM sodium phosphate buffer, 50 mM sodium phosphate buffer containing 2 mg/ml BSA, or 50 mM sodium phosphate buffer containing 0.5% lactose at concentrations of 1-3 units/ml. These lyase solutions were then divided into 3 equal aliquots, and one of each was subjected to either freeze thawing, lyophilization, or retained as a control in an ice bath. The activities of heparin lyases 1-111 were determined in the presence and absence of excipients after: 1) brief storage a t 4 "C; 2) freezing at -70 "C and thawing; and 3) -70 "C freezing, lyophilization, and reconstituting with an equal volume of cold water.
RESULTS
Optimized cell lysis of F. heparinum by sonification was accomplished in 10 min at 100 watts using a 40% pulse mode without inactivation of the liberated enzyme. Protamine was added to remove nucleic acid. Batch HA adsorption and release was performed to enrich lyase activity yet failed to separate the three heparin lyase activities. A non-interacting chromatographic technique with QAE-Sephadex was used to further purify the heparin lyase activities. This technique gave good recovery of total heparin lyase activity while reduc- ing protein concentration. After concentration using Amicon pressure filtration, the sample was divided into 5-ml aliquots and stored at -70 "C. HA-HPLC used a linear sodium chloride

24350 Heparin Lyases from Flavobacterium heparinum
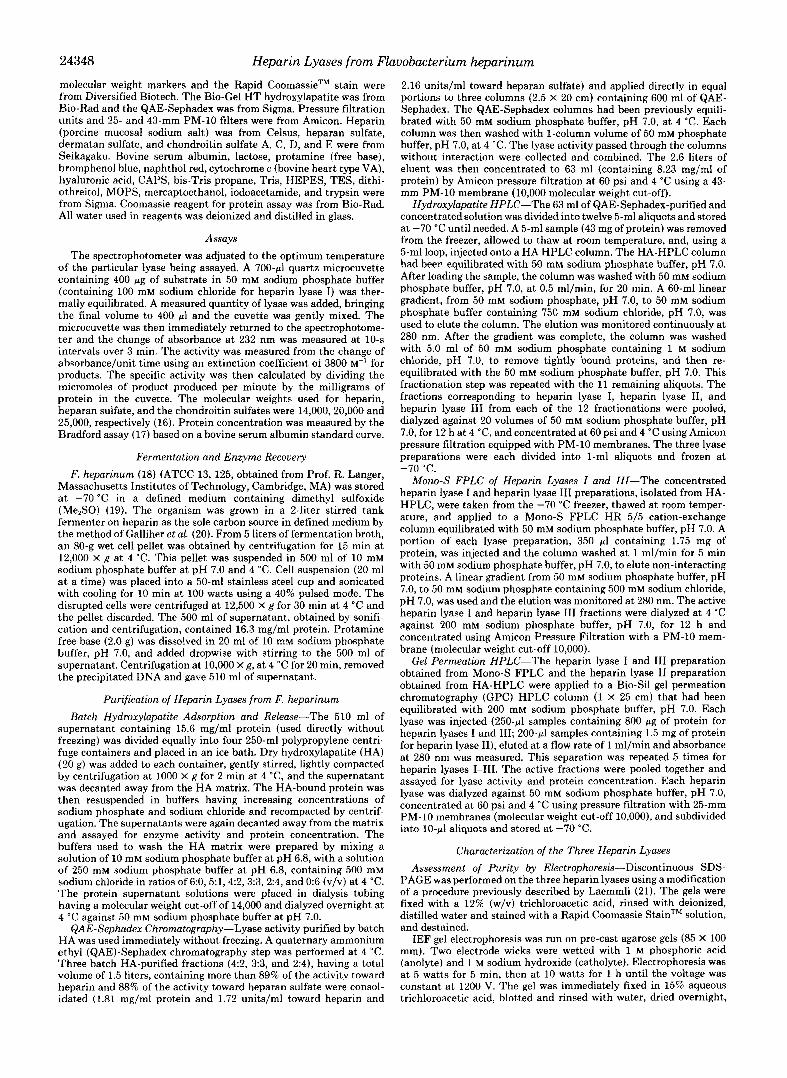
gradient and heparin lyases 1-111 were eluted at 330, 555. and 435 mM sodium chloride, respectively (Fig. 1). This separation was done 12 times, on 5-ml sample injections, and the chro- matograms were reproducible. Heparin lyases I and I11 were further purified by cation exchange FPLC (Fig. 2). In the final purification step, heparin lyases 1-111 were fractionated using GPC (Fig. 3).
The results obtained using this purification scheme for the three heparin lyases are summarized in Table I. Heparin lyase I was purified 3400-fold over the cell homogenate. The scheme provided an overall yield based on mass of 0.03%, a yield based on total activity recovery of 10.8%, and had a specific activity of 130 units/mg. Heparin lyase I1 was purified 5200- fold over the cell homogenate with an overall yield based on mass of 0.02%. This enzyme had a specific activity of 19 units/mg toward heparin with a 1.02% total activity recovery. This enzyme preparation also had a specific activity of 36.5 units/mg toward heparan sulfate, a 1.54% total activity recov- ery. Heparin lyase I11 was purified 5100-fold over the cell homogenate, a yield of based on mass of 0.02%, a yield based on total activity of 2.74%, and had a specific activity of 63.5 units/mg.
Characterization of Heparin Lyase Purity and Physical Properties-The physical, kinetic, and stability characteris- tics of the three heparin lyases were investigated. Discontin- uous SDS-PAGE (21) illustrated the three heparin lyases were apparently homogeneous. The molecular weights of hep- arin lyase 1-111 were estimated at 42,800, 84,100, and 70,800, respectively (Fig. 4). Nonreducing SDS-PAGE without p- mercaptoethanol revealed the same banding pattern (not shown) suggesting that no subunits were present. IEF was used to determine the isoelectric points of the three heparin lyases and to assess their purity. IEF using a variety of pH
70
60
50
40
30
20
10
0
Elution Volume (1 mL fractions)
FIG. 1. HA-HPLC fractionation of heparin lyases. The pro- tein (A2RO) is the solid line. The activity (unit/ml) toward heparin (0) and activity (unit/ml) toward heparan sulfate (m) are shown with cross-hatching to indicate the portion of the peaks that were collected.
Elution Volume (mL)
FIG. 2. Mono-S FPLC fractionation of heparin lyases. a, heparin lyase I, and b, heparin lyase 111. The arrow indicates the start, of the salt gradient elution, and the cross-hatching indicates the portion of the peaks that were collected.
0 . . . , . . . , . . ~ , . . . , . . . , . . . , . . . , . . . 0 2 4 6 8 10 12 14 16
Elution Volume (mL) FIG. 3. GPC-HPLC fractionation of heparin lyases. a, hepa-
rin lyase I; b, heparin lyase II; c, heparin lyase 111; and d, molecular weight standards (Mr) consisting of thyroglobulin (bovine, 670,000), gammaglobulin (158,000), ovalbumin (44,000), myoglobin (horse, 17,000), and cyanocobalamin (1350). The cross-hatching indicates the portion of the peaks that were collected.
TABLE I Purification summary of the heparin lysases
Purification step Protein Activity Unit/mg % activity
Heparin lyase I Cell homogenization
Batch-HA Protam. Ppt.
QAE Sepharose
Mono-S FPLC HA-HPLC
GPC-HPLC
Heparin lyase I1 acting on heparin
Cell homogenization Protam. Ppt. Batch-HA QAE Sepharose HA-HPLC GPC-HPLC
Heparin lyase I1 acting on heparan sulfate
Cell homogenization Protam. Ppt. Batch-HA QAE Sepharose HA-HPLC GPC-HPLC
Heparin lyase I11 Cell homogenization Protam. Ppt. Batch-HA QAE Sepharose
Mono-S FPLC HA-HPLC
GPC-HPLC
mg units
8150 66 7960 2890 2720 2580 519 2220
22.6 944 7.36 877 2.40 313
8150 66 7960 2890 2720 2580 519 2220
19.6 109 1.55 29.4
8150 91.5 7960 3680 2720 2580 519 2220
19.6 275 1.55 56.5
8150 91.5 7960 3680 2720 3240 519 2130 23.1 1010 8.41 348 1.59 101
8.12 X 10-~ 3.63 X 10" 9.50 X 10"
41.8 4.27
119 130
8.12 X 10-~ 3.63 X 10" 9.50 X 10"
4.27 5.53
19
1.13 X lo-' 4.63 X 10"
1.19 4.11
14 36.5
1.13 X lo-* 4.63 X 10"
1.19 4.11
43.6 41.4 63.5
100 89.4 76.8 32.7 30.4 10.8
100 89.4 76.8 3.8 1.02
100 88.0 57.8 7.46 1.54
100 88.0 57.8 27.4 9.45 2.74

Heparin Lyases from Flavobacterium heparinum 24351 A B
m
4 95.5
4 55.0 43.0
< 36.0
4 29 .O
4 18.4
4 124
FIG. 4. SDS-PAGE in a 12% discontinuous polyacrylamide gel under reducing conditions. Two pg each of heparin lyase I (lane a), heparin lyase I1 (lane b), heparin lyase 111 (lane c), and molecular weight standards (lane d ) . Shown to the right are the mass of the molecular weight standards in kDa.
gradients (pH 3-10,7-10, and 8.5-10.5) failed to give accurate PI values for the three lyases as they each migrated to a position very near the cathode. An agarose gel with a pH gradient of 9-11 was then used, focusing the three proteins below the band for cytochrome c standard (PI = 10.25). The PI values measured for heparin lyases 1-111 were 9.1-9.2,8.9- 9.1, and 9.9-10.1, respectively. Urea-acetic acid PAGE in tube gels (22) confirmed the homogeneity of the three heparin lyases (not shown). Capillary zone electrophoresis electro- pherograms (23) of each heparin lyase gave a single symmet- rical peak (not shown). Heparin lyases 1-111 had migration times of 12.7, 12.4, and 13.4 min, respectively.
RP-HPLC was used to desalt the three heparin lyases prior to amino acid compositional analysis and tryptic digestion for peptide mapping (24). Interestingly, each chromatogram shows a very tight doublet of peaks suggesting the presence of isoforms. Amino acid compositional analysis of the two heparin lyase I isoforms revealed the same amino acid com- position (24). The major isoform of heparin lyases 1-111 had retention times of 38.5,44.3, and 42.7 min, respectively.
The major RP-HPLC peak corresponding to each heparin lyase was treated exhaustively with trypsin to prepare peptide fragments. These peptide fragments were again analyzed using RP-HPLC. The peptide map of each lyase (not shown) was distinctly different although a few common peptide frag- ments were observed.
Amino acid analyses of the three heparin lyases are shown in Table 11. No N-terminal amino acid was detected in any of the three heparin lyases.
Characterization of Optimal Catalytic Activity for the Hep- arin Lyases-The optimal reaction conditions for each of the three heparin lyases was determined in a series of experi- ments. The first parameter examined was the pH optimum. A heparin concentration of 2.5 mg/ml for heparin lyases I and I1 and a heparan sulfate concentration of 1.0 mg/ml for heparin lyases I1 and I11 were assumed (and later demon- strated) to be saturating based on published values (14, 26) and preliminary experiments. A reaction temperature of 37 "C was initially chosen as an average of values reported in the literature (8,14,27). The temperature was later modified after the optimum for each lyase was determined.
The pH optima determined were 7.15 on heparin for lyase I, 7.3 on heparin and 6.9 on heparan sulfate for lyase 11, and 7.6 on heparan sulfate for lyase 111.
The buffer giving optimum activity for each heparin lyase
TABLE I1 Amino acid composition of the three heparin lyases
Assuming 387 amino acids for heparin lyase I (M, = 43,000), 727 amino acids for heparin lyase I1 (M, = 84,000), and 636 amino acids for heparin lyase 111 (M, = 70,000). Trp not reported.
Amino acid Heparin lyase I Heparin lyase I1 Heparin lyase 111
Asx 45 91 95 Glx 36 62 67 Ser 24 37 38 G ~ Y 30 101 50 His 6 14 13 Arg 13 37 35 Thr 20 35 25 Ala 26 55 52 Pro 20 40 35 TY 27 54 37 Val 18 44 37 Met 2 15 7 Ile 20 31 24 Leu 17 53 42 Phe 17 35 36 LYS 47 47 40 CYS 2 3 0
was selected using six different buffers each adjusted to the optimum pH for the enzyme and substrate being studied. Heparin lyase I showed similar initial reaction velocities in Tris-HC1 and BTP-HC1, intermediate activity in sodium phosphate, and reduced activity in MOPS, TES, and HEPES. After incubation in each buffer at 37 "C for 24 h, the activity was reduced to 1-20% of its initial value. Heparin lyase I incubated in MOPS, TES, and HEPES retained the most activity. Heparin lyase I1 activity on heparin was remarkably similar in all six buffers. When acting on heparan sulfate, however, heparin lyase I1 also showed a marked reduction of activity in MOPS, TES, and HEPES. After incubation in each buffer, MOPS, TES, and HEPES were found to best protect heparin lyase I1 activity (30-70% retention of activity) toward both heparin and heparan sulfate. Heparin lyase I11 showed only slight differences in activity in the six buffers studied. MOPS and HEPES protected heparin lyase I11 activ- ity (15-30% retention of activity) following incubation.
The affect of calcium, copper(II), mercury(II), and zinc(I1) ions on heparin lyase initial reaction velocities were investi- gated based on prior literature (14, 28). BTP-HCI buffer (50 mM) was chosen because of its compatibility with these ions.
The ionic strength (0-500 mM) for optimum activity was investigated for each heparin lyase at its pH optimum in 50 mM sodium phosphate buffer. Sodium chloride, potassium chloride, sodium acetate, and potassium acetate gave compa- rable activities at the same ionic strength. Heparin lyase I showed increased activity in response to increased salt con- centrations,. with an optimum activity at 100 mM. Heparin lyases I1 and I11 each show a decrease in activity with increas- ing concentration of added salt. A t 400 mM of salt, the activity heparin lyase 1-111 were almost completely inhibited.
The temperature for optimum activity was determined for the heparin lyases in 50 mM sodium phosphate buffer at their optimum pH (with heparin lyase I containing 100 mM sodium chloride) using temperatures between 15 and 55 "C. The tem- peratures for maximum activity were 35 "C for heparin lyase I, 40 "C for heparin lyase I1 acting on both heparin and heparan sulfate, and 45 "C for heparin lyase 111. The temper- ature stability optima for the heparin lyases were established to ensure that thermal inactivation did not influence experi- ments aimed at determining the kinetic constants. Heparin lyases I and I11 (protein concentration of 650 ng/ml) showed an exponential decrease in activity. Heparin lyase I lost 80%

24352 Heparin Lyases from Flavobacterium heparinurn
of its activity in 5 h at 30 "C. Heparin lyase 111 lost 80% of its activity in 3.5 h and 0.5 h at 35 and 40 "C, respectively. Heparin lyase I1 (protein concentration 1-2 pg/ml) showed a much slower decay in activity, retaining 70% of its activity on both heparin and heparan sulfate after 25 h at 35 "C. All further studies on heparin lyase 1-111 used 30, 35, and 35 "C, respectively, to retain high activity while maintaining enzyme stability.
The heparin lyases showed <0.5% activity toward chon- droitin sulfate C and dermatan sulfate and no activity toward chondroitin sulfate A, D, and E. No hyaluronidase, glucuron- idase activity and <0.5% sulfatase activity was observed.
The specificity of the three heparin lyases was examined using their polysaccharide substrates. The initial rate and the final level of heparin and heparan sulfate depolymerization was measured. Heparin lyase 1-111 acted at an average of 7, 14, and 1 sites in the heparin polymer and 5, 25, and 20 sites in the heparan sulfate polymer, respectively. Heparin lyase I1 acted on heparan sulfate at 1.7 times the initial rate observed on heparin. Oligosaccharide maps (not shown), in which the oligosaccharide products are analyzed by strong anion-ex- change HPLC and gradient PAGE (8), were prepared for each heparin lyase acting on heparin and heparan sulfate (15). These data are consistent with the specificity for heparin lyase 1-111 shown in Fig. 5.
Determination of the Michaelis-Menten Constants for the Heparin Lyases-Michaelis-Menten constants were deter- mined using the optimum reaction conditions in experiments designed to calculate reaction velocities at each substrate concentration where 4 0 % had been consumed (Table 111).
Stability of Heparin Lyases-In the absence of excipient, heparin lyase I stored at 4 "C, after a single freeze-thawing and after freeze-drying, retained 50, 45, and 25% of its activ- ity, respectively. The addition of 2.0 mg/ml BSA enhanced storage stability, resulting in >85% retention of activity, as did the addition of 5% lactose, giving 40-80% retention of activity. Heparin lyase I1 retained >75% of its activity under all storage conditions, and the addition of BSA or lactose gave little additional stabilization. Heparin lyase 111 retains most of its activity during brief storage at 4 "C but lost 70-80% on freeze-thawing or freeze-drying. The presence of BSA in- creases the recovered activity by 20-25% but added lactose destabilizes heparin lyase 111.
DISCUSSION
Heparin lyases are prepared from F. heparinurn, a heparin- utilizing organism that also produces exoglycuronidases, sul-
foesterases, and sulfamidases that further act on the lyase- generated oligosaccharide products (27, 29). Several Bacteroi- des sp. (30, 31) also produce heparinases, however, these enzymes are not well characterized. A heparinase has also been purified to apparent homogeneity from an unidentified soil bacterium (32). This enzyme differs from those isolated in this study in its molecular weight (94,000), PI (9.2), amino acid composition and kinetic properties ( K , of 3.4 p~ and V,,, of 36.8 pmol/min, pH optimum of 7.6). Three heparin lyases, partially purified from Flauobacterium sp. Hp206, have molecular weights of 64,000, 100,000, and 72,000 (33), differ- ent from heparin lyase 1-111.
The heparin lyases of F. heparinurn are the most widely used and best studied (10). Linker and Hovingh (12) first separated these lyase activities, fractionating a crude lyase fraction into a heparinase (heparin lyase I) and a heparitinase (heparin lyase 111). Both activities were purified by 50-100- fold, but no physical characterization of these enzymes was performed. Although these lyase activities did not represent homogeneous proteins, important information on their sub- strate specificity was reported. The heparinase fraction re- quired the presence of both 0- and N-sulfation while the heparitinase fractions required the absence of 0-sulfation and either N-acetylation or N-sulfation.
Dietrich and co-workers (12, 34, 35) and Ototani and Yos- izawa (36-39) isolated three lyases, a heparinase (heparin lyase I) and two heparitinases, from F. heparinurn. The hep- arinase acted on heparin to produce mainly trisulfated disac- charides (40, 41). Nader et al. (42) purified two heparitinases (called heparitinase I and 11, possibly corresponding to hepa- rin lyases I1 and 111, although no physical properties of these enzymes were presented) and characterized their substrate specificity toward heparin and heparan sulfate. Heparitinase I degraded both N-acetylated and N-sulfated heparan sulfate while heparitinase I1 degraded primarily N-sulfated heparan sulfate.
McLean and co-workers described the specificity of a par- tially purified heparinase I1 (43-45). Although no evidence of homogeneity or any physical properties for heparinase I1 were presented, the broad specificity on various polymeric sub- strates (43) clearly identifies the enzyme as heparin lyase I1 (8, 44).
Linhardt et al. (46) reported the purification of heparinase (heparin lyase I) to a single band on SDS-PAGE. Affinity purification of heparin lyase I on heparin-Sepharose failed apparently due to degradation of the column matrix. Suffi-
HEPARINMEPARAN SULFATE
&@ bb Qb Lo OX ' 0 OH Lo OX 0 Lo OX
OH OH
FIG. 5. Primary linkages within N"! Osq- NHY i ox NHY ; ai heparin and heparan sulfate cleaved by heparin lyases 1-111. Where X = SO; or H , Y = SO;, COCH3, or H, and n = 0, 1, 2, etc. I Heparin Lyase I Heparin Lyase III Heparin Lyase 11
ai
NHV NHY

Heparin Lyases from Flavobacterium heparinum 24353
TABLE 111 Kinetic constants of the purified heparin lyases
Heparin Substrate lyase L a p p , " Vm..".b kcJKmc
P M
I Heparin 17.8 -+ 1.50 219 k 3.48 8.82 I1 Heparin 57.7 2 6.56 16.7 k 0.555 0.405 11 Heparan sulfate 11.2 * 2.18 28.6 -+ 1.26 3.57
111 Heparan sulfate 29.4 2 3.16 141 -+ 3.88 5.59
"Values of the apparent K , and V,,, are derived from initial velocities obtained at eight or more concentrations (3-500 p M ) of either heparin or heparan sulfate. Protein concentrations for heparin lyases 1-111 were 80, 994 and 68 ng/ml, respectively. Standard errors of apparent K , and V,,, values indicate the precision of fitting the initial rates and corresponding concentrations of heparin or heparan sulfate to the Michaelis-Menten equation as described under "Mate- rials and Methods."
V,,, is expressed as pmollmin. mg protein. ' k,,,/K, is expressed as ( s . p ~ ) - ' .
cient quantities of pure heparin lyase I for detailed character- ization studies and amino acid analysis were first prepared by Yang et al. (27). Heparin lyase I was used to prepare polyclonal antibodies in rabbits for affinity purification of heparin lyase I, but excessively harsh conditions required to elute the en- zyme resulted in substantial loss of activity (47). Yang et al. (48) also described a rapid two-step method to prepare cata- lytically pure heparin lyase I.
Seikagaku Co. has recently reported the molecular weights of their commercial enzymes corresponding to heparin lyase 1-111 to be 43,000,84,000, and 70,000, respectively (49). These reports are in close agreement to the molecular weights we observed, but no details of their purification or characteriza- tion methods have been published.
Our purification releases heparin lyase activity from cell pellet by sonification. Protamine precipitation then increases both the total and specific activity by 42-fold without de- creases in protein concentration, presumably by removing the polyanionic nucleic acids that may competitively inhibit the heparin lyases. A batch HA purification step (27, 46, 48) greatly reduces the protein concentration and other contam- inating activities associated with heparin/heparan sulfate me- tabolism (27, 29, 48). QAE-Sephadex was used to remove contaminating acidic proteins.
HA-HPLC resolved the three lyase activities (Fig. 1). Chon- droitin/dermatan sulfate lyases, also found in this bacterium, elute from the HA-HPLC column at the end of the gradient just behind heparin lyase 11.
Gradient elution from a Mono-S FPLC column further purified heparin lyases I and I11 (Fig. 2). Heparin lyase I was recovered with excellent retention of activity and a large decrease in protein concentration. The specific activity of heparin lyase I11 did not improve using Mono-S FPLC, as it showed a substantial reduction in total activity. SDS-PAGE analysis, however, revealed an improvement in the purity of heparin lyase I11 following this step. Heparin lyase I1 was not purified by Mono-S FPLC, since when it was applied to the column it did not bind.
The final purification step for each of the three heparin lyases was GPC (Fig. 3). The molecular weights of heparin lyases 1-111 were estimated by GPC at 40,700, 140,800, and 50,190, respectively. Following GPC each heparin lyase prep- aration was shown homogeneous by SDS-PAGE, acid-urea PAGE (22), IEF, and Capillary zone electrophoresis (23). The molecular weights estimated by SDS-PAGE from heparin lyases 1-111 were 42,800,84,100, and 70,800, respectively. The molecular weight for heparin lyase I1 measured by SDS-PAGE is substantially lower than that afforded by GPC perhaps due
to the formation of non-covalent dimers in the absence of detergent. The molecular weight of heparin lyase I is in agreement with the 42,900 by GPC and 42,700 by SDS-PAGE reported by Yang et al. (27). The PI of heparin lyase I measured here is substantially higher than the reported value of 8.5 obtained using chromatofocusing (27).
Reverse-phase HPLC of each heparin lyase showed a very tight doublet of peaks. Amino acid analysis of both heparin lyase I peaks were identical (24) and similar to that reported by Yang et al. (27). The isoforms differ slightly in hydropho- bicity possibly due to some posttranslational modification such as glycosylation, phosphorylation, or methylation. Ad- ditional studies are required to understand this phenomenon. The amino acid compositions demonstrate that heparin lyases 1-111 are different gene products and that heparin lyases I and I11 are not merely posttranslationally processed from the larger heparin lyase 11.
Sasisekharan (24) was unable to obtain an N-terminal sequence for heparin lyase I. Our attempts a t N-terminal sequencing of heparin lyase 1-111 also failed presumably due to blocked N termini. Sasisekharan prepared peptide frag- ments of heparin lyase I, purified a peptide, and successfully obtained an internal sequence. From this sequence a comple- mentary nucleic acid probe was prepared and used to isolate the mRNA coding for heparin lyase I. The sequence of this mRNA was consistent with the amino acid analysis and molecular weight of the protein. The heparin lyase I gene has been recombined into Escherichia coli and enzyme-expressed. No physical or activity data are currently available for the cloned enzyme.
The lyases all contain a high amount of lysine that might contribute to their high isoelectric points. Computer model- ing, using the amino acid composition of heparin lyase I, gave a calculated isoelectric point of 9.33 (24) in agreement with the experimental values obtained by using isoelectric focusing.
The pH optimum calculated for heparin lyase I was 7.15. This value was higher than the pH of 6.5 reported by Yang et al. (27) and by Linker and co-workers (11, 28). Both groups assayed their lyase preparations using time periods of up to 6 h where thermal instability might become a factor. The max- imum time period used in this study was only 3 min. The pH optimum of heparin lyase I1 acting on heparan sulfate was 6.9. Seikagaku Co. (49) reports a pH optimum of 7.5 for heparin lyase I1 acting on heparan sulfate but no details were given about their assay procedure. The pH optimum for heparin lyase I11 was 7.6. Hovingh and Linker (28) as well as Dietrich and co-workers (14) reported the pH optimum of between 6.0 and 7.0 for this enzyme. Again, the assay time intervals used by both groups were up to 6 h, and the thermal instability might account for the differences between these values and ours.
Buffer selection studies showed the activity of heparin lyase I was reduced by approximately 50% in buffers containing sulfonic acid, possibly the result of competitive inhibition by the buffer. Surprisingly, Sasisekharan (24) reported that HEPES buffer gave higher heparin lyase I activity than sodium phosphate buffer. Our study uses a 5-fold higher buffer concentration and one-fourth the substrate concentration possibly explaining these differences. Decreases in heparin lyase I1 and I11 activity were also observed in sulfonate buffers. The lyases were incubated in the various buffers after 24 h at 37 "C to understand the affect of buffer on enzyme stability. In general, sulfonic acid-containing buffers (MOPS, TES, and HEPES) had a stabilizing effect on all of the lyases, with HEPES demonstrating the greatest stabilization. Linhardt et al. (46) showed that polyanethole sulfonic acid competitively

24354 Heparin Lyases from Flavobacterium heparinum
inhibits heparin lyase I. It is interesting to speculate that increased enzyme stability in sulfonate buffers might result from the binding of buffer to the enzyme active site. These results give some additional insight into the use of HEPES for use with heparin lyase I by Sasisekharan (24). His assays were performed over time periods of up to 6 h, where buffer stabilization of the enzyme might have been important. Fi- nally, heparin lyase I1 was substantially more stable toward storage in buffer at 35 "C than heparin lyases I and 111.
The activity of heparin lyase I is slightly reduced by 1 mM zinc and markedly reduced by 10 ~ L M and 1 mM mercury and 1 mM copper. Calcium at 10 mM increased activity by 30%. The activity of heparin lyase I1 acting on both heparin and heparan sulfate in the presence of divalent metal ions showed inhibition by all of the metals tested except for 10 PM copper. Even calcium resulted in dramatically reduced heparin lyase I1 activity. Heparin lyase I11 was activated (20%) by calcium, unaffected by copper and mercury (both at 10 PM), and inhibited by zinc, mercury, and copper (all at 1 mM). Other research groups (13, 14, 28, 49) have reported a variety of conflicting data on the activity of heparin lyases in the pres- ence of these metals.
In general, the addition of divalent metal ions decreased the activity of the heparin lyases. The conflicting data on the effects of divalent metal ions may arise from different assay conditions or differences in the purity of the enzymes that were studied. Because of this confusion, their addition to enzyme should be avoided. A major question that arises from this study is whether divalent metals interact with the enzyme or the substrate. The modest increases of heparin lyase I and I11 activity in the presence of calcium might be due to calcium complexing with substrate, resulting in a change in its sec- ondary structure, and increasing its enzymatic susceptibility.
Optimal activity of heparin lyase I was observed at an ionic strength of 100 mM, which is in agreement with the literature (27, 49). Our results showing a decrease in heparin lyases I1 and 111 activity with increasing salt concentrations agree with the results of Dietrich and co-workers (14) but are contrary t o results reported by Seikagaku Co. (49).
Our observed optimal activity temperatures of 35, 40, and 45 "C for heparin lyases 1-111, are comparable to literature values (14, 27, 28, 43, 45, 49). The slight differences in these values appear to reflect differences in the contribution of the thermal inactivation component (the result of the duration time of the assays performed by various researchers).
Thermal stability data for heparin lyase I is in agreement with that reported by Yang et al. (27). Seikagaku Co. report (49) of thermal instability for heparin lyase I1 at temperatures >30 "C and for heparin lyase 111 at temperatures >40 "C (49) are difficult to explain. Our data consistently shows heparin lyase I1 has good thermal stability while heparin lyase I11 is thermally unstable.
Table I11 summarizes the apparent Michaelis-Menten con- stants for heparin lyases 1-111 acting on heparin and heparan sulfate. Apparent K,,, values for heparin lyase I ranging from 0.3 to 42 p~ and a V,,, of 19.7 pmol/min/mg protein have been reported (16,27,46). An apparent K,,, of 5.7 PM and V,,, of 3.57 X pmol/min for a purified heparin lyase 111 acting on heparan sulfate have been reported (16). Differences in the kinetic constants obtained in the present study from those previously reported may be the result of variable assay con- ditions ( i e . buffer, pH, temperature, time, or the presence of impurities in the commercial enzyme preparations).
Heparin lyase I and I1 act on both heparin and heparan sulfate while heparin lyase I11 acts only on heparan sulfate. All three enzymes act endolytically, however, all cleavable
sites within the polymer may not be equally susceptible (52). The primary linkages within these polymeric substrates that are cleaved by each enzyme (Fig. 5) were deduced from oligo- saccharide mapping experiments. The specificity of pure hep- arin lyase 1-111 toward heparin and heparan sulfate were identical to that previously reported for their partially puri- fied, commercially prepared counterparts. Oligosaccharide substrates (i.e. tetrasaccharides and hexasaccharides) having equivalent sites are poor substrates (16). The V,,,,,/K,,, ob- served for heparin lyase I and 111 acting on tetrasaccharide substrates is only 0.01 to 1% of the V,,,/K,,, measured for the polymer substrates (16).
The action of heparin lyases 1-111 on dermatan and chon- droitin sulfates A-E were also studied. These substrates vary in position and degree of sulfation as well as the chirality of their uronic acid. The slight activity of these enzymes toward chondroitin sulfate C and dermatan sulfate suggested that either the heparin lyases are contaminated or that these substrates contained small amounts of heparin or heparan sulfate. To distinguish between these two possibilities, the reaction was followed for longer times. All of the activity was observed initially, after which the substrate became stable toward repeated challenges with fresh enzyme. This con- firmed that the small activity observed was the result of contaminated substrate (-1% heparin/heparan sulfate con- tamination in chondroitin sulfate C and dermatan sulfate) and not contaminated enzyme. None of the heparin lyases showed activity on hyaluronic acid. The failure of the heparin lyases to act on these other glycosaminoglycans clearly dem- onstrates both their specificity for heparin/heparan sulfate and the lack of contaminating lyase activity. No glycuronidase activity (51) was observed and <0.5% sulfatase activity (45) was detected in the purified lyases.
I t was necessary to study conditions for the optimal storage of the heparin lyases as the literature is replete with examples of the instability of these enzymes. The increased activity seen in the non-frozen, freeze-thawed, and lyophilized heparin lyase I samples that were stored in 2.0 mg/ml BSA suggest this is an excellent excipient for heparin lyase I. If added protein poses a problem then the addition of 5% lactose appears to be an acceptable substitute for stabilizing heparin lyase I. Heparin lyase I1 is a relatively stable enzyme, thus the addition of excipient is not essential for preserving its activity during storage. Heparin lyase I11 is very unstable toward freeze-thawing and lyophilization. The addition of 2 mg/ml BSA offers only modest protection of activity during storage.
Acknowledgments-We thank Dr. Ram Sasisekharan in Professor Langer's laboratory for obtaining the peptide maps and amino acid composition of the three heparin lyases and Kenan Gu for technical assistance.
REFERENCES 1.
3. 2.
4.
5. 6.
7.
8.
9.
10.
11 . 12.
Linhardt, R. J. (1991) Chem. Ind. 2,45-50 Casu B. (1985) Adu. Carbohydr. Chem. Biochem. 43,51-134 LinhHrdt, R. J., Wang, H. M., Loganathan, D., and Bae, J. H. (1992) J.
Lindahl, U., Feingold, D., and RodBn, L. (1986) Trends Biochem. Sci. 11 ,
Jacobsson, I., and Lindahl, U. (1980) J. Biol. Chem. 255,5094-5100 Lindahl, U., and Kjellen, L. (1987) in The Biology of Extracellular Matrix
Proteodvcans (Wipht. T. N.. and Mecham. R.. eds) UU. 59-104. Academic
Biol. Chem. 267,2380-2387
221-225
Press,h"ew York - '
Loganathan, D. (1988) Biochem. J. 2 5 4 , 781-787
Gallagher, J. T. (1990) Biochemist~29,2611-2617
Biochemistry 29,4362-4368
Biotech. 12 , 135-176
, . . . .
Linhardt, R. J., Rice, K. G., Kim, Y. S., Lohse, D. L., Wang, H. M., and
Linhardt, R. J., Turnbull, J. E., Wang, H. M., Loganathan, D., and
Loganathan, D., Wang, H. M., Mallls, L. M., and Linhardt, R. J. (1990)
Linhardt, R. J., Galliher, P. M., and Cooney, C. L. (1986) Appl. Biochem.
Linker, A., and Hovingh, P. (1965) J. B{ol. Chem. 240,3724-3728 Hovingh, P., and Linker, A. (1970) J. B~ol. Chem. 245,6170-6175

Heparin Lyases from Flavobacterium heparinum 24355 13. Dietrich, C. P., Silva, M. E., and Michelacci, Y. M. (1973) J. Biol. Chem. Clycoconjugates, September, 1989, Jerusalem
14. Silva, M. E., Dietrich, C. P., and Nader, H. B. (1976) Biochem. Biophys. 56,965-972
15. Lohse, D. L. (1992) The Heparin Lyases of Flavobacterium heparinum. Commun. 56,973-980
16. Rice, K. G., and Linhardt, R. J. (1989) Carbohydr. Res. 190,219-233 37. Ototani, N., and Yosizawa, Z. (1979) Carbohydr. Res. 70,295-306 17. Bradford. M. M. 11976) Anal. Riochem. 72. 248-254 38. Ototani, N.. Kikiuchi. M.. and Yosizawa. Z. (1981) Carbohvdr. Res. 88.
248,6408-6415 34. Silva, M. E., and Dietrich, C. P. (1974) Biochem. Biophys. Res. Commun.
Acta 437,129-141 35. Michelacci, Y. M., and Dietrich, C. P. (1974) Biochem. Biophys. Res.
Ph.D. thesis, The University of Iowa 36. Ototani, N., and Yosizawa, Z. (1978) J . Biochem. (Tokyo) 84, 1005-1008
~~~~ ~ ~~ ," ., ~~ ". 18. Payza, A.'N., and Korn, E. D. (1956) Nature 177,B-89 19. Zirnmermann, J. J., Oddie, K., Langer, R., and Gooney, C. L. (1991) Appl. 39. Ototani, N., and Yosizawa, Z. (1981) Proceedings of the 6th International
Biochem. Biotech. 30. 137-148 Symposium on Glycoconjugates, Tokyo, Japan Scientific Societies Press,
", --- -- - 291-303
. .
20. Galliher, P. M., Coonei, C. L,Langer, R. S., and Linhardt, R. J. (1981) Tokyo Appl. Enuiron. Microbiol. 41, 360-365 40. Dietrich, C. P., and Nader, H. B. (1974) Biochem. Biophys. Acta 343, 34-
21. Laernmli, U. K. (1970) Nature 227,680-685 44 22. panyim, s., and Chalkley, R. (1969) Arch. Biophys. 130, 337- 41. Dietrich, c. p., Nader, H. B., Britto, L. R., and Silva, M. E. (1971) Biochim.
9 ° C Bionhvs. Acta 237. 430-441 23. 24.
25. 26.
27.
28. 29.
30.
31.
32.
33.
Lauer, H. H., and McManigill, D. (1986) Anal. Chem. 58, 166-170 Sasisekharan, R. (1991) Cloning and Biochemical Characterization of Hep-
arinase from Flavobacterium heparinum. Ph.D. thesis, Harvard Univer- sity
a*"
Perella, F. W. (1988) A d . Biochem. 174,437-447 Yang, V., Morgan, L., McCarthy, M. T., and Langer, R. (1985) Carbohydr.
Yang, V. C., Linhardt, R. J., Berstein, H., Cooney, C. L., and Langer, R.
Hovingh, P., and Linker, A. (1970) J. Biol. Chem. 245,6170-6175 Galliher, P. M., Linhardt, R. J., Conway, L. J., Langer, R., and Cooney, C.
Saylers, A. A,, Vercellotti, J. R., West, S. E. H., and Wilkins, T. D. (1977)
Nakamura, T., Shibata, Y., and Fujimura, S. (1988) J. Clin. Microbiol. 26,
Bohmer, L. H., Pitout, M. J., Steyn, P. L., and Visser, L. (1990) J. Biol.
Yoshida, K., Miyazono, H., Tawada, A,, Kikuchi, H., Morikawa, K., and Tokuyasu, K. (1989) Proceedings of the 10th Annual Symposium of
Res. 143,294-299
(1985) J. Biol. Chem. 260,1849-1857
L. (1982) Eur. J . Appl. Microbiol. Biotechnol. 15, 252-257
Appl. Enuiron. Microbiol. 33, 319-322
1070-1071
Chern. 265, 13609-13617
42. Nader, H. B., Porcionatto, M. A,, Tersariol, 1. L. S., Pinhal, M. S., Oliveira, F. W., Moraes, C. T., and Dietrich, C. P. (1990) J. Biol. Chem. 265, 16807-16813
43. Moffat, C. F., McLean, M. W., Long, W. F., and Williamson, F. B. (1991) Eur. J. Biochem. 197, 449-459
44. McLean, M. W., Long, W. F., and Williamson, F. B. (1985) in Proceedings of the 8th International Symposium on Clycoconjugates, pp. 73-74, Hous-
45. McLean, M. W., Bruce, J. S., Long, W. F., and Williamson, F. B. (1984) ton, Praeger Publishers, NY
46. Linhardt, R. J., Cooney, C. L., Tapper, D., Zannetos, C. A., Larsen, A. K., Eur. J . Biochern. 145,607-615
47. Linhardt, R. J., Merchant, Z. M., and Persinger, D. W. (1985) Znt. J. and Langer, R. S. (1984) Appl. Biochem. Biotech. 9, 41-55
48. Yang, V. C., Bernstein, H., Cooney, C. L., and Langer, R. (1987) Appl. Biochern. 17, 1179-1183
49. Yoshida, K. (1991) International Symposium on Heparin and Related Pol- Blochem. Btotech. 16,35-50
50. Dietrich, C. P. (1969) Biochemistry 8, 2089-2094 ysacchorides, September 1-6, 1991, Uppsala, Sweden
51. Warnick, C. T., and Linker, A. (1972) Biochemistry 11, 568-572 52. Cohen, D. M. and Linhardt, R. J. (1990) Biopolymers 30, 733-741
~'~ . i ~ ~ "" -~ . , ." ."