purdue cooperative extension service ag outlook 2006
Post on 22-Dec-2015
217 views
TRANSCRIPT

PURDUE COOPERATIVE EXTENSION SERVICE
AG OUTLOOK 2006

2
U.S. Net Farm Income and Government82.5
71.8
13.3
21.4
0
10
20
30
40
50
60
70
80
90
85 86 87 88 89 90 91 92 93 94 95 96 97 98 99 0 1 2 3 4 5
Bill
ion
$
Net Farm Income
Government Payments
3
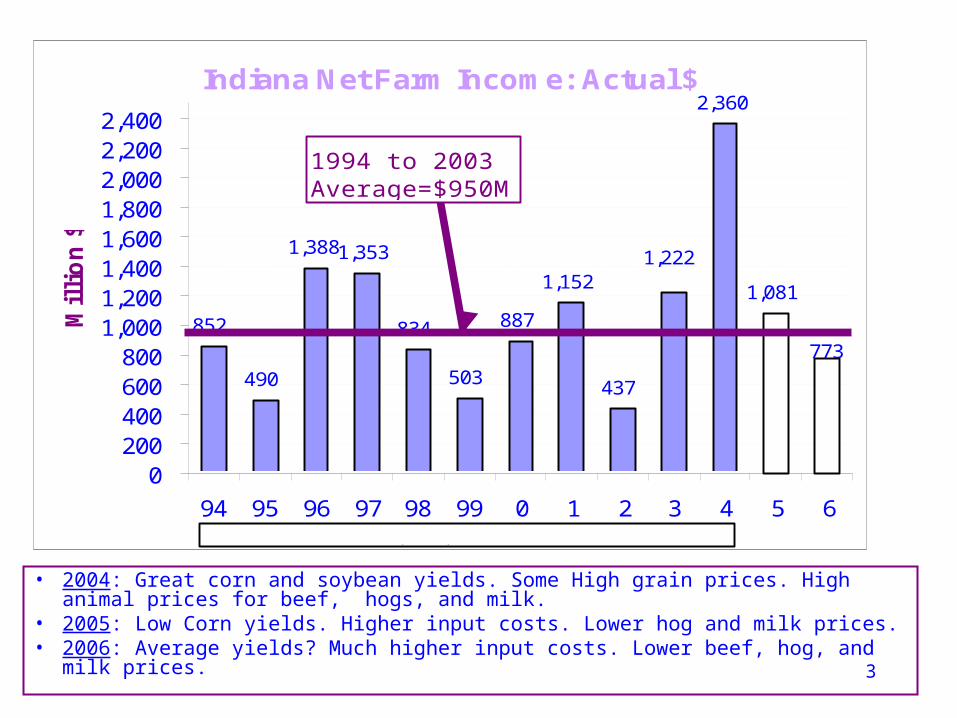
• 2004: Great corn and soybean yields. Some High grain prices. High animal prices for beef, hogs, and milk.
• 2005: Low Corn yields. Higher input costs. Lower hog and milk prices.• 2006: Average yields? Much higher input costs. Lower beef, hog, and milk prices.
Indiana Net Farm Income: Actual $
852
490
1,3881,353
834
503
887
1,152
437
2,360
1,081
773
1,222
0200400600800
1,0001,2001,4001,6001,8002,0002,2002,400
94 95 96 97 98 99 0 1 2 3 4 5 6
Mil
lio
n $
1994 to 2003 Average=$950M
Source 1994-2004 USDA; 2005, 2006 Estimates -P urdue

4
Forecast for 2006
Last 12 Months
Next 12 Months
GDP (Real) +3.6% +3.2% to 3.6%
CPI +3.0% (Jan-July 2005)
+2.5 to 3%
Unemployment 4.9% (August 05)
4.8%-5.0% (August 06)
3 Month Treasury 3.4% (Sept., 2005)
4.3% (August 06)
10 Year Treasury 4.2% (Sept., 2005)
5.3%(August 06)

5
Commercial Ag Loan Rates: Chicago Fed District
5
6
7
8
9
10
11
12
13
90 91 92 93 94 95 96 97 98 99 0 1 2 3 4 5
Inte
rest
Rat
e
Operating
Feeder Cattle
Real Estate
6
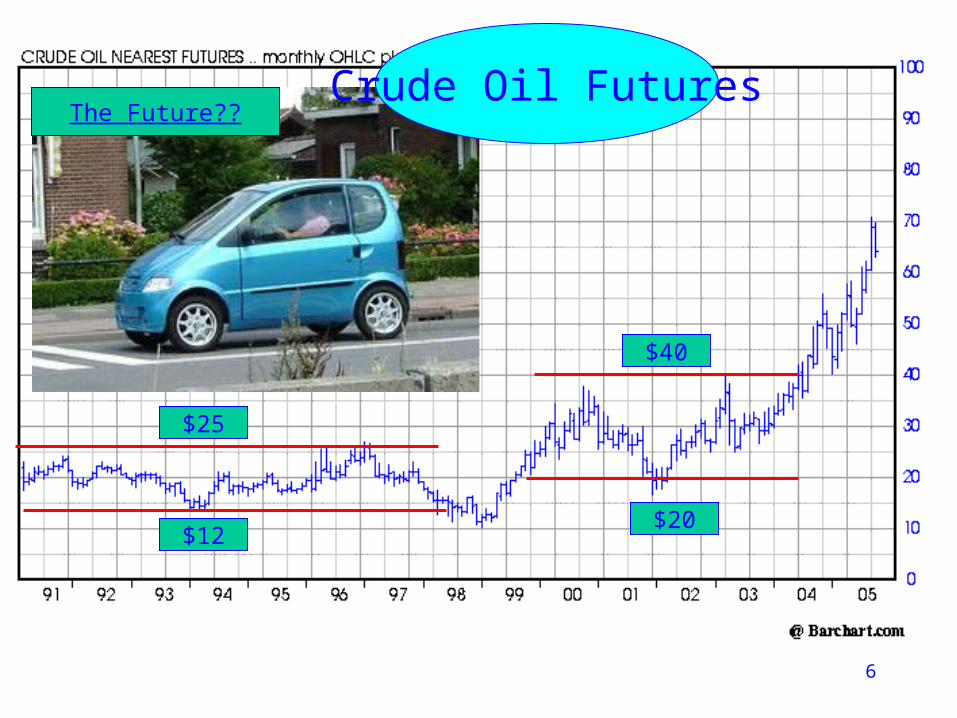
The Future??
$12
$40
$25
$20
Crude Oil Futures

7
17.3 FeetCurb Weight: 5,842
7.5 FeetCurb Weight: 1,388
Europe$5.00 Gasoline
U.S.$1.75 Gasoline

8
Government Provisions:
2005 to 2007 Crops ($/bu.)
Corn Soybeans Wheat
Target $2.63 (+.03) $5.80 3.92 (+.06)
Direct Payment $0.28 $0.44 $0.52
CCP Pivot $2.35 $5.36 $3.40
Maximum CCP $0.40 $0.36 $0.65
National Loan 1.95 (-.03) $5.00 2.75 (-.05)

9
Government Policy• Just two more years under current bill 2006 to 2007 crops.
• Review LDP rules for Corn:
– Today’s LDP is based on yesterday’s Posted County Price.
– 60-day MLG Lock-in rule (CCC-697).
• 2007 Farm Bill Driven By:– WTO: Cotton LDP’s are not legal. Impact soybeans, corn, and wheat as
well for 2007 Bill.
– Federal budget deficits. Will Congress cut payments to agriculture??
– Political Landscape: House Ag committee has changed leadership, Senate is more intact.
• Likely Implications for 2007 Farm Bill– Reduced spending for agriculture.
– Broad based programs like EQUIP and CSP. Less commodity based.
– Changes in the form and level of LDP payments.

10
Food Prices Lower than General Inflation!• Grocery store food prices up 1.4% in last year
much lower than the than 3.2% general inflation.
• Led by lower dairy and egg prices, and generally lower commodity prices after hurricanes, and BSE last year.
• Greater competition from food warehouses and super centers.
• Katrina: Higher coffee, bananas, chicken, seafood
• Over the next year:
– Restaurant prices +2% to 3%
– Food store prices +1% to 2%

11
U.S. Planted Acreage
40
50
60
70
80
90
80 82 84 86 88 90 92 94 96 98 00 2 4
Mill
ion
Acr
es
Corn Soybeans Wheat
2005:Corn + .9%Beans -2.8%Wheat -2.7%
12
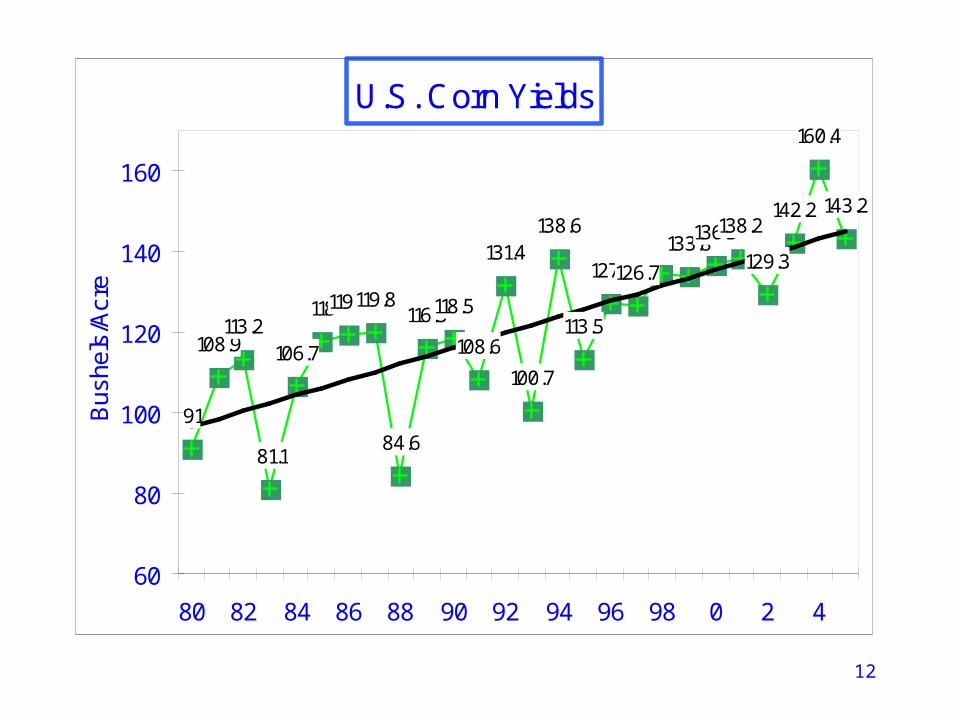
U.S. Corn Yields
91
108.9113.2
81.1
106.7
118119.3119.8
84.6
116.3118.5
108.6
131.4
100.7
138.6
113.5
127.1126.7133.8136.9138.2
129.3
142.2
160.4
143.2
60
80
100
120
140
160
80 82 84 86 88 90 92 94 96 98 0 2 4
Bus
hels
/Acr
e

13
U.S. Corn Production
6.64
8.128.24
4.17
7.67
8.88
8.23
7.13
4.93
7.537.93
7.48
9.48
6.34
10.05
7.40
9.239.21
9.769.43
9.929.51
8.97
10.09
11.81
10.64
3
4
5
6
7
8
9
10
11
80 82 84 86 88 90 92 94 96 98 0 2 4
Bill
ion
Bu
she
ls

14

15
Corn: USDA
9/12/2005
01/02 02/03 03/04 04/05 05/06
Carryin 1,899 1,596 1,087 958 2,125
Production 9,507 8,967 10,089 11,807 10,639
Total Supply 11,416 10,578 11,190 12,775 12,774
Feed & Residual 5,877 5,563 5,798 6,150 5,825
Food,Seed,&Ind 2,054 2,340 2,537 2,690 2,870
Export 1,889 1,588 1,897 1,810 2,000
Total Use 9,820 9,491 10,232 10,650 10,695
Ending Stocks 1,596 1,087 958 2,125 2,079
US Farm Price $1.97 $2.32 $2.42 $2.06 $1.70-$2.10
$1.90

16
Friday September 9, 2005
Corn Soybeans
Harvest to late-March
Harvest to June
Harvest to late-March
Harvest to June
Futures Premium $0.18 $0.24 $0.22 $0.26
Potential Basis Gain $0.15 $0.15 $0.15 $0.15
Expected Carry $0.33 $0.39 $0.37 $0.41
Interest -$0.04 -$0.06 -$0.14 -$0.22
Return After Interest: On-Farm $0.29 $0.33 $0.23 $0.19
Commercial Storage Charges* -0.22 -0.29 -0.22 -0.29
Returns to Commercial Storage $0.07 $0.04 $0.01 -$0.10
* Based on $.14 per bushel until December 31, and 2.5 cents per month after.

17
Corn Price Strategies• Harvest cash prices $1.65 to $1.80• LDP’s working-review FSA forms and mechanics
– Today’s LDP is on yesterday’s Posted County Price (PCP)– 60 day repayment lock-in provisions (CCC-697)
• Consider early LDP’s of $.35 to $.50 per bushel • Great returns to on-farm storage and some on Commercial:
– 32 to 35 cents to late-March– 36 to 40 cents into early-summer
• Late-spring or early-summer $1.95 to $2.10 • LDP, store, and earn the carry:
– LDP, store, and forward contract– LDP, store, and sell May or July futures (hedge)– LDP, store, and speculate on price rise – Do some of the first two on a sizable portion.
• Fewer corn acres in 2006, but better yields modest price improvement.

18
U.S. Soybean Yields
26.5
30.1
31.5
26.2
28.1
34.133.3
33.9
27.0
32.3
34.134.2
37.6
41.4
35.3
37.6
38.938.9
36.6
38.1
39.6
38.0
33.9
42.5
39.6
32.6
25
27
29
31
33
35
37
39
41
43
80 82 84 86 88 90 92 94 96 98 0 2 4
Bu
./acr
e

19
U.S.Soybean Production
2.45
3.14
2.86
1.0
1.2
1.4
1.6
1.8
2.0
2.2
2.4
2.6
2.8
3.0
3.2
80 82 84 86 88 90 92 94 96 98 0 2 4
Billi
on B
ushe
ls

20

21
Soybeans: USDA
9/12/2005
01/02 02/03 03/04 04/05 05/06
Carryin 248 208 178 112 295
Production 2,891 2,756 2,454 3,141 2,856
Total Supply 3,141 2,969 2,638 3,258 3,155
Seed & Residual 171 130 111 168 150
Crush 1,700 1,615 1,530 1,700 1,685
Exports 1,063 1,044 885 1,095 1,115
Total Use 2,933 2,791 2,526 2,963 2,950
Ending Stock 208 178 112 295 205
Farm Price $4.38 $5.40 $7.34 $5.75 $5.15-$6.05
$5.60

22
Soybean Pricing Strategies
• Harvest cash prices: $5.40 to $5.60• Post-harvest recovery back to $5.80 to $6.00 (by Thanksgiving)• Flat-to-modestly higher in Jan, Feb. March with normal South American
harvest?? Highs maybe $6.10 to $6.20 in late-spring• No LDP’s expected• Gross returns to storage: Store on-farm, maybe commercial
– 35 to 38 cents to late-March– 39 to 43 cents to late spring
• Strategies: - Store on-farm and speculate until December, then consider forward
pricing on hedging.- Consider commercial storage until Thanksgiving time.-Speculate for higher prices: Last four years cash increase has been:
- 2001 Crop = +$1.50/ bu. - 2002 Crop = +$1.25+ - 2003 Crop = +$3.00/bu. -2004 Crop = +$2.20/bu.
• With limited storage space, the Market favors corn storage over bean storage.
• More acres in 2006, higher yields, lower prices????
23
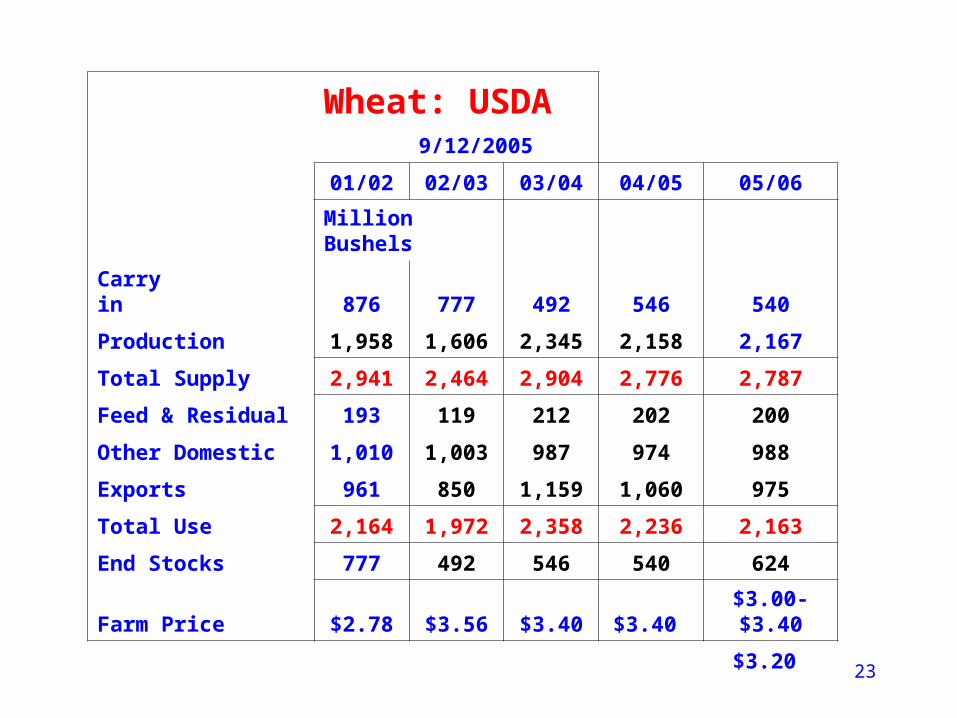
Wheat: USDA
9/12/2005
01/02 02/03 03/04 04/05 05/06
Million Bushels
Carryin 876 777 492 546 540
Production 1,958 1,606 2,345 2,158 2,167
Total Supply 2,941 2,464 2,904 2,776 2,787
Feed & Residual 193 119 212 202 200
Other Domestic 1,010 1,003 987 974 988
Exports 961 850 1,159 1,060 975
Total Use 2,164 1,972 2,358 2,236 2,163
End Stocks 777 492 546 540 624
Farm Price $2.78 $3.56 $3.40 $3.40 $3.00-$3.40
$3.20

24
Estimated Production CostsEstimated Variable Expenses Per Acre: 04, 05, 2006
$88$96
$191
$171
$106$114
$184
$207
128
226
205
105
$0
$25
$50
$75
$100
$125
$150
$175
$200
$225
$250
Cont. Corn Rot. Corn Rot. Beans Wheat
$/A
cre
2004
2005
2006
+ 12% + 8%
+ 11% + 9%

25
Annual Prices 2003 - 2006
86
100
71
46
74
62
105
49
736669
98100
81
$20
$30
$40
$50
$60
$70
$80
$90
$100
$110
ChoiceSteers
FeederSteers
Lambs Barrow&Gilts
Broilers Turkey Eggs
$/cw
t o
r ce
nts
/do
z
3 4 5 6
26
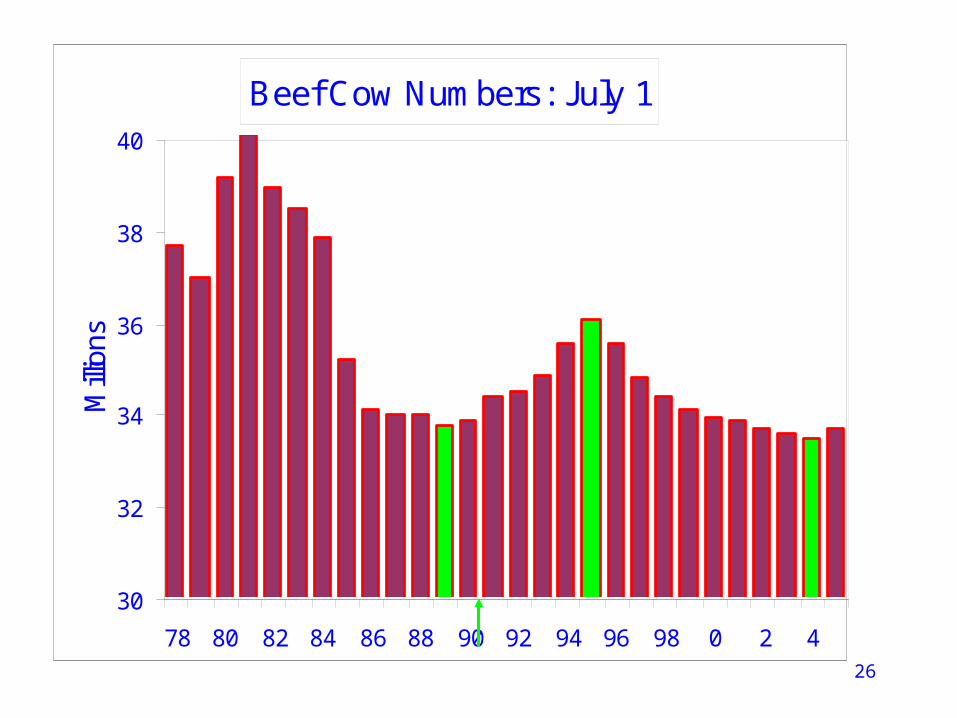
Beef Cow Numbers: July 1
30
32
34
36
38
40
78 80 82 84 86 88 90 92 94 96 98 0 2 4
Milli
ons

27
2004 I 5,838 -7.1% $82.16 $103.57 $111.50 $87.98
II 6,253 -9.4% $88.15 $116.47 $122.45 $104.58
III 6,360 -10.2% $83.58 $123.51 $129.12 $116.27
IV 6,097 2.1% $85.09 $112.94 $125.13 $110.19
Year 24,548 -6.4% $84.75 $114.12 $122.05 $104.76
2005 I 5,727 -1.9% $89.09 $122.70 $129.75 $104.09
II 6,195 -0.9% $87.96 $124.70 $136.05 $113.36
III 6,953 9.3% $79.54 $112.42 $120.40 $107.94
IV 6,392 4.8% $82.55 $111.74 $121.13 $109.62
Year 25,267 2.9% $84.79 $117.89 $126.83 $108.75
2006 I 6,134 7.1% $84.84 $120.09 $128.77 $103.89
II 6,686 7.9% $80.73 $109.14 $117.75 $106.06

28
U.S. All Milk Price 16.05
14.05
13.35
$11
$12
$13
$14
$15
$16
90 92 94 96 98 0 2 4 6
$/C
wt.
For 2006: Cow numbers + .5%Milk per cow +1.8%Production +2.3%
Milk prices lower, feed similar prices

29
The Numbers: June 1
Total Inventory +0.2%
Breeding +0.7%
Market +0.1%
Spring farrowings = 0 %
Summer farrowings - 0.1%
Fall farrowings - 0.3%

30
PRODUCTION
PRICES
Prod.%Chg
vs. Live Price
% Chg Vs.
Year Qtr Mill.#sYear-
ago Year Qtr $/cwt.Year-
ago
2004 Year 20,508 2.8% 2004 Year $52.51 33.1%
2005 I 5,136 0.1% 2005 I $51.92 17.5%
II 5,033 2.8% II $52.45 -4.5%
III 5,089 0.8% III $47.27 -16.5%
IV 5,501 1.2% IV $44.33 -18.4%
Year 20,758 1.2% Year $48.99 -6.7%
2006 I 5,190 1.1% 2006 I $46.75 -10.0%
II 5,045 0.2% II $50.42 -3.9%
Year 21,055 1.4% Year $45.62 -6.9%

31
Estimated Hog Returns ($/LiveCwt.)
1.43
-3.25
-7.03
-8.70
-5.05
1.532.38
-4.90
-0.87
6.34
14.3615.72
12.4712.38
5.885.00
6.767.20
-$10
-$6
-$2
$2
$6
$10
$14
$18
1 2 3 4 1 2 3 4 1 2 3 4 1 2 3 4 1 2
2 3 4 5 6
$/liv
eCw
t.

32
Indiana Land Values and Cash Rents
$500
$750
$1,000
$1,250
$1,500
$1,750
$2,000
$2,250
$2,500
$2,750
$3,000
75 77 79 81 83 85 87 89 91 93 95 97 99 1 3 5
$40
$60
$80
$100
$120
$140
$160
Average Land: $2,945 up 9.4%
Cash Rent: $126Up 3.3%
Outlook 2006:Land….up 4% to 6%Rents…up .5% to 1%

33
Indiana Avg. LandPrice/Earnings Ratio
10
12
14
16
18
20
22
24
75 77 79 81 83 85 87 89 91 93 95 97 99 1 3 5
Ra
tio
Value/Rent Ratio
Mean = 17.0
+1 & +2 Std Dev
34
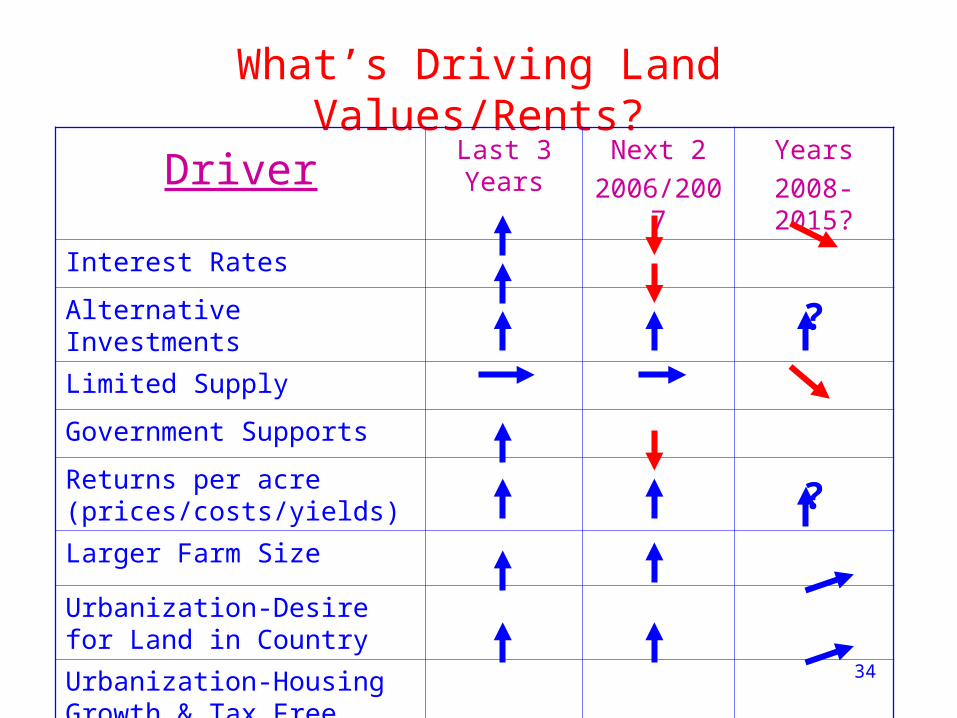
What’s Driving Land Values/Rents?
DriverLast 3 Years Next 2
2006/2007
Years
2008-2015?
Interest Rates
Alternative Investments ?Limited Supply
Government Supports
Returns per acre (prices/costs/yields) ?
Larger Farm Size
Urbanization-Desire for Land in Country
Urbanization-Housing Growth & Tax Free Exchanges (1031s)

35
Monday-Katrina
Tuesday-Flooding
Impact on Ohio River Corn Basis:-20 to -25 cents/bushel

36
Kokomo Corn Basis Impact:-4 to -6 cents/bushel

37
N.E. Indiana Corn Basis Impact:-2 to -3 cents/bushel