purchasing and control strategies: economic order
TRANSCRIPT

Purchasing and control strategies: Economic order quantities of oligopolistic
medium-scale enterprisesDutchque Van E. Dato-on
College of Business AdministrationUniversity of the [email protected]
ABSTRACT
Medium-scale enterprises have developed overtime and have performed a critical role in driving a country’s industrial transformation in most developed countries. A hardware establishment is a superb example of medium-scale endeavor. In the Philippines, particularly in Cebu City, the identified economic potentials of medium-scale enterprises slowly relegated due to challenges and constraints of a highly competitive oligopolistic market, product and demand variability including variances in purchasing strategies and internal control systems of most industries. One representation is Alliance Hardware, Inc. which desires to attain a 100% service level but the management has no idea as to the cost implications of the possible actions that they will take. This study intends to develop an appropriate inventory system so as to increase the company’s service level that will specifically cater to their needs as well as the needs of their customers. The research looks into establishing a standard reorder point and order quantity that will help the medium-scale hardware enterprises minimize inventory costs while minimizing or eliminating the presence of stock outs. Specifically, the study aims to optimize the service level using inventory management principles taking into account the company’s purchasing and internal control strategies in an oligopolistic environment. I analyzed all the data gathered and interpreted using industrial, operations and project management tools. Also, concepts such as reorder point, economic order quantity, safety stocks and service level were used. The computed standard reorder point and economic order quantity served as the basis for comparison in determining whether there is an improvement in the actual service level of Alliance Hardware, Inc. which serves as a good representation of a medium-scale venture. Finally, I then formulated solutions and alternatives that would help the company improve their inventory operations, thus, an increase in their level of customer service. Using the standard economic order quantity and reorder point that I have computed based on the data gathered would imply yearly savings of Php 838,355.10 for the company which is an enormous cutback on expenses especially for medium-scale enterprises in general.
Submitted: January 17, 2013
Keywords: inventory, reorder point, service level, stock outs
Accepted: July 11, 2013
U V J o u r n a l o f Re s e a rc h 2 0 1 3
brought to you by COREView metadata, citation and similar papers at core.ac.uk
provided by Journal of Research - University of the Visayas

I. INTRODUCTIONMedium-scale enterprises contribute to the
conception of wealth, employment and income generation, both in rural and urban areas, thus, ensuring a more reasonable income distribution. They also provide the economy with a constant supply of ideas, skills, and innovations necessary to promote competition and the efficient allocation of limited resources.
A hardware establishment is an excellent example of medium-scale endeavour. Characteristics include carrying out a network that includes over a hundred competitors in the market, employability rate of 60% having employing around over 100 where products sold are purchased by the company from other sources mostly in bulk and are stored in two or more warehouses. Moreover, a noted business asset size of around Php15M to Php100M yearly.
Alliance Hardware, Inc. (AHI) is located strategically in Cebu City, so it attracts a high number of customers. Also, the company has already developed strong business relationships with contractors and small hardware establishments outside the city. It is necessary for them to be able to cater the demands of their clients; otherwise, these clients would opt to go to the hardware’s competitors for their hardware needs. The management wants to determine their current service level and how they can optimize it so that they could further strategically plan on investing on expansion. In the year 2009, the company was able to record the highest stock out percentage of 3.85% of the annual sales amounting to Php 4,149,614.90. If this problem continues, customers of the hardware would decrease, which would then affect sales and profit.
The major problem that AHI encounters is the stock out of their merchandise. They are sometimes unable to provide for the demand requirements of some customers because they are already out of stock. This problem may lead to other problems such as dissatisfied customers and loss of sales.
It is, therefore, very important for the management to be able to easily monitor their
inventory. Predictable patterns of product use and sale can be determined by tracking inventory on a regular basis. The management can then base their ordering process on such predictions. They should be able to know which items to order, how much of these items to order, and when to order them, thus, under stock of inventory is minimized.
According to Tersine (1993), the two key factors considered essential for an effective inventory management is the proper control over inventory stock and the need of managers to assess the appropriate service level, which entails cost. Levels of inventory should be carefully scheduled in order to balance the carrying cost of inventory and the cost of implementing acceptable levels of customer service. Effective inventory management is a prime determining factor of a highly operative and efficient organization. Martin (2006) pointed out that inventories serve several functions to an organization. The most fundamental function includes meeting anticipated customer demand and most importantly to protect against stock out. Thus, it is crucial for the management to establish a track of its inventory system and to make decisions on when is the perfect time to reorder and how much of the items to order. Furthermore, it is stated that for the management to be effective, it must have a reliable system to keep track of inventory on order and on hand, a dependable demand forecast that includes the signal of the possible forecast error, knowledge of lead times including its variability effects, realistic estimates of inventory holding costs, shortage and ordering costs and a superior classification system of inventory items (Stevenson, 2011).
In actual, the demand requirement at any given time frame is uncertain, and when this happens, a natural question is, “At what level should the inventory be before the management of the hardware store could place an order?” The inventory level at which an order should be placed is referred to as the reorder point. Krajewski and Ritzman (2009) stated that the fundamental method of reorder point calculation involved the computation of the lead time and the daily usage rate. However, in real life situations, lead times and usage rates
UV Journal of Research118

come in uncertainties. On circumstances where the demand rate and/or lead time vary, the reorder level should be at a level high enough to provide to the demand requirements during lead time and also to provide a measure of safety stock at some point in order to partially neutralize the degree of uncertainty. Stevenson (2011) also mentioned that once the reorder point has been settled, it can proceed in ordering the quantity to: (1) minimize the total annual ordering cost; and (2) carry the cost of inventory.
In order to determine the most efficient order size for the company as well as finding a solution on the right amount to order while minimizing other inventory related costs, the economic order quantity should be established. Harris (1913) developed the economic order quantity (EOQ) formula which is the generally used method of computing the minimum annual cost for ordering and carrying an inventory. The EOQ computation assimilates the: (1) cost of placing an order; (2) the unit cost; (3) the yearly sales rate; and (4) the carrying cost of inventory.
The EOQ calculation may look moderately simple. However, the job of determining the exact data inputs to precisely denote the inventory as well as the operations is a bit daunting task. Overstated ordering and carrying costs are typical errors made in calculating for the EOQ. Piasecki (2011) identified two factors that influence the resulting EOQ which are: (1) Ordering Costs and (2) Carrying Costs. Ordering Costs are also identified as the purchase cost generally called the set up cost. It represents the totality of the fixed costs that are acquired each time an item is ordered. These costs are primarily linked with physical activities required to process the order. Carrying Costs are also called the holding costs. This refers to the cost related with having inventory on hand. It is mainly made up of the costs accompanying with the storage cost and the inventory investment. Martin (2006) stated that the primary components of carrying costs were (1) energy or cost of electricity; (2) space; (3) taxes; (4) material handling/storage equipment; (5) insurance; and (6) manpower. Stevenson (2011) established that the annual total cost (TC) associated
with carrying and ordering inventory when Q units are ordered each time is:
TC = Annual Carrying Cost + Annual Ordering Cost
In computing the total cost formula, Greene (1997) identified the three steps that should be taken into account. First, test the formula. The company should test the software design and system set up, run the program and then physically checks the results using items that are representative of the variations of the inventory. Second, results should be projected. It is essential to run a simulation to determine the overall short-term and long-term effects that the EOQ control and calculation will have on the warehouse space, operations and cash flows. If the projection shows a dropping level of inventory and an increasing order frequency, the process changes should be able to handle the increased activity. Lastly, EOQ should be maintained. It is encouraged that the values for Ordering Cost and Carrying Cost should be evaluated at least once per year.
A manager must cautiously weigh the cost of carrying safety stock in contrary to the reduction in stock out risk that it provides because holding safety stocks incurs additional expenses. Bragg (2011) stresses out that the customer service level is inversely proportional to the risk of stock out because as the risk of stock out decreases, the company’s customer service level increases. Service level relies directly on management’s judgment. This is a target for the proportion of demand that is met directly from stock or, the maximum acceptable probability that a demand cannot be met from stock. Typically an organization will specify a service level of 95%, suggesting that it will meet 95% of demand from stock, but will not meet the remaining 5% of the demand. In practice, there are several ways of measuring the service level, with common options including percentage of orders totally satisfied from stock, percentage of units demanded that are delivered from stock, percentage of units demanded that are delivered on time and the percentage of time there is stock available. The percentage units
D a t o - o n , D. V. E . 119
demanded that are met from stock is the most obvious measure of service level. This is particularly useful in organizations like retail shops and hardware stores where each customer generally demands a single unit, so it also represents the percentage satisfied customer. Landvater (1997) believed that the way to get a higher service level is to hold more safety stock, but the critical factor in setting the amount of safety stock is variation of lead time. If there is little variation, we only need low safety stock. If there is wide variation, we need extremely high safety stocks to get a high service level. In principle, widely varying demand would need an infinite safety stock to ensure a service level of 100%, but getting anywhere close to this can become prohibitively expensive. Often, they set different levels that reflect an item’s importance, but the choice of service is a decision made by managers. They must: (1) assess all information available; and (2) choose an appropriate service level (Muller, 2011).
Segregation of materials for selective control, called the A-B-C approach, is an essential tool for inventory management. A-B-C analysis is a simple and generally used method that is based on Pareto’s “80-20” law. The most universal style or method is to compute the demand in units then calculate the entire usage value at cost for every item (total cost of sales multiplied by the required units) for a particular period in the future. The A-B-C approach measures the cost significance of each item. “A” or high-valued items would be under the tightest control and the responsibility of the most experienced personnel. “B” or medium-valued items would be less tightly controlled. “C” items would be under simple physical controls such as the two-bin system with safety stocks. The plan provides impressive savings in materials costs. The A-B-C approach concentrates on items that need utmost importance or value. Because it is not practical to give equal attention to all items in inventory, stock items are classified and ranked on the basis of their descending importance based upon annual peso value of each item, thus providing a proportional value analysis. Also, the A-B-C list recommends what items to focus on to
control most of the inventory investment (Usry & Matz, 2009).
Forecasts form the basis for many management decisions. In particular, sales forecasts help the company to plan how much of the items could possibly sell or not. Thus, forecasts are crucial in keeping the inventory minimal. Martin (2006) clearly stated that with more accurate organization’s forecasts, the better equipped it will be to take advantage of future opportunities and reduce potential risks. A valuable strategy can be to work to develop short-term forecasts. Better short-term forecasts will not only enhance profits through: (1) lower inventory levels; (2) fewer shortages; and (3) improved customer service levels; but, will also enhance forecasting credibility throughout the organization. According to Greene (1997), maintaining accurate and updated information on the price items, fluctuating demand requirements, and other variables can have a substantial impact on forecast accuracy.
The company wants to attain a 100% service level, but they are undecided on what to do because they do not know the cost implications of the possible actions they will take. With this study, I would help Alliance Hardware, Inc. to develop an appropriate inventory system so as to increase their service level that will specifically cater to their needs and the needs of their customers, taking into consideration factors such as demand requirements, lead time and other inventory costs that will affect the reorder point and order quantity.
II. THE STUDYThe study intends to evaluate the current
inventory system of the establishment particularly on the purchasing strategies and internal control system with the end view of proposing recommendations to have a more efficient and systematic inventory system.
Specifically, it aims to answer the following questions: (1) What inventory system does the establishment normally adopt in keeping track of their inventory? (a) How does this enterprise classify its inventory in terms of criticality? (b) How
UV Journal of Research120

do they meet anticipated customer demand? and (c) How is the ordering system done? (2) At what point should the establishment reorder for new stocks to reduce or eliminate stock out? (3) How much stocks should be ordered at reorder point? (4) What alternatives can be suggested in order to improve the service of the hardware store?
III. METHODOLOGYThis study made use of quantitative and
applied method of research as various inventory management techniques and computations were utilized. I chose Alliance Hardware, Inc. as a representation of a medium-scale enterprise that wanted to pursue expansion strategies by primarily obtaining a desired 100% service level or at least improving its current service level near to its desired state.
Assumptions made on the study include: (1) only one item is involved; (2) annual demand requirements of each item are known; (3) demand is stretched evenly throughout the year, and (4) a 1% stock out adjustment is assumed to represent those recorded unserved items. The 1% stock out adjustment represents those items that were not provided by the sales staff to their customer by the time the customer requests for a certain item and no stock was available for sale. Failure to record some of these unserved items will be difficult to obtain thus the stock out adjustment was made.
The data gathering and other research procedures needed to complete this study was conducted at the main office situated at Legaspi corner Lapu-Lapu St., Cebu City and its warehouse is located at the Reclamation Area, Cebu City. The main office has an estimated area of 1,000 sq. feet while the warehouse has a total area of 3,600 sq. feet.
Other sources of data needed to facilitate the flow of the study include: (1) Price list -this is comprised of the list of all items sold and its corresponding unit price; (2) Sales Records - this contains sales records for each item. This was provided by the inventory manager and this will serve as the basis for the demand; (3) Journal - necessary information like the number of unserved items, history of customer complaints and other stock out related concerns
were obtained from the hardware journal; (4) Purchase Order - information on the order quantity of the critical items from the different suppliers was acquired from the purchase order, (ordering details like the placement of order reflecting the date it was received which will constitute the lead time; due to the present unstructured inventory control system, sales records and journals for the recent 3 years); and (5) Interviews conducted - interviews were conducted to the general manager, inventory manager, accounting officer, warehouse officer and the sales personnel to gather other usable data.
The important individuals who aided in obtaining valuable information needed for the study were: (1) General Manager, who supported in acquiring the needed data through her approval in doing actual observations inside the hardware and other data gathering procedures that were done. Also, she served as a guide in determining other important people to interview. (2) Inventory Manager, who provided the necessary data like the list of items sold including its unit price, associated costs incurred in ordering the inventory, associated costs incurred in holding the inventory and other vital information. Also, the inventory manager supplied the other essential historical data like sales of items during previous years and other needed statistics. Furthermore, the approximate number of unserved items and other stock out issues were provided. (3) Accounting Officer, who presented current internal control used by the organization. (4) Warehouse Officer who was interviewed regarding basic information about the warehouse, as well as the process involved in the receipt of the ordered items. (5) Sales personnel who shared their common problems encountered regarding stock out of items and how the inventories are classified and other relevant information.
The data gathering started by evaluating the current inventory system of Alliance Hardware, Inc. through the interviews conducted, sales records and other data made available by the inventory manager and accounting officer. Also, necessary data in calculating the hardware’s holding cost, ordering cost and other costs associated in determining the reorder point and the appropriate order quantity
D a t o - o n , D. V. E . 121

were obtained through interviews and documents provided by the management. Interviews conducted to the key people and actual observation at the hardware aided in appropriately assessing the current inventory system.
The data gathered was then analyzed and interpreted using industrial, operations and project management tools, particularly, forecasting and A-B-C classification. I also focused on studying specific inventory management concepts such as reorder point, safety stock, service level and economic order quantity.
Based from the historical data gathered, I forecasted the demand for 2012 using four different forecasting techniques, specifically, the moving average, weighted moving average, trend line analysis and exponential smoothing. The forecasting technique with the least mean absolute deviation for each family was then chosen as the forecast. The most common measure is the mean absolute deviation (MAD). The formula used to compute MAD is:
MAD = Σ I Actual – Forecast I / n.
After obtaining the forecast, I then classified the items from the most important to the least important using the A-B-C approach. This was done
by multiplying the forecasted annual demand with the corresponding unit price and setting a range for each classification. The class “A” items consisted of those items with an annual value greater than P700,000; class “B” items with an annual value ranging between P200,000 and P700,000; and class “C” items with an annual value of less than P200,000. Those classified as “A” and “B” items were regarded as the critical items in this study since these are the items which have a major effect on the sales and profit as proven by the Pareto analysis.
After determining the critical items, the present ordering system, supplier information, and lead time for these items were then obtained. The data that was used as a basis for the present ordering system was that of the year 2011 since this was the most recent available data. These data were used to determine the appropriate timing of order and the level of safety stock. AHI is willing to hold in stock to increase service level, thus minimizing the occurrence of stock out.
Once the appropriate timing of order is determined, it follows that a proper order quantity should also be established to minimize cost of inventory. To obtain the proper order quantity, I chose from the different order size models and selected the most appropriate one to apply, which was the economic order quantity model. For this
Figure 1. Input-Process-OutputFlow.
UV Journal of Research122

model, it is necessary to identify the holding cost, ordering cost and other associated costs of inventory for the identified critical items.
The computed reorder point and economic order quantity served as the basis for my comparison in determining whether there is an improvement in the actual service level.
The present inventory process flow is shown in detail in Figure 2. It involves sales, ordering, receiving and documentation of the items delivered by the supplier. Ishikawa Diagram. I found the following pertinent observations that aided in identifying the causes that led to a low service as shown in Figure 3.
Man. The inventory manager committed a mistake in updating inventory. She may have subtracted or added the wrong quantity. The warehouse officer failed to inspect ordered items. He included items that were not in acceptable condition. The purchaser issued the wrong purchase order. There is lack of supervision, coordination and verification. Inventory records do not match with actual inventory on hand.
Method. There is no standard ROP and order size quantity. Hardware items are not classified. Some saleable items may not be available at the time the customer orders.
IV. RESULTS AND DISCUSSIONStock out and Service Level. The presence of
stock out is one of the main problems encountered. The stock out values for 2009, 2010 and 2011 were obtained in the hardware journal and verified in the purchase order. Year 2009 had the highest percentage stock out of 3.85% amounting to Php 4,149,614.90. Values for 2010 and 2011 are shown in Table 1. An estimated adjustment of 1% was assumed for those unrecorded unserved items since these unrecorded unserved items are hard or impossible to determine. The established percentage stock out aided the researcher in assessing the current service level. The service level was computed by subtracting the percentage stock
out values from 100%.Present Ordering System. The present
ordering system is determined, and a sample from one supplier (Diagonal Steel, Manila) is shown in detail in Table 2. The data is based on the 2011 ordering from eight different suppliers of the identified critical items. The table presents the month that AHI ordered from the supplier and the corresponding amount of order. Also, the minimum order quantity is indicated. With the obtained data, the total annual orders were computed by summing up the individual orders. Also, the number of orders was determined. From these, the present order quantity (per order) was computed by dividing the total annual orders by the number of orders made per year.
Present Inventory System. AHI, Inc. adapts the click sheet control. It involves the use of what is commonly called stock cards. In this method, the sales staff records the item to be withdrawn from inventory and deducts it to the outstanding stocks on either a card or sheet of paper. The recorded information is then used for reorder purposes. Also, visual checking is done to determine if additional inventory is required. However, currently, this is conducted on an irregular basis.
Forecasting. Forecasts are extremely important inputs in the business because it helps managers to foresee the future. Currently, AHI predicts future demand through judgment and experience in formulating forecasts. This is a simple, qualitative technique to use but introduces a higher degree of inaccuracy. It is, therefore, essential for the company to take a more proactive approach to forecasting, that is to provide quantitative measures in an effort to explicitly categorize inducing factors and to incorporate this into equations that could be used for predictive purposes. Such techniques like moving average, weighted moving average, exponential smoothing and trend-line analysis could provide higher measures of accuracy than just plain judgment of future values.
D a t o - o n , D. V. E . 123

Year Total Sales (Php)
Stock out (Php)
Recorded % Stock out Adjustment % Stock
outService
Level
2009 107,823,971.37 4,149,614.90 3.85 1 4.85 95.15
2010 126,642,162.20 2,884,958.65 2.28 1 3.28 96.72
2011 149,160,141.39 3,906,259.05 2.62 1 3.62 96.38
Table 1. ServiceLevelDetermination.
Figure 2. DetailedProcessFlowofAllianceHardware,Inc.’sPresentInventoryManagementSystem.
UV Journal of Research124

I then used such quantitative forecasting techniques to predict future demand. For Weighted Moving Average, 50% weight was allotted for year 2010, 30% for 2009 and 20% for 2008. For Exponential Smoothing, three alpha values were applied, that is, 0.05, 0.28 and 0.50. The technique that gives the lowest mean absolute deviation (MAD) was chosen.
Classification System. It would be unrealistic to devote equal attention to each of the items sold at Alliance Hardware, Inc. The present system
Figure 3.IshikawaDiagram
Table 2. PresentOrderingSystemofAHI.
MOQ: 50 unitsLT=10D
LT=12D
LT=12D
LT=9D
LT=11D
LT=12D Total
Orders# of orders POQ
Feb Apr May Jul Sep NovBI Pipe 1" 450 500 400 550 550 500 2950 6 492BI Pipe 1 1/4" 500 550 550 550 600 500 3250 6 542BI Pipe 1 1/2" 300 300 250 350 450 350 2000 6 333BI Pipe 2" 550 350 550 450 400 350 2650 6 442
employed by the company in classifying their hardware items is only based on experience. Items that seem to be saleable for the past years are believed to be the most critical without considering the cost of that particular item. However, they failed to consider that some items may not be fast moving but have greater value since they have higher selling price. A more reasonable approach would be to allocate control efforts according to the relative importance of various items in inventory, that is, with the use of a widely known approach called the
D a t o - o n , D. V. E . 125

A-B-C classification system. The A-B-C approach was used to determine
the value or cost significance of each item sold. The annual value of the item is equivalent to the product of the demand and its corresponding selling price. Class “A” or high-value items, which have an annual value greater than Php 700,000.00, are under the tightest control, class “B” are those items with an annual value that range from Php 200,000.00 to Php 700,000.00 while class “C” items, which have an annual value of less than Php 200,000.00, are under simple physical control. The critical items, which constitute both class “A” and class “B” items, served as the core of the study.
Pareto Principle. The value of the critical items equal to Php 106,345,221.04, which is 85.49% of the total annual value. Applying the Pareto principle proves the significance of giving utmost priority to having an appropriate inventory of these items in order to eliminate or reduce the presence of stock out. Table 3 shows the annual values of the critical items with respect to the total annual value.
Demand and Lead Time Variability. The timing of order is influenced by both demand and lead time. The management has an idea as to the variability of demand and lead time of their hardware items, but they fail to counter it with the right amount of safety stock.
It is important to have reasonable estimates of the amount and timing of demand especially that Inventories are used to satisfy demand requirements. Also, it is crucial for the company to know the length of time it takes for orders to be delivered. In addition, AHI needs to know the extent to which demand and lead time might vary. The greater variability in either demand or lead time, the greater the amount of safety stock that will be needed to achieve the desired service level.
Annual Value (Php) Percentage
Critical Items Total
106,345,221.04 124,395,755.46 85.49%
Table 3. ParetoAnalysis.
However, the management should not disregard the fact that it is expensive to hold stocks.
Ordering System. The present ordering system of Alliance Hardware, Inc. is shown in Table 2. I have found out that there is no standard ordering method employed in AHI as validated by the interviews conducted. Furthermore, the company is unsure of the proper timing of order as they only make use of subjective means such as visual checking, physical checking and click sheet control in estimating when to reorder. These are reasonable methods but are somewhat inaccurate. These methods only notify the AHI personnel as to how much is their current supply but not about the right time to reorder. AHI did not use scientific or statistical computation as they are not knowledgeable with the different tools that will help them determine the right time to order and the most cost efficient amount to order.
Service Level. AHI is experiencing stock out as reflected in Table 1. For the past years, stock out ranged from 2.9M to 4.2M. This high amount is indicative of AHi’s low service level. The company wants to attain a 100% service level, but currently, they are undecided on what to do because they do not know the cost implications of the possible actions they will take. Achieving a 100% service level is realistically hard and at the same time highly expensive. However, I made alternatives on how AHI could realize the closest service level to their desired level, with corresponding cost analysis.
Reorder Point. The reorder point answers the problem on the appropriate timing to reorder the hardware items. When the available quantity of an item drops to the computed reorder point, the item is reordered. I have found out that Alliance Hardware, Inc. does not follow a standard reorder point. Considering this, I have computed for the reorder point at 96.38% given that the service level is maintained from that of 2010, which is the most recent service level determined based from the data treated. Then, reorder points at 98.00% and 99.98% were computed for the management
UV Journal of Research126

Table 4. Cost–BenefitAnalysisofIncreasingServiceLevel.
Figure 4.InternalControlforPurchaseofHardwareItems.
to have a comparison as to the cost that will be incurred in carrying additional inventory.
It was then found out that increasing the service level to 98.00% would entail an additional cost of Php 60,529.25. Also, by increasing it to the optimum service level of 99.98%, additional cost of inventory amounts to Php 409,177.72.
Furthermore, the stock out value if the service level will continue to be at 96.38% for 2011 is determined to be Php 4,503,126.3. It will be reduced to Php 2,487,915.10 and Php
24,879.15 if the service level is increased to 98.00% and 99.98% respectively. As a result, an opportunity gain of Php 2,015,211.20 and Php 4,478,247.15 is achieved as shown in Table 4.
Economic Order Quantity. Having known when to reorder, I opted to establish a standard order quantity for Alliance Hardware, Inc. that would help them minimize their cost of inventory. To calculate for the economic order quantity, the ordering and holding cost were first determined. Then, the economic order quantity computed was
D a t o - o n , D. V. E . 127
computed. A comparison of AHI’s present order quantity with the computed economic order quantity was established. It was found out that if AHI follows the standard economic order quantity, they can save approximately Php 838,355.10 in a year, which is a huge amount of money.
Inventory Control System Used. I focused on the three basic questions in inventory control: (1) what items to keep in stock, (2) when to place the order and (3) how much to order. Having posed these questions, I sought to find answers by evaluating AHI’s way of assessing demand whether it is independent or dependent. It was then found out that at AHI, the demand for an item is independent of the demand for any other item.
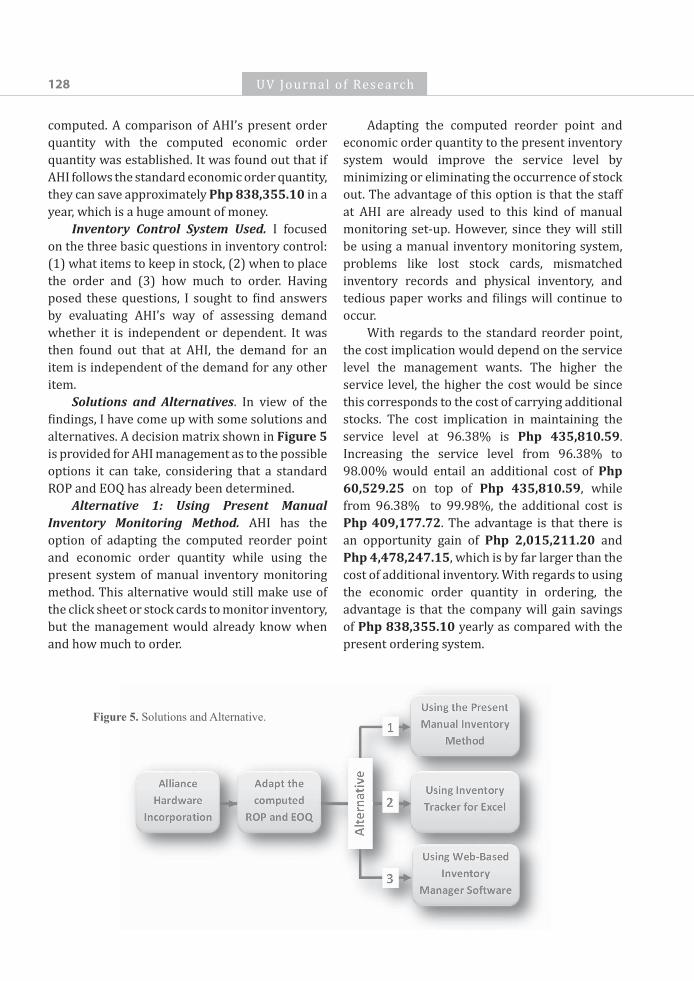
Solutions and Alternatives. In view of the findings, I have come up with some solutions and alternatives. A decision matrix shown in Figure 5 is provided for AHI management as to the possible options it can take, considering that a standard ROP and EOQ has already been determined.
Alternative 1: Using Present Manual Inventory Monitoring Method. AHI has the option of adapting the computed reorder point and economic order quantity while using the present system of manual inventory monitoring method. This alternative would still make use of the click sheet or stock cards to monitor inventory, but the management would already know when and how much to order.
Adapting the computed reorder point and economic order quantity to the present inventory system would improve the service level by minimizing or eliminating the occurrence of stock out. The advantage of this option is that the staff at AHI are already used to this kind of manual monitoring set-up. However, since they will still be using a manual inventory monitoring system, problems like lost stock cards, mismatched inventory records and physical inventory, and tedious paper works and filings will continue to occur.
With regards to the standard reorder point, the cost implication would depend on the service level the management wants. The higher the service level, the higher the cost would be since this corresponds to the cost of carrying additional stocks. The cost implication in maintaining the service level at 96.38% is Php 435,810.59. Increasing the service level from 96.38% to 98.00% would entail an additional cost of Php 60,529.25 on top of Php 435,810.59, while from 96.38% to 99.98%, the additional cost is Php 409,177.72. The advantage is that there is an opportunity gain of Php 2,015,211.20 and Php 4,478,247.15, which is by far larger than the cost of additional inventory. With regards to using the economic order quantity in ordering, the advantage is that the company will gain savings of Php 838,355.10 yearly as compared with the present ordering system.
Figure 5. SolutionsandAlternative.
UV Journal of Research128

Alternative 2: Using Inventory Tracker for Excel. Alliance Hardware, Inc. has the option of adapting the computed reorder point and economic order quantity using the Inventory Tracker for Excel. The Inventory Tracker for Excel permits small and medium-scale business owners and inventory management professionals to track inventory and view automatic alerts when it is already necessary to reorder. The key features of the Inventory Tracker for Excel is its unique ability to pre-determine reorder and tolerance levels and its easy customization. For instance, when units in stock are within 15% (or whatever percentage is defined) of the pre-determined reorder level, the status field turns yellow and indicates “reorder needed”. The status field turns green and indicates “in stock” when units in stock exceed your reorder tolerance level. When no units remain in stock, the status field turns red and indicates “out of stock”. These color-based alerts provide an easy way to distinguish products that need attention. It includes spreadsheets that supports 25,000-65,000 products and is very user-friendly even for anyone who only has basic knowledge in Excel.
Adapting this option would enable the company to track their inventory without difficulty and view automatic color-based alerts when it is necessary for the company to reorder. Also, it will help the company in minimizing the stock out of items since the authorized personnel assigned in monitoring inventory is alerted every time there is a need to reorder a particular item. Adapting the standard ROP with the Inventory Tracker eliminates the subjective way of reordering.
This option would entail the computerization of Alliance Hardware, Inc.’s inventory system and purchase of the Inventory Tracker for Excel software. Management should transfer all the files from the click sheet or stock cards, journal, etc. to the computer. This is somehow related to Alternative 1 but, the advantage is that, it would eliminate problems such as lost stock cards, and errors in recording transactions since the tracking of inventory is already through Excel.
Employing the Inventory Tracker for Excel would involve the same financial implications with regards to ROP and EOQ as that of Alternative 1, but with an additional expense in acquiring the computers and the necessary software including training and cost of maintenance personnel. AHI would need a minimum of 3 computers to implement this option. Each Inventory Tracker for Excel software costs Php 1,890.00. Also, the inventory manager should undergo training for basic excel functions. This is estimated to be around Php 5,000.00. Cost of maintenance is approximately Php 3,000.00 every month. Estimating Php 30,000.00 for each computer set, total cost of implementing this alternative amounts to Php 136,670.00.
Alternative 3: Using Web-based Inventory Manager Software. Another alternative for AHI is to adapt the computed reorder point and economic order quantity using a web-based inventory manager such as Golden Web Inventory System. Golden Web Inventory System (GWIS) is speedy and is considered high-performance inventory management software with functions such as item tracking, inventory control, optimal stocks assurance, and increased productivity. GWIS is a known desktop application, utilizing XML technology, which allows remote computers to synchronize and share information. The software computes real-time on hand, allocated and available stock levels when invoices are being entered. AHI could also choose to use this software with their invoices, purchase orders, several types of management reports, etc. They can even directly connect to some of their suppliers through the internet.
This option would necessitate the automation of AHI’s inventory system. Web-based inventory management would make it easy to keep their inventory accurate from any location. The web-based inventory management solution software supports multiple users, inventory transaction logging and enables the company to manage inventory in multiple locations. As soon as the purchase and sales transactions are entered by the
D a t o - o n , D. V. E . 129

sales staff, the inventory management software application offers the capabilities to choose the location of the warehouse that will accept or fulfil the order. Inventory reports allow the staff to view information about the total available inventory.
This software would allow the company to track their inventory on a real-time basis. This would align the inventory control from the main office with that of the warehouse. If inventory is deducted from the warehouse, the system will automatically determine the number of deductions and this deduction will be reflected on the system. The system can be accessed both from the main office and warehouse. This option minimizes paper works and mismatched physical inventory and inventory records. Using the web-based inventory manager software would improve the operations of the company. This would imply a high service level because the hardware can immediately serve the needs of their customers.
Using the web-based inventory manager would involve the same financial implications with regards to ROP and EOQ as that of Alternative 1, but it entails a higher additional expense for the company for the reason that AHI will need to buy the computers and the needed software at the same time pay for the internet connection and other related fees in installing
the software. Each software costs Php 14,000.00 and system installation charge totals to Php 10,000.00 inclusive of the professional fee and all cables and wires needed for the installation. A two half day formal training for the sales personnel is conducted to orient them and make them familiarize with the basic functions and features of the new system. The two half day training is estimated to be around Php 5,000.00, inclusive of the speaker, snacks, and all the training materials needed. A programmer from an outside agency is hired to perform monthly maintenance and is paid Php 3,000.00 per month. Considering that AHI needs a minimum of three computers to implement this option, and each computer set costs Php 30,000.00, the total cost of implementing this alternative amounts to Php 194,988.00. For the internet connection, the company can subscribe to the on-going telephone and internet connection package offered by telephone companies, such as the Plan 999 of PLDT My DSL.
Payback Period. Payback measures the time it will take to recoup in the form in the expected cash flows, the net initial investment of the project. The payback of each of the alternatives is shown in Table 5.
Alternative
(at 99.98% service level)
Cost of
ImplementationMonthly Savings
Payback
(in months)
1.Use present Manual Inventory Monitoring
MethodPhp 0.00 Php 339,089.12 No payback
2. Use inventory Tracker for Excel Php 136,670.00 Php 339,089.12 0.40
3.Use Web-Based Inventory Manager Software Php 194,988.00 Php 339,089.12 0.58
Table 5. PaybackPeriodofAlternatives.
UV Journal of Research130

All of the alternatives generate the same monthly savings, but with Alternative 1, problems like loss of stock cards, mismatch of physical inventory with records and tedious paper works and filing will still continue to occur. On the other hand, Alternative 3 entails a higher cost of implementation but, AHI would be more competitive in the global market. Proposals
The ultimate goal for this research is to optimize the service level of medium-scale enterprise in order to minimize or eliminate the occurrence of stock out. This is by providing them with the proper timing of order and the order quantity that would minimize inventory costs.
With the alternatives presented, I highly recommend the following:
(1) AHI should establish accurate forecasts to take advantage of the varying demand requirements and lessen probable risks. Also, the company should maintain accurate and updated information on customer demand, lead time variability of the orders, prices and other variables that have significant impacts on the forecast accuracy.
(2) AHI should adopt Alternative 3, which is to incorporate the standard reorder point and economic order quantity using the Golden Web Inventory System (GWIS). This alternative would provide the company with substantial opportunity both for implementing the standard reorder point and economic order quantity. Also, tracking of inventory would be easier since the system is automated and functions in real-time condition. This means that every time inventory is deducted and added from the main office or warehouse, the system will automatically determine the number of deductions and additions that will be reflected on the system. This alternative would enable the company to keep a more accurate inventory from any location since it supports multi-user capabilities at multiple locations. Also, this is considered a one-time big time investment considering that this would help AHI be more competitive just like any large-scale hardware
establishments like Built-It. Furthermore, the system provides automatic alerts when reordering is necessary and adjustable tolerance levels can be configured upon management’s decision. Lastly, this alternative promotes a paperless environment which eliminates tedious paper works and filings thereby improving operation, thus, improving the service level of the company.
(3) To ensure the success of this alternative, proper orientation of the employees should be done. It is important that management discuss with their employees the new automated web-based inventory system, its advantages and how it affects their work. Accountability of inventory and its management is very crucial and should only be assigned to someone who understands the system and has undergone training. Moreover, the inventory manager should be educated in the computation of the standard reorder point and economic order quantity so that these values can be kept accurate and up-to-date. Estimates of the holding cost and ordering cost should be reviewed periodically and updated as necessary. Also, variability in demand and lead time should constantly be considered.
(4) To ensure that the demand and lead variability can be addressed, medium-scale enterprise should ensure that production and lead time decisions of their suppliers should be effectively delegated to cost centers that easily generates time to produce an order with proper freight schedule estimates to reduce congestion delays of deliveries.
(5) In order to maximize the economic order quantity computed, medium-scale enterprises should examine whether to pursue product standardization. However, it is still best to ensure the purchase products to strategic alliances or to an appropriate number of suppliers of desired relationships. With the computed EOQ and ROP, strategic cost management is applied through the realization of cost savings of Php 838,355.10 in a year.
(6) The company could also improve their system by having a more efficient internal control
D a t o - o n , D. V. E . 131

system. The current internal control allows room for mistakes such as issuance of wrong purchase orders and mismatched inventory since there is minimal communication with the different sections of the company. To remedy this, I recommend a more open communication line between sections or divisions. Also, it is important that copies of the documents like purchase orders and invoices be provided to the proper individuals for verification and confirmation purposes so as to eliminate the said problems.
(7) That future researchers conducting a similar field of study consider other reasonable estimates in calculating inventory related costs.
(8) Finally, a more thorough analysis regarding space requirements should be conducted.
V. CONCLUSIONI came into a conclusion that the cost of
achieving Alliance Hardware, Inc.’s desired service level, which is at 99.98% amounting to Php 409,177.72, is lesser than the total possible stock out amount if they remain at their current service level at 96.38% which is Php4,503,126.30. Therefore, Alliance Hardware, Inc. should really consider improving their service level. Moreover, I can ascertain that additional stocks caused by the increase in the service level would still be accommodated in their warehouse considering that from actual observation, the warehouse can still hold inventory even if current inventory is doubled.
Lastly, using the standard economic order quantity would imply yearly savings of Php 838,355.10 for the company.
Originality Index: 97 %Similarity Index: 3 %Paper ID: 346458940Grammarly: Checked
REFERENCES
Bragg,S.V.(2011).Inventory best practices.N.Y.:Wiley.Greene, J. H. (1997). Production and inventory control
handbook.N.Y.:McGraw-HillCompanies,Inc.Harris, F.W. (1913).How many parts to make at once.
RetrievedNovember21,2012fromhttp://userhome.brooklyn.cuny.edu/irudowsky/CIS10.31/articles/EOQModelOriginalPaper.pdf
Krajewski, L. J., & Ritzman, L. P. (2009). Operations management: Strategy and analysis. New Jersey:PrenticeHall
Landvater, D. V. (1997). World class production and inventory management.N.Y.:Wiley
Muller,M. (2011).Essentials of inventory management.N.Y.:Wiley
Piasecki,D.J. (2011). Inventory management explained: A focus on forecasting, lot sizing, safety stocks and ordering systems.RetrievedOctober 11, 2012 fromhttp://www.inventoryexplained.com
Stevenson,W. J. (2011).Operations management. N.Y.:McGraw-HillCompanies,Inc.
Tersine,R.J.(1993).Principles of inventory management and materials management. New Jersey: PrenticeHall
Usry,M.F.,&Matz,A.(2009).Cost accounting: Planning and control.Canada:ThomsonSouthwestern.
UV Journal of Research132