pulse-wave propagation in straight-geometry vessels … · for stiffness estimation: theory,...
TRANSCRIPT

Pulse-Wave Propagation in
Straight-Geometry Vessels
for Stiffness Estimation: Theory,
Simulations, Phantoms and In VitroFindings
Danial Shahmirzadie-mail: [email protected]
Ronny X. Lie-mail: [email protected]
Ultrasound and Elasticity Imaging Laboratory,
Department of Biomedical Engineering,
Columbia University, New York, NY 10025
Elisa E. Konofagou1
Ultrasound and Elasticity Imaging Laboratory,
Department of Biomedical Engineering,
Department of Radiology,
Columbia University,
New York, NY 10025
e-mail: [email protected]
Pulse wave imaging (PWI) is an ultrasound-based method for non-invasive characterization of arterial stiffness based on pulse wavepropagation. Reliable numerical models of pulse wave propagationin normal and pathological aortas could serve as powerful tools forlocal pulse wave analysis and a guideline for PWI measurementsin vivo. The objectives of this paper are to (1) apply a fluid-structure interaction (FSI) simulation of a straight-geometry aortato confirm the Moens-Korteweg relationship between the pulsewave velocity (PWV) and the wall modulus, and (2) validate thesimulation findings against phantom and in vitro results. PWIdepicted and tracked the pulse wave propagation along the abdom-inal wall of canine aorta in vitro in sequential Radio-Frequency(RF) ultrasound frames and estimates the PWV in the imaged wall.The same system was also used to image multiple polyacrylamidephantoms, mimicking the canine measurements as well as modelingsofter and stiffer walls. Finally, the model parameters from the ca-nine and phantom studies were used to perform 3D two-waycoupled FSI simulations of pulse wave propagation and estimatethe PWV. The simulation results were found to correlate well withthe corresponding Moens-Korteweg equation. A high linearcorrelation was also established between PWV2 and E measure-ments using the combined simulation and experimental findings(R2¼ 0.98) confirming the relationship established by the afore-mentioned equation. [DOI: 10.1115/1.4007747]
Keywords: arterial stiffness, aortic pulse wave velocity (PWV), pulsewave imaging (PWI), fluid-structure interaction (FSI) simulation
1 Introduction
Changes in the vascular mechanics may have immediate ramifi-cations on the onset and progression of cardiovascular disease(CVD) [1] and the aortic stiffness has been reported as an inde-
pendent indicator of all-cause and CVD-related mortalities [2].Collectively, it has been increasingly appreciated that assessingarterial stiffness could prove pivotal in routine clinical diagnosis,treatment and follow-up procedures [3].
The arterial pulse wave velocity (PWV) has been shown to berelated to the underlying wall stiffness through the Moens-Korteweg equation [4] and has been used in a variety of applica-tions for noninvasive estimation of arterial stiffness [5,6]. TheMoens-Korteweg equation has been established based on theassumptions of having an infinitely long, straight, isolated, and cy-lindrical vessel with elastic, isotropic, and homogenous walls,containing a homogenous, incompressible and nonviscous fluid[5,7]. Most of the aforementioned assumptions may not be validin vivo; nonetheless, the qualitative relationship between stiffnessand PWV remains valid and forms the basis of the PWI methodfor stiffness estimation based on the PWV measurements.
The current clinical gold standard consists of obtaining theglobal PWV by measuring the difference in arrival times betweenthe temporal pulse pressure profiles at two distinct sites, e.g., thecarotid and femoral arteries, and dividing it by the over-the-skinmeasured distance [3,8]. Such methods are at the core of mostclinical studies involving the measurement of arterial stiffness [9].Due to a number of factors, such as the lack of knowledge on theexact arterial geometry and the assumption of a single longitudi-nal flow direction between the carotid and the femoral sites, suchmethods may lead to an overestimation/underestimation of thetrue distance [10]. Most importantly, the wall stiffness has beenshown to vary along the arterial tree, and therefore assuming aglobal PWV may not detect early onset or focal disease [11].These and other fundamental limitations of the carotid-femoralmethods have been reviewed in details elsewhere [12].
Different imaging modalities, such as ultrasound [13,14] and MRI[15,16] have been used for noninvasive imaging of the arterial wallat multiple time-points during the cardiac cycle in order to track thepropagation of the transient vibrations along the artery in 2D andestimate the PWV; in some cases together with simultaneous pres-sure measurements for determining parameters such as augmentationindex (AI). More recently, the ultrasound-based method of pulsewave imaging (PWI) has been developed to fully analyze the wavepropagation with high temporal and spatial resolutions and to mea-sure the PWV locally. The PWI feasibility studies have been done invarious applications such as normal and aneurysmal mouse [17] andhuman aortas [18], aneurysmal and hypertensive patients [19], andexperimental aortic phantoms [10]. The PWI results have also beencompared against the clinical method of applanation tonometry inhumans [20]. Ongoing PWI studies are focused on verification of themethod in the presence of regional changes in wall composition andgeometry, such as aneurysmal wall and arterial branches.
Existing finite element method (FEM)-based models that simu-late vascular biomechanical function primarily rely on solid-state(SS) modeling of blood vessels experiencing static or pulsatile in-ternal pressure replicating the hemodynamic effects [21,22]. Morerecently, fully-coupled FSI simulations using patient-specific geo-metries and anisotropic finite-strain constitutive relations havebeen reported in healthy and diseased arteries, aiming at comput-ing biomechanical properties, such as fluid velocity and pressure,and wall displacement and stress [21,23,24]. Scotti et al. haveextracted temporal wall displacement variation using dynamicFSI; however, no spatial information was obtained and therefore noPWV measurements were extracted [25]. Preliminary studies onperforming FSI simulations of aortic pulse wave propagation havebeen reported by our group [11,26]. The objective of this paper isto verify the use of such simulations of pulse wave propagationalong the straight-geometry linearly elastic aortic walls against sim-ilar PWI studies on phantoms and in vitro canine aortas.
2 Materials and Methods
2.1 Canine Aorta In Vitro. Aortas from male Mongrel dogs(total length of L¼ 205 6 21.21 mm, n¼ 2) were freshly excised
1Corresponding author.Contributed by the Bioengineering Division of ASME for publication in the
JOURNAL OF BIOMECHANICAL ENGINEERING. Manuscript received January 13, 2012; finalmanuscript received September 13, 2012; accepted manuscript posted October 17,2012; published online October 26, 2012. Assoc. Editor: Hai-Chao Han.
Journal of Biomechanical Engineering NOVEMBER 2012, Vol. 134 / 114502-1Copyright VC 2012 by ASME
Downloaded 02 Nov 2012 to 156.145.114.29. Redistribution subject to ASME license or copyright; see http://www.asme.org/terms/Terms_Use.cfm

from the thoracic to the suprarenal abdominal regions and kept inphosphate-buffered saline (PBS) during the entire in vitro experi-mentation. Given the known regional variations in the wall struc-tural and mechanical properties, the wall was imaged along thedescending (thoracic) and suprarenal abdominal (being respec-tively referred to as “proximal” and “distal” to the heart through-out the rest of the paper) to measure the pulse-wave-induced walldisplacement at each location. Details of the ultrasound systemand PWI setup are provided in Appendix A.1 (Fig. 1). After com-pletion of the PWI, the same proximal and distal regions on theaorta were used to extract the rectangular samples (in the hoopdirection) for the mechanical testing. The aortic samples had alength equal to l¼ 14.77 6 0.93 mm, width w¼ 6.55 6 0.11 mm,and thickness t¼ 1.99 6 0.08 mm (n¼ 4) for the proximal, andl¼ 13.51 6 2.39 mm, w¼ 6.21 6 1.08 mm, and t¼ 1.45 6 0.11 mm(n¼ 4) for the distal cases. All in vitro experiments were completedwithin 24 h post-mortem. Details of the tensile mechanical testingare provided in Appendix A.2. The Young’s modulus measured onthe distal aorta was used as the reference for the phantom and simu-lation studies.
2.2 Phantoms. Shear rheometry testing was initially per-formed on small cylindrical samples (diameter d¼ 6.68 6 0.44 mmand height h¼ 4.20 6 0.52 mm) from phantoms of 15%, 20%,25%, 30%, 45%, 60%, and 75% polyacrylamide (Fisher Scientific,PA, USA) gel concentrations (n¼ 3 for each) [10], in order to char-acterize the wall mechanical properties. The mechanical testingresults were used to determine the gel concentrations which yieldthe desired Young’s modulus of 110 kPa (reported for canine aortain vitro) as well as lower and higher moduli of 55 and 220 kPa,respectively, representing softer and stiffer walls. Details of the rhe-ometry mechanical testing are provided in Appendix A.3. The tubephantoms (n¼ 3) from each modulus were manufactured with in-ternal diameter di¼ 7.96 6 0.84 mm, thickness t¼ 2.12 6 0.36 mm,and total length L¼ 248.27 6 2.30 mm and were imaged with thesame PWI setup described in Appendix A.1 (Fig. 1) to map thepulse wave propagation and estimate the PWV.
2.3 FSI Model. 3D two-way coupled simulations of pulsewave propagation were performed using the coupled Eulerian-Lagrangian (CEL) explicit solver of Abaqus 6.10-1 (Simulia, RI,
USA) (Fig. 2). A workstation with IntelVR
XeonVR
CPU @2.33 GHzand 32 GB RAM was used to carry out the computations. Themodel parameters were primarily determined based on the previ-ous experimental measurements as well as existing literature onthe canine aorta in vitro [27]. The tube geometry was set with aninternal diameter of di¼ 8 mm, thickness t¼ 2 mm and totallength L¼ 300 mm (Fig. 2(a)). The wall was modeled with elasticmaterial properties of density qs¼ 1050 kg/m3, Poisson’s ratiov¼ 0.48, and Young’s modulus Enormal¼ 110 kPa, Esoft¼ 55 kPaor Estiff¼ 220 kPa, respectively, representing normal, softer, andstiffer walls. The same as in the phantom and in vitro studies, thefluid was modeled as water with density qf¼ 993 kg/m3, soundspeed c0¼ 1523 m/s, and viscosity g¼ 0.007 N s/m2 [28,29].Additional details can be found in Appendix A.4, as well as in aprevious publication on using CEL for modeling the arterial pulsewave along inhomogeneous walls [11].
2.4 PWV-Based Stiffness Estimation. The PWV estimatesfrom the wall displacement spatio-temporal maps were used toobtain the Young’s modulus, E, via the Moens-Korteweg equation[4,7,30], i.e.,
E ¼ ½2ð1� v2Þqr=t�PWV2 (1)
where v, q, t, and r denote the wall Poisson’s ratio, density, thick-ness, and radius, respectively. This relation was the basis of
Fig. 1 (a) Pulse wave imaging experimental set up. (b) Magnifi-cation at the transducer-phantom level. Red dye was injected inthe fluid for leakage monitoring on the tube.
Fig. 2 (a) Half view of the full 3D aorta-fluid mesh in Abaqus.(b) Examples of a propagating wall displacement wave at multi-ple time points. (c) Schematic representation of a spatio-temporal map of the wall displacement wave.
114502-2 / Vol. 134, NOVEMBER 2012 Transactions of the ASME
Downloaded 02 Nov 2012 to 156.145.114.29. Redistribution subject to ASME license or copyright; see http://www.asme.org/terms/Terms_Use.cfm
establishing the correlation between the PWV2 and E. A high cor-relation is favorable in the PWI method allowing for the detectionof local changes in stiffness based on the noninvasive PWVmeasurements.
3 Results
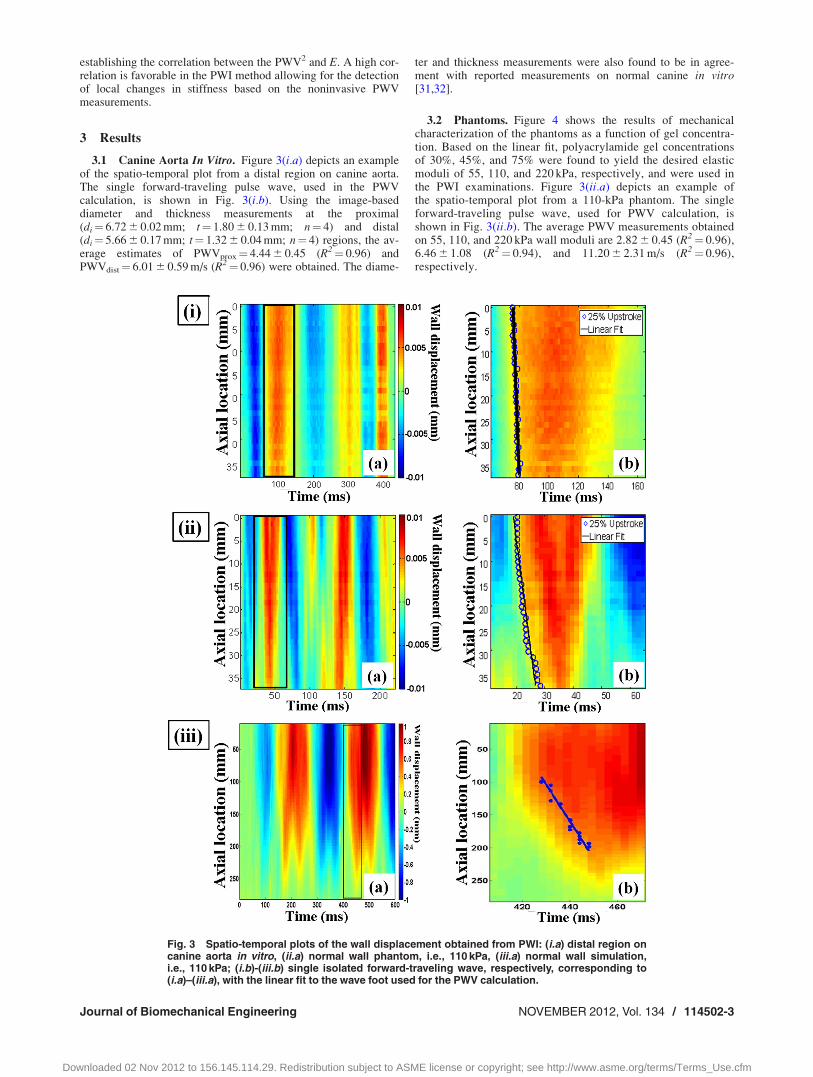
3.1 Canine Aorta In Vitro. Figure 3(i.a) depicts an exampleof the spatio-temporal plot from a distal region on canine aorta.The single forward-traveling pulse wave, used in the PWVcalculation, is shown in Fig. 3(i.b). Using the image-baseddiameter and thickness measurements at the proximal(di¼ 6.72 6 0.02 mm; t¼ 1.80 6 0.13 mm; n¼ 4) and distal(di¼ 5.66 6 0.17 mm; t¼ 1.32 6 0.04 mm; n¼ 4) regions, the av-erage estimates of PWVprox¼ 4.44 6 0.45 (R2¼ 0.96) andPWVdist¼ 6.01 6 0.59 m/s (R2¼ 0.96) were obtained. The diame-
ter and thickness measurements were also found to be in agree-ment with reported measurements on normal canine in vitro[31,32].
3.2 Phantoms. Figure 4 shows the results of mechanicalcharacterization of the phantoms as a function of gel concentra-tion. Based on the linear fit, polyacrylamide gel concentrationsof 30%, 45%, and 75% were found to yield the desired elasticmoduli of 55, 110, and 220 kPa, respectively, and were used inthe PWI examinations. Figure 3(ii.a) depicts an example ofthe spatio-temporal plot from a 110-kPa phantom. The singleforward-traveling pulse wave, used for PWV calculation, isshown in Fig. 3(ii.b). The average PWV measurements obtainedon 55, 110, and 220 kPa wall moduli are 2.82 6 0.45 (R2¼ 0.96),6.46 6 1.08 (R2¼ 0.94), and 11.20 6 2.31 m/s (R2¼ 0.96),respectively.
Fig. 3 Spatio-temporal plots of the wall displacement obtained from PWI: (i.a) distal region oncanine aorta in vitro, (ii.a) normal wall phantom, i.e., 110 kPa, (iii.a) normal wall simulation,i.e., 110 kPa; (i.b)-(iii.b) single isolated forward-traveling wave, respectively, corresponding to(i.a)–(iii.a), with the linear fit to the wave foot used for the PWV calculation.
Journal of Biomechanical Engineering NOVEMBER 2012, Vol. 134 / 114502-3
Downloaded 02 Nov 2012 to 156.145.114.29. Redistribution subject to ASME license or copyright; see http://www.asme.org/terms/Terms_Use.cfm

3.3 FSI Model. Figure 3(iii.a) illustrates the spatio-temporalplot in the 110 kPa wall modulus simulation. The single forward-traveling pulse wave, used for the PWV calculation, is shown inFig. 3(iii.b). The PWV measurements obtained for the 55, 110,and 220 kPa wall modulus are 2.72 (R2¼ 0.87), 5.64 (R2¼ 0.95),and 8.46 m/s (R2¼ 0.93), respectively.
3.4 Correlation Between Stiffness and PWV. Table 1 sum-marizes the quantitative in vitro, phantom, and simulation results.The PWV-based estimation difference of the modulus is providedin the last row of the table which shows acceptable PWI perform-ance except in the proximal aortic region and the soft wall simula-tion. Figure 5 illustrates the theoretical, i.e., Moens-Korteweg,relationship between the PWV2 versus E (based on the parametersused in the simulation) as well as the measured data from in vitro,phantom, and simulations, showing a high linear correlation coef-ficient of R2¼ 0.98, combined.
4 Discussion
Figure 5 shows that the three simulation data points (�) are rea-sonably correlated to the Moens-Korteweg line. Also, Table 1shows that the difference of stiffness estimation was very low fornormal and stiff models, i.e., less than 7%. However, the stiffnessestimation accuracy is compromised in the simulation of the softmodel, i.e. difference of 56.2%, most likely due to the larger andfaster wall displacement in the soft wall causing possible under-sampling effects by the selected spatio-temporal resolutions. Fur-thermore, as predicted by the Moens-Korteweg equation, thePWVs measured in the canine aortas, phantoms, and simulationswere found to increase with the corresponding Young’s modulus.The simulation parameters were obtained from the in vitro andexperimental phantom measurements and the results from all stud-ies were found to be in excellent agreement, R2¼ 0.98. Therefore,the PWI technique was found to serve as a good basis for detect-ing the relative stiffness changes.
Given the main focus here on validating the PWI methodaccording to the Moens-Korteweg equation, simple geometryand a set of elastic material properties were considered in simu-lation and phantom studies. The PWI estimates on the phantomwall moduli showed that the method is able to describe theincrease in the wall stiffness via the PWV estimates. However,the estimation difference was higher for the soft phantom mostlikely due to the much larger viscosity of soft phantoms obtainedby shear rheometry (viscosity results not shown here). Similarly,the higher stiffness estimation error on the proximal aortic seg-ment could be attributed to the large tissue inhomogeneity andviscosity. However, a lower PWV measured at the proximalconfirms the mechanical testing results and previously reportedfindings that the thoracic region of the aorta is softer than theabdominal region [33].
Unlike in the phantom and in vitro experiments where a contin-uous stream of numerous pulsatile cycles was simply achieved,performing the 3D fully-coupled FSI simulations for long dura-tions was tested in this study by the current limitations in the com-putational power. Therefore, the simulation results here alsoreflect the initial transient of the dynamic wave behavior. None-theless, the high correlation established in simulations for all ho-mogenous and nonhomogeneous wall properties studied aspreviously reported [11], and the high correlation establishedbetween the simulation and experimental findings as well as theMoens-Korteweg theoretical relationship strongly confirm that thesimulation framework accurately represents the wave propagation.As part of our ongoing studies related to the normal or pathologi-cal aortas, the 2D mesh is being considered in axisymmetric geo-metries, which allows for an affordable computational cost. Inaddition, despite the initial single cycle of the input function con-sidered in this paper, the spatio-temporal plot demonstrates the ex-istence of several forward (and backward) waves generated as aresult of multiple reflections of the wave along the finite vessellength, primarily due to the higher velocities of the wall displace-ment wave (e.g., 2.72–8.46 m/s) compared to the fluid velocity(e.g., 1.5 m/s) and the fixed ends of the vessel.
Fig. 4 Mechanical characterization of phantom compressivemodulus (E
0) and threefold of the shear modulus (3G) (Appen-
dix A.4). The errorbars show the standard deviation on eachmeasurement (n 5 3). The linear fit to the defined averageYoung’s modulus, i.e., E ¼ ðE 0 þ 3GÞ=2, and the standard devia-tion lines are shown with the solid and dashed lines,respectively.
Table 1 Summary of PWV and E estimates from canine aortas, phantoms, and simulations studies. The last row indicates the dif-ference between the PWI-based stiffness estimates and the reference values, i.e., mechanical testing results in canine aortas andphantoms studies and the input values in the simulations studies.
Canine aortas Phantoms Simulations
Proximal Distal Soft Normal Stiff Soft Normal Stiff
Reference E (kPa) 97.10 6 9.54 125.06 6 12.45 51.24 6 7.03 112.26 6 4.31 250.88 6 37.14 55 110 220PWV-based E (kPa) 56.20 6 4.27 117.70 6 0.25 51.20 6 2.61 91.89 6 5.27 254.31 6 7.39 24.09 102.82 231.34E difference (%) �42.12 6 7.69 �5.89 6 10.41 �0.08 6 16.69 �18.15 6 5.72 1.37 6 17.89 �56.20 �6.53 5.15
Fig. 5 The theoretical, i.e., Moens-Korteweg, relationshipbetween the PWV2 versus E (based on the parameters used inthe simulation) as well as the measured data from canine aor-tas, phantoms, and simulations, showing a high linear correla-tion coefficient of R2 5 0.98, combined.
114502-4 / Vol. 134, NOVEMBER 2012 Transactions of the ASME
Downloaded 02 Nov 2012 to 156.145.114.29. Redistribution subject to ASME license or copyright; see http://www.asme.org/terms/Terms_Use.cfm
Future investigations are needed to further assess the in vivoimplications of the PWI simulations by better mimicking thephysiologic conditions such as viscoelastic wall, non-Newtonianfluid and patient-specific velocity profile and geometry. Despitethe fact that considerations of these factors could affect the nu-merical PWV estimates, the proportional change in PWVs due tochange in the wall stiffness, as it pertains to the PWI calculations,is expected to remain valid.
5 Conclusion
This study shows the feasibility of using numerical solutions ofpulse wave propagation along the walls of straight-geometryarteries for PWV and stiffness estimation as validated by theMoens-Korteweg formulation. The simulation results showedhigher PWVs for increasing wall moduli and yielded accuratestiffness estimates. Furthermore, good agreement was foundbetween PWV2 and the E in both the simulation and experimentalPWI findings from arterial phantoms and canine aortas in vitro.The outcome of this study encourages the application of PWI forthe noninvasive and regional estimation of arterial wall stiffening,with implications extended to cardiovascular clinical diagnosis.
Acknowledgment
The study was supported in part by NIH R01-HL098830. Theauthors thank Dr. Sacha Nandlall and Dr. Jianwen Luo from ourlab for helpful discussions, and Prof. Van C. Mow and Dr. Leo Q.Wan from the department of biomedical engineering for helpingwith the mechanical testing systems and design.
Appendix
A.1 Pulse Wave Imaging (PWI) Protocol. A customizedlaboratory setup was used to perform the PWI examinations(Fig. 1). The setup consisted of a peristaltic pump (ManostatVaristaltic, IL, USA), providing a sinusoidal flow off¼ 1.5–3.5 Hz, jVj ¼ 3.98–6.82 m/s into the aorta or phantom toinduce the pulsatile wall displacement. A Sonix Touch (Ultraso-nix Medical, BC, Canada) ultrasound system with a 10 MHz lineararray was used to image the wall at 950 fps and 16-beam density.A radio frequency (RF)-based, one-dimensional cross correlationtechnique was used to estimate the temporal pulse-wave-inducedwall displacement [10,34], averaged over 10 cycles. The spatio-temporal displacement variation was used to estimate PWV. Inorder to comply with the Moens-Korteweg assumptions, the bestsingle forward-traveling pulse wave was identified on each spatio-temporal plot (also from the simulations) and the PWV was calcu-lated as the slope of the linear regression fit (Fig. 2(c)).
A.2 Tensile Testing Protocol. Tensile mechanical testingwas performed on the canine aortic samples using an Instron
VR
5848 microtester (Instron, MA, USA). Samples were first precon-ditioned under e¼ 5% for 20 cycles at 1 Hz, followed by 5 cyclesof tensile testing under e¼ 40% at 0.0125 Hz.
A.3 Shear Testing Protocol. Shear rheometry was per-formed on polyacrylamide phantom specimens (TA Instrument,DE, USA). A biopsy punch of d¼ 6 mm was used to extract thetest samples. First, the samples were tested under e¼ 5% com-pression to measure the compressive Young’s modulus, E0, fol-lowed by an f¼ 1 Hz oscillatory shear test under e¼ 1% tomeasure the shear modulus, G. Given the quasi-incompressibilityof the polyacrylamide phantoms [35], the measurements fromboth tests were used to estimate an elastic modulus (E) defined asthe average of the compressive Young’s modulus and threefold ofthe shear modulus, i.e., E¼ (E0 þ 3G)/2.
A.4 Simulations Framework. To imitate the clamped endsof the phantoms and in vitro aortas, both ends of the tube werefully constrained in three dimensions as the boundary conditions
in the simulation. Relative ambient pressures of 0 and 200 Pawere exerted around the tube, mimicking the immersion of thetube phantom under 2 cm depth of water in the experimentalsetup, and on the outlet, respectively. (Alternatively, absolutepressures could have been considered by adding the atmosphericpressure on both the surrounding and the tube outlet, however, nochange in results were expected.) A sinusoidal initial fluid veloc-ity (f¼ 1.5 Hz, jVj ¼ 3.98 m/s) was applied on the tube inlet. Freeand nonreflecting boundary conditions were, respectively,appointed on the fluid inlet and outlet cross sections to ensure con-tinuous fluid flow and to minimize any boundary effect reflec-tions. A friction coefficient of l¼ 0.001 was assumed between thefluid and the solid wall surfaces. A mesh seeding size of 1.8 mmwas found to be optimal in providing a converging stable solutionwhile computationally affordable. The model contained a totalnumber of 26691 elements and 30642 nodes. The initial time in-crement was 4.85� 10�7 s with the average stable time incrementand total CPU time, respectively, varying between 7.41� 10�6
and 14.75� 10�6 s, and 1.37� 106 and 1.46� 106 s, across differ-ent simulations. Additional details on using CEL for modeling thearterial pulse wave propagation can be found elsewhere [11]. Inthe radial direction (wall thickness), only one point was selectedalong the entire length of the tube to segment the wall and to mea-sure the average wall displacement at the wall middle path (simi-lar to the experimental and in vivo PWI studies). Axial spatial andtemporal resolutions of 1.6 mm and 4 ms were used to measurethe propagation of the wall displacement along the aorta(Fig. 2(b)) and the information was mapped onto a 2D spatio-temporal plane (Fig. 2(c)). Given the focus of the study on PWVestimation, the above parameters were considered to properly cap-ture the wave propagation along the tube axial direction.
References[1] Safar, M., 1989, “Pulse Pressure in Essential Hypertension: Clinical and Thera-
peutical Implications,” Hypertension, 7(10), pp. 769–776.[2] Sutton-Tyrrell, K., Najjar, S., Boudreau, R., Venkitachalam, L., Kupelian, V.,
Simonsick, E., Havlik, R., Lakatta, E., Spurgeon, H., Kritchevsky, S., Pahor,M., Bauer, D., and Newman, A., 2005, “Elevated Aortic Pulse Wave Velocity,a Marker of Arterial Stiffness, Predicts Cardiovascular Events in Well-Functioning Older Adults,” Circulation, 111(25), pp. 3384–3390.
[3] Laurent, S., Cockcroft, J., Van Bortel, L., Boutouyrie, P., Giannattasio, C.,Hayoz, D., Pannier, B., Vlachopoulos, C., Wilkinson, I., and Struijker-Boudier,H., 2006, “Expert Consensus Document on Arterial Stiffness: MethodologicalIssues and Clinical Applications,” Eur. Heart J., 27(21), pp. 2588–2605.
[4] Korteweg, D., 1878, “Uber Die Fortpflanzungsgeschwindigkeit Des Schalles inElastiischen Rohren,” Ann. Phys. Chem., 5, pp. 52–537.
[5] Fung, Y., 1997, Biomechanics: Circulation, Springer-Verlag, New York, NY.[6] Olufsen, M., 1999, “Structured Tree Outflow Condition for Blood Flow in
Larger Systemic Arteries,” Am. J. Physiol., Heart Circ. Physiol., 276(1), pp.H257–H268.
[7] Nichols, W., and O’Rourke, M., 2005, McDonald’s Blood Flow in Arteries:Theoretical, Experimental and Clinical Principles, Hodder Arnold Publication,London, UK.
[8] Pannier, B., Avolio, A., Hoeks, A., Mancia, G., and Takazawa, K., 2002,“Methods and Devices for Measuring Arterial Compliance in Humans,” Am. J.Hypertens., 15(8), pp. 743–753.
[9] Davies, J., and Struthers, A., 2003, “Pulse Wave Analysis and Pulse Wave Ve-locity: A Critical Review of Their Strengths and Weaknesses,” Hypertension,21(3), pp. 463–472.
[10] Vappou, J., Luo, J., and Konofagou, E., 2010, “Pulse Wave Imaging for Nonin-vasive and Quantitative Measurement of Arterial Stiffness In Vivo,” Am. J.Hypertens., 23(4), pp. 393–398.
[11] Shahmirzadi, D., and Konofagou, E., 2012, “Detection of Aortic Wall Inclu-sions Using Regional Pulse Wave Propagation and Velocity in Silico,” ArteryRes., 6(3), pp. 114–123.
[12] Segers, P., Kips, J., Trachet, B., Swillens, A., Vermeersch, S., Mahieu, D.,Rietzschel, E., De Buyzere, M., Van Bortel, L., 2009, “Limitations and Pitfallsof Non-Invasive Measurement of Arterial Pressure Wave Reflections and PulseWave Velocity,” Artery Res., 3(2), pp. 79–88.
[13] Brands, P., Willigers, J., Ledoux, L., Reneman, R., and Hoeks, A., 1998, “ANoninvasive Method to Estimate Pulse Wave Velocity in Arteries Locally byMeans of Ultrasound,” Ultrasound Med. Biol., 24(9), pp. 1325–1335.
[14] Hoctor, R., Dentinger, A., and Thomenius, K., 2007, “Array Signal Processingfor Local Arterial Pulse Wave Velocity Measurement Using Ultrasound,” IEEETrans. Ultrason. Ferroelectr. Freq. Control, 54(5), pp. 1018–1027.
[15] Bolster, B., Atalar, E., Hardy, C., and McVeigh, E., 1998, “Accuracy of ArterialPulse-Wave Velocity Measurement Using MR,” Magn. Reson. Imaging, 8(4),pp. 878–888.
Journal of Biomechanical Engineering NOVEMBER 2012, Vol. 134 / 114502-5
Downloaded 02 Nov 2012 to 156.145.114.29. Redistribution subject to ASME license or copyright; see http://www.asme.org/terms/Terms_Use.cfm
[16] Shao, X., Fei, D., and Kraft, K., 2004, “Computer-Assisted Evaluation of AorticStiffness Using Data Acquired via Magnetic Resonance,” Comput. Med. Imag-ing Graph., 28(6), pp. 353–361.
[17] Fujikura, K., Luo, J., Gamarnik, V., Pernot, M., Fukumoto, R., Tilson, M., andKonofagou, E., 2007, “A Novel Noninvasive Technique for Pulse-Wave Imag-ing and Characterization of Clinically-Significant Vascular Mechanical Proper-ties In Vivo,” Ultrason. Imaging, 29(3), pp. 137–154, available at: http://orion.bme.columbia.edu/ueil/documents/article/2007-fujikura-pwi-technique.pdf
[18] Vappou, J., Luo, J., and Konofagou, E., 2010, “Regional Measurement of Arte-rial Stiffness Using Pulse Wave Imaging: Phantom Validation and PreliminaryClinical Results,” Proceedings of the IEEE Ultrasonics Symposium, San Diego,CA, pp. 1332–1335.
[19] Li, R., Luo, J., Balaram, S., Chaudhry, F., Lantis, J., Shahmirzadi, D.,and Konofagou, E., 2011, “In Vivo Application of Pulse Wave Imaging forArterial Stiffness Measurement Under Normal and Pathological Conditions,”33rd Annual International IEEE EMBS Conference, Boston, MA, pp.567–570.
[20] Vappou, J., Luo, J., Okajima, K., Tullio, M., and Konofagou, E., 2011, “AorticPulse Wave Velocity Measured by Pulse Wave Imaging (PWI): A ComparisonWith Applanation Tonometry,” Artery Res., 5(2), pp. 65–71.
[21] Leung, J. H., Wright, A. R., Cheshire, N., Crane, J., Thom, S. A., Hughes, A.D., and Xu, Y., 2006, “Fluid Structure Interaction of Patient Specific Abdomi-nal Aortic Aneurysms: A Comparison With Solid Stress Models,” Biomed.Eng. Online, 5(33), pp. 1–15.
[22] Simon, B. R., Kaufmann, M. V., McAfee, M. A., and Baldwin, A. L., 1993,“Finite Element Models for Arterial Wall Mechanics,” J. Biomech. Eng.,115(4B), pp. 489–496.
[23] Rissland, P., Alemu, Y., Einav, S., Ricotta, J., and Bluestein, D., 2009,“Abdominal Aortic Aneurysm Risk of Rupture: Patient-Specific FSI Simula-tions Using Anisotropic Model,” ASME J. Biomech. Eng., 131(3), pp. 031001.
[24] Kelly, S. C., and O’Rourke, M. J., 2011, “A Two-System, Single-Analysis,Fluid-Structure Interaction Technique for Modelling Abdominal Aortic
Aneurysms,” Proc. Inst. Mech. Eng., Part H: J. Eng. Med., 224(8), pp.955–969.
[25] Scotti, C. M., Jimenez, J., Muluk, S. C., and Finol, E. A., 2008, “Wall Stressand Flow Dynamics in Abdominal Aortic Aneurysms: Finite Element Analysisvs. Fluid-Structure Interaction,” Comput. Methods Biomech. Biomed. Eng.,11(3), pp. 301–322.
[26] Vappou, J., Zervantonakis, I., Luo, J., and Konofagou, E. E., 2008, “Finite Ele-ment Modeling of the Pulse Wave Propagation in the Aorta for Simulation ofthe Pulse Wave Imaging (PWI) Method,” Computational Biomechanics forMedicine (MICCAI 2008 Workshop), New York, NY, pp. 118–127.
[27] Cox, R., 1975, “Anisotropic Properties of the Canine Carotid Artery In Vitro,”Biomechanics, 8(5), pp. 293–300.
[28] Lide, D., 2008, CRC Handbook of Chemistry and Physics, 89th ed., Taylor &Francis Publishing, New York, NY.
[29] Kaatze, U., 1995, “Fundamentals of Microwaves,” Radiat. Phys. Chem., 45(4),pp. 539–548.
[30] Moens, A., 1878, Die Pulskurve [the Pulse Curve], E. J. Brill., ed., Leiden, TheNetherlands.
[31] Bubenik, L. J., Hosgood, G., and Vasanjee, S. C., 2005, “Bursting Tension ofMedium and Large Canine Arteries Sealed With Ultrasonic Energy or SutureLigation,” Vet. Surg., 34(3), pp. 289–293.
[32] Sato, M., Hayashi, K., Niimi, H., Moritake, K., Okumura, A., and Handa, H.,1979, “Axial Mechanical Properties of Arterial Walls and Their Anisotropy,”Med. Biol. Eng. Comput., 17(2), pp. 170–176.
[33] Fischer, G., and Llaurado, J., 1966, “Collagen and Elastin Content in CanineArteries Selected from Functionally Different Vascular Beds,” Circ. Res.,19(2), pp. 394–399.
[34] Luo, J., and Konofagou, E., 2010, “A Fast Normalized Cross-Correlation Cal-culation Method for Motion Estimation,” IEEE Trans. Ultrason. Ferroelectr.Freq. Control, 57(6), pp. 1347–1357.
[35] Geissler, E., and Hecht, A. M., 1980, “The Poisson’s Ratio in Polymer Gels,”Macromolecules, 13(5), pp. 1276–1280.
114502-6 / Vol. 134, NOVEMBER 2012 Transactions of the ASME
Downloaded 02 Nov 2012 to 156.145.114.29. Redistribution subject to ASME license or copyright; see http://www.asme.org/terms/Terms_Use.cfm