pulse pressure and risk for cardiovascular events in ... · pulse pressure and risk for...
TRANSCRIPT

Listen to this manuscript’s
audio summary by
JACC Editor-in-Chief
Dr. Valentin Fuster.
J O U R N A L O F T H E A M E R I C A N C O L L E G E O F C A R D I O L O G Y V O L . 6 7 , N O . 4 , 2 0 1 6
ª 2 0 1 6 B Y T H E A M E R I C A N C O L L E G E O F C A R D I O L O G Y F O U N D A T I O N I S S N 0 7 3 5 - 1 0 9 7 / $ 3 6 . 0 0
P U B L I S H E D B Y E L S E V I E R h t t p : / / d x . d o i . o r g / 1 0 . 1 0 1 6 / j . j a c c . 2 0 1 5 . 1 0 . 0 8 4
Pulse Pressure and Risk for CardiovascularEvents in Patients With Atherothrombosis
From the REACH RegistrySenthil Selvaraj, MD, MA,a Ph. Gabriel Steg, MD,b,c,d,e Yedid Elbez, MSC,b,c,d Emmanuel Sorbets, MD,b,c,d,f,g
Laurent J. Feldman, MD,b,c,d Kim A. Eagle, MD,h E. Magnus Ohman, MD,i Jacques Blacher, MD, PHD,j
Deepak L. Bhatt, MD, MPH,a on behalf of the REACH Registry Investigators
ABSTRACT
FrobD
Pa
Pa
Lo
Bo
the
Fra
pre
Th
by
Ne
As
Me
At
gra
BACKGROUND Pulse pressure (PP) provides valuable prognostic information in specific populations, but few studies
have assessed its value on cardiovascular outcomes in a broad, worldwide population.
OBJECTIVES The aim of this study was to determine whether PP is associated with major adverse cardiovascular
outcomes, independently of mean arterial pressure.
METHODS Participants from the international REACH (Reduction of Atherothrombosis for Continued Health) registry,
which evaluates subjects with clinical atherothrombotic disease or risk factors for its development, were examined. Those
with incomplete 4-year follow-up or PP data (final n ¼ 45,087) were excluded. Univariate and multivariate regression
analyses were performed to determine the association between PP and cardiovascular outcomes, including cardiovascular
death, nonfatal myocardial infarction, nonfatal stroke, all myocardial infarction, all stroke, cardiovascular hospitalization,
and a combined outcome. PP was analyzed as a continuous and categorical (i.e., by quartile) variable.
RESULTS The mean age of the cohort was 68 � 10 years, 35% were women, and 81% were treated for hypertension.
The mean blood pressure was 138 � 19/79 � 11 mm Hg, rendering a mean PP of 49 � 16 mm Hg. On univariate analysis,
increasing PP quartile was associated with worse outcomes (p < 0.05 for all comparisons). After adjusting for sex, age,
current smoking status, history of hypercholesterolemia, history of diabetes, aspirin use, statin use, blood pressure
medication use, and mean arterial pressure, PP quartile was still associated with all outcomes except all stroke and
cardiovascular death (p < 0.05 for all comparisons). Analysis of PP as a continuous variable yielded similar results.
CONCLUSIONS In an international cohort of high-risk subjects, PP, a readily available hemodynamic parameter, is
associated with multiple adverse cardiovascular outcomes and provides prognostic utility beyond that of mean arterial
pressure. (J Am Coll Cardiol 2016;67:392–403) © 2016 by the American College of Cardiology Foundation.
m the aBrigham and Women’s Hospital Heart and Vascular Center and Harvard Medical School, Boston, Massachusetts;
épartement Hospitalo-Universitaire FIRE (Fibrosis, Inflammation, Remodelling), Université Paris-Diderot, Sorbonne Paris Cité,
ris, France; cFACT (French Alliance for Cardiovascular Clinical Trials), Hôpital Bichat, Assistance Publique-Hôpitaux de Paris,
ris, France; dINSERM U-1148, Paris, France; eNational Heart and Lung Institute, Royal Brompton Hospital, Imperial College,
ndon, United Kingdom; fHôpital Avicenne, Assistance Publique-Hôpitaux de Paris, Bobigny, France; gUniversité Paris XIII,
bigny, France; hUniversity of Michigan, Ann Arbor, Michigan; iDuke University Medical Center, Durham, North Carolina; andjParis Descartes University, Assistance Publique-Hôpitaux de Paris, Diagnosis and Therapeutic Center, Hôtel-Dieu, Paris,
nce. A full list of the REACH registry investigators can be found in Bhatt DL, Steg PG, Ohman EM, et al. International
valence, recognition, and treatment of cardiovascular risk factors in outpatients with atherothrombosis. JAMA 2006;295:180–9.
e REACH registry was sponsored by Sanofi, Bristol-Myers Squibb, and the Waksman Foundation (Tokyo, Japan) and is endorsed
the World Heart Federation. Dr. Steg has received a research grant from Sanofi and Servier awarded to INSERM U-698 and the
w York University School of Medicine; has served as a consultant or received speaking fees from Ablynx, Amarin, Amgen,
tellas, AstraZeneca, Bayer, Boehringer Ingelheim, Bristol-Myers Squibb, Daiichi-Sankyo, Eisai, GlaxoSmithKline, Eli Lilly,
dtronic, Merck Sharp & Dohme, Novartis, Otsuka, Pfizer, Roche, Sanofi, Servier, The Medicines Company; and holds stock in
erovax. Dr. Feldman has received research grants from Sanofi and Bristol-Myers Squibb. Dr. Blacher has received a research
nt from Servier; and speaking fees from AstraZeneca, Bayer, Bristol-Myers Squibb, Bouchara Recordati, Daïchii-Sankyo,
AB BR E V I A T I O N S
AND ACRONYM S
BMI = body mass index
DBP = diastolic blood pressure
MI = myocardial infarction
PP = pulse pressure
= systolic blood pressure
J A C C V O L . 6 7 , N O . 4 , 2 0 1 6 Selvaraj et al.F E B R U A R Y 2 , 2 0 1 6 : 3 9 2 – 4 0 3 Pulse Pressure and Cardiovascular Outcomes
393
P ulsatile components of blood pressure captureelements of cardiac risk beyond that capturedby steady components (1–3). The former, often
measured as pulse pressure (PP), is recognized as apotent risk factor for cardiovascular disease,including myocardial infarction (MI), stroke, and car-diovascular mortality (4). According to the Windkes-sel model of arterial blood pressure, PP can bethought simply as a reflection of both stroke volumeand arterial wall compliance. Although left ventricu-lar ejection contributes, high PP typically reflectsdecreased arterial compliance, particularly in olderpatients. Hypertension, diabetes, atherosclerosis,and many more conditions alter the cellular matrixof the wall, reducing wall elasticity, and thus theirrelationship to elevation in PP becomes clear.
SEE PAGE 404
Several studies have examined the relationship inspecific populations between PP and adverse cardio-vascular outcomes, with the preponderance of evi-dence favoring an association (4–11). However, thereare few data regarding the predictive value of PP forcardiovascular outcomes in a large, internationalcohort. In addition, peripheral PP, although clinicallymore accessible than central PP, may not be the mostaccurate reflection of left ventricular stress and cor-onary perfusion (10). Thus, understanding whetherperipheral PP is clinically useful warrants furtherstudy. Finally, although a significant proportion,though certainly not all (12,13), of the PP data havebeen generated from hypertensive clinical trials withrestricted patient populations, less is known about itsrelationship to a broad array of subjects in an outpa-tient setting. We therefore sought to examine therelationship between PP and adverse cardiovascularevents using data from the REACH (Reduction ofAtherothrombosis for Continued Health) registry.
GlaxoSmithKline, Ipsen, Menarini, Merck Serono, Merck Sharpe & Dohme, No
Bhatt is a member of the advisory boards of Cardax, Elsevier Practice Upd
sciences; is a member of the boards of directors of the Boston VA Research Ins
is chair of the American Heart Association Get With the Guidelines Steerin
committees of the Duke Clinical Research Institute, the Harvard Clinical Res
Health Research Institute; has received honoraria from the American College
and News, ACC.org), Belvoir Publications (editor-in-chief, Harvard Heart Lett
steering committees), the Harvard Clinical Research Institute (clinical trial st
chief, Journal of Invasive Cardiology), the Journal of the American College
pharmacology), the Population Health Research Institute (clinical trial ste
editor, Cardiology Today’s Intervention), WebMD (continuing medical educat
Cardiology; has received research funding from Amarin, AstraZeneca, Bristo
Ischemix, Medtronic, Pfizer, Roche, Sanofi, and The Medicines Company; an
Pharma, and Takeda. All other authors have reported that they have no re
disclose. Clive Rosendorff, MD, PhD, DSc Med, served as guest editor for th
Manuscript received October 4, 2015; accepted October 27, 2015.
METHODS
STUDY POPULATION. We studied participantsfrom the REACH registry, an international,longitudinal study of atherothrombosis. De-tails regarding the methodology of the studyhave been previously reported (14–17). Inbrief, REACH enrolled stable outpatients $45
years of age with either established atherothromboticdisease (coronary artery disease, cerebrovasculardisease, or peripheral artery disease) or with $3 riskfactors for atherothrombosis. Subjects were recruitedduring a 7-month period between December 2003and June 2004. Because of regulatory requirements,enrollment in Japan was delayed and occurred be-tween August 2004 and December 2004. Final datacollection occurred until April 2009. Exclusion criteriafor the present study were lack of either a completeset of blood pressure measurements or 4 years offollow-up data. Complete follow-up of the initialcohort could not be completed because of withdrawalof some of the study sites. All REACH study partici-pants gave written informed consent, and each studysite’s local Institutional Review Board approved theREACH study.CLINICAL CHARACTERISTICS AND OUTCOME VARIABLES.Baseline height, weight, and seated systolic bloodpressure (SBP) and diastolic blood pressure (DBP)were obtained. Blood pressure was measured usinga brachial mercury sphygmomanometer. PP wasdefined as the difference between the SBP and DBP. Aquality control check with the number of bloodpressure readings ending in zero was performed (18)and showed that 58% of SBP readings and 60% ofDBP readings ended in zero (20% expected). Bodymass index (BMI) was defined as weight in kilogramsdivided by the square of height in meters. Medicalhistory and medications were established using
SBP
vartis, Pileje, Roche, Sanofi, Servier, and Takeda. Dr.
ate Cardiology, Medscape Cardiology, Regado Bio-
titute and the Society of Cardiovascular Patient Care;
g Committee; is a member of the data monitoring
earch Institute, the Mayo Clinic, and the Population
of Cardiology (senior associate editor, Clinical Trials
er), the Duke Clinical Research Institute (clinical trial
eering committee), HMP Communications (editor-in-
of Cardiology (associate editor and section editor,
ering committee), Slack Publications (chief medical
ion steering committees); is deputy editor of Clinical
l-Myers Squibb, Eisai, Ethicon, Forest Laboratories,
d has conducted unfunded research for FlowCo, PLx
lationships relevant to the contents of this paper to
is paper.

Selvaraj et al. J A C C V O L . 6 7 , N O . 4 , 2 0 1 6
Pulse Pressure and Cardiovascular Outcomes F E B R U A R Y 2 , 2 0 1 6 : 3 9 2 – 4 0 3
394
techniques previously documented (14). In particular,diabetes was defined as any history of diabetes orcurrent diabetes (diagnosed by at least 2 fasting bloodglucose measures >7 mmol/l or >126 mg/dl), treatedor not. Hypercholesterolemia was defined as treat-ment with lipid-lowering therapy. Hypertension wasdefined as past or current treatment with antihyper-tensive agents. The primary outcome of the studywas a combined outcome of cardiovascular death(including fatal MI and fatal stroke), nonfatal MI,nonfatal stroke, and cardiovascular hospitalization.Secondary outcomes included each of the individualoutcomes used to formulate the primary outcome inaddition to fatal and nonfatal MI as well as fatal andnonfatal stroke. Reasons for cardiovascular hospital-ization included atherothrombotic events, such astransient ischemic attack, unstable angina, and otherischemic arterial events. Further elaboration of thedefinitions of these outcomes is provided elsewhere(14,16).
STATISTICAL ANALYSIS. Clinical characteristics aredisplayed by PP quartile, for descriptive purposes.Continuous data are presented as mean � SD. Cate-gorical variables are presented as counts and per-centages. Cox proportional hazard models wereconstructed to determine the relationship of PP(per 10 mm Hg increase) with all outcomes. Cutoffranges for each of the PP quartiles were defined asfollows: quartile 1, #50 mm Hg; quartile 2, 50 <PP#60 mm Hg; quartile 3, 60 <PP #70 mm Hg; andquartile 4, >70 mm Hg. Figure 1 displays the rawrelationship between PP quartiles and cardiovascularoutcomes. Given the nonlinear relationship observedin a few of the analyses, adjusted Cox models for eachoutcome with PP introduced as restricted cubicsplines were performed using knots at PP ¼ 40, 60,and 80 mm Hg (Figure 2) (19).
Covariates included in multivariate models wereselected on the basis of clinical relevance as well asassociation with PP in previous studies. Model 1covariates included sex, age, current smoker status,history of hyperlipidemia, history of diabetes melli-tus, aspirin use, and statin use. Model 2 furtheradjusted for history of atherothrombosis (defined ashistory of MI, stroke, or peripheral artery disease).Model 3 additionally adjusted for medications knownto influence PP, including angiotensin-convertingenzyme inhibitors, angiotensin receptor blockers,beta-blocker, calcium-channel blockers, and diureticagents. Finally, model 4 additionally adjusted formean arterial pressure (defined as: [2 �DBP þ SBP] / 3)to determine whether PP adds clinically usefulinformation beyond these parameters (20).
On sensitivity analyses, we analyzed the resultsonly including: 1) women, for whom PP data arelimited in the published research; 2) subjects >60years of age, for whom the relationship with PPis typically stronger (4); 3) subjects without estab-lished atherothrombotic disease; 4) subjects withSBP >140 mm Hg (vs. #140 mm Hg); and 5) subjectstreated for hypertension versus those not treatedfor hypertension, given the reduction of PP withantihypertensive treatment (21).
All primary analyses were repeated using SBP andDBP as the predictor variables instead of PP. A 2-sidedp value #0.05 was considered to indicate statisticalsignificance. Analysis was performed using SASversion 9.3 (SAS Institute Inc., Cary, North Carolina).
RESULTS
CHARACTERISTICS OF STUDY PARTICIPANTS.
Descriptive characteristics of the REACH study sam-ple are displayed in Table 1. Among an eligible 67,888participants, more than two-thirds (n ¼ 45,087) metthe inclusion criteria and were analyzed in the pre-sent study. The vast majority of exclusions were dueto incomplete 4-year follow-up data (n ¼ 22,661). Themean age of the cohort was 68 � 10 years, and 35%were women. Subjects from 29 countries were repre-sented. Comorbidities were common, including hy-pertension (81%), hypercholesterolemia (70%),coronary artery disease (58%), and diabetes mellitus(44%); 82% had established atherothrombotic dis-ease. Long-term medication use reflected standardtherapies used for the comorbidities detailed inTable 1. Blood pressure was relatively well controlled(mean 138 � 19/79 � 11 mm Hg; mean PP 49 � 16mm Hg) and obesity was common (mean BMI 28 � 5kg/m2, 28% obese [BMI >30 kg/m2]). Increasing PPwas associated with increasing age, BMI, and femalesex. There was a significant difference in comorbidityburden profile in the lower and higher PP quartiles.Higher PP quartiles were more likely to have hyper-tension, peripheral arterial disease, and diabetes (p <
0.01 for all comparisons). Lower PP quartiles wereassociated with increasing prevalence of congestiveheart failure, coronary artery disease, smoking, hy-percholesterolemia, and atrial fibrillation (p < 0.05for all comparisons). Medication difference likewisereflected the disparity in comorbidity burden (i.e.,higher antiplatelet agent, nitrate or antianginal agent,statin, and beta-blocker use with lower PP quartiles;p < 0.01 for all comparisons). Online Table 1 showsthe distribution of PP by SBP tiers (<140,140 #PP <160, and $160 mm Hg). Of note, 93% ofsubjects in PP quartile 4 had SBP $140 mm Hg.

FIGURE 1 Pulse Pressure Quartiles and Cardiovascular Outcomes
350
300
250
200
150
100
50
0Num
ber o
f Eve
nts b
y 10
,000
Per
sons
-Yea
r
1 / 40.2 2 / 52.5 3 / 62.1 4 / 79.7Quartiles of Pulse Pressure (Mean)
1 / 40.2 2 / 52.5 3 / 62.1 4 / 79.7Quartiles of Pulse Pressure (Mean)
1 / 40.2 2 / 52.5 3 / 62.1 4 / 79.7Quartiles of Pulse Pressure (Mean)
1 / 40.2 2 / 52.5 3 / 62.1 4 / 79.7Quartiles of Pulse Pressure (Mean)
1 / 40.2 2 / 52.5 3 / 62.1 4 / 79.7Quartiles of Pulse Pressure (Mean)
1 / 40.2 2 / 52.5 3 / 62.1 4 / 79.7Quartiles of Pulse Pressure (Mean)
1 / 40.2 2 / 52.5 3 / 62.1 4 / 79.7Quartiles of Pulse Pressure (Mean)
350
300
250
200
150
100
50
0Num
ber o
f Eve
nts b
y 10
,000
Per
sons
-Yea
r 350
300
250
200
150
100
50
0Num
ber o
f Eve
nts b
y 10
,000
Per
sons
-Yea
r
350
300
250
200
150
100
50
0Num
ber o
f Eve
nts b
y 10
,000
Per
sons
-Yea
r 350
300
250
200
150
100
50
0Num
ber o
f Eve
nts b
y 10
,000
Per
sons
-Yea
r
1000950900850800750700650600550500450400350300250200150100
500Nu
mbe
r of E
vent
s by
10,0
00 P
erso
ns-Y
ear
1400130012001100
1000900800700600500400300200100
0Num
ber o
f Eve
nts b
y 10
,000
Per
sons
-Yea
r
CARDIOVASCULAR DEATH CARDIOVASCULAR HOSPITALIZATION
FATAL AND NONFATAL MYOCARDIAL INFARCTION NONFATAL MYOCARDIAL INFARCTION
FATAL AND NONFATAL STROKE NONFATAL STROKE
COMBINED OUTCOME
186172 178
214
694 675744
812
128 130151 159
87 88102 112
145160
177206
119133
154175
946 9271003
1109
Unadjusted relationship between pulse pressure quartiles and outcomes (p < 0.01 for trend of all outcomes). Mean pulse pressure (millimeters
of mercury) is labeled on the x-axis for each pulse pressure quartile.
J A C C V O L . 6 7 , N O . 4 , 2 0 1 6 Selvaraj et al.F E B R U A R Y 2 , 2 0 1 6 : 3 9 2 – 4 0 3 Pulse Pressure and Cardiovascular Outcomes
395
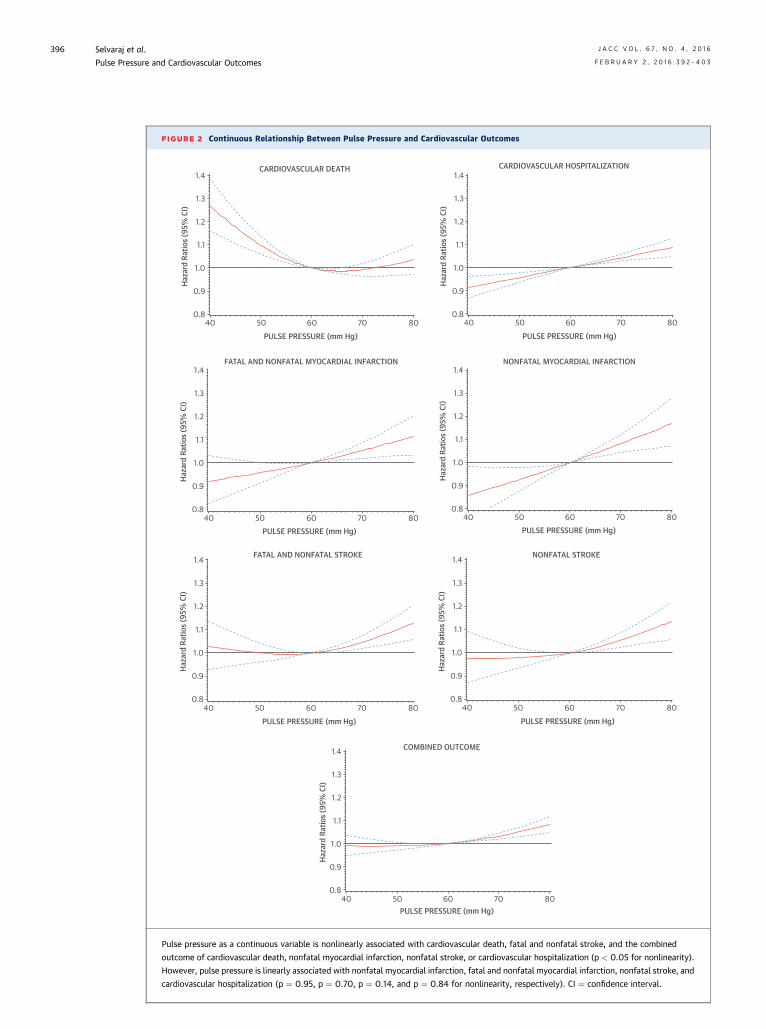
FIGURE 2 Continuous Relationship Between Pulse Pressure and Cardiovascular Outcomes
1.4
1.3
1.2
1.1
1.0
0.9
0.8
Haza
rd R
atio
s (95
% C
I)
40 50 60 70 80PULSE PRESSURE (mm Hg)
1.4
1.3
1.2
1.1
1.0
0.9
0.8
Haza
rd R
atio
s (95
% C
I)
40 50 60 70 80PULSE PRESSURE (mm Hg)
1.4
1.3
1.2
1.1
1.0
0.9
0.8
Haza
rd R
atio
s (95
% C
I)
40 50 60 70 80PULSE PRESSURE (mm Hg)
1.4
1.3
1.2
1.1
1.0
0.9
0.8
Haza
rd R
atio
s (95
% C
I)
40 50 60 70 80PULSE PRESSURE (mm Hg)
1.4
1.3
1.2
1.1
1.0
0.9
0.8
Haza
rd R
atio
s (95
% C
I)
40 50 60 70 80PULSE PRESSURE (mm Hg)
1.4
1.3
1.2
1.1
1.0
0.9
0.8
Haza
rd R
atio
s (95
% C
I)
40 50 60 70 80PULSE PRESSURE (mm Hg)
1.4
1.3
1.2
1.1
1.0
0.9
0.8
Haza
rd R
atio
s (95
% C
I)
40 50 60 70 80PULSE PRESSURE (mm Hg)
CARDIOVASCULAR DEATH CARDIOVASCULAR HOSPITALIZATION
FATAL AND NONFATAL MYOCARDIAL INFARCTION NONFATAL MYOCARDIAL INFARCTION
FATAL AND NONFATAL STROKE NONFATAL STROKE
COMBINED OUTCOME
Pulse pressure as a continuous variable is nonlinearly associated with cardiovascular death, fatal and nonfatal stroke, and the combined
outcome of cardiovascular death, nonfatal myocardial infarction, nonfatal stroke, or cardiovascular hospitalization (p < 0.05 for nonlinearity).
However, pulse pressure is linearly associated with nonfatal myocardial infarction, fatal and nonfatal myocardial infarction, nonfatal stroke, and
cardiovascular hospitalization (p ¼ 0.95, p ¼ 0.70, p ¼ 0.14, and p ¼ 0.84 for nonlinearity, respectively). CI ¼ confidence interval.
Selvaraj et al. J A C C V O L . 6 7 , N O . 4 , 2 0 1 6
Pulse Pressure and Cardiovascular Outcomes F E B R U A R Y 2 , 2 0 1 6 : 3 9 2 – 4 0 3
396
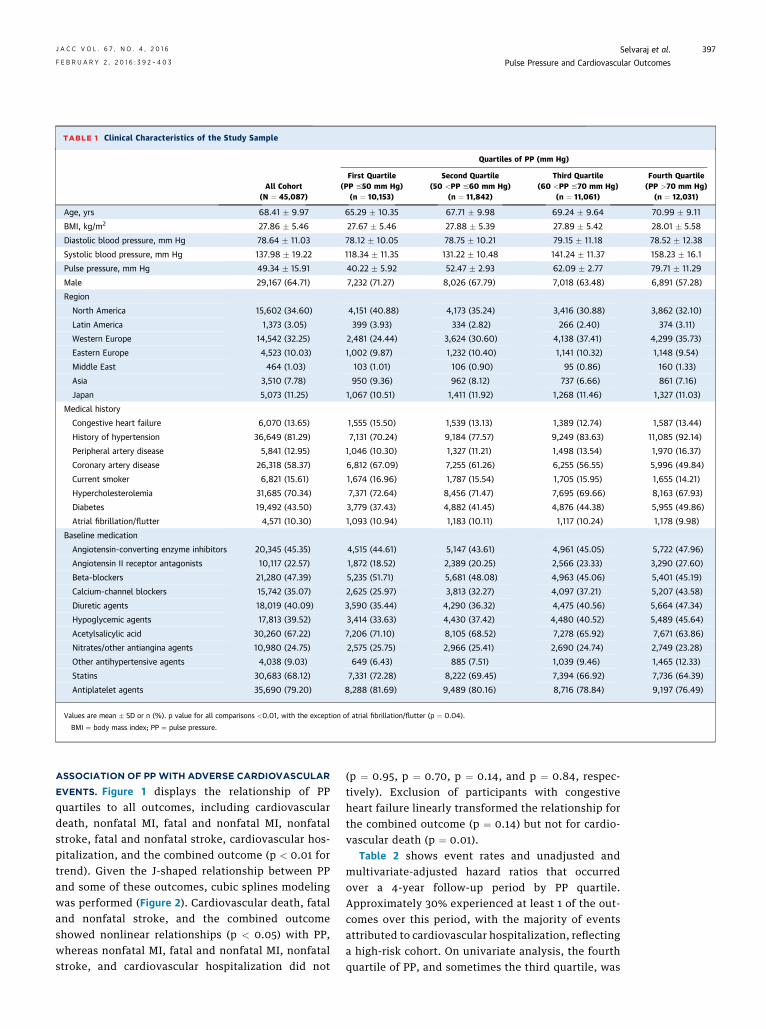
TABLE 1 Clinical Characteristics of the Study Sample
All Cohort(N ¼ 45,087)
Quartiles of PP (mm Hg)
First Quartile(PP #50 mm Hg)
(n ¼ 10,153)
Second Quartile(50 <PP #60 mm Hg)
(n ¼ 11,842)
Third Quartile(60 <PP #70 mm Hg)
(n ¼ 11,061)
Fourth Quartile(PP >70 mm Hg)
(n ¼ 12,031)
Age, yrs 68.41 � 9.97 65.29 � 10.35 67.71 � 9.98 69.24 � 9.64 70.99 � 9.11
BMI, kg/m2 27.86 � 5.46 27.67 � 5.46 27.88 � 5.39 27.89 � 5.42 28.01 � 5.58
Diastolic blood pressure, mm Hg 78.64 � 11.03 78.12 � 10.05 78.75 � 10.21 79.15 � 11.18 78.52 � 12.38
Systolic blood pressure, mm Hg 137.98 � 19.22 118.34 � 11.35 131.22 � 10.48 141.24 � 11.37 158.23 � 16.1
Pulse pressure, mm Hg 49.34 � 15.91 40.22 � 5.92 52.47 � 2.93 62.09 � 2.77 79.71 � 11.29
Male 29,167 (64.71) 7,232 (71.27) 8,026 (67.79) 7,018 (63.48) 6,891 (57.28)
Region
North America 15,602 (34.60) 4,151 (40.88) 4,173 (35.24) 3,416 (30.88) 3,862 (32.10)
Latin America 1,373 (3.05) 399 (3.93) 334 (2.82) 266 (2.40) 374 (3.11)
Western Europe 14,542 (32.25) 2,481 (24.44) 3,624 (30.60) 4,138 (37.41) 4,299 (35.73)
Eastern Europe 4,523 (10.03) 1,002 (9.87) 1,232 (10.40) 1,141 (10.32) 1,148 (9.54)
Middle East 464 (1.03) 103 (1.01) 106 (0.90) 95 (0.86) 160 (1.33)
Asia 3,510 (7.78) 950 (9.36) 962 (8.12) 737 (6.66) 861 (7.16)
Japan 5,073 (11.25) 1,067 (10.51) 1,411 (11.92) 1,268 (11.46) 1,327 (11.03)
Medical history
Congestive heart failure 6,070 (13.65) 1,555 (15.50) 1,539 (13.13) 1,389 (12.74) 1,587 (13.44)
History of hypertension 36,649 (81.29) 7,131 (70.24) 9,184 (77.57) 9,249 (83.63) 11,085 (92.14)
Peripheral artery disease 5,841 (12.95) 1,046 (10.30) 1,327 (11.21) 1,498 (13.54) 1,970 (16.37)
Coronary artery disease 26,318 (58.37) 6,812 (67.09) 7,255 (61.26) 6,255 (56.55) 5,996 (49.84)
Current smoker 6,821 (15.61) 1,674 (16.96) 1,787 (15.54) 1,705 (15.95) 1,655 (14.21)
Hypercholesterolemia 31,685 (70.34) 7,371 (72.64) 8,456 (71.47) 7,695 (69.66) 8,163 (67.93)
Diabetes 19,492 (43.50) 3,779 (37.43) 4,882 (41.45) 4,876 (44.38) 5,955 (49.86)
Atrial fibrillation/flutter 4,571 (10.30) 1,093 (10.94) 1,183 (10.11) 1,117 (10.24) 1,178 (9.98)
Baseline medication
Angiotensin-converting enzyme inhibitors 20,345 (45.35) 4,515 (44.61) 5,147 (43.61) 4,961 (45.05) 5,722 (47.96)
Angiotensin II receptor antagonists 10,117 (22.57) 1,872 (18.52) 2,389 (20.25) 2,566 (23.33) 3,290 (27.60)
Beta-blockers 21,280 (47.39) 5,235 (51.71) 5,681 (48.08) 4,963 (45.06) 5,401 (45.19)
Calcium-channel blockers 15,742 (35.07) 2,625 (25.97) 3,813 (32.27) 4,097 (37.21) 5,207 (43.58)
Diuretic agents 18,019 (40.09) 3,590 (35.44) 4,290 (36.32) 4,475 (40.56) 5,664 (47.34)
Hypoglycemic agents 17,813 (39.52) 3,414 (33.63) 4,430 (37.42) 4,480 (40.52) 5,489 (45.64)
Acetylsalicylic acid 30,260 (67.22) 7,206 (71.10) 8,105 (68.52) 7,278 (65.92) 7,671 (63.86)
Nitrates/other antiangina agents 10,980 (24.75) 2,575 (25.75) 2,966 (25.41) 2,690 (24.74) 2,749 (23.28)
Other antihypertensive agents 4,038 (9.03) 649 (6.43) 885 (7.51) 1,039 (9.46) 1,465 (12.33)
Statins 30,683 (68.12) 7,331 (72.28) 8,222 (69.45) 7,394 (66.92) 7,736 (64.39)
Antiplatelet agents 35,690 (79.20) 8,288 (81.69) 9,489 (80.16) 8,716 (78.84) 9,197 (76.49)
Values are mean � SD or n (%). p value for all comparisons <0.01, with the exception of atrial fibrillation/flutter (p ¼ 0.04).
BMI ¼ body mass index; PP ¼ pulse pressure.
J A C C V O L . 6 7 , N O . 4 , 2 0 1 6 Selvaraj et al.F E B R U A R Y 2 , 2 0 1 6 : 3 9 2 – 4 0 3 Pulse Pressure and Cardiovascular Outcomes
397
ASSOCIATION OF PP WITH ADVERSE CARDIOVASCULAR
EVENTS. Figure 1 displays the relationship of PPquartiles to all outcomes, including cardiovasculardeath, nonfatal MI, fatal and nonfatal MI, nonfatalstroke, fatal and nonfatal stroke, cardiovascular hos-pitalization, and the combined outcome (p < 0.01 fortrend). Given the J-shaped relationship between PPand some of these outcomes, cubic splines modelingwas performed (Figure 2). Cardiovascular death, fataland nonfatal stroke, and the combined outcomeshowed nonlinear relationships (p < 0.05) with PP,whereas nonfatal MI, fatal and nonfatal MI, nonfatalstroke, and cardiovascular hospitalization did not
(p ¼ 0.95, p ¼ 0.70, p ¼ 0.14, and p ¼ 0.84, respec-tively). Exclusion of participants with congestiveheart failure linearly transformed the relationship forthe combined outcome (p ¼ 0.14) but not for cardio-vascular death (p ¼ 0.01).
Table 2 shows event rates and unadjusted andmultivariate-adjusted hazard ratios that occurredover a 4-year follow-up period by PP quartile.Approximately 30% experienced at least 1 of the out-comes over this period, with the majority of eventsattributed to cardiovascular hospitalization, reflectinga high-risk cohort. On univariate analysis, the fourthquartile of PP, and sometimes the third quartile, was
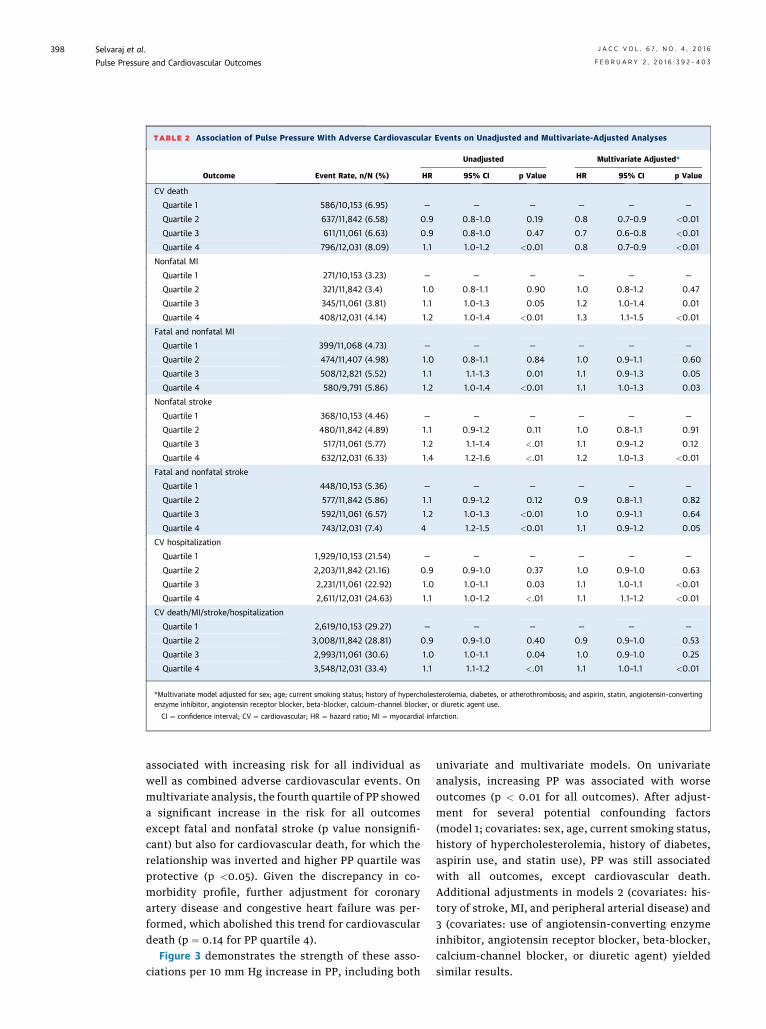
TABLE 2 Association of Pulse Pressure With Adverse Cardiovascular Events on Unadjusted and Multivariate-Adjusted Analyses
Outcome Event Rate, n/N (%)
Unadjusted Multivariate Adjusted*
HR 95% CI p Value HR 95% CI p Value
CV death
Quartile 1 586/10,153 (6.95) — — — — — —
Quartile 2 637/11,842 (6.58) 0.9 0.8–1.0 0.19 0.8 0.7–0.9 <0.01
Quartile 3 611/11,061 (6.63) 0.9 0.8–1.0 0.47 0.7 0.6–0.8 <0.01
Quartile 4 796/12,031 (8.09) 1.1 1.0–1.2 <0.01 0.8 0.7–0.9 <0.01
Nonfatal MI
Quartile 1 271/10,153 (3.23) — — — — — —
Quartile 2 321/11,842 (3.4) 1.0 0.8–1.1 0.90 1.0 0.8–1.2 0.47
Quartile 3 345/11,061 (3.81) 1.1 1.0–1.3 0.05 1.2 1.0–1.4 0.01
Quartile 4 408/12,031 (4.14) 1.2 1.0–1.4 <0.01 1.3 1.1–1.5 <0.01
Fatal and nonfatal MI
Quartile 1 399/11,068 (4.73) — — — — — —
Quartile 2 474/11,407 (4.98) 1.0 0.8–1.1 0.84 1.0 0.9–1.1 0.60
Quartile 3 508/12,821 (5.52) 1.1 1.1–1.3 0.01 1.1 0.9–1.3 0.05
Quartile 4 580/9,791 (5.86) 1.2 1.0–1.4 <0.01 1.1 1.0–1.3 0.03
Nonfatal stroke
Quartile 1 368/10,153 (4.46) — — — — — —
Quartile 2 480/11,842 (4.89) 1.1 0.9–1.2 0.11 1.0 0.8–1.1 0.91
Quartile 3 517/11,061 (5.77) 1.2 1.1–1.4 <.01 1.1 0.9–1.2 0.12
Quartile 4 632/12,031 (6.33) 1.4 1.2–1.6 <.01 1.2 1.0–1.3 <0.01
Fatal and nonfatal stroke
Quartile 1 448/10,153 (5.36) — — — — — —
Quartile 2 577/11,842 (5.86) 1.1 0.9–1.2 0.12 0.9 0.8–1.1 0.82
Quartile 3 592/11,061 (6.57) 1.2 1.0–1.3 <0.01 1.0 0.9–1.1 0.64
Quartile 4 743/12,031 (7.4) 4 1.2–1.5 <0.01 1.1 0.9–1.2 0.05
CV hospitalization
Quartile 1 1,929/10,153 (21.54) — — — — — —
Quartile 2 2,203/11,842 (21.16) 0.9 0.9–1.0 0.37 1.0 0.9–1.0 0.63
Quartile 3 2,231/11,061 (22.92) 1.0 1.0–1.1 0.03 1.1 1.0–1.1 <0.01
Quartile 4 2,611/12,031 (24.63) 1.1 1.0–1.2 <.01 1.1 1.1–1.2 <0.01
CV death/MI/stroke/hospitalization
Quartile 1 2,619/10,153 (29.27) — — — — — —
Quartile 2 3,008/11,842 (28.81) 0.9 0.9–1.0 0.40 0.9 0.9–1.0 0.53
Quartile 3 2,993/11,061 (30.6) 1.0 1.0–1.1 0.04 1.0 0.9–1.0 0.25
Quartile 4 3,548/12,031 (33.4) 1.1 1.1–1.2 <.01 1.1 1.0–1.1 <0.01
*Multivariate model adjusted for sex; age; current smoking status; history of hypercholesterolemia, diabetes, or atherothrombosis; and aspirin, statin, angiotensin-convertingenzyme inhibitor, angiotensin receptor blocker, beta-blocker, calcium-channel blocker, or diuretic agent use.
CI ¼ confidence interval; CV ¼ cardiovascular; HR ¼ hazard ratio; MI ¼ myocardial infarction.
Selvaraj et al. J A C C V O L . 6 7 , N O . 4 , 2 0 1 6
Pulse Pressure and Cardiovascular Outcomes F E B R U A R Y 2 , 2 0 1 6 : 3 9 2 – 4 0 3
398
associated with increasing risk for all individual aswell as combined adverse cardiovascular events. Onmultivariate analysis, the fourth quartile of PP showeda significant increase in the risk for all outcomesexcept fatal and nonfatal stroke (p value nonsignifi-cant) but also for cardiovascular death, for which therelationship was inverted and higher PP quartile wasprotective (p <0.05). Given the discrepancy in co-morbidity profile, further adjustment for coronaryartery disease and congestive heart failure was per-formed, which abolished this trend for cardiovasculardeath (p ¼ 0.14 for PP quartile 4).
Figure 3 demonstrates the strength of these asso-ciations per 10 mm Hg increase in PP, including both
univariate and multivariate models. On univariateanalysis, increasing PP was associated with worseoutcomes (p < 0.01 for all outcomes). After adjust-ment for several potential confounding factors(model 1; covariates: sex, age, current smoking status,history of hypercholesterolemia, history of diabetes,aspirin use, and statin use), PP was still associatedwith all outcomes, except cardiovascular death.Additional adjustments in models 2 (covariates: his-tory of stroke, MI, and peripheral arterial disease) and3 (covariates: use of angiotensin-converting enzymeinhibitor, angiotensin receptor blocker, beta-blocker,calcium-channel blocker, or diuretic agent) yieldedsimilar results.
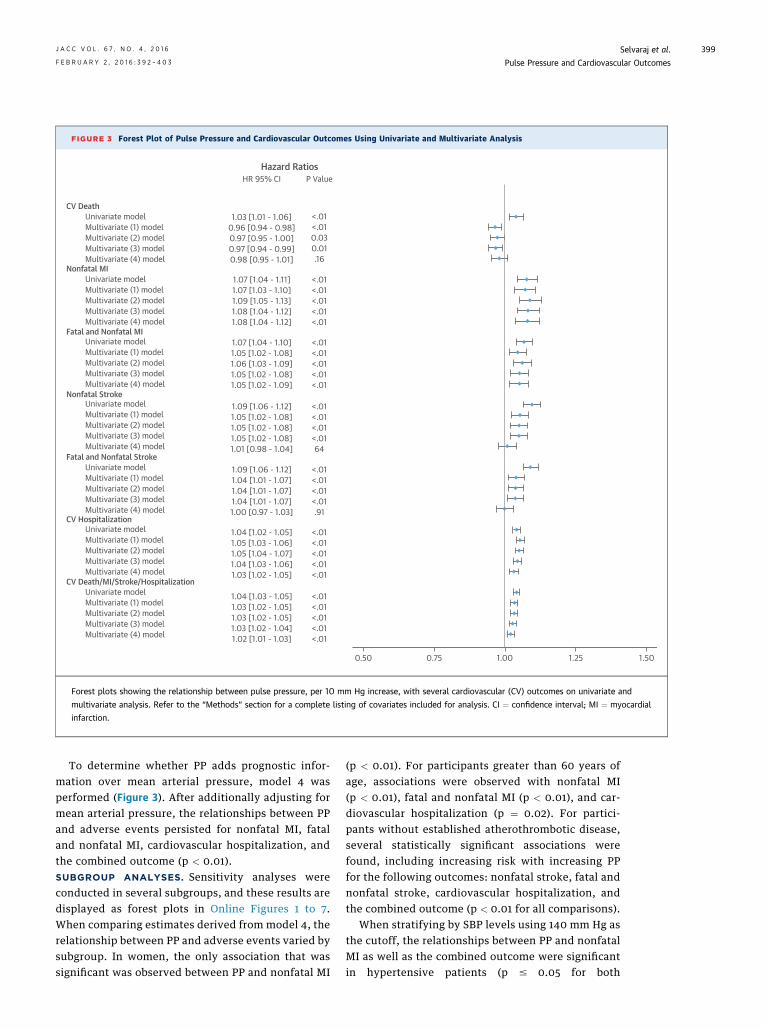
FIGURE 3 Forest Plot of Pulse Pressure and Cardiovascular Outcomes Using Univariate and Multivariate Analysis
Hazard RatiosHR 95% CI P Value
CV Death
Nonfatal MI
Fatal and Nonfatal MI
Nonfatal Stroke
Fatal and Nonfatal Stroke
CV Hospitalization
CV Death/MI/Stroke/Hospitalization
Univariate modelMultivariate (1) modelMultivariate (2) modelMultivariate (3) modelMultivariate (4) model
Univariate modelMultivariate (1) modelMultivariate (2) modelMultivariate (3) modelMultivariate (4) model
Univariate modelMultivariate (1) modelMultivariate (2) modelMultivariate (3) modelMultivariate (4) model
Univariate modelMultivariate (1) modelMultivariate (2) modelMultivariate (3) modelMultivariate (4) model
Univariate modelMultivariate (1) modelMultivariate (2) modelMultivariate (3) modelMultivariate (4) model
Univariate modelMultivariate (1) modelMultivariate (2) modelMultivariate (3) modelMultivariate (4) model
Univariate modelMultivariate (1) modelMultivariate (2) modelMultivariate (3) modelMultivariate (4) model
1.03 [1.01 - 1.06]0.96 [0.94 - 0.98]0.97 [0.95 - 1.00]0.97 [0.94 - 0.99]0.98 [0.95 - 1.01]
1.07 [1.04 - 1.11]1.07 [1.03 - 1.10]1.09 [1.05 - 1.13]1.08 [1.04 - 1.12]1.08 [1.04 - 1.12]
1.07 [1.04 - 1.10]1.05 [1.02 - 1.08]1.06 [1.03 - 1.09]1.05 [1.02 - 1.08]1.05 [1.02 - 1.09]
1.09 [1.06 - 1.12]1.05 [1.02 - 1.08]1.05 [1.02 - 1.08]1.05 [1.02 - 1.08]1.01 [0.98 - 1.04]
1.09 [1.06 - 1.12]1.04 [1.01 - 1.07]1.04 [1.01 - 1.07]1.04 [1.01 - 1.07]1.00 [0.97 - 1.03]
1.04 [1.02 - 1.05]1.05 [1.03 - 1.06]1.05 [1.04 - 1.07]1.04 [1.03 - 1.06]1.03 [1.02 - 1.05]
1.04 [1.03 - 1.05]1.03 [1.02 - 1.05]1.03 [1.02 - 1.05]1.03 [1.02 - 1.04]1.02 [1.01 - 1.03]
<.01<.010.030.01.16
<.01<.01<.01<.01<.01
<.01<.01<.01<.01<.01
<.01<.01<.01<.0164
<.01<.01<.01<.01.91
<.01<.01<.01<.01<.01
<.01<.01<.01<.01<.01
0.50 0.75 1.00 1.25 1.50
Forest plots showing the relationship between pulse pressure, per 10 mm Hg increase, with several cardiovascular (CV) outcomes on univariate and
multivariate analysis. Refer to the “Methods” section for a complete listing of covariates included for analysis. CI ¼ confidence interval; MI ¼ myocardial
infarction.
J A C C V O L . 6 7 , N O . 4 , 2 0 1 6 Selvaraj et al.F E B R U A R Y 2 , 2 0 1 6 : 3 9 2 – 4 0 3 Pulse Pressure and Cardiovascular Outcomes
399
To determine whether PP adds prognostic infor-mation over mean arterial pressure, model 4 wasperformed (Figure 3). After additionally adjusting formean arterial pressure, the relationships between PPand adverse events persisted for nonfatal MI, fataland nonfatal MI, cardiovascular hospitalization, andthe combined outcome (p < 0.01).SUBGROUP ANALYSES. Sensitivity analyses wereconducted in several subgroups, and these results aredisplayed as forest plots in Online Figures 1 to 7.When comparing estimates derived from model 4, therelationship between PP and adverse events varied bysubgroup. In women, the only association that wassignificant was observed between PP and nonfatal MI
(p < 0.01). For participants greater than 60 years ofage, associations were observed with nonfatal MI(p < 0.01), fatal and nonfatal MI (p < 0.01), and car-diovascular hospitalization (p ¼ 0.02). For partici-pants without established atherothrombotic disease,several statistically significant associations werefound, including increasing risk with increasing PPfor the following outcomes: nonfatal stroke, fatal andnonfatal stroke, cardiovascular hospitalization, andthe combined outcome (p < 0.01 for all comparisons).
When stratifying by SBP levels using 140 mm Hg asthe cutoff, the relationships between PP and nonfatalMI as well as the combined outcome were significantin hypertensive patients (p # 0.05 for both
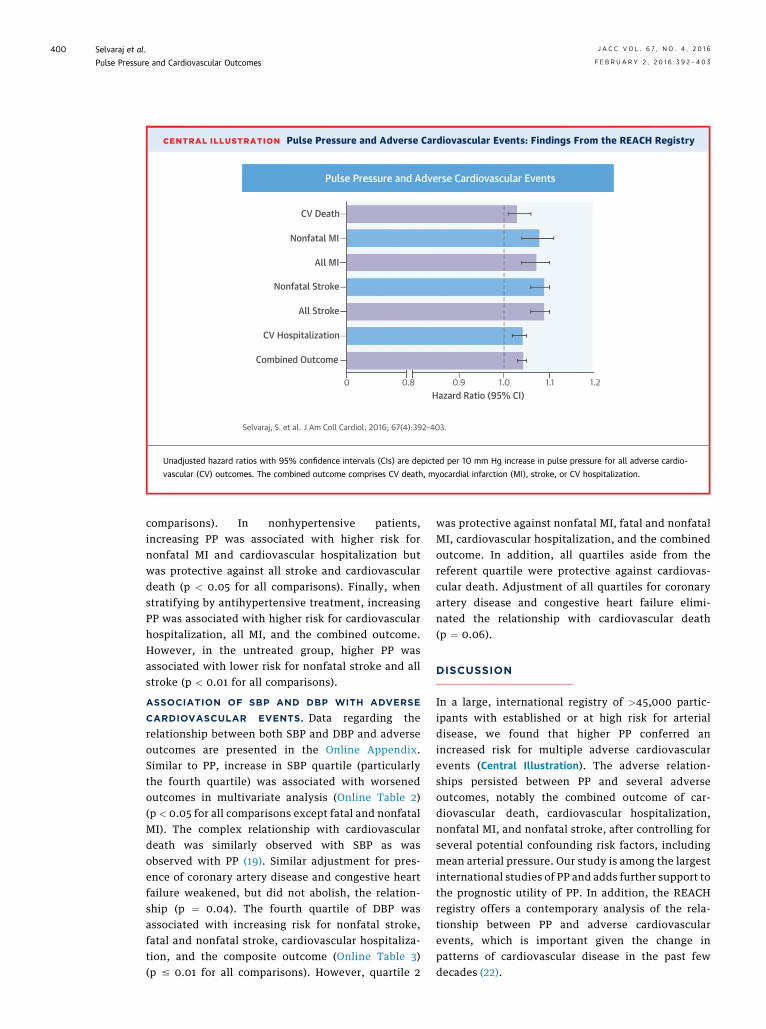
CENTRAL ILLUSTRATION Pulse Pressure and Adverse Cardiovascular Events: Findings From the REACH Registry
0 0.8 0.9 1.0 1.1 1.2Hazard Ratio (95% CI)
CV Death
Nonfatal MI
All MI
Nonfatal Stroke
All Stroke
CV Hospitalization
Combined Outcome
Pulse Pressure and Adverse Cardiovascular Events
Selvaraj, S. et al. J Am Coll Cardiol. 2016; 67(4):392–403.
Unadjusted hazard ratios with 95% confidence intervals (CIs) are depicted per 10 mm Hg increase in pulse pressure for all adverse cardio-
vascular (CV) outcomes. The combined outcome comprises CV death, myocardial infarction (MI), stroke, or CV hospitalization.
Selvaraj et al. J A C C V O L . 6 7 , N O . 4 , 2 0 1 6
Pulse Pressure and Cardiovascular Outcomes F E B R U A R Y 2 , 2 0 1 6 : 3 9 2 – 4 0 3
400
comparisons). In nonhypertensive patients,increasing PP was associated with higher risk fornonfatal MI and cardiovascular hospitalization butwas protective against all stroke and cardiovasculardeath (p < 0.05 for all comparisons). Finally, whenstratifying by antihypertensive treatment, increasingPP was associated with higher risk for cardiovascularhospitalization, all MI, and the combined outcome.However, in the untreated group, higher PP wasassociated with lower risk for nonfatal stroke and allstroke (p < 0.01 for all comparisons).
ASSOCIATION OF SBP AND DBP WITH ADVERSE
CARDIOVASCULAR EVENTS. Data regarding therelationship between both SBP and DBP and adverseoutcomes are presented in the Online Appendix.Similar to PP, increase in SBP quartile (particularlythe fourth quartile) was associated with worsenedoutcomes in multivariate analysis (Online Table 2)(p < 0.05 for all comparisons except fatal and nonfatalMI). The complex relationship with cardiovasculardeath was similarly observed with SBP as wasobserved with PP (19). Similar adjustment for pres-ence of coronary artery disease and congestive heartfailure weakened, but did not abolish, the relation-ship (p ¼ 0.04). The fourth quartile of DBP wasassociated with increasing risk for nonfatal stroke,fatal and nonfatal stroke, cardiovascular hospitaliza-tion, and the composite outcome (Online Table 3)(p # 0.01 for all comparisons). However, quartile 2
was protective against nonfatal MI, fatal and nonfatalMI, cardiovascular hospitalization, and the combinedoutcome. In addition, all quartiles aside from thereferent quartile were protective against cardiovas-cular death. Adjustment of all quartiles for coronaryartery disease and congestive heart failure elimi-nated the relationship with cardiovascular death(p ¼ 0.06).
DISCUSSION
In a large, international registry of >45,000 partic-ipants with established or at high risk for arterialdisease, we found that higher PP conferred anincreased risk for multiple adverse cardiovascularevents (Central Illustration). The adverse relation-ships persisted between PP and several adverseoutcomes, notably the combined outcome of car-diovascular death, cardiovascular hospitalization,nonfatal MI, and nonfatal stroke, after controlling forseveral potential confounding risk factors, includingmean arterial pressure. Our study is among the largestinternational studies of PP and adds further support tothe prognostic utility of PP. In addition, the REACHregistry offers a contemporary analysis of the rela-tionship between PP and adverse cardiovascularevents, which is important given the change inpatterns of cardiovascular disease in the past fewdecades (22).
J A C C V O L . 6 7 , N O . 4 , 2 0 1 6 Selvaraj et al.F E B R U A R Y 2 , 2 0 1 6 : 3 9 2 – 4 0 3 Pulse Pressure and Cardiovascular Outcomes
401
Furthermore, given the large population and sig-nificant number of events, we were able to performmultiple sensitivity analyses to define more preciselythe relationship between PP and adverse events inseveral subgroups. Of note, strong relationships wereobserved in participants without established athero-thrombotic disease, suggesting that despite beinglower risk, PP still has strong prognostic value. Inparticipants older than 60 years of age, PP was asso-ciated with nonfatal MI and cardiovascular hospital-ization. As shown previously, PP is particularly usefulin older patients, because SBP and DBP tend todiverge after age 55 (23). Therefore, the resultant PPwidening becomes a more accurate assessment ofvascular bed compliance and cardiovascular risk.
The degree of SBP, we found, was also important.In hypertensive patients, there were significant in-creases in nonfatal MI and the combined outcome.However, in nonhypertensive subjects, this relation-ship with cardiovascular outcomes was mixed.Increasing PP was associated with higher risk fornonfatal MI and cardiovascular hospitalization;however, it was also protective against fatal andnonfatal stroke and, as a result, cardiovascular death,likely secondary to the resultant relationship be-tween stroke and low DBP with widening PP (24). Twostudies from the Framingham cohort found that PPindependently predicted cardiovascular disease butthat elevated SBP was an important modifying riskfactor in the relationship (25,26). Finally, antihyper-tensive treatment also influences the relationshipbetween PP and adverse events. For patients ontreatment for hypertension, there was an increasedrisk for cardiovascular hospitalization, all MI, and thecombined endpoint. For patients not on treatment forhypertension, increasing PP was protective againagainst nonfatal stroke and all stroke, which is againlikely secondary to lower stroke risk with lower DBP.
It is important to note that these adverse re-lationships observed in the entire study populationwere most prominent with the fourth quartile of PP(corresponding to a PP of >70 mm Hg) and sometimeswith the third quartile. The vast majority of patientsin the fourth quartile of PP were hypertensive(SBP $140 mm Hg), while nearly one-half were veryhypertensive (SBP $160 mm Hg). Thus, it is particu-larly notable that this quartile of PP continued tohave significant associations with numerous adverseevents even after adjusting for mean blood pressure.In addition, some of these relationships were J sha-ped (including cardiovascular death, all stroke, andthe combined outcome). Thus, high PP states likelyreflect adverse hemodynamic status, whereas low PPis not necessarily reassuring, because the latter may
indicate poor perfusion states. This hypothesis wasfurther explored by removing patients with heartfailure, which linearly transformed the relationshipfor the combined outcome, suggesting that low PPmay be most problematic in this group and likely re-flects low stroke volume (27).
Despite several studies on the topic, there is stillsome debate as to whether PP adds to cardiovascularrisk stratification. The Framingham Heart Studyshowed in a cohort of nearly 2,000 participants thatneither SBP nor DBP was superior to PP in predictingcoronary events (4). However, this cohort wasinitially free of coronary heart disease and not takingantihypertensive medications. Conversely, in MRFIT(Multiple Risk Factor Intervention Trial), PP was,interestingly, found to be inferior to SBP and DBP incardiovascular risk assessment in male patients freeof diabetes mellitus and MI (11). The cohort analyzedin the present study was at higher risk than theseother cohorts, with a predominantly hypertensivepopulation and many with established athero-thrombosis. Our findings of the additive utility of PPare consistent with other studies in higher risk pop-ulations (19,20).
The pathophysiologic correlates of elevated PP arecomplex. Increasing PP causes increased cyclicstretch on vascular structures. These changes inintramural tension catalyze numerous pathways,including atherosclerotic remodeling, facilitateproinflammatory cell migration, and increase oxidantproduction (1). Although increasing PP clearly accel-erates atherothrombosis, the reverse is also true,whereby plaque formation increases vascular stiff-ness, and thereby PP, creating a vicious cycle. Previ-ous study of peripheral PP has yielded inconsistentresults in relation to adverse cardiovascular events.The large sample size of the present study providedenough power to detect a relationship. The relativerisks for adverse events calculated here are compa-rable with those observed in previous studies (20,28).
We also examined the relationship between bothSBP and DBP and adverse cardiovascular events. PPand SBP followed similar trends, as changes in PPquartiles largely reflect changes in SBP. In addition,there were J-shaped relationships between DBP and afew outcomes, including the combined outcome,which is consistent with a large, previous study inpatients with atherothrombosis, in whom low bloodpressure may not be ideal (19,29). Low diastolic pres-sure may be poorly tolerated because this may reflectreduced coronary filling, which predominantly occursduring diastole. Conversely, low DBP may reflect“reverse causality,” wherein low pressure is a symp-tom of the disease, not a cause, and therefore may

PERSPECTIVES
COMPETENCY IN PATIENT CARE AND
PROCEDURAL SKILLS: PP, which can arise as a
consequence of arterial stiffness in patients with
atherosclerosis, is a marker of cardiovascular disease
burden and identifies patients at risk for ischemic
events irrespective of age, sex, SBP, antihypertensive
therapy, or previous atherothrombotic events.
TRANSLATIONAL OUTLOOK: Future studies
should assess the outcomes of therapies that specif-
ically target long-term reduction of arterial PP.
Selvaraj et al. J A C C V O L . 6 7 , N O . 4 , 2 0 1 6
Pulse Pressure and Cardiovascular Outcomes F E B R U A R Y 2 , 2 0 1 6 : 3 9 2 – 4 0 3
402
represent a sicker population (30). Furthermore, PPcontinued to show a more linear relationship withstroke, as seen previously (19,31). The discrepant re-lationships between SBP and DBP and adverse car-diovascular events stress the importance ofcalculating PP. However, our findings are not meant tosupport the isolated use of PP. As also demonstratedin the Framingham Heart Study, the combined use ofboth static (i.e., SBP or mean arterial pressure) anddynamic (i.e., PP) measurements best captures car-diovascular risk (32).
Current guidelines for the management of hyper-tension have focused on SBP and DBP (33). PP haspreviously been identified as providing prognosticvalue even beyond the previous iteration of the JointNational Committee classification for hypertension(3). In addition, normal mean arterial pressure canstill signify increased cardiovascular risk in thesetting of high PP (34). Because PP is easily calculatedfrom blood pressure, its clinical utility is high.Reduction in PP may serve as a therapeutic target;however, future research is necessary to delineate itsrole more precisely.STUDY LIMITATIONS. Our results should be inter-preted in the context of several limitations. First,central PP may provide physiologically more relevantinformation than peripheral measurements, becauseproximal measurements capture effects perceived bythe heart as well as the coronary and carotid arteries.However, obtaining these data requires special de-vices not amenable to routine clinical practice; inaddition, a recent meta-analysis showed that centralPP does not offer a significant increase in predictiveability over peripheral PP (28).
Second, heart rate was not collected and thereforecould not be adjusted for on multivariate analysis.
Third, REACH studied high-risk subjects withclinical atherothrombotic disease or multiple riskfactors for atherothrombosis. Therefore, our resultsmay not be generalizable to healthier cohorts. How-ever, we performed subgroup analysis in subjectswithout established atherothrombosis, and manyadverse relationships were still observed.
Fourth, REACH did not identify subjects with se-vere aortic stenosis, which could explain the rela-tionship between low PP and increased cardiovascular
mortality even after excluding patients with heartfailure.
Fifth, the REACH registry does not provide ambu-latory blood pressure measurements, which havebeen shown to improve cardiovascular risk stratifi-cation (35).
Sixth, our study demonstrated digit preferencebias, reflected by the higher than expected number ofblood pressure readings ending in zero, which hasbeen observed in numerous previous studies (36–38).It is not clear if this affected our results, but it doesunderscore the need for better training in the mea-surement of blood pressure in clinical practice.
CONCLUSIONS
In a large study of high-risk subjects with risk factorsfor, or established, atherothrombosis, PP adds valu-able information in cardiovascular risk stratificationto standard risk factors, including mean arterial pres-sure. These results are particularly relevant becausethe population reflects many modern clinical prac-tices, given the large burden of atherothrombotic dis-ease studied here. PP, which is readily available in theoffice setting, can help risk stratify high-risk patients.
REPRINT REQUESTS AND CORRESPONDENCE: Dr.Deepak L. Bhatt, Brigham and Women’s Hospital,Department of Cardiology, 75 Francis Street, Boston,Massachusetts 02115. E-mail: [email protected].
RE F E RENCE S
1. Safar ME, Blacher J, Jankowski P. Arterial stiff-ness, pulse pressure, and cardiovascular disease-isit possible to break the vicious circle? Athero-sclerosis 2011;218:263–71.
2. Blacher J, Staessen JA, Girerd X, et al. Pulsepressure not mean pressure determines cardio-vascular risk in older hypertensive patients. ArchIntern Med 2000;160:1085–9.
3. Domanski M, Norman J, Wolz M, et al. Cardio-vascular risk assessment using pulse pressure in thefirst National Health and Nutrition ExaminationSurvey (NHANES I). Hypertension 2001;38:793–7.

J A C C V O L . 6 7 , N O . 4 , 2 0 1 6 Selvaraj et al.F E B R U A R Y 2 , 2 0 1 6 : 3 9 2 – 4 0 3 Pulse Pressure and Cardiovascular Outcomes
403
4. Franklin SS, Khan SA, Wong ND, et al. Is pulsepressure useful in predicting risk for coronaryheart disease? The Framingham Heart Study. Cir-culation 1999;100:354–60.
5. Dyer AR, Stamler J, Shekelle RB, et al. Pulsepressure—III. Prognostic significance in four Chi-cago epidemiologic studies. J Chronic Dis 1982;35:283–94.
6. Franklin SS. Cardiovascular risks related toincreased diastolic, systolic and pulse pressure. Anepidemiologist’s point of view. Pathol Biol (Paris)1999;47:594–603.
7. Lee ML, Rosner BA, Weiss ST. Relationship ofblood pressure to cardiovascular death: the ef-fects of pulse pressure in the elderly. Ann Epi-demiol 1999;9:101–7.
8. Verdecchia P, Schillaci G, Borgioni C, et al.Ambulatory pulse pressure: a potent predictor oftotal cardiovascular risk in hypertension. Hyper-tension 1998;32:983–8.
9. Pini R, Cavallini MC, Palmieri V, et al. Centralbut not brachial blood pressure predicts cardio-vascular events in an unselected geriatric popu-lation: the ICARe Dicomano Study. J Am CollCardiol 2008;51:2432–9.
10. Roman MJ, Devereux RB, Kizer JR, et al. Cen-tral pressure more strongly relates to vasculardisease and outcome than does brachial pressure:the Strong Heart Study. Hypertension 2007;50:197–203.
11. Domanski M, Mitchell G, Pfeffer M, et al. Pulsepressure and cardiovascular disease-related mor-tality: follow-up study of the Multiple Risk FactorIntervention Trial (MRFIT). JAMA 2002;287:2677–83.
12. Gu YM, Thijs L, Li Y, et al. Outcome-driventhresholds for ambulatory pulse pressure in 9938participants recruited from 11 populations. Hy-pertension 2014;63:229–37.
13. Aparicio LS, Thijs L, Asayama K, et al. Refer-ence frame for home pulse pressure based oncardiovascular risk in 6470 subjects from 5 pop-ulations. Hypertens Res 2014;37:672–8.
14. Bhatt DL, Steg PG, Ohman EM, et al. Interna-tional prevalence, recognition, and treatment ofcardiovascular risk factors in outpatients withatherothrombosis. JAMA 2006;295:180–9.
15. Ohman EM, Bhatt DL, Steg PG, et al. TheReduction of Atherothrombosis for ContinuedHealth (REACH) registry: an international, pro-spective, observational investigation in subjects atrisk for atherothrombotic events-study design. AmHeart J 2006;151:786.e1–10.
16. Steg PG, Bhatt DL, Wilson PW, et al. One-yearcardiovascular event rates in outpatients withatherothrombosis. JAMA 2007;297:1197–206.
17. Bhatt DL, Eagle KA, Ohman EM, et al.Comparative determinants of 4-year cardiovascu-lar event rates in stable outpatients at risk of orwith atherothrombosis. JAMA 2010;304:1350–7.
18. Kuznetsova T, Staessen JA, Kawecka-Jaszcz K,et al. Quality control of the blood pressurephenotype in the European Project on Genes inHypertension. Blood Press Monit 2002;7:215–24.
19. Dorresteijn JA, van der Graaf Y, Spiering W,et al. Relation between blood pressure andvascular events and mortality in patients withmanifest vascular disease: J-curve revisited. Hy-pertension 2012;59:14–21.
20. Benetos A, Rudnichi A, Safar M, Guize L. Pulsepressure and cardiovascular mortality in normo-tensive and hypertensive subjects. Hypertension1998;32:560–4.
21. Laurent S, Briet M, Boutouyrie P. Large andsmall artery cross-talk and recent morbidity-mortality trials in hypertension. Hypertension2009;54:388–92.
22. Yang Q, Cogswell ME, Flanders WD, et al.Trends in cardiovascular health metrics and asso-ciations with all-cause and CVD mortality amongUS adults. JAMA 2012;307:1273–83.
23. Franklin SS, Gustin WT, Wong ND, et al. He-modynamic patterns of age-related changes inblood pressure. The Framingham Heart Study.Circulation 1997;96:308–15.
24. MacMahon S, Peto R, Cutler J, et al. Bloodpressure, stroke, and coronary heart disease. Part1, prolonged differences in blood pressure: pro-spective observational studies corrected for theregression dilution bias. Lancet 1990;335:765–74.
25. Franklin SS, Gokhale SS, Chow VH, et al. Doeslow diastolic blood pressure contribute to the riskof recurrent hypertensive cardiovascular diseaseevents? The Framingham Heart Study. Hyperten-sion 2015;65:299–305.
26. Kannel WB, Wilson PW, Nam BH, et al. A likelyexplanation for the J-curve of blood pressurecardiovascular risk. Am J Cardiol 2004;94:380–4.
27. Jackson CE, Castagno D, Maggioni AP, et al.Differing prognostic value of pulse pressure inpatients with heart failure with reduced or pre-served ejection fraction: results from the MAGGICindividual patient meta-analysis. Eur Heart J 2015;36:1106–14.
28. Vlachopoulos C, Aznaouridis K, O’Rourke MF,et al. Prediction of cardiovascular events and all-cause mortality with central haemodynamics: asystematic review and meta-analysis. Eur Heart J2010;31:1865–71.
29. Cooper-DeHoff RM, Gong Y, Handberg EM,et al. Tight blood pressure control and cardiovas-cular outcomes among hypertensive patients with
diabetes and coronary artery disease. JAMA 2010;304:61–8.
30. Rosendorff C, Lackland DT, Allison M, et al.Treatment of hypertension in patients withcoronary artery disease: a scientific statementfrom the American Heart Association, AmericanCollege of Cardiology, and American Society ofHypertension. J Am Coll Cardiol 2015;65:1998–2038.
31. PROGRESS Collaborative Group. Randomisedtrial of a perindopril-based blood-pressure-lowering regimen among 6,105 individuals withprevious stroke or transient ischaemic attack.Lancet 2001;358:1033–41.
32. Franklin SS, Lopez VA, Wong ND, et al. Singleversus combined blood pressure components andrisk for cardiovascular disease: the FraminghamHeart Study. Circulation 2009;119:243–50.
33. James PA, Oparil S, Carter BL, et al. 2014evidence-based guideline for the management ofhigh blood pressure in adults: report from thepanel members appointed to the Eighth JointNational Committee (JNC 8). JAMA 2014;311:507–20.
34. Domanski MJ, Mitchell GF, Norman JE, et al.Independent prognostic information provided bysphygmomanometrically determined pulse pres-sure and mean arterial pressure in patients withleft ventricular dysfunction. J Am Coll Cardiol1999;33:951–8.
35. Piper MA, Evans CV, Burda BU, et al. Diag-nostic and predictive accuracy of blood pressurescreening methods with consideration of rescre-ening intervals: a systematic review for the U.S.Preventive Services Task Force. Ann Intern Med2015;162:192–204.
36. Kim ES, Samuels TA, Yeh HC, et al. End-digitpreference and the quality of blood pressuremonitoring in diabetic adults. Diabetes Care 2007;30:1959–63.
37. Ali S, Rouse A. Practice audits: reliability ofsphygmomanometers and blood pressure recordingbias. J Hum Hypertens 2002;16:359–61.
38. Thavarajah S, White WB, Mansoor GA. Termi-nal digit bias in a specialty hypertension facultypractice. J Hum Hypertens 2003;17:819–22.
KEY WORDS blood pressure, diastolicblood pressure, hypertension, systolic bloodpressure, wave reflections
APPENDIX For supplemental figures andtables, please see the online version of thisarticle.