pulse of the industry - eyfile/ey-pulse-of-the-industry.pdf · welcome to the 2015 edition of pulse...
TRANSCRIPT

1Medical technology report 2015
Medical technology report 2015
Pulse of the industry

Welcome to the 2015 edition of Pulse of the industry, EY’s eighth annual report on the medical technology industry.
In previous issues, we documented how the shifts to value-based health care and patient-centrism continue to transform the sector, which, because of its iterative product cycle, remains susceptible to commoditization.
The medtech industry’s financial performance for the 12 months that ended 30 June 2015 underscores the challenges this diverse set of companies continue to face: overall revenue growth for the industry remains tepid, as a tougher reimbursement climate depresses new product sales. Meantime, early-stage, venture-backed companies, the lifeblood of medtech’s future innovations, continue to struggle as a result of a shrinking pool of committed venture investors.
In 2014–15, these obstacles were partially offset by a record number of initial public offerings and debt deals, a healthy market for mergers and acquisitions, and an increased emphasis on R&D spending.
Despite these gains, the medical technology industry cannot afford complacency. Investors will rightly continue to ask executive teams, “Where’s the growth?” We believe reigniting revenue growth requires continued focus on the development of breakthrough products and solutions that improve health outcomes. It is those innovations that will catalyze and sustain investor enthusiasm in medtech.
At EY, we aren’t becoming complacent either. Long-time readers will notice a change in the format of this year’s report. Recognizing that time is precious, we are moving away from issuing large, once-yearly reports to the more frequent publication of insights via a new digital platform. We are “unbundling” content to give readers access to insights when they are most needed: in real time.
As medtech companies strive to solve harder problems, EY’s global organization continues to have its “pulse” on the industry. You can keep up to date with our latest perspectives at our new digital home, Vital Signs: ey.com/vitalsigns.
We look forward to ongoing conversations with you in one-on-one discussions and via social media. For more, please visit our Twitter feed: @EY_LifeSciences.
To our clients and friends:
2 EY | Pulse of the industry
Connect with us @EY_LifeSciences ey.com/vitalsigns
Glen Giovannetti Global Life Sciences Leader

Contents
Year in review
Financial performance
Financing
Mergers and acquisitions
Appendix
4 12 32 48 58

4 EY | Pulse of the industry
Medtech’s recent lack of growth may be best explained by the fact that the sector hasn’t been immune to the increased demands to demonstrate value in health care.
Pulse 2015
Year in review

5Medical technology report 2015
Optimists and pessimists could even point to the same medtech metrics — say, the total amount of capital raised by the industry in that 12-month period, or a rising number of premarket approvals (PMAs) — and see completely different things.
Medtech’s recent lack of growth may be best explained by the fact that the sector hasn’t been immune to the increased demands to demonstrate value in health care. In fact, medtech, with its iterative product development cycle, is particularly susceptible to the value-based criticisms that may depress new product sales. As a consequence, organic growth has been difficult to achieve, particularly at the industry’s leading therapeutic device companies, since true breakthrough innovation remains rare.
But macro trends giveth as well as taketh away. The fact that the medtech industry outperformed the broader market during 2014 and the first half of 2015 has been due largely to the warmth investors have shown the overall life sciences and health care sectors.
Meanwhile, the medtech sector on the whole has increased its research and development (R&D) spend, albeit slowly, and returned less cash to shareholders through dividends and share buybacks. This might be seen as a shift toward investing in innovation for the medium and longer terms. But again, it may also point to an industry forced to generate more and better evidence for the same kind of iterative innovation that has driven it for years. Whether industry is accelerating the speed of innovation — or simply spending more to achieve the same pace — remains to be seen.
A booming M&A marketMedtech’s tepid growth, as well as the historically low cost of capital, combined to enable a booming M&A environment. Indeed, M&A allowed the industry’s larger, but slower-growing, companies opportunities to grow their top and bottom lines. The year saw its fair share of large M&A
deals, as companies pursued scale in their chosen fields. It also boasted a spate of spin-off deals, as diversified companies sought greater focus or shed underperforming business units.
While the most recent 12-month period saw fewer total M&A deals than any time since 2010–11, average deal size for non-megadeals (defined as deals worth less than US$10 billion) reached a four-year high. Notably, from July 2014 through June 2015, the medtech industry announced 16 deals worth at least US$1 billion. Acquisitions tended to feature fewer structured milestone payments as well. That shift reflected the increased options available to smaller companies, such as pursuing IPOs. It was also an indication of the more mature nature of the acquisition targets, which because they were generating revenues were less subject to binary risks from clinical trials or regulatory hurdles.
The 12 months that ended 30 June 2015 provide a Rorschach test for the medical technology industry. A record number of initial public offerings (IPOs) and a healthy mergers and acquisitions (M&A) market are reasonable causes for optimism. The sector’s overall single-digit revenue growth, dwindling interest from a shrinking venture capital community and a tougher reimbursement environment are legitimate reasons to be concerned.
Pulse 2015

6 EY | Pulse of the industry
The year’s deal-making was highlighted by two massive acquisitions: in October 2014, Becton Dickinson (BD) bought medication management specialist CareFusion for US$12.2 billion, and in May 2015, the conglomerate Danaher announced that it would buy the purification and filtration systems provider Pall Corporation for US$13.8 billion. (Washington, DC-based Danaher had a busy year — its other major move was the acquisition of dental implant specialist Nobel Biocare in December 2014 for US$2.2 billion.)
Debt drives medtech financingThose deals, as well as previously announced megadeals from the prior year (Medtronic/Covidien, US$42.9 billion; Zimmer/Biomet, US$13.4 billion) led to a record year for debt offerings. Medtronic raised US$17 billion alone, while BD, Zimmer and Boston Scientific together added nearly US$18 billion more. In total, 20 medtechs raised at least US$100 million in debt between July 2014 and June 2015, helping medtech to raise nearly US$41 billion in cumulative debt deals.
In 2014–15, debt made up the overwhelming majority of medtech’s total fundraising, which approached nearly US$50 billion, more than double the 10-year average.
Public equity markets also surged, with investors welcoming 43 newly public medtech companies to public markets in the US and Europe during the period. Those start-ups raised a cumulative US$2.3 billion, up 57% year-on-year. Both the number of IPOs and the total capital raised are likely unsustainable. Interestingly, the follow-on markets appeared steady, if unremarkable,
and the US$2 billion raised through June 2015 approximates the previous 10-year average.
IPO windows close as quickly as they open, and this one — pushed further ajar and propped open by the zephyr of biotech offerings over the past few years — will be no exception. What’s more, the characteristics of these newly public medtech companies suggest investors aren’t as adventurous as they may look at first glance. In the US, four out of every five medtechs to go public during the period were revenue-generating. (Those data are similar to the last medtech IPO window, when two-thirds of the companies to go public had revenues.) For medtechs, at least, products and real revenue appear to attract investors more than biotech-like promise.
Consequently, these record hauls don’t tell the full fundraising story. The medtech industry’s success was far from uniform, and a deeper dive describes a troubling dichotomy, particularly when it comes to the venture capital environment. Across all industries, the venture markets are thriving, and according to Dow Jones VentureSource, venture capital investors (VCs) invested US$57 billion in US companies in 2014, more than US$20 billion more than in any other year since the 2008 financial crisis. But with the exception of biotech, health care in general, and medtech specifically, have failed to ignite venture interest. In 2014, medtech companies attracted only 5.9% of all venture dollars, the latest figure in a steady decline in medtech’s venture share since 2009. And venture investments in earlier-stage companies, those raising seed, Series A or Series B rounds, are making up a smaller share of that smaller pie. Unlike in biotech, corporate venture investors have so far failed to make up for the shortfall
Year in review
IPO windows close as quickly as they open, and this one — pushed further ajar and propped open by the zephyr of biotech offerings over the past few years — will be no exception.

7Medical technology report 2015
among traditional VCs. Although investors such as Johnson & Johnson, Abbott and Medtronic (and corporates known more for their biotech investments like Novartis or Pfizer) remain active, their total absolute investment isn’t increasing.
The difficult medtech venture situation, which paradoxically can create better opportunities for the fewer traditional VCs that decide to stick around, raises the question of whether the dearth of early-stage capital will create a subsequent innovation vacuum. The industry faces a challenge in sourcing sufficient innovation capital to drive future growth.
R&D investment on the riseDuring 2014, the medtech industry once again ramped up R&D spending. That cumulative spend rose 6%, to US$14.3 billion, the fifth consecutive yearly increase. Some of this increase was driven by research tools companies such as Illumina, where R&D spend rose 40% year-on-year. But even within the therapeutic device subsector, R&D budgets are on the rise, perhaps reflecting changing priorities and a realization that investing in innovation, and demonstrating the value of that innovation, are essential for medtech’s future growth prospects.
An uptick in companies choosing the U.S. Food and Drug Administration’s more difficult PMA pathway suggests therapeutic device players are shifting toward backing their products with better evidence of value.
What’s more, the gap between what industry spends on R&D and what it returns to shareholders via dividends and share buybacks was smaller than in any year since 2011. Even a subtle rebalancing of industry capital allocation may be seen as a positive sign.
* Through 31 August 2015Source: FDA. Includes only original applications.
Number of US FDA Premarket Approvals by year
0
5
10
15
20
25
30
35
40
45
50
2004 2005 2006 2007 2008 2009 2010 2011 2012 2013 2014 2015*
But as is the case with medtech’s other inkblot metrics, it may also signal something completely different. In 2014, medtech companies spent US$37.3 billion in cash considerations for acquisitions. Dialing down share repurchases could also be a harbinger of further large-scale industry consolidation.
The ramifications of the financial, financing and dealmaking metrics of 2014–15 remain a matter of perception. What is clear: there are significant opportunities to transform health care via medtech. Delivering on that promise, however, requires a continued commitment to innovation across the medtech value chain. Carpe diem.
The gap between what industry spends on R&D and what it returns to shareholders via dividends and share buybacks was smaller in 2014 than in any year since 2011.
Year in review

Vincent ForlenzaPresident and CEO, Becton Dickinson Chairman of the Board of Directors, AdvaMed
Guest article
Promoting an innovation agenda
Year in review
The health care gains we have experienced over the last several decades as a result of advances in medical technology are truly remarkable. Between 1980 and 2010, new devices helped decrease the duration of hospital stays by more than half, added five years to US life expectancy and significantly reduced fatalities from heart disease and stroke. The industry has also fueled economic growth, generating high-wage manufacturing jobs and a favorable balance of trade in the US.
But the innovation ecosystem that supports medical technology is severely stressed, eroding the US’ historic leadership role in this important industry.
Venture capital investment has plummeted, especially for start-up firms that are the industry’s lifeblood, and the regulatory process remains too time-consuming, inefficient and inconsistent. The payment environment, meanwhile, is more restrictive than ever before, limiting patient access to potentially life-saving treatments while discouraging investment in new innovation. The US tax system, especially the new medical device excise tax, further discourages R&D and manufacturing investment, exacerbating a tenuous situation.
Responding to these many challenges requires more than a simple fix. It requires a comprehensive plan to address each aspect of our beleaguered ecosystem with specific policy solutions. Thus, AdvaMed responded earlier this year with its “Innovation Agenda.”
Consisting of five broad policy areas, the Innovation Agenda aims to unleash the potential of medical technology to extend and improve lives, reduce the cost and burden of disease, and maintain and enhance US scientific and economic leadership.
The first pillar calls for improving the FDA’s regulatory processes to reduce the cost and time it takes to get new medical technology approved, while maintaining the highest standards of safety and efficacy. The predictability and efficiency of the regulatory review process has improved significantly since the passage of the FDA user fee agreement in 2012. To continue this momentum, we need greater use of valid scientific evidence in the review process, including a broader range of data sources, such as registries, experience in foreign markets and peer-reviewed journal articles. This is in line with the FDA device center’s own mission statement that American patients will be the first in the world to have access to new devices.
Second, reforms are needed in the coverage and payment processes of the Centers for Medicare and Medicaid Services (CMS), including automatic Medicare coverage of FDA-approved clinical trials for investigational devices. This would replace the current process that requires a separate, duplicative and potentially time-consuming approval by CMS, and aligns medical technology trials to the same process used in drug trials. Additional process reforms would increase the transparency of local coverage decisions and ensure stakeholders have adequate opportunities to provide feedback to Medicare administrative contractors.
Bridging the FDA and CMS processes, we also need to create a streamlined, seamless pathway between the two agencies to speed the development of,― and patient availability to, ― significant breakthrough products for debilitating or life-threatening diseases or conditions that have no viable treatment alternative.
Third, we need to reform the US tax system, one of the least competitive in the world. In addition to repealing the device tax, we need to lower the overall corporate tax rate and provide incentives to invest in start-ups. “Innovation boxes,” for example, would lower the tax rate on income earned from intellectual property generated through domestic R&D and manufacturing.
Fourth, we often see a lack of regulatory harmonization in emerging markets that raises costs and delays patient access to needed technologies. To counter these trends, we need to complete free trade agreements such as the Trans-Pacific Partnership and Transatlantic Trade and Investment Partnership. We believe these agreements will improve patient access to medical technology and reduce tariff and non-tariff barriers while helping to maintain the US medtech industry’s favorable balance of trade with other nations.
Finally, to reverse the decade-long decline in US investment in medical research, we need to prioritize steady growth in funding for the National Institutes of Health and the National Science Foundation.
Restoring the innovation ecosystem will be no easy task. It will require bold policy changes that will affect complex regulatory, reimbursement, tax and international issues. Implementing the provisions in AdvaMed’s Innovation Agenda is important for the medtech industry, but it is critical for millions of patients and families whose lives depend on the development of new and better diagnostics, treatments and cures.
8 EY | Pulse of the industry

Guest article
Three years ago, when we were raising our last fund, investors did not differentiate between medtech and biotech. That has changed. Biotech is hot, and medtech is clearly not performing as well. Preclinical biotechs can command valuations in the hundreds of millions of dollars; medtechs with products on the market, on the other hand, have a hard time raising US$20 million. It’s as if you’re traveling at 20 miles per hour, and someone passes you at 120 miles per hour.
As a result, some investors are starting to look at medtech in a negative light. I believe the difference in perception is largely cyclical. I am absolutely convinced that we can make incredible returns in medtech. It’s not a question of “why isn’t medtech as hot as biotech?” It’s, “can you make a lot of money in medtech?” That’s all that matters.
In fact, this may be one of the best times to invest in medtech, particularly early- stage companies. There aren’t many US VCs interested in doing early-stage deals, But that is just one part of the acceleration factor. There just aren’t many VCs in medtech today.
You also have to make sure you understand how much money the company is going to need to get from one milestone to the next. Keep in mind that few medtech multinationals have investment arms dedicated to making investments in smaller medtechs. Of those that do, the scale of their investments is an order of magnitude different compared to that of pharma companies.
That, coupled with the fact that many traditional VCs have left, means you have to be more creative when putting together syndicates. For example, as the Series A investors in Mainstay, a Minneapolis-based company, we looked left and right to find US investors for the company’s Series B. This was tough. The company ultimately relocated to Ireland, very successfully completed an oversubscribed round, and then listed on both the Euronext Paris and the Dublin ESM. As you think about your next rounds of financing, you need to adapt to the times and where the capital is flowing.
If you do that, I think it’s reasonable to believe that you will find other investors to syndicate with. This business is all about buying low and selling high. If you invest for peanuts, then the returns, mathematically, are almost infinite.
This perspective has been excerpted and adapted from an interview originally published in the 31 August 2015 issue of The Medtech Strategist. To receive a complimentary copy of the full interview, please send an article request to [email protected].
Most of those who haven’t switched to investing in later-stage deals are no longer with us. However, because Sofinnova is consistently investing in medtech while so many others have left the industry, we now have the chance to invest in companies we would not have seen before. Our two most recent medtech investments, Shockwave and Reflexion Medical, are companies based in the Bay Area. Five years ago, the VCs who seeded those companies would have just continued to invest in them and the companies would likely not have knocked on my door.
Now, our deal flow has really increased. So has the quality of our medtech deals; in fact, the quality of all medtech deals is higher. Our fund remains focused on Europe, where we invest about two-thirds of our money. But right now the quality deals are in the US, where there are fantastic management teams and experienced executives who just can’t find any money.
While there may be investment opportunities in services, diagnostics or digital health, we plan to stick to therapeutic devices. That’s what we know. Cardiovascular remains a major area for us. There are still huge unmet needs in this area: heart failure, hypertension, structural heart, and even in the valve space. Orthopedics is difficult, but a related area, neurostimulation to treat spine pain, is very promising.
But to be successful, I think you have to be even more rigorous in your analysis of the company and the investment than before because the risk profile is greater. The universe of potential medtech buyers may be two or three in contrast to pharma, where there are potentially dozens. You have to make sure that you’ve talked to potential strategic buyers before you invest.
Antoine PapiernikManaging Partner, Sofinnova Partners
Making money in medtech
9Medical technology report 2015
Year in review

10 EY | Pulse of the industry
Josh Makower, MDGeneral Partner, NEA
Guest article
Year in review
Even at a time of extraordinary medical and scientific progress, the outlook for bringing new medical technologies to market is hardly rosy. The sector has sustained a series of substantial blows since the global financial crisis, including a more restrictive U.S. Food and Drug Administration, changing business practices in Europe and persistent reimbursement uncertainty. These barriers translate to significant delays in revenue growth, often compelling companies to seek additional capital from investors at a time when financial resources for medtechs are ever-dwindling.
While the biotech sector has recently seen a steady flow of capital and strong liquidity, the medtech sector hasn’t enjoyed a similar boost. Substantial consolidation within the industry means fewer acquirers, and those buyers are primarily focused on later-stage companies.
Public markets, meantime, require strong revenue growth as a threshold for reasonable valuations, rendering those markets relatively inaccessible for the majority of early-stage medtechs.
Without a robust flow of capital back into the hands of private investors via IPO or M&A activity, medtech can be a tough
sell to venture capitalists’ current or prospective limited partners, resulting in fewer dollars flowing to the sector. Indeed, first-round funds for traditional medtech companies have decreased substantially in recent years, and a number of VCs have departed the space altogether. I expect there will be additional departures before the industry stabilizes.
Light at the end of the tunnelThe challenges facing medtech are not insurmountable. Since the passage of the Food and Drug Administration Safety and Innovation Act of 2012, the regulatory process has become more transparent and predictable.
There is also growing recognition that when the underlying disease etiology is mechanical or electrical in nature, medtech solutions are one of the best ways to treat such conditions. Heart disease, osteoarthritis, hearing, urologic and vision problems (to name just a few) involve a focused set of tissues that can be optimally treated locally and are areas of opportunity for innovative medical devices.
While challenges persist, such as the reimbursement landscape, I do see light at the end of the tunnel. I am optimistic about the long-term prospects for the industry and believe that now is a very good time to make certain types of medtech investments.
The first is the area of traditional medtech. Contraction in the VC community means that companies are competing for fewer dollars, and the resulting decline in valuations makes it a great time to invest. NEA will continue its decades-long practice of investing in people and ideas that have
the potential to transform health and improve patient care, with dollars spread across early-stage bets as well as later-stage projects.
The other area where I see real promise is a newer investment focus for NEA, but it’s ideally suited to a firm that has always had deep expertise in both health care and technology. The emerging field of health tech marries traditional medtech (e.g., medical devices) with state-of-the-art consumer electronics technology, digital marketing, e-commerce and social media tools to create an entirely new class of products and solutions. Where traditional medtech catered exclusively to physicians and hospital systems, health tech is more likely to be consumer-facing, bringing new tools and technologies directly to patients. It’s also more focused on preventive care, enabling patients to better manage their health before their physical problems advance to a state that can only be treated via an intervention such as surgery.
The opportunity is fueled by advances in consumer electronics, the evolution of e-commerce channels, and, most importantly, the consumerization of health care. We can leverage our understanding of traditional medtech device development and apply it to create new digitally enabled products and services.
Because these products may require a lighter regulatory approval pathway, we believe there is an opportunity to commercialize products in this space for half, even one-third, of what it would cost to develop a traditional medtech device. Direct patient access to these products and services also eliminates many of the reimbursement challenges faced by traditional medtech devices. A faster path to revenue should translate to acceleration in value creation and liquidity timelines.
Sustaining early-stage medtech innovation
10 EY | Pulse of the industry

11Medical technology report 2015 11Medical technology report 2015
Bringing investors backI believe health tech is a huge opportunity for medtech innovators. Tech giants such as Apple, Google and Samsung are seriously eyeing the health care space, which translates to new opportunities for strategic partnerships, a broader universe of potential acquirers and, ultimately, a reinvigorated medtech sector. In time, these developments will bring investor enthusiasm — and dollars — back to medtech.
For traditional medtech, improved liquidity will be critical to attracting future investment and we are seeing some positive indicators. In recent weeks Allergan, Abbott, Medtronic and Edwards Lifesciences have all acquired exciting earlier-stage companies. As this activity continues, investors and their limited partners are bound to take notice.
Taken together, the improving landscape for traditional medtech and the fast-growing market for new health tech businesses strongly signal an upswing for the medtech sector overall. Investors who have stayed the course will have an opportunity to help shape what I believe will be the most exciting cycle for health and medical technology in many years.
I am optimistic about the long-term prospects for the industry and believe that now is a very good time to make certain types of medtech investments.
11Medical technology report 2015
Year in review

12 EY | Pulse of the industry
Looking for growth
It remains to be seen whether therapeutic device companies can sustain or accelerate their current business development activities or advance their pipelines to help re-invigorate top-line growth.
Financial performance

13Medical technology report 2015
Indeed, it’s likely that the spate of IPOs and high-value M&As sweeping across medtech — and the implicit promise of more to come — helped buoy medtech’s market capitalization more than the promise of organic growth, even as the overall life sciences market continued its steep upward trajectory. The juxtaposition of the medtech industry’s performance with that of the surging biotech sector is yet another reminder
that the reimbursement challenges facing all life sciences companies are felt most acutely by the device sector, where the specter of commoditization looms largest.
It remains to be seen whether medtech players in the industry’s core therapeutic devices cohort can sustain or accelerate their current business development activities or advance their pipelines to
help re-invigorate top-line growth, since both depend mightily on the fickle flow of capital, whether it is venture dollars or inexpensive debt. (See the accompanying article, “A record year, a looming crisis?”)
In 2014, the industry’s largest players grew slowly, delivering unimpressive top-line gains that resulted in an overall growth
In 2014, the medical technology industry outperformed the broader markets as it experienced a record-setting wave of mergers and acquisitions, as well as a surge in initial public offerings driven by renewed investor interest in the life sciences sector, a trend that began with biotech offerings in 2013. But these newsworthy events caused hardly a ripple — at least as measured by the sector’s broad financial performance metrics. Most of the major medtech industry indicators barely budged compared with 2013, reflecting a new normal of single-digit top-line growth that has characterized medtech for the past several years.
Medical technology at a glance, 2013–14 (US$b, data for pure-plays except where indicated)
Public company data 2014 2013 % change
Revenues $341.8 $333.8 2%
Conglomerates $151.7 $152.2 0%
Pure-play companies $190.2 $181.6 5%
R&D expense $14.3 $13.5 6%
SG&A expense $63.8 $60.6 5%
Net income $16.9 $16.3 4%
Cash and cash equivalents and short-term investments $60.2 $58.4 3%
Market capitalization $684.5 $567.6 21%
Number of employees 678,500 662,800 2%
Number of public companies 414 379 9%
Source: EY, Capital IQ and company financial statement data.Numbers may appear inconsistent due to rounding.Data shown for US and European public companies.Market capitalization data is shown for 31 Dec 2014 and 31 Dec 2013.

14 EY | Pulse of the industry
Financial performance
rate for the industry of only 2%. For the commercial leaders, this level of growth further illustrates the need for the inorganic growth that drove the past year’s Medtronic/Covidien and Zimmer/Biomet megamergers.
While the medtech IPO market was robust, growth in the sector’s overall market capitalization only slightly outpaced growth in the broader markets and lagged behind biotech, which continued its astounding run. In 2014, the medtech industry gained 21% in market capitalization. (From 1 January 2014, through the first half of 2015, market capitalizations increased 38%.) Despite the influx of newly public medtechs, this performance was actually less impressive than the 31% increase observed in 2013. (Based on EY’s analysis, newly public medtechs were responsible for about 2% of the year’s overall increase in market capitalization.)
That gain wasn’t evenly distributed. Therapeutic device companies, which make up 58% of the publicly traded medtechs, added 25% in market cap. The 36 research and other equipment companies in our universe topped the charts with a 27% gain over the period, outpacing the field. That isn’t too surprising, given that the fates of these suppliers are closely tied to their biopharma customers, enabling this medtech sub-sector to enjoy a similar market acceleration.
R&D investment rose again in 2014, up 6% on the year after a 7% increase in 2013, while SG&A spending grew at a steady 5%, the same as the year prior. For the second year in a row, the uptick in R&D spending was boosted by big players in the research tools sector. Newly public medtechs also had a material impact, accounting for about 40% of the year-over-year increase in R&D spend.
As a result of the brightening IPO climate, 40 medtechs went public in calendar year 2014. Outside R&D spending, these newly public companies affected other financial performance metrics, notably the number of public companies and bottom-line growth. The year 2014 ended with 35 more public companies than it began with, growing 9% compared to a 1% decline in 2013. Meanwhile, overall net income rose 4% to US$16.9 billion in 2014. Adjusting for the 2014 class of medtech IPOs, net income actually would have increased 7% year-over-year.
Our analysis suggests newly public companies contributed about 8% of the medtech industry’s year-over-year revenue growth. While this is a relatively modest result, the infusion of new medtechs and capital will be an important source of long-term innovation and future revenue for the sector overall — and for the top tier players willing to act as consolidators.
After a significant 24% boost in 2013, the industry’s cash and cash equivalents grew by only 3% in 2014 despite a blockbuster financing environment. In conjunction with a renewed focus on deal-making and a steady uptick in R&D spending, this more modest growth suggests companies are putting more emphasis on allocating capital to efforts to promote future growth.
That is good news. But more needs to be done. Vigorous large-scale mergers, the rising tide of broad markets and the once-a-decade spike in IPOs can only sustain medtech’s growth for so long. With payers less willing to reimburse incremental innovations or add costs to an already strained health care system, a focus on accelerating innovation and demonstrating value is of paramount importance.
To accelerate growth beyond the single-digit revenue gains achieved in 2013 and 2014, medtechs will need to invest

15Medical technology report 2015
To accelerate growth beyond the single-digit revenue gains achieved in 2013 and 2014, medtechs will need to invest even more in innovation and do so across the industry’s value chain.
Financial performance
even more in innovation and do so across the industry’s value chain, particularly in early-stage medtechs that might become fodder for future M&A and boost the returns of the VCs that back them. But that early-stage medtech investor base is shrinking, creating a funding vacuum that may result in fewer start-ups. The scenario raises the serious question of whether the industry can replenish its innovation engine and return to an era of higher growth rates.
Treading waterAs previously noted, top-line growth for US and European companies was difficult to come by in 2014, as the sector on the whole inched up only 2% to US$341.8 billion. That growth was below last year’s 4% uptick.
Pure-play companies once again outperformed conglomerates — revenue for the latter group actually shrank marginally, from US$152.2 billion in 2013 to US$151.7 billion in 2014. This tally was affected by divestitures at some of medtech’s largest players, including Johnson & Johnson (off nearly US$1 billion, or 3%) and Siemens (down more than US$1.5 billion, or 9%).
Among pure-play medtechs, non-imaging diagnostics players enjoyed the best revenue growth in the major categories in 2014, up 6% as a group. Hearing-loss specialist Amplifon (8%), in vitro diagnostics stalwart BioMerieux (7%) and patient-monitoring technology provider Masimo Corp. (7%) helped drive overall
growth in diagnostics. Despite strong growth from Illumina in the research instrumentation and equipment segment — the genomic analysis equipment maker saw its revenue jump 31% — revenues for that sub-sector increased only 3%.
Halyard Health, which spun out from Kimberly-Clark in 2014, drove the 13% year-on-year growth in the “Other” category. Note, Halyard’s US$1.6 billion revenue would have been captured in the conglomerate totals in prior years. Without Halyard, the revenue growth in “Other” would have been on par with the 1% notched by the imaging subsector. Halyard,
which officially launched 1 November 2014, markets a variety of medical products, including infection prevention supplies and devices for respiratory diseases, digestive health and pain management. The divestiture, meantime, enables parent company Kimberly-Clark to focus on the consumer segment.
This shift to more focused business models, which has gained traction over the past few years, has been a recurring opportunity for value creation among the industries’ diversified players.
-4%
-2%
0%
2%
4%
6%
8%
10%
12%
14%
Imaging Non-imaging diagnostics
Research and other equipment
Therapeutic devices (total)
Other
US and European non-conglomerate revenue growth by product group
Source: EY, Capital IQ and company financial statement data. Data shown for pure-play companies only.
Percentage change in revenue Percentage change in number of companies

Financial performance
16 EY | Pulse of the industry
Among therapeutic device companies, only companies in three therapeutic areas enjoyed double-digit revenue growth. Ophthalmology saw 11% growth, driven mostly by Essilor International’s 12% rise on the back of a series of 12 acquisitions during the year. Those deals added roughly US$600 million to the French company’s top line in 2014.
Growth in neurology (20%) and gastrointestinal (25%), meanwhile, came off much smaller bases. For example, in neurology, neuromodulation specialist Cyberonics led the way on an absolute basis, adding nearly US$28 million (11%) ahead of its February 2015 merger with cardiovascular-focused Sorin Group.
-1.5
-1.0
-0.5
0.0
0.5
1.0
1.5
Dental
Hematology/ renal
Multiple
Ophthalmic
Orthopedic
Change in US and European therapeutic device companies’ revenue and net income by selected disease categories, 2014 vs. 2013
Source: EY, Capital IQ and company financial statement data.Data shown for pure-play companies only.
Revenue Net income
Cardiovascular/vascular
US$
b
These pockets of therapeutic device growth remain hidden in niche markets that are unlikely to move the needle at the industry’s leading companies.
Among larger subsectors of the therapeutic device market, cardiovascular/vascular revenues grew by only 5% year-over-year (at US$932 million, about the same growth as the previous year). That growth, however, was aided significantly by Edwards Lifesciences, which posted 14% revenue growth due to strong sales from its transcatheter heart valves. Edwards also achieved one of the biggest year-over-year gains in net income, increasing its bottom line 108% as a result of a US$750 million
Pockets of therapeutic device growth remain hidden in niche markets that are unlikely to move the needle at the industry’s leading companies.

Financial performance
17Medical technology report 2015
litigation settlement with Medtronic. (In exchange for the up-front fee to Edwards, Medtronic retains the ability to continue marketing its CoreValve system.)
Orthopedic specialists grew the top line by more than US$1 billion in aggregate, also good for a 5% boost over 2013. Stryker saw the largest bump in absolute terms, adding US$654 million (7%) thanks to sales growth across its Orthopaedic, MedSurg and Neurotechnology and Spine segments. Smith & Nephew’s revenue grew by 6%, or US$266 million, thanks to added sales from acquisitions and strong growth in emerging markets. Support and prosthetics maker Ö――ssur grew by more than US$73 million, or 17%, to US$508 million. The Icelandic company’s top line was bolstered by 38 product launches during the year, including the third generation of its Rheo bionic knee.
Net income for orthopedics companies overall fell by 28%, however, due almost entirely to Stryker. The company’s net income fell 49%, largely as a result of charges incurred by a series of recalls and acquisitions as well as a tax payment on a planned cash repatriation.
Only the dental subsector saw revenue fall, thanks entirely to the US$2.2 billion acquisition of Switzerland’s Nobel Biocare by Danaher in December 2014. Reintroducing that revenue (which is only removed here because Danaher is a conglomerate) would reverse the sector’s 9% revenue drop, resulting in a modest 3.5% gain.
Commercial leadersThe number of pure-play medtech commercial leaders, those companies with more than US$500 million in annual revenue, held fast at 58, as three new members (Merit Medical Systems, Ö――ssur and Halyard Health) replaced two acquired companies (Life Technologies and Nobel Biocare) and one exited the group due to flagging sales (Thoratec).
After only one year in the group, Thoratec’s revenue fell to US$488 million, as sales of its HeartMate II left ventricular assist device suffered at the hands of competition and a slowing market. Merit surely hopes for a longer tenure. The Utah-based maker of disposable medical
devices for interventional and diagnostic procedures saw revenue jump 13% to US$506 million in 2014.
The list of commercial leaders will shift again in 2015 as a result of transactions that closed over the year. Covidien and CareFusion will retire due to their respective acquisitions by Medtronic and Becton Dickinson.
Most of medtech’s commercial leaders (40) are US-based. They comprise 90% of US medtech revenue and 86% of total market cap, despite representing only 16% of all US public companies. Europe’s 18 commercial leaders likewise dominated the continent’s revenue (89%) and market capitalization (90%), delivering 10% net income gains.
2010 2011 2012 2013 2014
Source: EY, Capital IQ and company financial statement data.
US and European commercial leaders, 2010–14
>US$10b US$5b–US$10b US$2.5b–US$5b US$1b–US$2.5b US$0.5b–US$1b
16 15 14 14 15
26 26 26 27 26
11
8 8 9 9
23 2 3 3
0
10
20
30
40
50
604
5 65 5

18 EY | Pulse of the industry
Financial performance
18 EY | Pulse of the industry
Interestingly, in the US, it was the commercial leaders’ smaller counterparts that outperformed the more established companies, outpacing in revenue growth (6% to 5%); growth in R&D spend (27% to 3%); net income growth (16% to 5%); and boost in market capitalization (24% to 19%).
Extending the runwayIn 2014, fewer medtech companies in the US and Europe were cash-starved than in previous years, with 45% of US companies and 41% of their European counterparts holding less than a year’s cash on the balance sheet, down from 50% and 42%,
In 2014, fewer medtech companies in the US and Europe were cash-starved than in previous years.
50% 50%45%
23%16% 23%
10%
8%12%
9%12%
11%
8% 14% 9%
0%
10%
20%
30%
40%
50%
60%
70%
80%
90%
100%
2012 2013 2014
Source: EY, Capital IQ and company financial statement data.Chart excludes companies that are cash flow positive.
US public medtech cash index, 2012–14More than 5 years 3–5 years 2–3 years 1–2 years Less than 1 year

19Medical technology report 2015
Financial performance
19Medical technology report 2015
respectively. Part of this improvement is again likely due to the influx of newly public medtechs and the significant sums they were able to raise in their debuts. Among non-commercial leaders, financings greater than US$50 million accounted for more than half of all capital raised between July 2014 and June 2015, suggesting that those companies that were able to finance in 2014 did so with gusto.
In the US, cash reserves have remained relatively constant over the past few years, with 32% of medtech companies holding greater than two years’ worth of cash on their balance sheets in both 2013 and 2014. In contrast with the previous year, when 14% of US firms held more than five years’ cash, only 9% hit this mark in 2014. This shift may reflect renewed optimism about the financial climate as well as more aggressive capital allocation strategies and M&A agendas.
The opposite held true in Europe, where a surge in companies with greater than five years’ worth of cash reserves more than doubled the proportion from a year earlier. One in every five European medtech companies holds at least five years of cash, and two in five have at least two years’ worth.
43% 42% 41%
21% 24%20%
11%14%
9%
10%11%
11%
14% 8% 20%
European public medtech cash index, 2012–14More than 5 years 3–5 years 2–3 years 1–2 years Less than 1 year
0%
10%
20%
30%
40%
50%
60%
70%
80%
90%
100%
2012 2013 2014
Source: EY, Capital IQ and company financial statement data.Chart excludes companies that are cash flow positive. Numbers may appear inconsistent due to rounding.

20 EY | Pulse of the industry
Financial performance
20 EY | Pulse of the industry
Capital allocation: balancing actWhat companies do with that cash remains essentially unchanged from the prior year, as the medtech sector attempts to balance the need for long-term growth with shorter-term investor expectations. True, R&D spend has edged up slightly each year since 2009 and more significantly over the past two years, from about US$11 billion in 2009 to just over US$14 billion in 2014. However, in every year since 2010, medtech companies returned more cash to shareholders via dividends and buybacks than they reinvested in R&D. In a potentially important signpost for the future, in 2014, that gulf shrunk to its smallest level in five years.
Medtech companies returned US$15.6 billion to shareholders in 2014, a decline of US$2.8 billion (–15%), and spent an aggregate US$14.3 billion on R&D. Thirteen companies paid out at least US$100 million in dividends, led by Medtronic (US$1.3 billion) and Covidien (US$578 million), sending total dividend payments for 2014 up 10% versus the prior year.
Meanwhile, share buybacks fell nearly a quarter to US$10.2 billion, their lowest total since 2010, suggesting at least a modest rebalancing of industry’s priorities. Medtronic (US$2.2 billion worth of stock repurchased) and Intuitive Surgical (US$1 billion repurchased) led the way as 22 companies bought back more than US$100 million in shares. It speaks to industry’s growth challenges that
Meanwhile, share buybacks fell nearly a quarter to US$10.2 billion, their lowest total since 2010, suggesting at least a modest rebalancing of industry’s priorities.
Source: EY, Capital IQ and Thomson ONE.Data shown for US and European public pure-play companies for which data were publicly disclosed. Cash returned to shareholders includes total dividends paid and stock repurchased.
Ann
ual s
pend
(US$
b)
0
5
10
15
20
25
30
35
40
2009 2010 2011 2012 2013 2014
Penny wise? How medtechs have spent their cash, 2009–14Cash acquisitions R&D expensesCash returned to shareholders

21Medical technology report 2015
Financial performance
21Medical technology report 2015
Medtronic returned nearly US$4 billion to shareholders in 2014 while its market capitalization barely outperformed the broader medtech market (25% to 21%).
R&D spend rose 6% from 2013 to 2014, but the increased investment wasn’t spread evenly over our heterogeneous medtech cohort (Medtronic, for example, saw a 5% decline, and Bruker a 9% fall).
The R&D boost was fueled in large part by research tools companies. Sequencing stalwart Illumina continued to improve the throughput and economic value of its HiSeq sequencing configurations, as well as its NextSeq and MiSeq platforms, and R&D spend rose 40%. Even where revenue has shrunk because of aggressive pricing — for instance, in the company’s array business — Illumina plans to increase R&D investment.
At Thermo Fisher, a 75% jump in R&D spend was due almost completely to its US$13.6 billion acquisition of Life Technologies in 2013, which closed in February 2014. Thermo Fisher had been investing about US$700 million in R&D annually (or about 4% of revenue). During 2014, the company launched new products in its research, applied markets and clinical businesses.
Within the therapeutic device space, R&D budgets may be increasing as companies strive to present stronger evidence to payers in an attempt to secure better reimbursement for their products. More companies in 2014 opted to push through the FDA’s more onerous Class III premarket approval (PMA) pathway, with 25 PMAs granted on the year, up from 21 in 2013. As of early September 2015, the FDA had already approved 29 PMAs, and industry was on pace to match or better its decade-long high of 39.
0%
20%
40%
60%
80%
100%
Source: EY and Capital IQ.Chart includes companies that were active on 30 June 2015.
US market capitalization relative to leading indices, 2013–15Russell 3000EY US medtech industry Dow Jones Industrial Average
NASDAQ Composite
2013 2014 2015
0%
25%
50%
75%
100%
125%
Source: EY and Capital IQ.Chart includes companies that were active on 30 June 2015.
US market capitalization by company size, 2013–15Large cap (> US$5b)Micro cap (< US$250m)Small cap (US$250m–US$1b)
EY US medtech industry Mid cap (US$1b–US$5b)
2013 2014 2015

Financial performance
22 EY | Pulse of the industry
0%
25%
50%
75%
100%
125%
Source: EY and Capital IQ.Chart includes companies that were active on 30 June 2015.
Small cap (US$250m–US$1b) Micro cap (< US$250m)
European market capitalization by company size, 2013–15
Large cap (> US$5b)EY European medtech industry Mid cap (US$1b–US$5b)
2013 2014 2015
0%
10%
20%
30%
40%
50%
60%
70%
Source: EY and Capital IQ.Chart includes companies that were active on 30 June 2015.
European market capitalization relative to leading indices, 2013–15
CAC-40 FTSE 100EY European medtech industry DAX
2013 2014 2015

Financial performance
23Medical technology report 2015 23Medical technology report 2015

24 EY | Pulse of the industry
US medtechs’ aggregate top line rose only 3% in 2014, compared with 4% in the previous period. Pure-plays enjoyed a 5% revenue increase, while year-over-year revenue growth at conglomerates stalled at 0%.
Still, a few companies enjoyed significant positive momentum. Illumina rode the biotech wave and greater demand for genomic sequencing to a 31% boost in revenue on the year, surging more than US$400 million to US$1.4 billion in 2014.
reaching US$762 million on the year as it continued to grab market share and build on its position as the largest pure-play spine-focused medtech.
The lack of growth among conglomerates is partially explained by two departures
US medtechs stuck in neutral
US medtech at a glance, 2013–14 (US$b, data for pure-plays except where indicated)
Public company data 2014 2013 % change
Revenues $222.5 $216.2 3%
Conglomerates $83.8 $83.8 0%
Pure-play companies $138.7 $132.4 5%
R&D expense $11.4 $10.7 7%
SG&A expense $46.1 $42.6 8%
Net income $11.6 $11.3 2%
Cash and cash equivalents and short-term investments $52.2 $49.9 5%
Market capitalization $505.6 $423.1 20%
Number of employees 454,900 448,500 1%
Number of public companies 244 227 7%
Source: EY, Capital IQ and company financial statement data.Numbers may appear inconsistent due to rounding.Market capitalization data is shown for 31 Dec 2014 and 31 Dec 2013.
Dental products maker Align Technology jumped 17% (US$108 million) to more than US$761 million, reflecting strong demand for its Invisalign orthodontic treatment. And spine specialist NuVasive added 11% (US$77 million) in revenue,
24 EY | Pulse of the industry
US | Financial performance

25Medical technology report 2015
Despite anemic revenue gains and a spotty net income picture, US medtechs managed to secure a 20% increase in market capitalization.
Financial performanceUS
from the US conglomerate cohort. Endo International reincorporated in Ireland as a consequence of its acquisition of the Canadian pharmaceutical company Paladin Laboratories for US$1.6 billion in February 2014. And Halyard Health — the former medtech business of Kimberly-Clark — emerged as a US$1.6 billion pure-play medtech company. Normalizing for these two deals would have pushed conglomerates’ still meager growth to 2.3% over 2013.
Ten of the remaining 12 US-based conglomerates increased their top lines during the year. Allergan’s 30% revenue gain stands out, driven mainly by the success enjoyed by its portfolio of aesthetic medical device products. Only Johnson & Johnson, where revenue declined by nearly US$1 billion (-3%), and Hospira (off US$79 million, or 10%) suffered shrinking sales. J&J remains the world’s largest medtech by revenue, and the bellwether’s decline might have had an outsized impact on the sector. But the company’s fall was due largely to the disposal of Ortho-Clinical Diagnostics, which contributed nearly US$2 billion to the company’s 2013 revenues. As a result of the divestiture, J&J’s diagnostics revenues dropped 49% compared to the prior year.
Alongside Thermo Fisher, Baxter International also performed well, adding US$1.3 billion (15%) to its top line during 2014. Baxter’s renal business was its star performer, jumping 35% thanks to added heft from its acquisition of Gambro in 2013. The company generated additional value through the spin-off of Baxalta, its pharmaceutical business, in a floatation
US commercial leaders and other companies, 2013–14 (US$b)
2014 2013 % change
Commercial leaders
Revenues $124.7 $119.2 5%
R&D expense $9.0 $8.8 3%
Net income $14.0 $13.4 5%
Market capitalization $433.6 $365.2 19%
Number of employees 402,300 395,800 2%
Number of commercial leaders 40 40 0%
Other companies
Revenues $14.1 $13.2 6%
R&D expense $2.4 $1.9 27%
Net income (loss) $(2.4) $(2.0) 16%
Market capitalization $72.0 $57.9 24%
Number of employees 52,600 52,700 0%
Number of other companies 204 187 9%
Source: EY, Capital IQ and company financial statement data.Commercial leaders are pure-play companies with revenues in excess of US$500 million.Numbers may appear inconsistent due to rounding.Market capitalization data is shown for 31 Dec 2014 and 31 Dec 2013.
25Medical technology report 2015

26 EY | Pulse of the industry
that concluded in July 2015 and further demonstrates the value that might be unlocked as diversified businesses seek focus-by-divestiture.
Despite anemic revenue gains and a spotty net income picture, US medtechs managed to secure a 20% increase in market capitalization. That’s a far cry from 2013’s 37% gain, but the cohort continued to far outpace the broader markets. Since the start of 2013, US medtechs have nearly doubled their aggregate value (up 96%); in contrast, the NASDAQ and the Russell 3000 indices are up 65% and
46%, respectively, over the same period. US medtechs’ R&D spend outpaced the global rate, rising 7% on the year to US$11.4 billion.
Danaher, with a 24% five-year compound annual growth rate (CAGR), became the fastest-growing US medtech over the 2010-14 period, replacing NuVasive (16%, good for ninth-fastest). Only one newcomer cracked the top 10 in 2014, as the conglomerate IDEX — Health & Science Technologies posted 18% CAGR to take sixth place.
US | Financial performance
Selected fast-growing US medtechs by revenue growth, 2009–14 (US$m)
Companies 2009 2014 CAGR
Danaher — Life Sciences & Diagnostics and Dental $3,142.0 $9,378.8 24%
Illumina $666.3 $1,861.4 23%
Cepheid $170.6 $470.1 22%
Align Technology $312.3 $761.4 20%
Corning: Life Sciences $366.0 $862.0 19%
IDEX: Health & Science Technologies $323.9 $752.0 18%
Volcano $171.5 $392.8 18%
Natus Medical $166.4 $355.8 16%
NuVasive $370.3 $762.4 16%
Intuitive Surgical $1,052.2 $2,116.0 15%
Source: EY, Capital IQ and financial statement data.Companies in italics have made significant acquisitions between 2009 and 2014.CAGR = compound annual growth rate
26 EY | Pulse of the industry

27Medical technology report 2015
Source: EY, Capital IQ and company financial statement data.Data shown for pure-play companies only.
Selected US medtech public company financial highlights by region, 2014 (US$m, % change over 2013)
Region RevenueNumber of companies
Market capitalization 31 Dec 2014 R&D Net income
Cash and cash equivalents Total assets
Massachusetts $36,433 34 $99,612 $2,831 $1,718 $5,069 $85,633
14% 10% 18% 20% 1,868% -44% 15%
Minnesota $23,276 14 $95,064 $2,278 $4,104 $16,266 $49,530
2% 0% 17% -3% -3% 25% 7%
New Jersey $13,310 15 $44,118 $960 $1,426 $4,032 $20,027
7% 7% 23% 12% -26% 1% 5%
Southern California $13,097 36 $76,919 $1,579 $1,495 $8,183 $24,813
-15% 9% 21% -6% 23% 19% -17%
Northern California $13,052 34 $59,607 $1,430 $863 $5,301 $21,102
4% 13% 20% 13% -30% 4% 12%
Michigan $9,983 3 $37,590 $622 $547 $5,077 $18,139
8% 0% 25% 14% -47% 25% 13%
Pennsylvania $6,929 9 $19,606 $266 $657 $1,141 $11,406
4% 0% 15% 4% 16% 2% -4%
Indiana $6,359 2 $21,832 $276 $781 $1,795 $11,387
-6% -33% 17% -7% -6% -8% -3%
Ohio$3,185 5 $5,917 $120 $56 $300 $3,198
3% 0% 11% 5% -68% 9% 0%
New York State$3,117 20 $8,422 $213 $184 $637 $4,939
-6% 0% 16% -2% 165% 46% -1%
Maryland$1,998 3 $9,477 $125 $387 $2,110 $4,001
4% 0% 10% 10% -8% 14% 9%
Texas$1,247 10 $4,652 $136 $88 $395 $1,452
-18% 0% -15% -17% 142% -33% -25%
Financial performanceUS
27Medical technology report 2015

28 EY | Pulse of the industry
The European medtech landscape mirrored that of the US, albeit on a smaller scale. Pure plays outperformed the broad medtech market, posting a 5% revenue increase compared with a 1% slide for Europe’s conglomerates.
Acquisitions key to European medtech growth
EU | Financial performance
European medtech at a glance, 2013–14 (US$b, data for pure-plays except where indicated)
Public company data 2014 2013 % change
Revenues $119.3 $117.6 1%
Conglomerates $67.8 $68.4 -1%
Pure-play companies $51.5 $49.2 5%
R&D expense $2.9 $2.8 3%
SG&A expense $17.7 $18.0 -2%
Net income $5.3 $5.0 6%
Cash and cash equivalents and short-term investments $8.0 $8.5 -6%
Market capitalization $178.8 $144.4 24%
Number of employees 223,600 214,300 4%
Number of public companies 170 152 12%
Source: EY, Capital IQ and company financial statement data.Numbers may appear inconsistent due to rounding.Market capitalization data is shown for 31 Dec 2014 and 31 Dec 2013.
28 EY | Pulse of the industry

29Medical technology report 2015
Of the 10 fastest-growing European medtechs as measured by five-year CAGR, half grew by acquisition in 2014, continuing a trend from 2013.
That decline might have been worse without Endo’s Irish inversion deal and the stout performance of Roche, which gained 4% thanks to increased revenue in its Professional Diagnostics and Molecular Diagnostics businesses.
Conglomerates’ poor performance was hastened by headwinds and unit divestitures at Siemens, Europe’s largest medtech company (Siemens will be unseated by the new combination of Medtronic and Covidien in next year’s rankings). Siemens’ revenue fell 9% in 2014, as it sold its hearing aid business, Audiology Solutions, for US$2.9 billion in November 2014 to a consortium of private investors. The company also parted ways with its hospital information systems business, which was sold for US$1.3 billion to US-based Cerner in August 2014. Philips Healthcare, currently Europe’s second-largest medtech, also had a difficult year: revenue fell 4% to US$12.2 billion as the company faced a significant decrease in equipment orders from North America.
In Europe, R&D investment grew at only 3%, after a 9% spike the prior year, and net income grew at 6% versus a 10% decline in 2013. Leading the way on bottom-line gains were French ophthalmology giant Essilor and Swiss hearing care company Sonova Holdings. Essilor’s net income gain of US$446 million (57%) was boosted by acquisitions and accounting charges, primarily a large gain recognized as part of the consolidation of Transitions Optical, which it bought for US$1.85 billion. Sonova’s year-on-year bottom-line boost — US$254 million, or 215% — was a result of 2013 settlement costs. Market cap gains across the European sector can be chalked up in large part to Covidien’s 50% rise. Removing Covidien from Europe’s 24% sector-wide market cap growth would bring that figure to 17%, much closer to 2013’s
European commercial leaders and other companies, 2013–14 (US$b)
2014 2013 % change
Commercial leaders
Revenues $46.0 $43.9 5%
R&D expense $2.4 $2.3 4%
Net income (loss) $5.8 $5.2 10%
Market capitalization $160.2 $128.4 25%
Number of employees 203,900 194,100 0%
Number of commercial leaders 18 18 0%
Other companies
Revenues $5.4 $5.3 2%
R&D expense $0.5 $0.5 –2%
Net income (loss) $(0.5) $(0.2) 93%
Market capitalization $18.6 $16.1 16%
Number of employees 19,800 20,400 –3%
Number of other companies 153 135 13%
Source: EY, Capital IQ and company financial statement data.Commercial leaders are pure-play companies with revenues in excess of US$500 million.Numbers may appear inconsistent due to rounding.Market capitalization data is shown for 31 Dec 2014 and 31 Dec 2013.
Financial performanceEU
29Medical technology report 2015

30 EY | Pulse of the industry
EU | Financial performance
16% market cap rise. Beyond Covidien, Denmark’s Coloplast (up 46% in 2014) and the UK’s Smith & Nephew (up 45%) enjoyed market support.
Of the 10 fastest-growing European medtechs, as measured by five-year CAGR, half grew by acquisition in 2014, continuing a trend from 2013. (By comparison, only two of the 10 fastest-growing US companies made acquisitions in 2014.) Israeli aesthetics player Syneron led the way — for the sixth year in a row — as the fastest-growing European medtech, with a five-year CAGR of 36%. Essilor (10% five-year CAGR) and Össur (9%) joined UK optics company Halma-Medical (18%) and Dutch joint replacement specialist Tornier (11%) as the four newcomers to the list.
Selected fast-growing European medtechs by revenue growth, 2009–14 (US$m)
Companies Location 2009 2014 CAGR
Syneron Medical Israel $54.7 $255.7 36%
Merck KGaA: EMD Millipore Germany $883.3 $3,579.6 32%
Halma — Medical United Kingdom $118.5 $268.8 18%
Novartis — Alcon (Surgical & Vision Care) Switzerland $2,997.0 $6,616.0 17%
Tornier Netherlands $201.5 $345.0 11%
Ambu Denmark $172.3 $282.0 10%
Essilor International France $4,683.6 $7,526.9 10%
Semperit — Sempermed Austria $388.9 $601.2 9%
Ossur Iceland $330.6 $509.4 9%
ELEKTA Sweden $1,019.9 $1,560.2 9%
Source: EY, Capital IQ and financial statement data.Companies in italics have made significant acquisitions between 2009 and 2014.CAGR = compound annual growth rate
30 EY | Pulse of the industry

31Medical technology report 2015
Financial performanceEU
Selected European medtech public company financial highlights by region, 2014 (US$m, % change over 2013)
Region RevenueNumber of companies
Market capitalization 31 Dec 2014 R&D Net income
Cash and cash equivalents Total assets
France $11,080 34 $34,976 $684 $1,211 $1,490 $19,761
11% 17% 22% 15% 39% -25% 35%
Ireland $10,707 4 $46,907 $557 $1,569 $1,655 $21,027
4% 100% 50% 9% -8% -12% 4%
Sweden $5,957 42 $12,714 $310 $365 $715 $11,047
1% 24% -18% -6% -28% -8% 11%
United Kingdom $5,340 21 $20,438 $297 $433 $448 $8,685
7% 5% 39% 5% -24% -2% 24%
Germany $4,239 13 $4,978 $175 $184 $405 $4,026
5% -7% 11% 7% 15% 36% 5%
Denmark $4,166 4 $25,457 $202 $689 $378 $4,218
6% 0% 31% 7% -4% -6% 9%
Switzerland $3,632 7 $17,046 $162 $591 $1,030 $4,856
-11% -13% 15% -37% 85% -13% -12%
Italy $3,091 5 $5,241 $140 $264 $649 $4,187
2% 0% 4% -8% 29% 28% 7%
Netherlands$1,690 2 $6,703 $188 $87 $605 $5,113
5% 0% 3% 11% 167% 38% 7%
Israel$672 25 $1,938 $118 -$148 $449 $985
26% 9% -21% 22% 61% 18% 8%
Source: EY, Capital IQ and company financial statement data.Data shown for pure-play companies only.
31Medical technology report 2015

32 EY | Pulse of the industry
A record year, a looming crisis?
The all-time highs in initial public offerings (IPOs) and debt financings cannot be ignored. Those injections of capital helped propel mergers and acquisitions to record highs last year and boosted the prospects of newly public medtechs.
Financing

33Medical technology report 2015
However, this impressive total is marred by a persistent vacuum in early-stage venture capital funding that continues to threaten the future of medtech’s innovation ecosystem. The innovation capital that does find its way into the coffers of medtech’s emerging public and private companies has shrunk for the second year in a row; it comes from a dwindling number of sources; and it is increasingly concentrated among a smaller group of successful fundraisers.
The all-time highs in initial public offerings (IPOs) and debt financings cannot be ignored. Those injections of capital helped propel mergers and acquisitions to record highs last year and boosted the prospects of newly public medtechs. Most notably, the window
for IPOs remained open for a second consecutive 12 months. Between 1 July 2014 and 30 June 2015, 43 companies debuted on exchanges in the US and Europe, raising close to a cumulative US$2.3 billion. That total is more than US$800 million (57%) above the previous 10-year high achieved in the prior 12 months.
Meanwhile, the industry’s largest players led a tsunami of debt deals that pulled in more than US$40.8 billion, nearly double the previous high-water mark of US$23.1 billion achieved in July 2012–June 2013. Just five companies combined to raise the vast majority of that total, which accounted for an astounding 82% of all medtech financing.
It seems improbable that such record levels of IPO and debt financing are sustainable, however, and a more distressing story lurks beneath the record fundraising headlines. The industry’s fantastic success in raising debt capital is due at least in part to historically low interest rates, as well as megamergers that represented compelling inorganic growth stories. However, at more than double the level of the past seven years’ average, the period’s debt financing is more likely an outlier than the new normal. And, although the current IPO window for medtech companies specifically, and health care companies more broadly, is historic in both the number of companies and total amounts raised, even wide-open windows eventually close.
The 12 months ending 30 June 2015 were a blockbuster year for medtech financing. Public investor support of fledgling companies, combined with inexpensive debt, produced the sector’s largest financial haul ever, nearly US$50 billion. That is nearly double what medtechs raised in the prior period and 56% more than the previous post-financial crisis record set in the 12 months ending 30 June 2013.
Capital raised in the US and Europe by year (US$m)
TypeJul 2008– Jun 2009
Jul 2009– Jun 2010
Jul 2010– Jun 2011
Jul 2011– Jun 2012
Jul 2012– Jun 2013
Jul 2013– Jun 2014
Jul 2014– Jun 2015
Venture $4,711 $5,013 $4,156 $4,710 $4,349 $4,821 $4,703
IPO $17 $353 $820 $436 $205 $1,465 $2,299
Follow-on and other $1,801 $2,389 $2,397 $1,013 $4,205 $2,040 $1,960
Debt $6,437 $13,344 $12,273 $20,097 $23,120 $19,765 $40,823
Total $12,967 $21,099 $19,646 $26,255 $31,878 $28,090 $49,785
Source: EY, BMO Capital Markets, Dow Jones VentureSource and Capital IQ.Numbers may appear inconsistent due to rounding. PIPEs are included in “follow-on and other.”

34 EY | Pulse of the industry
The cyclical nature of public markets’ embrace of medical technology IPOs is seemingly fundamental, a law akin to gravity or thermodynamics. (In contrast, the follow-on market appears remarkably steady, if slightly tepid, with the recent period’s roughly US$2 billion on par with our seven-year average.)
All of which makes the continued scarcity of early-stage medtech venture financing even more problematic. Total venture funding of medtech fell about 2.4% year-on-year. At just over US$4.7 billion for the year ending 30 June 2015, the total roughly equaled the industry’s average since Pulse began tracking medtech financing. (The low water mark, US$4.2 billion, occurred from July 2010 through June 2011.) The 2014-15 total reflected a year-on-year decline across multiple metrics: total proceeds, number of venture rounds and, in a show of investors’ disinterest in the sector compared to other opportunities, medtech’s share of all venture dollars.
Fewer medtech start-ups raising less capital and fewer venture investors willing to place bets on fledgling medtech companies may cause lasting damage to the innovation value chain. During the 2007-08 period, 180 different investors participated in funding private medtech companies; this past year, that figure fell to 141. Even more ominously, this ebb takes place during the historically buoyant IPO market and at a time when related industries are enjoying healthy venture investment bolstered by an influx of new and deep-pocketed sources of innovation capital. The medtech industry faces a fundamental challenge in sourcing capital to foster innovation and reignite growth.
Debt bonanzaThe four largest debt offerings raised from July 2014 through June 2015 helped finance acquisitions. Medtronic alone raised US$17 billion to finance the cash consideration of its US$42.9 billion acquisition of Covidien, which closed in January 2015. Besides Medtronic’s enormous deal, Becton Dickinson (BD), Zimmer and Boston Scientific raised cumulatively almost US$18 billion in debt to fund their respective acquisitions of CareFusion, Biomet and Endo International’s American Medical Systems’ Men’s Health and Prostate Health business. Buying CareFusion adds medication management services and patient care technologies to BD’s BD Medical business unit and shores up its domestic sales. Zimmer’s take-out of Biomet makes the newly bulked-up orthopedics player second only to Johnson & Johnson in that therapeutic device category, while Boston Scientific has taken over the top spot in the men’s health device market as a result of its acquisition of AMS and its urology portfolio. Though the past year didn’t boast the same headline M&A figures, the availability of inexpensive debt clearly helped maintain momentum.
Those four large offerings, plus the more than US$1.6 billion Thermo Fisher raised for general corporate purposes in November 2014, accounted for 89% of the 12 months’ medtech debt dollars (and 73% of the year’s total medtech financing). Overall, 20 medtech companies took advantage of low interest rates to raise at least US$100 million in debt deals during the July 2014–June 2015 period.
Commercial stage companies that haven’t tapped the debt markets may be tempted to do so while debt remains inexpensive, especially as growth via M&A remains the industry’s most obvious near-term value creation strategy and aggressive payments to shareholders continue to help drive industry returns.
Financing

35Medical technology report 2015
Innovation capitalThe unusually enormous sums raised by commercial leaders in the debt market meant 2014–15 was a commercial leaders’ world, dwarfing the so-called innovation capital raised in the same period. (Innovation capital is the money raised by companies with less than US$500 million in annual revenue.)
In the 12 months ending 30 June 2015, innovation capital fell nearly 12% to US$13.0 billion. Although this is the second consecutive yearly drop in innovation capital from 2012–13’s high of more than US$15.8 billion, it’s still safely higher than the 10-year average of about US$9.4 billion. However, because of the year’s debt totals — and in spite of the booming IPO market — innovation capital’s share of total funding dropped to a record low of less than 26%.
Moreover, the innovation capital that was raised in 2014–15 resides in the coffers of fewer, later-stage players, creating a smaller handful of cash-rich companies. In the 2014–15 period, financings greater than US$50 million accounted for about 55% of total innovation capital, or nearly US$7 billion. At its nadir in 2008, however, that same share of capital was only about US$1.6 billion, or 22% of the total. Among the “haves” — those companies perennially grabbing the largest shares of innovation capital — are firms developing products for well-established sub-sectors, such as orthopedic and cardiovascular devices and non-imaging diagnostics.
US$
b
Commercial leaders Innovation capital
Innovation capital raised in the US and Europe by year
Source: EY, BMO Capital Markets, Dow Jones VentureSource and Capital IQ.Innovation capital is the amount of capital raised by companies with revenues of less than US$500 million.
0
10
20
30
40
50
60
Jul 2008–Jun 2009
Jul 2009–Jun 2010
Jul 2010–Jun 2011
Jul 2011–Jun 2012
Jul 2012–Jun 2013
Jul 2013–Jun 2014
Jul 2014–Jun 2015
Venture capital concernsAcross all industries, the venture markets are booming. In 2014–15, more companies raised more venture capital than perhaps ever before. Dow Jones VentureSource reports venture capitalists (VCs) invested US$57 billion in US companies in 2014. That is at least US$20 billion more than in any other calendar year since the 2008 financial crisis. In 2015, according to VentureSource, the climate has warmed even more, with nearly US$36 billion deployed in the six months ending 30 June 2015. But health care in general (with the noteworthy exception of biotech), and in particular medtech, seems to have been left out in the cold.
In 2014, health care and medtech companies garnered only 20.7% and 5.9% of all US venture dollars, respectively, with both metrics in steady decline since 2009. (That year, health care captured 33.8% of venture dollars and medtech captured 12.7%.) In the first half of 2015, health care has rebounded slightly, to 21.7%. Medtech, however, remains in a slump. From January through June 2015, medtech companies pulled in a paltry 3.8% of US venture funding. (In overall dollars, the industry is on pace to better its 2014 total.)
The innovation capital that was raised in 2014-15 resides in the coffers of fewer, later-stage players, creating a smaller handful of cash-rich companies.
Financing

36 EY | Pulse of the industry
Early-stage venture funding is eroding at a faster clip. During the 12-month period from July 2014 through June 2015, only 29% of venture investment went to companies raising their seed, first or second rounds, as opposed to 37% in the prior 12-month period. (The 10-year average is 36.2%.) Most concerning, investment in early-stage companies dropped in absolute terms to less than US$1.3 billion from nearly US$1.6 billion in the prior period. Late-stage investment, at more than US$3.1 billion, accounted for 71% of the total and a 10-year high in absolute terms, reflecting the reduced risk of investing in more established companies as well as the increased presence of crossover investors (those investors who back both private and public companies, a phenomenon closely related to the wide-open IPO window).
Investors poured the most money into therapeutic device companies, which garnered 57% of the total. Again, cardiovascular therapeutic devices (13% of all medtech venture funding) and orthopedic therapeutic devices (8%) combined to attract about a billion dollars in venture capital during the period. And impressively, non-imaging diagnostics companies captured 25% of all medtech venture funding during the period, or nearly US$1.2 billion. Leading the way was the molecular diagnostics company Invitae (a 2010 spin-out from Genomic Health), which raised US$120 million in an October 2014 financing. That crossover-heavy round was the largest medtech venture financing of the 12-month period and was quickly followed by Invitae’s February 2015 IPO, which grossed nearly the same amount (about US$117 million) in a rare upsized, above-the-range debut.
0%
10%
20%
30%
40%
50%
60%
70%
80%
90%
100%
Source: EY, Dow Jones VentureSource and Capital IQ.Early-stage investment includes seed, series A and series B rounds. It was not possible to classify $300 million in venture investments as either early-stage or late-stage.
Jul 2008–Jun 2009
Jul 2009–Jun 2010
Jul 2010–Jun 2011
Jul 2011–Jun 2012
Jul 2012–Jun 2013
Jul 2013–Jun 2014
Jul 2014–Jun 2015
Late stage Early stage
US and European venture investment by round
Venture investors appear increasingly disinterested in medtech companies.
Financing

37Medical technology report 2015
Num
ber o
f fina
ncin
g ro
unds
Capi
tal r
aise
d (U
S$m
)
Source: EY and Dow Jones VentureSource.
Amount of capital raised Number of financing rounds
VC rounds of US medtech companies with participation of corporate venture investors, by year
July 2009–June 2010
July 2010–June 2011
July 2011– June 2012
July 2012–June 2013
July 2013–June 2014
July 2014–June 2015
0
10
20
30
40
50
60
70
$0
$200
$400
$600
$800
$1,000
$1,200
Despite the successes enjoyed by companies like Invitae, venture investors appear increasingly disinterested in medtech companies. Part of the decline in medtech’s share of the overall pie might be chalked up to a few colossal venture rounds in the tech space: when the ride-hailing app company Uber raises, on its own, several billion dollars in venture funding in a single year, that has an outsized impact on technology companies’ share of the overall venture market.
But an increasingly uncertain reimbursement climate, as well as tougher regulation in key markets such as Europe, can put off venture firms’ limited partners. Venture investors may also shy away from earlier-stage investments in favor of keeping additional dry powder to support existing investments or later-stage opportunities. Whatever the cause, investors that choose to remain active in medtech could, paradoxically, reap outsized rewards: fewer dollars sloshing around the ecosystem means the remaining investors should be able to drive better deal terms. And, start-ups that do receive funding should theoretically be more capital efficient and of higher caliber, possibly breaking the cycle of incremental innovation by producing truly differentiated products.
What’s more, in an era of shrinking traditional investment sources, that funding may increasingly come from a more diverse set of backers. Take, for example, the US$40 million venture round raised in May 2015 by the cardiovascular device company Shockwave Medical. Only a few years ago, the California company might have been backed by a familiar syndicate of Silicon Valley VCs. Shockwave’s 2015 round was instead backed by two undisclosed large-cap strategic investors
alongside VCs and crossover investors from both US coasts, as well as Europe. (See the accompanying perspective, “Making money in medtech.”)
The increased presence of strategic investors — led by the handful of traditionally active corporate investors that include Johnson & Johnson, Abbott and Medtronic — will be particularly important for medtech companies attempting to weather a downturn in traditional venture investment. Large, diversified companies better known for their pharmaceutical units (and their corporate venture activity in the biotech space) may also play a pivotal role.
In the 12 months from July 2014 through June 2015, active corporate medtech investors included Novartis Venture Funds, Roche Venture Fund, Merck Global Health Innovation, Pfizer Ventures and GlaxoSmithKline’s SR
One. While these strategic investors are currently holding steady at about US$1.1 billion–US$1.2 billion in medtech venture investment per year, their invested capital is growing as a percentage of the total (from about a quarter to nearly a third), as cash from traditional VCs wanes.
IPOs reach historic highsThe blockbuster IPO market should help boost the returns of medtech venture investors. Medtech IPOs have enjoyed unprecedented success, with 43 companies going public from July 2014 through June 2015, up from 34 in the previous 12 months. Those companies raised more than US$2.3 billion from the public markets, for an average haul of about US$53 million, compared to US$1.5 billion and US$43.1 million the prior year. Of course, medtech’s success
Financing

38 EY | Pulse of the industry
hasn’t taken place in a vacuum, and has been overshadowed (and perhaps driven in part) by the success enjoyed by newly public biotechs. To put medtech in context: during the calendar year 2014, an astounding 63 biotech companies went public in the US alone.
But as the industry sets records for number of IPOs and total cash raised in IPOs, medtech investors surely see opportunities for growth. Interestingly, the therapeutic device subsector, where the industry’s largest players have struggled to eke out even low-single-digit year-on-year revenue growth, remains a strong area for IPOs. Therapeutic device companies accounted for 28 of the industry’s 43 public market debuts, raising US$1.6 billion in the process.
Seven orthopedics companies raised a combined US$450 million, led by Massachusetts-based implant maker ConforMIS, which raised US$155 million in
its June 2015 IPO, and French prosthetics company Amplitude Surgical, which raised nearly US$119 million the same month. Five ophthalmology companies raised a total of US$287 million, led by California’s Glaukos, which pulled in more than US$124 million to finance its glaucoma device. Among other notable categories, non-imaging diagnostics companies represented 11 IPOs, raising nearly half a billion dollars, led by the Belgian molecular diagnostics company Biocartis (about US$109 million in April 2015). Imaging companies raised US$108 million across three offerings.
It wasn’t a uniformly positive IPO market, however, as only about half of the medtechs reaching the public markets priced their deals within or above their selected price ranges. Post-market performance was also variable: only 15 of the 28 medtechs to go public in the US had produced positive returns as of 30 June 2015. (As ConforMIS debuted on 30 June 2015, it is not included in the analysis of post-IPO performance.)
In Europe, the performance was even worse: only 6 of 14 were in the green. Those companies that did stay above water tended to do extremely well, however, with an average 26% return as of 30 June 2015, which is above the broader medtech return of 20% produced during the same period.
Four out of every five medtechs to IPO in the US were revenue-generating. (During the 2007–08 period, the proportion was similar; two-thirds of US medtechs that went public generated revenue.) Such data suggest that while public investors are willing to embrace medtech companies,
Medtech IPOs have enjoyed unprecedented success, with 43 companies going public during the July 2014–June 2015 period, up from 34 in the previous period.
Financing

39Medical technology report 2015
they remain much more likely to value those medtechs based on real dollars as opposed to promise.
Three companies emerged as star performers. Non-magnetic intravenous infusion pump provider iRadimed soared 272% between its July 2014 IPO and the end of June 2015. The Florida-based company’s performance was driven by continued strong pump demand as well as pipeline progress; the company’s in-development MRI Monitor product is expected to reach the market in 2016.
Intersect ENT, which makes drug delivery implants for sinusitis, rose 160% on the year after its July 2014 IPO. Positive trial data for the California company’s PROPEL implant drove the increase. Nevro, which focuses on chronic pain, jumped 199% since its November 2014 IPO, taking its market value over US$1 billion.
Along with Invitae and Glaukos, Nevro was one of the few medtechs able to price above its planned IPO pricing range. The California-based neuromodulation company received a few boosts during the year, none bigger than FDA approval for its Senza spinal cord stimulation device in May 2015. Nevro and its shareholders took advantage of that momentum with a June 2015 follow-on offering. The combined primary/secondary stock sale allowed Nevro to raise roughly US$145 million and allowed its shareholders to gross about US$150 million in the secondary. No other medtech in the newly public cohort tapped the markets again in such a meaningful way.
Capi
tal r
aise
d in
IPO
s (U
S$b)
Num
ber o
f dea
ls
Source: EY, Capital IQ and Dow Jones VentureSource
US and European IPOs by year
Jul 2014–Jun 2015
Jul 2013–Jun 2014
Jul 2012–Jun 2013
Jul 2011–Jun 2012
Jul 2010–Jun 2011
Jul 2009–Jun 2010
Jul 2008–Jun 2009
Jul 2007–Jun 2008
Jul 2006–Jun 2007
Jul 2005–Jun 2006
Jul 2004–Jun 2005
Jul 2003–Jun 2004
Jul 2002–Jun 2003
Jul 2001–Jun 2002
Jul 2000–Jun 2001
0
10
20
30
40
50
0.0
0.5
1.0
1.5
2.0
2.5
Capital raised Number of deals
Jul 2014–Jun 2015
Jul 2013–Jun 2014
Jul 2012–Jun 2013
Jul 2011–Jun 2012
Jul 2010–Jun 2011
Source: EY, Capital IQ, and Dow Jones VentureSource
US and European IPO pricing by year
0.0
0.4
0.8
1.2
1.6
2.0
2.4
0
5
10
15
20
25
30
Capi
tal r
aise
d (U
S$b)
Num
ber o
f IPO
s
Below range Within range Above range Capital raised
Financing

US companies accounted for the vast majority of financing activity during the year, raising US$47 billion of the US$49.8 billion global total.
Hence, US trends mirrored global trends, with the enthusiasm around record debt (US$40.1 billion) and IPO (US$1.8 billion) raises tempered by essentially flat venture capital financing (up 0.8% to
of capital than in years past. There were only 409 venture financings during the July 2014–June 2015 period, compared with 449 the year prior and the prior six years’ average of 438 rounds.
US | Financing
United States mirrors global financing trends
Venture-backed US medtechs raised fewer rounds of capital than in years past. There were only 409 venture financings during the July 2014–2015 period, compared with 449 the year prior.
0
5
10
15
20
25
30
35
40
45
50
US
$b
Jul 2008–Jun 2009
Jul 2009–Jun 2010
Jul 2010–Jun 2011
Jul 2011–Jun 2012
Jul 2012–Jun 2013
Jul 2013–Jun 2014
Jul 2014–Jun 2015
Source: EY, BMO Capital Markets, Dow Jones VentureSource and Capital IQ.
US financings by yearDebt Follow-on and other IPO Venture
US$3.7 billion). Proceeds from follow-on offerings were also down for the year, off 21% to US$1.3 billion.
In addition to the decline in total venture financing, US medtechs raised fewer rounds
40 EY | Pulse of the industry
US | Financing

Financing US
Underscoring the increasing concentration of capital among fewer medtechs, with so many fewer rounds, average deal size was at its highest level in five years (US$9.2 million). California companies dominated the venture charts, with 8 of the top 10 financings by dollar value going to Golden State companies, and 8 of the top 13 going to companies in the northern part of the state. San Francisco-based Invitae’s US$120 million Series F topped the charts, followed by a US$80 million round from Connecticut-based imaging company Butterfly Network. Butterfly founder Jonathan Rothberg has said the company intends to develop an inexpensive, portable imaging device. Rounding out the top three was Mountain View, California-based personal genomics and research company 23andMe, with a US$79 million Series E round (which the company hopes will
Top US venture rounds, July 2014–June 2015
Company Region Product type (disease)Gross raised
(US$m) Quarter Round type
Invitae Northern California Non-imaging diagnostics 120 Q4 2014 Late stage
Butterfly Network Connecticut Imaging 80 Q4 2014 Late stage
23andMe Northern California Non-imaging diagnostics 79 Q2 2015 Late stage
Outset Medical Northern California Therapeutic devices (hematology/renal) 60 Q2 2015 Late stage
EndoChoice Georgia Therapeutic devices (gastrointestinal) 57 Q1 2015 Late stage
Guardant Health Northern California Non-imaging diagnostics 56 Q1 2015 Late stage
BioNano Genomics Southern California Research and other Equipment 53 Q4 2014 Late stage
Calhoun Vision Southern California Therapeutic devices (ophthalmic) 52 Q2 2015 Late stage
Outset Medical Northern California Therapeutic devices (hematology/renal) 51 Q2 2015 Late stage
Medical Instrument Development Laboratories Northern California Therapeutic devices (ophthalmic) 51 Q4 2014 Late stage
Cardiokinetix Northern California Therapeutic devices (cardiovascular/vascular) 50 Q1 2015 Late stage
TELA Bio Pennsylvania Therapeutic devices (non-disease-specific) 46 Q4 2014 Early stage
Restoration Robotics Northern California Therapeutic devices (aesthetics) 45 Q4 2014 Late stage
Shockwave Medical Northern California Therapeutic devices (cardiovascular/vascular) 40 Q2 2015 Early stage
Fractyl Laboratories Massachusetts Therapeutic devices (hematology/renal) 40 Q3 2014 Late stage
Misfit Wearables New Hampshire Non-imaging diagnostics 40 Q4 2014 Late stage
Source: EY, BMO Capital Markets, Dow Jones VentureSource and Capital IQ.
0%
5%
10%
15%
20%
25%
30%
35%
2008 2009 2010 2011 2012 2013 2014 H1 2015
Medtech's share of total venture funding Health care's share of total venture funding
Source: EY, Dow Jones VentureSource.
Medtech’s share of US venture capital continues to free-fall
41Medical technology report 2015

US | Financing US | Financing
Capital raised Number of deals
US IPOs by year
0
3
6
9
12
15
18
21
24
27
30
0.0
0.2
0.4
0.6
0.8
1.0
1.2
1.4
1.6
1.8
2.0
Jul 2014–Jun 2015
Jul 2013–Jun 2014
Jul 2012–Jun 2013
Jul 2011–Jun 2012
Jul 2010–Jun 2011
Jul 2009–Jun 2010
Jul 2008–Jun 2009
Jul 2007–Jun 2008
Jul 2006–Jun 2007
Jul 2005–Jun 2006
Jul 2004–Jun 2005
Jul 2003–Jun 2004
Jul 2002–Jun 2003
Jul 2001–Jun 2002
Jul 2000–Jun 2001
Num
ber o
f dea
ls
Capi
tal r
aise
d in
IPO
s (U
S$b)
Source: EY, Capital IQ, BioCentury and Dow Jones VentureSource.
eventually top US$150 million) that may propel the company deeper into drug development. Also noteworthy was the debut venture round (US$46 million) from TELA Bio, a stealthy Pennsylvania-based surgical reconstruction start-up.
In terms of overall financing, Minnesota led all states, raising US$17.2 billion
Source: EY, BMO Capital Markets, Dow Jones VentureSource and Capital IQ.
Jul 2008–Jun 2009
Jul 2009–Jun 2010
Jul 2010–Jun 2011
Jul 2011–Jun 2012
Jul 2012–Jun 2013
Jul 2013–Jun 2014
Jul 2014–Jun 2015
US venture capital by year
Tota
l am
ount
rais
ed (U
S$b)
0.0
1.5
3.0
4.5
6.0
7.5
9.0
10.5
12.0
13.5
0.0
0.5
1.0
1.5
2.0
2.5
3.0
3.5
4.0
4.5
Aver
age
deal
siz
e (U
S$m
)
Tota
l am
ount
rais
ed (U
S$b)
Total amount raised Average deal size
from 1 July 2014 to 30 June 2015. Of course, 99% of that total was due to massive debt Medtronic raised to fund its Covidien acquisition. Becton Dickinson’s large debt raise propelled New Jersey to second place, while Massachusetts was third, with companies in that state raising US$4.6 billion during the 12-month period.
42 EY | Pulse of the industry

Tota
l equ
ity c
apita
l rai
sed
(US$
b)
Venture capital raised (US$m)
Source: EY, BMO Capital Markets, Dow Jones VentureSource and Capital IQ.Size of bubbles shows relative number of financings per region.
Capital raised by leading US regions excluding debt, July 2014–June 2015
0 200 400 600 800 1,000 1,200 1,400 1,600 1,8000
0.5
1.0
1.5
2.0
2.5
3.0
3.5
Massachusetts
Northern California Southern California
Minnesota
Texas
New Jersey
Pennsylvania
New York State
Financing US
Selected US IPOs, July 2014–June 2015
Company name Location Product type (disease)Amount (US$m)
IPO pricing range
Post-IPO performance (as of 30 June 2015)
ConforMIS Massachusetts Therapeutic devices (orthopedic) 155 Within 28%
Nevro Northern California Therapeutic devices (neurology) 145 Within 199%
Glaukos Southern California Therapeutic devices (ophthalmic) 124 Above 61%
Invitae Northern California Non-imaging diagnostics 117 Above -7%
EndoChoice Holdings Georgia Therapeutic devices (gastrointestinal) 110 Within 9%
Entellus Medical Minnesota Therapeutic devices (ear, nose and throat) 90 Within 52%
Sientra Southern California Therapeutic devices (aesthetics) 86 Within 68%
Ocular Therapeutix Massachusetts Therapeutic devices (ophthalmic) 75 Below 62%
Carbylan Therapeutics Northern California Therapeutic devices (multiple) 75 Below 43%
Lantheus Holdings Massachusetts Imaging 74 Below 3%
T2 Biosystems Massachusetts Non-imaging diagnostics 66 Below 48%
Avinger Northern California Therapeutic devices (cardiovascular/vascular) 65 Within -1%
Histogenics Massachusetts Therapeutic devices (orthopedic) 65 Below -41%
Intersect ENT Northern California Therapeutic devices (ear, nose and throat) 63 Within 160%
Bellerophon Therapeutics New Jersey Therapeutic devices (respiratory) 60 Below -34%
Roka Bioscience New Jersey Non-imaging diagnostics 60 Below -78%
Source: EY and CapitalIQ.
Excluding debt, medtechs based in Northern California raised the most equity financing (US$2.6 billion) of any region. Nearly 60% of that sum was venture dollars. Massachusetts and Southern California claimed the number two and three spots, respectively. Venture-backed companies in Massachusetts pulled in US$453 million, while public companies added US$547 million in additional equity financing. Southern California-based medtechs, meanwhile, raised nearly US$1 billion in equity financing, with 45% of the total captured by privately held players. As usual, these three geographies accounted for the majority of the venture capital dollars and equity funding invested July 2014–June 2015.
43Medical technology report 2015

US | Financing EU | Financing
Europe reverts to mean
US
$b
Source: EY, BMO Capital Markets, Dow Jones VentureSource and Capital IQ.
European financings by year
Debt Follow-on and other IPO Venture
0
1
2
3
4
5
6
Jul 2008–Jun 2009
Jul 2009–Jun 2010
Jul 2010–Jun 2011
Jul 2011–Jun 2012
Jul 2012–Jun 2013
Jul 2013–Jun 2014
Jul 2014–Jun 2015
The European venture picture is actually surprisingly steady over the past seven years.
Europe’s share of the global medtech financing pie, at less than 6%, was its smallest since 2008–09.
Without the massive influx of debt and with fewer IPOs than in the US, European medtechs raised only US$2.8 billion between July 2014 and June 2015, a decline of 45% from the prior year. Debt financing in Europe declined 77% to
cash raised in follow-on offerings rose by 59%, to US$677 million. The vast majority of Europe’s financing during the period was innovation capital, with only one commercial leader, the Swedish
US$733 million and IPO financing was flat at US$454 million. Venture financing fell by 13%, but the US$955 million in venture capital raised by European medtechs was still the second-highest total in the past seven years. Meanwhile,
44 EY | Pulse of the industry

Source: EY, BMO Capital Markets, Dow Jones VentureSource and Capital IQ.
Financing EU
Ave
rage
dea
l siz
e (U
S$m
)
Tota
l am
ount
rais
ed (U
S$b)
Source: EY, BMO Capital Markets, Dow Jones VentureSource and Capital IQ.
European venture capital by year
0
1
2
3
4
5
6
0.0
0.2
0.4
0.6
0.8
1.0
1.2
Jul 2008– Jun 2009
Jul 2009–Jun 2010
Jul 2010– Jun 2011
Jul 2011–Jun 2012
Jul 2012–Jun 2013
Jul 2013–Jun 2014
Jul 2014–Jun 2015
Total amount raised Average deal size
radiosurgery company Elekta, raising cash. Elekta’s March 2015 debt offering raised about US$119 million.
The European venture picture is actually surprisingly steady over the past seven years, with this year’s declines (including a 19% drop-off in the number of venture rounds, to 170) a reflection of an unusual spike during the previous year.
This year’s top venture round went to Biocartis, which pulled in US$86 million in a late 2014 pre-IPO round. In second was UK-based molecular tools company Oxford Nanopore Technologies, which raised US$58 million to build out its commercial and manufacturing infrastructure. The company has proven to be an adept and consistent fundraiser: its 2013 US$63 million round was good for second
Top European venture rounds, July 2014–June 2015
Company Location Product type (disease)Gross raised
(US$m) Quarter Round type
Biocartis Belgium Non-imaging diagnostics 86 Q3 2014 Late stage
Oxford Nanopore Technologies UK Research and other Equipment 58 Q3 2014 Late stage
Enigma Diagnostics UK Non-imaging diagnostics 50 Q4 2014 NA
Quanta Fluid Solutions UK Therapeutic devices (hematology/renal) 44 Q4 2014 Early stage
Xeltis Switzerland Therapeutic devices (cardiovascular/vascular) 36 Q4 2014 Early stage
Veryan Medical UK Therapeutic devices (cardiovascular/vascular) 27 Q1 2015 Late stage
Advanced Accelerator Applications France Imaging 26 Q2 2015 Late stage
Magnus Life Science UK Therapeutic devices (multiple) 26 Q4 2014 Early stage
Neuravi Ireland Therapeutic devices (hematology/renal) 21 Q2 2015 Early stage
EarlySense Israel Non-imaging diagnostics 20 Q1 2015 Late stage
Atlas Genetics UK Non-imaging diagnostics 20 Q1 2015 Late stage
In'Tech Medical France Therapeutic devices (orthopedic) 20 Q2 2015 Late stage
MyCartis Switzerland Research and other Equipment 20 Q3 2014 Early stage
Curetis Germany Non-imaging diagnostics 19 Q4 2014 Late stage
i-optics Netherlands Imaging 15 Q2 2015 Late stage
Pocared Diagnostics Israel Non-imaging diagnostics 15 Q1 2015 Early stage
45Medical technology report 2015

US | Financing EU | Financing
largest that year, and the company raised US$109 million in July 2015, staking an early claim for the top of next year’s leaderboard.
Oxford Nanopore doesn’t court traditional venture investors, though, instead raising its cash from the kinds of institutional investors that typically support publicly traded companies.
The United Kingdom led the way in venture funding (US$322 million) and overall funding (US$576 million) during the year, with strong showings from France (second overall with US$432 million) and Israel (third overall at US$333 million). Israel was second in venture with US$185 million and had the most venture rounds in Europe, at 51.
European IPOs by year
0
3
6
9
12
15
18
21
0.0
0.1
0.2
0.3
0.4
0.5
0.6
0.7
Jul 2014–Jun 2015
Jul 2013–Jun 2014
Jul 2012–Jun 2013
Jul 2011–Jun 2012
Jul 2010–Jun 2011
Jul 2009–Jun 2010
Jul 2008–Jun 2009
Jul 2007–Jun 2008
Jul 2006–Jun 2007
Jul 2005–Jun 2006
Jul 2004–Jun 2005
Jul 2003–Jun 2004
Jul 2002–Jun 2003
Jul 2001–Jun 2002
Jul 2000–Jun 2001
Num
ber o
f dea
ls
Capi
tal r
aise
d in
IPO
s (U
S$b)
Source: EY, Capital IQ and Dow Jones VentureSource.
Capital raised Number of deals
46 EY | Pulse of the industry

Tota
l cap
ital r
aise
d (U
S$m
)
Venture capital raised (US$m)
Source: EY, BMO Capital Markets, Dow Jones VentureSource and Capital IQ.Size of bubbles shows relative number of financings per region.
Capital raised by leading European countries excluding debt, July 2014–June 2015
0
100
200
300
400
500
600
700
0 50 100 150 200 250 300 350 400
Belgium Israel
Sweden
Finland
Switzerland
France
Netherlands UK
GermanyThe United Kingdom led the way in venture funding and overall funding during the year, with strong showings from France and Israel.
European IPOs, July 2014–June 2015
Company Location Product type (disease)Gross raised
(US$m)IPO pricing range
Post-IPO performance (as of 30 June 2015)
Amplitude Surgical SA France Therapeutic devices (orthopedic) 119 Within –3%
Biocartis Belgium Non-imaging diagnostics 109 Within 11%
Innocoll Ireland Therapeutic devices (multiple) 59 Below 63%
NeuroDerm Israel Therapeutic devices (neurology) 45 Below 54%
ReWalk Robotics Israel Therapeutic devices (orthopedic) 41 Below –7%
SciBase Sweden Non-imaging diagnostics 20 Within –13%
Nexstim Finland Imaging 20 Within –22%
Check-Cap Israel Imaging 12 Within –42%
Safe Orthopaedics France Therapeutic devices (orthopedic) 11 Within 64%
LIDDS Sweden Therapeutic devices (oncology) 7 Within –48%
I.CERAM France Therapeutic devices (orthopedic) 4 Within 61%
Zenicor Medical Systems Sweden Non-imaging diagnostics 2 Within –13%
VibroSense Dynamics Sweden Therapeutic devices (neurology) 1 Within –18%
Scandinavian Real Heart Sweden Therapeutic devices (cardiovascular/vascular) 1 Within 28%
Source: EY and CapitalIQ.
47Medical technology report 2015

48 EY | Pulse of the industry
Seeking scale and focus
In 2014-15, larger players took advantage of inexpensive capital to pursue scale through bolt-on acquisitions, while diversified companies divested underperforming or non-core units.
M&A

49Medical technology report 2015
In 2014–15, larger players took advantage of inexpensive capital to pursue scale through bolt-on acquisitions, while diversified companies divested underperforming or non-core units. The year also saw the emergence of new industry leaders, as a series of large acquisitions catapulted Danaher and Becton Dickinson toward the top of the medtech revenue rankings.
The shadow of Medtronic’s US$42.9 billion acquisition of Covidien from the prior period loomed large. Absent that behemoth, total medtech M&A growth would have been an impressive 39% by dollar value. The Medtronic-Covidien deal wasn’t the only transaction affecting overall deal metrics. In 2014–15, there were two megadeals (transactions worth more than US$10 billion)
totaling US$26 billion, more value than in any other recent period except last year.
Normalizing for those transactions, both total and average medtech deal values demonstrated steady growth relative to the past few years. (However, non-megadeal totals remained substantially below the 2010–11 period.)
The total value of medtech mergers and acquisitions (M&A) declined 31% to US$58.4 billion in the year that ended 30 June 2015 and transaction volume was the lowest since 2010. But those drops in total deal dollars and deal volume mask a variety of metrics that point to a rebounding takeover market for the medtech industry.
0
20
40
60
80
100
120
140
160
180
0
10
20
30
40
50
60
70
80
90
Jul 2010–Jun 2011
Jul 2011–Jun 2012
Jul 2012–Jun 2013
Jul 2013–Jun 2014
Jul 2014–Jun 2015
Num
ber o
f dea
ls
Source: EY, Capital IQ and Thomson ONE.Chart includes deals with value disclosed.
Tota
l dea
l val
ue (U
S$b)
M&As in the US and Europe by yearMegadeals (>US$10b) Other M&As Number of M&As

50 EY | Pulse of the industry
Indeed, non-megadeal M&A value grew 13% year-over-year to US$32.4 billion, driven by an impressive additional 14 deals valued at more than US$1 billion (double the prior year’s total). The average deal size for all non-megadeals rose 31% to US$238 million, the highest average since 2010–11.
From a pure-play medtech perspective, much of that dealmaking came from Europe, where total deal value, number of deals and average deal size all reached multiyear highs. (This growth is independent of a series of portfolio rationalization decisions by Europe-based conglomerates such as Siemens and Bayer that would further enhance Europe’s M&A statistics.)
In the US, those same indicators slipped to multiyear lows. Overall, the M&A scene was healthy in 2014–15, with some obvious geographic disparities. But as consolidation at the top of medtech’s ranks continues, fewer companies may be competing for industry’s promising takeout targets in the future, which may suppress future exit values for fledgling companies.
Scale and focusMedtech companies continue to contend with tricky reimbursement environments and the quest for the types of truly innovative products that
can lift both top and bottom lines out of their low single-digit doldrums. (See the accompanying perspective, “Promoting an innovation agenda.”) During the calendar year 2014, the industry increased its R&D spend for the fifth consecutive year, narrowing the gap between what it devotes to R&D and what it returns to shareholders via buybacks and dividends to its slimmest point since 2009. But inorganic growth remained medtech’s most reliable strategy for business building, and the industry deployed US$37.3 billion on M&A during that calendar year.
Accelerating a trend that took hold in late 2013, industry’s largest companies pursued a variety of deals to build scale in core business areas, jettison underperforming assets and expand their service offerings for the year that ended 30 June 2015. Danaher’s US$13.8 billion acquisition of the filtration technology company Pall, and Becton Dickinson’s US$12.2 billion takeover of CareFusion to broaden its medication management portfolio comprised the year’s megadeals and were reminiscent of the trends.
Having only recently closed the merger with Covidien, Medtronic didn’t pull the trigger on any megadeals during the period. Still, the company managed to showcase its belief that scale is required for growth in the current medtech climate.
As consolidation at the top of medtech’s ranks continues, fewer companies may be competing for industry’s promising takeout targets in the future.
M&A
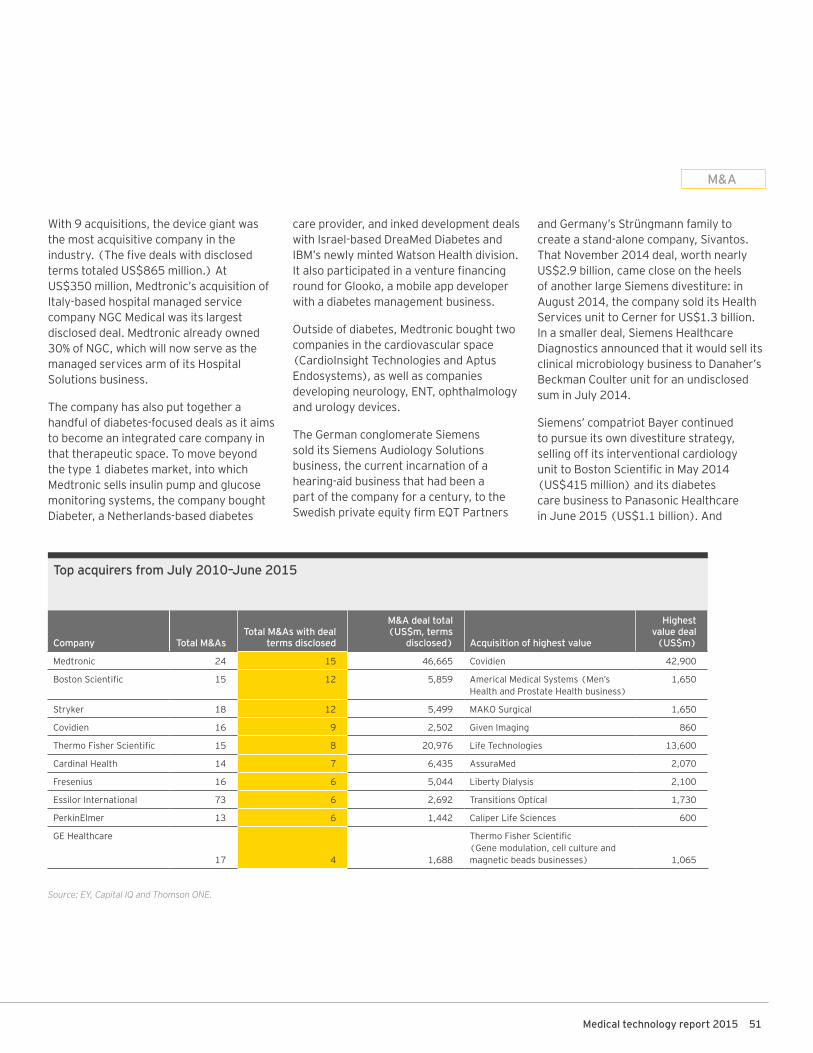
51Medical technology report 2015
With 9 acquisitions, the device giant was the most acquisitive company in the industry. (The five deals with disclosed terms totaled US$865 million.) At US$350 million, Medtronic’s acquisition of Italy-based hospital managed service company NGC Medical was its largest disclosed deal. Medtronic already owned 30% of NGC, which will now serve as the managed services arm of its Hospital Solutions business.
The company has also put together a handful of diabetes-focused deals as it aims to become an integrated care company in that therapeutic space. To move beyond the type 1 diabetes market, into which Medtronic sells insulin pump and glucose monitoring systems, the company bought Diabeter, a Netherlands-based diabetes
care provider, and inked development deals with Israel-based DreaMed Diabetes and IBM’s newly minted Watson Health division. It also participated in a venture financing round for Glooko, a mobile app developer with a diabetes management business.
Outside of diabetes, Medtronic bought two companies in the cardiovascular space (CardioInsight Technologies and Aptus Endosystems), as well as companies developing neurology, ENT, ophthalmology and urology devices.
The German conglomerate Siemens sold its Siemens Audiology Solutions business, the current incarnation of a hearing-aid business that had been a part of the company for a century, to the Swedish private equity firm EQT Partners
and Germany’s Strüngmann family to create a stand-alone company, Sivantos. That November 2014 deal, worth nearly US$2.9 billion, came close on the heels of another large Siemens divestiture: in August 2014, the company sold its Health Services unit to Cerner for US$1.3 billion. In a smaller deal, Siemens Healthcare Diagnostics announced that it would sell its clinical microbiology business to Danaher’s Beckman Coulter unit for an undisclosed sum in July 2014.
Siemens’ compatriot Bayer continued to pursue its own divestiture strategy, selling off its interventional cardiology unit to Boston Scientific in May 2014 (US$415 million) and its diabetes care business to Panasonic Healthcare in June 2015 (US$1.1 billion). And
M&A
Top acquirers from July 2010–June 2015
Company Total M&AsTotal M&As with deal
terms disclosed
M&A deal total (US$m, terms
disclosed) Acquisition of highest value
Highest value deal
(US$m)
Medtronic 24 15 46,665 Covidien 42,900
Boston Scientific 15 12 5,859 Americal Medical Systems (Men’s Health and Prostate Health business)
1,650
Stryker 18 12 5,499 MAKO Surgical 1,650
Covidien 16 9 2,502 Given Imaging 860
Thermo Fisher Scientific 15 8 20,976 Life Technologies 13,600
Cardinal Health 14 7 6,435 AssuraMed 2,070
Fresenius 16 6 5,044 Liberty Dialysis 2,100
Essilor International 73 6 2,692 Transitions Optical 1,730
PerkinElmer 13 6 1,442 Caliper Life Sciences 600
GE Healthcare
17 4 1,688
Thermo Fisher Scientific (Gene modulation, cell culture and magnetic beads businesses) 1,065
Source: EY, Capital IQ and Thomson ONE.

52 EY | Pulse of the industry
Johnson & Johnson, which sold Ortho-Clinical Diagnostics to Carlyle Group in January 2014 for US$4.15 billion, followed up on that deal with the sale of its Cordis endovascular device business to Cardinal Health. That March 2015 deal, worth nearly US$2 billion, underscores J&J’s attempt to revamp its medical device business to focus on faster-growing technologies or those that have the most potential for growth.
Like Siemens, Symmetry Medical and Alere also sold off services businesses, even as industry stalwarts such as Medtronic continue to see value in service offerings. In August 2014, contract manufacturer Tecomet acquired the OEM Solutions business of Symmetry Medical for US$450 million; in October 2014,
The US and European markets have perennially been driven by therapeutic device deals. The year ending 30 June 2015 was no exception.
M&A
Portfolio rationalization kicks into high gear
Acquired business unit Acquiring company MonthValue
(US$m)
Johnson & Johnson (Ortho-Clinical Diagnostics) Carlyle Group January 2014 $4,150
Siemens (Audiology Solutions) EQT Partners November 2014 $2,854
Johnson & Johnson (Cordis) Cardinal Health March 2015 $1,944
Novartis (Transfusion diagnostics unit) Grifols November 2013 $1,675
Endo International (AMS’ Men’s Health and Prostate Health business)
Boston Scientific March 2015 $1,650
Siemens (Health Services) Cerner August 2014 $1,300
Bayer (Diabetes Care) Panasonic Healthcare June 2015 $1,139
Thermo Fisher Scientific (Gene modulation, cell culture and magnetic beads businesses) GE Healthcare January 2014
$1,065
Alere (Health) Optum October 2014 $600
GE Healthcare (Vital Signs) Care Fusion November 2013 $500
Symmetry Medical (OEM Business Solutions) Tecomet August 2014 $450
Bayer (Interventional unit) Boston Scientific May 2014 $415
Zogenix (Zohydro ER franchise) Pernix Therapeutics March 2015 $384
Source: EY, Capital IQ and Thomson ONE.

53Medical technology report 2015
M&A
UnitedHealth Group’s service business Optum acquired Alere Health, which offers services in condition and case management and wellness, for US$600 million.
New leadersDanaher’s dealmaking had a significant impact on the M&A leaderboard and served to reshape the Washington, DC-based company’s product offerings. In May 2015, Danaher announced it would buy Pall Corporation, a leading provider of purification and filtration systems, for US$13.8 billion. The Pall deal allows Danaher to tap into the fast-growing demand for Pall’s technologies from the biotech sector — its life sciences business accounted for the majority of the company’s nearly US$3 billion annual revenue.
In addition to the Pall transaction, Danaher also bulked up its Beckman Coulter division with the acquisition of Siemens’ clinical microbiology business for an undisclosed sum, and solidified its spot as the top dental implant maker via its December 2014 acquisition of Nobel Biocare (US$2.2 billion).
Danaher plans to split into two publicly traded companies. Retaining the Danaher name will be a company that includes the Pall business, focused on life sciences and diagnostics (including Beckman Coulter), medical-diagnostic equipment, product-identification gear, dental appliances and water-treatment equipment. The new Danaher, which remains highly diversified, will comprise businesses generating about US$16.5 billion in annual revenue.
Becton Dickinson’s October 2014 US$12.2 billion cash-and-stock acquisition of the medication management leader CareFusion, meanwhile, moves it into the top five medical device companies, accelerating the company’s strategy for providing “end-to-end” solutions from drug preparation through administration and dispensing, the company noted at the time of the deal.
Buyers and sellersThe US and European M&A markets have perennially been driven by therapeutic device deals. In terms of deal volume, the year ending 30 June 2015 was no exception. As 114 device deals
Selected M&As, July 2014–June 2015
Acquiring company Location Acquired company LocationValue
(US$m)
Danaher US — District of Columbia Pall US — New York $13,800
Becton Dickinson US — New Jersey CareFusion US — California $12,200
EQT Partners Sweden Siemens (Audiology Solutions) Germany $2,854
Danaher US — District of Columbia Nobel Biocare Holding Switzerland $2,186
Hill Rom Holdings US — Indiana Welch Allyn US — New York $2,051
Cardinal Health US — Ohio Johnson & Johnson (Cordis) US — New Jersey $1,944
Steris US — Ohio Synergy Health UK $1,900
Montagu Private Equity UK Sebia France $1,858
Boston Scientific US — Massachusetts Endo International (AMS’ Men’s Health and Prostate Health business)
Ireland $1,650
Cerner US — Missouri Siemens (Health Services) Germany $1,300
Wright Medical Group US — Tennessee Tornier Netherlands $1,299
Cyberonics US — Texas Sorin Italy $1,242
Philips Healthcare Netherlands Volcano US — California $1,200
Panasonic Healthcare Japan Bayer (Diabetes Care) Germany $1,139
3M US — Minnesota Polypore International US — North Carolina $1,037
Source: EY, Capital IQ and Thomson ONE.
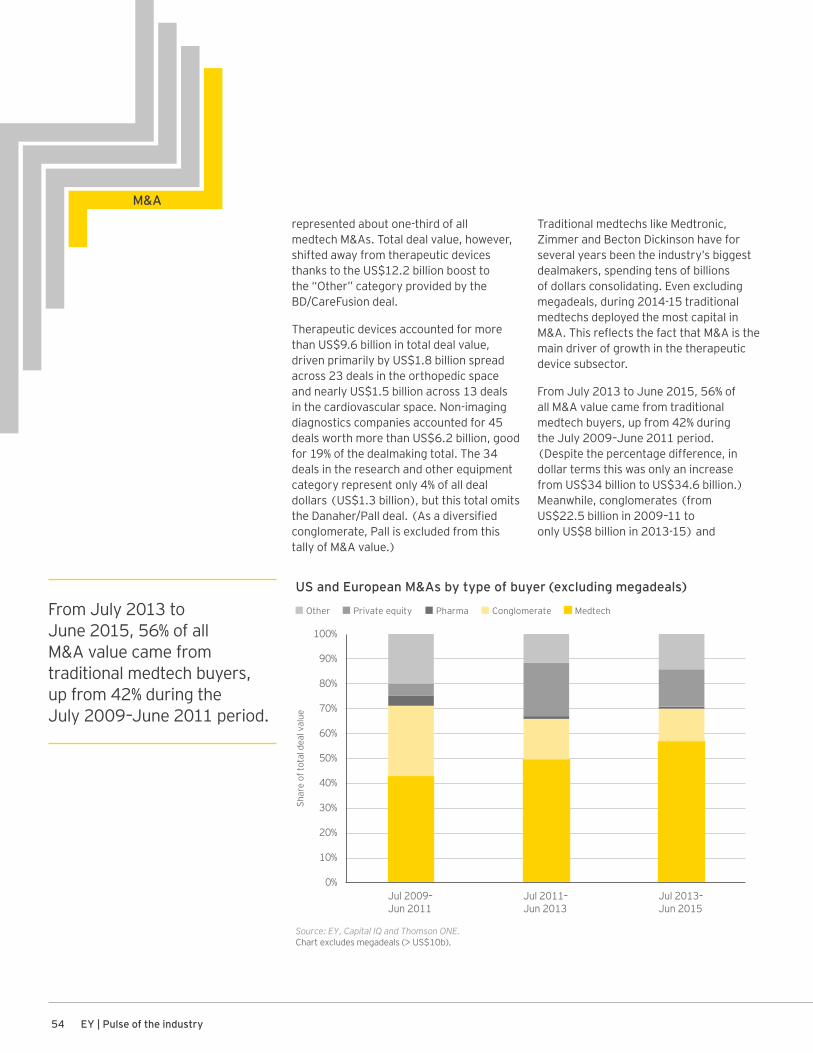
54 EY | Pulse of the industry
represented about one-third of all medtech M&As. Total deal value, however, shifted away from therapeutic devices thanks to the US$12.2 billion boost to the “Other” category provided by the BD/CareFusion deal.
Therapeutic devices accounted for more than US$9.6 billion in total deal value, driven primarily by US$1.8 billion spread across 23 deals in the orthopedic space and nearly US$1.5 billion across 13 deals in the cardiovascular space. Non-imaging diagnostics companies accounted for 45 deals worth more than US$6.2 billion, good for 19% of the dealmaking total. The 34 deals in the research and other equipment category represent only 4% of all deal dollars (US$1.3 billion), but this total omits the Danaher/Pall deal. (As a diversified conglomerate, Pall is excluded from this tally of M&A value.)
Traditional medtechs like Medtronic, Zimmer and Becton Dickinson have for several years been the industry’s biggest dealmakers, spending tens of billions of dollars consolidating. Even excluding megadeals, during 2014-15 traditional medtechs deployed the most capital in M&A. This reflects the fact that M&A is the main driver of growth in the therapeutic device subsector.
From July 2013 to June 2015, 56% of all M&A value came from traditional medtech buyers, up from 42% during the July 2009–June 2011 period. (Despite the percentage difference, in dollar terms this was only an increase from US$34 billion to US$34.6 billion.) Meanwhile, conglomerates (from US$22.5 billion in 2009–11 to only US$8 billion in 2013-15) and
0%
10%
20%
30%
40%
50%
60%
70%
80%
90%
100%
Shar
e of
tota
l dea
l val
ue
Source: EY, Capital IQ and Thomson ONE.Chart excludes megadeals (> US$10b).
US and European M&As by type of buyer (excluding megadeals)
Other Private equity Pharma Conglomerate Medtech
Jul 2009–Jun 2011
Jul 2011–Jun 2013
Jul 2013–Jun 2015
From July 2013 to June 2015, 56% of all M&A value came from traditional medtech buyers, up from 42% during the July 2009–June 2011 period.
M&A

55Medical technology report 2015
M&A
pharmaceutical companies (US$3.2 billion to US$482 million) saw their proportions slide in the most recent period. Private equity groups ballooned from less than US$4 billion during 2009–11 to more than US$13.6 billion during 2011–13, but that total fell to just over US$9 billion in the most recent two-year period.
Chinese acquirers The July 2014–June 2015 period saw the largest medtech acquisition ever by a China-based acquirer. The Hong Kong-based alternative investment firm XIO Group bought Israel-based Lumenis for US$510 million. Lumenis sells minimally invasive clinical solutions for the surgical, ophthalmology and aesthetic markets. Four other Chinese companies made acquisitions during the period (three with disclosed terms totaled US$153 million), but only two China-based companies were acquired during the same period, suggesting US and European medtechs are content, for the time being, to grow businesses in that emerging market organically after several years of M&A-driven growth.
0%
5%
10%
15%
20%
25%
30%
0
10
20
30
40
50
60
Jul 2010–Jun 2011
Jul 2011–Jun 2012
Jul 2012–Jun 2013
Jul 2013–Jun 2014
Jul 2014–Jun 2015
Source: EY, Capital IQ and Thomson ONE.
Milestone payments in US and European medtech M&As by yearNumber of M&As with milestones/total number of M&AsNumber of M&As with milestones
Num
ber o
f M&A
s
Perc
enta
ge o
f M&A
s w
ith m
ilest
one
paym
ents

56 EY | Pulse of the industry
Milestone deals dropThe past year featured fewer structured buyouts, with only 25 M&A deals during July 2014–June 2015 including milestone payments. This decline — from a four-year average of more than 46 per year, and from more than a quarter of all medtech acquisitions to fewer than 20% — reflects the options available to smaller medtech players. But this leverage is only likely to last as long as the IPO window for medtech companies remains open. (See accompanying article, “A record year, a looming crisis?”)
Over the same 12-month period, 43 companies went public on exchanges in the US and Europe, reflecting pent-up demand among public market investors for medtech companies who see the health care segment as a growth opportunity and,
thus, generated competition for would-be acquirers from the public markets. This is in stark contrast to almost every other year since the 2008 financial crisis, when — with limited opportunity to test public markets and less competition among acquirers — it was essentially a buyer’s market. In the 12 months between July 2014 and June 2015, the total value of milestones — as an absolute value and as a percentage of all M&A with milestones — also fell precipitously. At US$1.1 billion, the total value of all milestones during the period is less than half of its recent peak, in 2010–11. This drop is also partially driven by the kinds of companies larger players are acquiring. As takeover targets have matured and often are generating revenue from product sales, buyers find fewer obvious binary risks, such as clinical trial data or regulatory approvals, around which to hedge their bets.
The past year featured fewer structured buyouts, with only 25 M&A deals during July 2014–June 2015 including milestone payments.
M&A
0%
10%
20%
30%
40%
50%
0
0.5
1.0
1.5
2.0
2.5
3.0
Jul 2011–Jun 2012
Jul 2012–Jun 2013
Jul 2013–Jun 2014
Jul 2014–Jun 2015
Jul 2010– Jun 2011
Source: EY, Capital IQ and Thomson ONE.
Milestone share in US and European medtech M&As by year
Total value of milestones/total value of all M&As with milestonesTotal value of milestones
Tota
l dea
l val
ue (U
S$b)
Shar
e of
tota
l val
ue

57Medical technology report 2015
M&A
Europe steals the spotlightAlthough overall deal value in the US was up year-on-year for the second consecutive 12-month period, this bump was entirely due to the US$26 billion spent on the year’s two megadeals. Omitting Danaher/Pall and Becton Dickinson/CareFusion, US total deal value tumbled 38% to US$11.4 billion, 62% off the previous four-year average. Deal volume also fell, from 75 to 52 year-on-year and significantly off the four-year average (also 75). Finally, average deal value declined 9% year-on-year to $228 million in the US, off the four-year average of US$279 million by 18%.
This decline may be at least partly explained by the healthy equity markets, which give would-be M&A targets additional options for shareholder value creation. And as M&A targets increase in value on the public markets, would-be acquirers may find themselves priced out of a deal — or waiting for less buoyant valuations.
The picture was much brighter in Europe, particularly when including conglomerate spin-offs such as those from Bayer and Siemens. Ignoring Medtronic/Covidien from the previous period, total deal value jumped 190% year-on-year, reaching a five-year high of more than US$15.9 billion, a 93% improvement over the previous four-year average. Deal volume continued to ramp up smoothly, reaching 51 during the most recent period. And average deal size rose 145% year-on-year to US$312 million, 50% greater than the US$208 million previous four-year average. Removing Bayer’s and Siemens’ portfolio rationalization deals and the purchase of Endo International’s American Medical Systems Men’s Health and Prostate Health division by Boston Scientific, those metrics aren’t quite as impressive. But even without those drivers, deal volume and, in particular, total deal value jumped markedly year-on-year.
0
10
20
30
40
50
60
70
80
90
0
10
20
30
40
50
60
Jul 2010– Jun 2011
Jul 2011–Jun 2012
Jul 2012 –Jun 2013
Jul 2013–Jun 2014
Jul 2014–Jun 2015
Source: EY, Capital IQ and Thomson ONE.Chart includes deals with value disclosed and in which the acquired entity is a US medtech company.
US M&As by year
Tota
l dea
l val
ue (U
S$b)
Num
ber o
f dea
ls
Number of M&AsTotal deal value of megadeals (> US$10b) Total deal value
0
10
20
30
40
50
60
0
10
20
30
40
50
60
Jul 2010– Jun 2011
Jul 2011–Jun 2012
Jul 2012–Jun 2013
Jul 2013–Jun 2014
Jul 2014–Jun 2015
Source: EY, Capital IQ and Thomson ONE.Chart includes deals with value disclosed and in which the acquired entity is a European medtech company.
European M&As by year
Tota
l dea
l val
ue (U
S$b)
Num
ber o
f dea
ls
Number of M&AsTotal deal value of megadeals (> US$10b) Total deal value

58 EY | Pulse of the industry
Appendix
Defining medical technologyExcept as otherwise noted, medical technology (medtech) companies are defined for this report as companies that primarily design and manufacture medical technology equipment and supplies and are headquartered within the United States or Europe. For the purposes of this report, we have placed Israel’s data and analysis within the European market, and any grouping of the US and Europe has been referred to as “global.” This wide-
ranging definition includes medical device, diagnostic, drug delivery and analytical/life sciences tool companies, but excludes distributors and service providers such as contract research organizations or contract manufacturing organizations.
By any measure, medical technology is an extraordinarily diverse industry. While developing a consistent and meaningful classification system is important, it is anything but straightforward. Existing taxonomies sometimes segregate companies into scores of thinly populated categories, making it difficult to identify
and analyze industry trends. Furthermore, they tend to combine categories based on products (such as imaging or tools) with those based on diseases targeted by those products (such as cardiovascular or oncology), which makes it harder to analyze trends consistently across either dimension. To address some of these challenges, we have categorized medtech companies across both dimensions — products and diseases targeted.
Scope of this report

59Medical technology report 2015
Conglomerate companies
United States
• 3M: Health Care• Abbott: Diagnostic and Vascular Products• Agilent Technologies: Life Sciences and
Diagnostics• Allergan: Medical Devices• Baxter International: Medical Products• Corning: Life Sciences• Danaher: Life Sciences & Diagnostics and
Dental• Endo International: AMS• GE Healthcare• Hospira: Medication Management
• IDEX: Health & Science Technologies• Johnson & Johnson: Medical Devices &
Diagnostics• Pall: Life Sciences
Europe
• Agfa HealthCare• Bayer HealthCare: Medical Care• Carl Zeiss Meditec• DSM: Medical• Dräger: Medical• Eckert & Ziegler: Medizintechnik• Fresenius: Medical Devices
• GN Store Nord: GN ReSound• Halma: Medical• Jenoptik: Medical Technology• Merck KGaA: EMD Millipore• Novartis: Alcon Surgical• Philips Healthcare• Quantel Medical• Roche Diagnostics• Sanofi: Genzyme Biosurgery• Semperit: Sempermed• Siemens Healthcare• Smiths Medical
All publicly traded medtech companies were classified as belonging to one of five broad product groups:
• Imaging: companies developing products used to diagnose or monitor conditions via imaging technologies, including products such as MRI machines, computed tomography (CT) and X-ray imaging equipment, and optical biopsy systems
• Non-imaging diagnostics: companies developing products used to diagnose or monitor conditions via non-imaging technologies, which can include patient monitoring and in vitro testing equipment
• Research and other equipment: companies developing equipment used for research or other purposes, including analytical and life science tools, specialized laboratory equipment and furniture
• Therapeutic devices: companies developing products used to treat patients, including therapeutic medical devices, tools or drug delivery/infusion technologies
• Other: companies developing products that do not fit in any of the above categories were classified in this segment
In addition to product groups, this report tracks conglomerate companies that derive a significant part of their revenues from medical technologies. While a conglomerate medtech division’s technology could technically fall into one of the product groups listed above (e.g., GE Healthcare into “imaging” and Allergan into “therapeutic devices”), all conglomerate data are kept separate from that of the non-conglomerates. This is due to the fact that while conglomerates report revenues for their medtech divisions, they typically do not report other financial results for their medtech divisions, such as research and development or net income.
Appendix

60 EY | Pulse of the industry
Project leadershipGlen Giovannetti, EY Global Life Sciences Leader, provided strategic vision for this report, as well as a hands-on approach, editing articles and helping to compile and analyze data.
Chris Morrison, Contributing Writer, was the report’s lead author. He was responsible for writing all three Industry performance articles and the Year in review article.
Ellen Licking, EY Life Sciences Lead Analyst, was the report’s lead editor and a contributing writer. Iain Scott, EY’s other Life Sciences Lead Analyst, assisted with writing the guest articles.
As the project manager for Pulse of the industry, Jason Hillenbach had responsibility for the entire content and quality of this publication. He was also directly accountable for the primary data analysis and research throughout the report.
Data analysisRicha Arun, Tanushree Jain, Ashish Kumar and Ulrike Kappe conducted all of the research, collection and analysis of the report’s data.
Jason Hillenbach, Kim Medland, Ellen Licking and Iain Scott conducted fact-checking and quality review of the numbers presented throughout the publication.
Editing assistanceRussell Colton and Sue Brown were the copy editor and proofreader, respectively, for this edition of Pulse of the industry.
DesignThis publication would not look the way it does without the creativity of Aneesh Chandran, who was the lead designer for this project. Aneesh Nair and Joffy Jose provided additional design support, while Sujaya JP assisted with project coordination.
PR and marketingPublic relations and marketing efforts related to the report and its launch were led by Katie Costello, Peter Kelley and Sue Lavin Jones, with the help of Greg Kelley from our external PR firm, Feinstein Kean Healthcare.
Acknowledgments
Appendix

61Medical technology report 2015
Appendix
61Medical technology report 2015

62 EY | Pulse of the industry
Global Life Sciences Leader Glen Giovannetti [email protected] +1 617 374 6218
Global Life Sciences Assurance Leader Scott Bruns [email protected] +1 317 681 7229
Global Life Sciences Advisory Leader Kim Ramko [email protected] +1 615 252 8249
Global Life Sciences Tax Leader Mitch Cohen [email protected] +1 203 674 3244
Global Life Sciences Transaction Advisory Services Leader Jeff Greene [email protected] +1 212 773 6500
Australia Brisbane Winna Brown [email protected] +61 7 3011 3343
Melbourne Denise Brotherton [email protected] +61 3 9288 8758
Sydney Gamini Martinus [email protected] +61 2 9248 4702
Austria Vienna Erich Lehner [email protected] +43 1 21170 1152
Belgium Brussels Lucien De Busscher [email protected] +32 2 774 6441
Brazil São Paulo Frank de Meijer [email protected] +55 11 2573 3383
Canada Montréal Sylvain Boucher [email protected] +1 514 874 4393
Lara Iob [email protected] +1 514 879 6514
Toronto Mario Piccinin [email protected] +1 416 932 6231
Vancouver Nicole Poirier [email protected] +1 604 891 8342
Czech Republic Prague Petr Knap [email protected] +420 225 335 582
Denmark Copenhagen Christian Johansen [email protected] +45 5158 2548
France Paris Virginie Lefebvre-Dutilleul [email protected] +33 1 55 61 10 62
Germany Düsseldorf Gerd Stürz [email protected] +49 211 9352 18622
Mannheim Siegfried Bialojan [email protected] +49 621 4208 11405
Greater China Shanghai Titus Bongart [email protected] +86 21 22282884
Felix Fei [email protected] +86 21 22282586
India Mumbai Hitesh Sharma [email protected] +91 22 6192 0950
V. Krishnakumar [email protected] +91 22 6192 0950
Ireland Dublin Aidan Meagher [email protected] +353 1221 1139
Israel Tel Aviv Eyal Ben-Yaakov [email protected] +972 3 623 2512
Italy Milan Gabriele Vanoli [email protected] +39 02 8066 9840
Rome Alessandro Buccella [email protected] +39 06 67535630
Antonio Irione [email protected] +39 06 6755715
Japan Tokyo Hironao Yazaki [email protected] +81 3 3503 2165
Patrick Flochel [email protected] +81 3 3503 1542
Korea Seoul Jeungwook Lee [email protected] +82 2 3787 4301
Netherlands Amsterdam Dick Hoogenberg [email protected] +31 88 40 71419
New Zealand Auckland Jon Hooper [email protected] +64 9 300 8124
Global medical technology contacts

63Medical technology report 2015
Norway Trondheim/Oslo Willy Eidissen [email protected] +47 918 63 845
Poland Warsaw Mariusz Witalis [email protected] +48 225 577950
Russia Moscow Dmitry Khalilov [email protected] +7 495 755 9757
Singapore Singapore Sabine Dettwiler [email protected] +65 9028 5228
Rick Fonte [email protected] +65 6309 8105
South Africa Johannesburg Warren Kinnear [email protected] +27 11 772 3576
Spain Barcelona Dr. Silvia Ondategui-Parra [email protected] +34 93 366 3740
Sweden Uppsala Staffan Folin [email protected] +46 8 5205 9359
Switzerland Basel Jürg Zürcher [email protected] +41 58 286 84 03
United Kingdom Bristol Matt Ward [email protected] +44 11 7981 2100
Cambridge Cathy Taylor [email protected] +44 12 2355 7090
Rachel Wilden [email protected] +44 12 2355 7096
Edinburgh Mark Harvey [email protected] +44 13 1777 2294
Jonathan Lloyd-Hirst [email protected] +44 13 1777 2475
London/Reading David MacMurchy [email protected] +44 20 7951 8947
Ian Oliver [email protected] +44 11 8928 1197
United States Boston Kevin Casey [email protected] +1 617 585 1817
Michael Donovan [email protected] +1 617 585 1957
Chicago Jerry DeVault [email protected] +1 312 879 6518
James Welch [email protected] +1 312 879 3827
Houston Carole Faig [email protected] +1 713 750 1535
Minneapolis William Miller [email protected] +1 612 371 6984
Stephen Stenbeck [email protected] +1 612 371 6994
New York/New Jersey John Babitt [email protected] +1 212 773 0912
Dave DeMarco [email protected] +1 732 516 4602
Orange County Kim Letch [email protected] +1 949 437 0244
Philadelphia Howard Brooks [email protected] +1 215 448 5115
Steve Simpson [email protected] +1 215 448 5309
Raleigh Mark Baxter [email protected] +1 919 981 2966
Redwood Shores Chris Nolet [email protected] +1 650 802 4504
Rich Ramko [email protected] +1 650 802 4518
San Diego Dan Kleeburg [email protected] +1 858 535 7209

64 EY | Pulse of the industry
Number of US FDA Premarket Approvals by year 7
Medical technology at a glance, 2013–14 13
US and European non-conglomerate revenue growth by product group 15
Change in US and European therapeutic device companies’ revenue and net income by selected disease categories, 2014 vs. 2013 16
US and European commercial leaders, 2010–14 17
US public medtech cash index, 2012–14 18
European public medtech cash index, 2012–14 19
Penny wise? How medtechs have spent their cash, 2009–14 20
US market capitalization relative to leading indices, 2013–15 21
US market capitalization by company size, 2013–15 21
European market capitalization relative to leading indices, 2013–15 22
European market capitalization by company size, 2013–15 22
US medtech at a glance, 2013–14 24
US commercial leaders and other companies, 2013–14 25
Selected fast-growing US medtechs by revenue growth, 2009–14 26
Selected US medtech public company financial highlights by region, 2014 27
European medtech at a glance, 2013–14 28
European commercial leaders and other companies, 2013–14 29
Selected fast-growing European medtechs by revenue growth, 2009–14 30
Selected European medtech public company financial highlights by region, 2014 31
Capital raised in the US and Europe by year 33
Innovation capital raised in the US and Europe by year 35
US and European venture investment by round 36
VC rounds of US medtech companies with participation of corporate venture investors, by year 37
Data exhibit index

65Medical technology report 2015
US and European IPOs by year 39
US and European IPO pricing by year 39
US financings by year 40
Medtech’s share of US venture capital continues to free-fall 41
Top US venture rounds, July 2014–June 2015 41
US venture capital by year 42
US IPOs by year 42
Selected US IPOs, July 2014–June 2015 43
Capital raised by leading US regions excluding debt, July 2014–June 2015 43
European financings by year 44
European venture capital by year 45
Top European venture rounds, July 2014–June 2015 45
European IPOs by year 46
European IPOs, July 2014–June 2015 47
Capital raised by leading European countries excluding debt, July 2014–June 2015 47
M&As in the US and Europe by year 49
Top acquirers from July 2010–June 2015 51
Portfolio rationalization kicks into high gear 52
Selected M&As, July 2014–June 2015 53
US and European M&As by type of buyer 54
Milestone payments in US and European medtech M&As by year 55
Milestone share in US and European medtech M&As by year 56
US M&As by year 57
European M&As by year 57

Notes


EY | Assurance | Tax | Transactions | Advisory
About EY EY is a global leader in assurance, tax, transaction and advisory services. The insights and quality services we deliver help build trust and confidence in the capital markets and in economies the world over. We develop outstanding leaders who team to deliver on our promises to all of our stakeholders. In so doing, we play a critical role in building a better working world for our people, for our clients and for our communities.
EY refers to the global organization, and may refer to one or more, of the member firms of Ernst & Young Global Limited, each of which is a separate legal entity. Ernst & Young Global Limited, a UK company limited by guarantee, does not provide services to clients. For more information about our organization, please visit ey.com.
How EY’s Global Life Sciences Sector can help your businessLife sciences companies — from emerging to multinational — are facing challenging times as access to health care takes on new importance. Stakeholder expectations are shifting, the costs and risks of product development are increasing, alternative business models are manifesting, and collaborations are becoming more complex. At the same time, players from other sectors are entering the field, contributing to a new ecosystem for delivering health care. New measures of success are also emerging as the sector begins to focus on improving a patient’s “health outcome” and not just on units of a product sold.
Our Global Life Sciences Sector brings together a worldwide network of more than 7,000 sector-focused assurance, tax, transaction and advisory professionals to anticipate trends, identify implications and develop points of view on how to respond to the critical sector issues. We can help you navigate your way forward and achieve success in the new health ecosystem.
For more timely insights on the key business issues affecting life sciences companies, please go to ey.com/VitalSigns. You can also visit ey.com/lifesciences or email [email protected] for more information on our services. To connect with us on Twitter, follow @EY_LifeSciences.
© 2015 EYGM Limited. All Rights Reserved.
EYG no: FN0232
BMC Agency BACS 1002684
ED None
In line with EY’s commitment to minimize its impact on the environment, this document has been printed on paper with a high recycled content.
This material has been prepared for general informational purposes only and is not intended to be relied upon as accounting, tax, or other professional advice. Please refer to your advisors for specific advice.
The views of third parties set out in this publication are not necessarily the views of the global EY organization or its member firms. Moreover, they should be seen in the context of the time they were made.
ey.com/pulse