pulp capacity in the united states, 2000
TRANSCRIPT

Pulp Capacity in the United States, 2000 Brett R. Smith Robert W. Rice Peter J. Ince
United States Department of Agriculture Forest Service Forest Products Laboratory General Technical Report FPL−GTR−139

Abstract Contents Page Production capacities of all woodpulp mills in the United
States are identified by location, ownership, and process type. For each mill, production capacity is reported for the year 2000 by process type; total mill capacities are also reported for 1961, 1965, 1979, 1974, and 1983. In addition, the report summarizes the recent history and current status of woodpulp production capacity in the United States.
Introduction........................................................................... 1 Pulpwood Production and Capacity Trends.......................... 1 Trends in Pulpwood Receipts ............................................... 3 Pulpmill Capacity.................................................................. 3
Regional Pulpmill Capacity .............................................. 4 Keywords: woodpulp capacity, pulp mills, capacity trends, geographic distribution Grade Structure ................................................................. 4
Concluding Remarks............................................................. 4
Literature Cited ..................................................................... 5 Appendix�Capacity Data .................................................... 6
September 2003 Smith, Brett R.; Rice, R.W.; Ince, Peter J. 2003. Pulp capacity in the United States, 2000. Gen. Tech. Rep. FPL�GTR�139. Madison, WI: U.S. Depart-ment of Agriculture, Forest Service, Forest Products Laboratory. 23 p.
A limited number of free copies of this publication are available to the public from the Forest Products Laboratory, One Gifford Pinchot Drive, Madison, WI 53726�2398. This publication is also available online at www.fpl.fs.fed.us. Laboratory publications are sent to hundreds of libraries in the United States and elsewhere.
The Forest Products Laboratory is maintained in cooperation with the University of Wisconsin.
The use of trade or firm names is for information only and does not imply endorsement by the U.S. Department of Agriculture of any product or service.
The United States Department of Agriculture (USDA) prohibits discrimina-tion in all its programs and activities on the basis of race, color, national origin, sex, religion, age, disability, political beliefs, sexual orientation, or marital or familial status. (Not all prohibited bases apply to all programs.) Persons with disabilities who require alternative means for communication of program information (Braille, large print, audiotape, etc.) should contact the USDA�s TARGET Center at (202) 720�2600 (voice and TDD). To file a complaint of discrimination, write USDA, Director, Office of Civil Rights, Room 326-W, Whitten Building, 1400 Independence Avenue, SW, Wash-ington, DC 20250�9410, or call (202) 720�5964 (voice and TDD). USDA is an equal opportunity provider and employer.

Pulp Capacity in the United States, 2000 Brett R. Smith, Research Assistant, Department of Forest Management Robert W. Rice, Professor of Wood Science, Wood Science and Technology University of Maine, Orono, Maine
Peter J. Ince, Research Forester Forest Products Laboratory, Madison, Wisconsin
Introduction This report summarizes the current state and recent history of woodpulp production capacity in the United States. De-tailed information on current and historical capacity, owner-ship, and location is presented for each U.S. woodpulp mill. The information is organized by State, region, and type of pulp manufactured. Also included are summary tables and exhibits that analyze trends in average capacity, total capac-ity, pulpwood receipts, pulp production, and capacity by region using historical data. Previous summaries of wood pulp capacity have been published (Anon. 1959, 1961, 1965; McKeever 1977, 1987).
The information in this report is taken from several sources, including industry directories and publicly available corpo-rate information, principally Paperloop Publications (2001). Idled mills are accounted for in various ways by reporters, which has led to discrepancies in capacity and production data.
During the 20th century, U.S. woodpulp capacity increased greatly, while the total number of mills producing woodpulp generally decreased. From 1920 to 2000, for example, total U.S. woodpulp capacity grew from just over 15,000 short tons per day (TPD) to approximately 180,000 TPD. During this period, the total number of mills producing woodpulp dropped from 323 to 202.
Pulpwood Production and Capacity Trends After climbing fairly steadily throughout the 20th century, annual U.S. woodpulp production peaked historically in 1995 and then dropped by 12% over the next 7 years. The trend in U.S. woodpulp production is illustrated in Figure 1. The trend includes estimates of woodpulp produced for paper and paperboard products, dissolving pulp, and
mechanical pulp produced for construction paper and wet machine board.1
Figure 2 illustrates the trends in U.S. woodpulp production and production capacity since 1950. As illustrated, both woodpulp production and production capacity reached his-torical peaks in the mid- to late1990s and capacity peaked in 1997, according to data published by the American Forest & Paper Association (AF&PA 2001a).
U.S. woodpulp capacity has receded since 1997, according to AF&PA data, but capacity has not receded as much as production, because a number of mills were idled yet have remained in place. The AF&PA estimate of woodpulp capac-ity for the year 2000 was around 70 million short tons, equivalent to roughly 195,000 tons/day (AF&PA 2001b). The AF&PA data include capacity to produce woodpulp for paper and paperboard, construction paper, wet machine board, and dissolving pulp, but they do not include capacity to produce defibrated/exploded wood pulp for hardboard, insulating board or medium density fiberboard (MDF). Thus, the AF&PA total capacity estimate for 2000 (roughly 195,000 tons/day) agrees very closely with our total poten-tial capacity estimate (202,790 tons/day) after deducting the estimated capacity for defibrated/exploded pulp at
1 U.S. dissolving pulp capacity is reported by AF&PA, but dissolving pulp production has not been reported since 1992. In that year, dissolving pulp annual capacity was 1.46 mil-lion tons and the ratio of production to capacity (or capacity utilization) was 86%. The dissolving pulp capacity of the United States has been declining for decades, and capacity receded to 1.18 million tons in 2000. Woodpulp capacity includes dissolving pulp capacity (Fig. 2). Estimates of woodpulp production shown in the figures include an ap-proximation of dissolving pulp production based on an assumed 86% capacity utilization rate for dissolving pulp since 1992.

0
10
20
30
40
50
60
70 19
00
1910
1920
1930
1940
1950
1960
1970
1980
1990
2000
Milli
on s
hort
tons
2010
In 2001, capacity utilization for woodpulp was approxi-mately 86%, a level last experienced during the energy crisis of the mid-1970s and previously experienced only during the recessions of the late 1950s and early 1960s and at the end of the Great Depression in 1940. Several circumstances have contributed to the recent declines in U.S. woodpulp produc-tion and capacity utilization and the leveling of woodpulp capacity.
An exceptional increase in the trade-weighted value of the U.S. dollar, which began in 1996 and extended through 2001, contributed to a decline in U.S. pulp, paper, and pa-perboard exports, while simultaneously attracting a flood of imports. The strong dollar along with other economic factors also contributed to recession in the overall U.S. manufactur-ing sector in 2000 and 2001, dampening domestic demands for paper and paperboard in packaging, business, and adver-tising media. Thus, U.S. purchases of paper and paperboard dropped by 7.5% between 1999 and 2001, while production dropped by 8.4%. Also contributing to the leveling and decline in woodpulp production has been the significant increase in the use of recycled fiber in the manufacture of paper and paperboard in the United States since the 1980s. The consumption of recovered paper for recycling at U.S. paper and paperboard mills climbed from 20.2 million tons in 1989 to 31.4 million tons in 1995 and 37.9 million tons in 2000 (AF&PA 2001b).
Figure 1�Annual U.S. woodpulp production, 1900�2002.
30
80
10
20
40
50
60
70
0
1950
1960
1970
1980
1990
2000
Milli
on s
hort
tons
Woodpulp capacityWoodpulp production
2010
Precise annual data are not available on the production of exploded/defibrated pulp for hardboard, insulating board, and MDF. However, output data suggest that roughly 3 million tons of defibrated/exploded pulp were produced for those products in 2000. Production of insulating board and hardboard has been declining in recent decades, while MDF production has been increasing. The product output data indicate that annual production of defibrated/exploded pulp for those products in aggregate has increased by roughly 1 million tons over the past several decades.
The annual woodpulp capacity data (Fig. 2) reveal a deceler-ating trend in growth over recent decades. For example, in the 25-year period between 1940 and 1965, capacity in-creased at a compound growth rate of 5.1%/year. Over the subsequent 25-year period (1965 to 1990), capacity in-creased at a compound growth rate of 2.5%/year, just less than half the growth rate in the preceding 25 years. In the 16 years between 1985 and 2001, capacity increased at a compound growth rate of just 0.9%/year, and since the mid-1990s U.S. woodpulp capacity has actually receded.
Figure 2�Annual U.S. woodpulp production and production capacity, 1950�2002.
hardboard, insulating board, and MDF mills (7,858 tons/day) (see Appendix). In addition to capacity data for defi-brated/exploded pulp at hardboard, insulating board, and MDF mills, the data in this report include pulp mills that were actively in production and mills that were reportedly idled. Thus, the estimates of total capacity are total �poten-tial� capacity. About 10% of the total potential U.S. wood-pulp capacity was reportedly idled in 2000.
Likewise, annual woodpulp production data reveal a decel-erating trend in growth over recent decades, but with a more pronounced decline since the peak of production in 1995. In the 25-year period between 1940 and 1965, U.S. woodpulp production increased at a compound growth rate of 5.4%/year. Over the subsequent 25 years (1965 to 1990), production increased at a compound growth rate of
2

Figure 3�Annual U.S. woodpulp production, capacity, and pulpwood receipts, 1960�2002.
2.6%/year, again just less than half the growth rate in the preceding 25 years. In the 16 years between 1985 and 2001, production increased at a compound growth rate of just 0.5%/year, and U.S. woodpulp production declined substan-tially (by 11.7%) between the peak in 1995 and 2001 (Fig. 1).
Trends in Pulpwood Receipts Trends in pulpwood receipts at woodpulp mills have gener-ally followed trends in total woodpulp production. According to data on pulpwood receipts published by the Forest Resources Association (formerly American Pulpwood Association), the annual volume of pulpwood receipts at U.S. woodpulp mills increased fairly steadily over most of the 20th century, along with woodpulp production. How-ever, pulpwood receipts peaked in 1994, just a year before the peak in woodpulp production.
Subsequently, between 1994 and 2001, pulpwood receipts at U.S. woodpulp mills declined by 14.8%; between 1995 and 2002 U.S. woodpulp production declined similarly, by 11.9%. The trend in U.S. pulpwood receipts at woodpulp mills is illustrated in Figure 3, along with the generally correlated trend in U.S. woodpulp production and lagging trend in woodpulp capacity.
The mix of hardwoods and softwoods in total U.S. pulpwood receipts (roundwood and residues) has also shifted over time, although the proportion of softwoods in pulpwood receipts has generally been higher than that of hardwoods. According to historical data published by the Forest Re-sources Association, the shift in species mix generally fa-vored hardwoods from the 1950s to 1990s, with the hard-wood fraction of total pulpwood receipts increasing from 14% in 1950 to 24% in 1970 and peaking at 38% in 1994 (the same year total pulpwood receipts peaked). In recent
years, the hardwood fraction leveled and then declined slightly, standing at 36% in 2001.
300
0
60
120
180
240
1960 1970 1980 1990 2000
Milli
on g
reen
tons
pul
pwoo
d
0
20
40
60
80
100
Milli
on to
ns w
oodp
ulp
Pulpwood receiptsWoodpulp productionWoodpulp capacity
2010
The trends in regional volumes and proportions of pulpwood receipts at woodpulp mills have favored the South, with declining proportions in the West and North. By 2001, the South alone accounted for just over three-fourths (76%) of all U.S. pulpwood receipts, according to data published by the Forest Resources Association (Forest Resources Associa-tion 2002). This reflects a generally increasing volume of pulpwood receipts at woodpulp mills in the South, until the volume of receipts leveled in the mid-1990s. Meanwhile, the annual volume of receipts in the North climbed more gradu-ally and then declined in the early 1990s (declining more significantly in the Northeast), while the annual volume of receipts in the West increased until the mid-1980s, then subsequently declined (APA 1989).
Pulpwood receipts in the South increased from 59% of total U.S. pulpwood receipts in 1960 to 65% in 1980 and 76% by 2001. Pulpwood receipts in the North fell from 21% of total U.S. pulpwood receipts in 1960 to 16% in 1980 and 14% by 2001. Pulpwood receipts in the West were 20% of total U.S. pulpwood receipts in 1960 and 19% in 1980, but they have dropped significantly since the 1980s, to just 10% by 2001 (APA 1989, Forest Resources Association 2002).
Pulpmill Capacity Although total U.S. woodpulp capacity has leveled since the late 1990s, capacity generally grew from 1920 to 2000, reaching a total of 182,440 tons/day in 2000, or approxi-mately 66,591,000 tons/year (excluding idled capacity). Since 1920, woodpulp capacity has grown at an average compound growth rate of approximately 3.2%/year, although the rate of growth has decelerated over time. Woodpulp manufacture has changed significantly since 1920, with regard to the average size of production facilities, the mix of pulp types being made, and the locations where the pulp is manufactured.
The average pulpmill increased from 47 TPD in 1920 to 865 TPD in 2000 (weighted averages, Table 1). The increase occurred as a result of several factors. New mills coming online have been designed with capacities far larger than their predecessors to take advantage of economies of scale. Demand has grown significantly, requiring larger facilities; smaller, older mills that were not cost competitive because of outdated technology or size have closed. Newly constructed mills producing sulfate pulp have the largest capacities, often exceeding 2,000 tons/day in a single mill (Table 1). The average capacity of a sulfate mill was 1,220 TPD in 2000, dwarfing all other pulp mill types. In 2000, the average sulfite mill was capable of producing 336 TPD, the average mechanical pulp mill 399 TPD, and the average semi-chemical mill 454 TPD.
3

Table 1�Average capacity of U.S. wood pulp mills by grade (short tons/day)
Sulfite Sulfate Mechanical Semichemical
Year Number Avg. cap. Number
Avg. cap. Number
Avg. cap. Number
Avg. cap.
1920 96 57 52 47 175 42
1930 89 80 70 80 136 60 13 23
1940 80 108 69 189 100 74 10 69
1950 67 136 78 294 91 95 22 133
1955 67 150 83 409 93 103 80 104
1961 62 180 95 537 87 147 58 172
1965 54 209 101 619 77 172 57 191
1970 41 249 121 734 71 207 54 232
1974 33 297 120 826 64 226 50 275
1983 21 364 122 991 79 279 44 322
2000 13 336 114 1,220 52 399 23 454
Regional Pulpmill Capacity Sulfite pulp continued the slide in total capacity begun in the
1960s, falling from 7,650 TPD in 1983 to 4,367 TPD in 2000. The average sulfite mill produced 336 TPD in 2000, the only grade to have a decrease in average mill size since 1983.
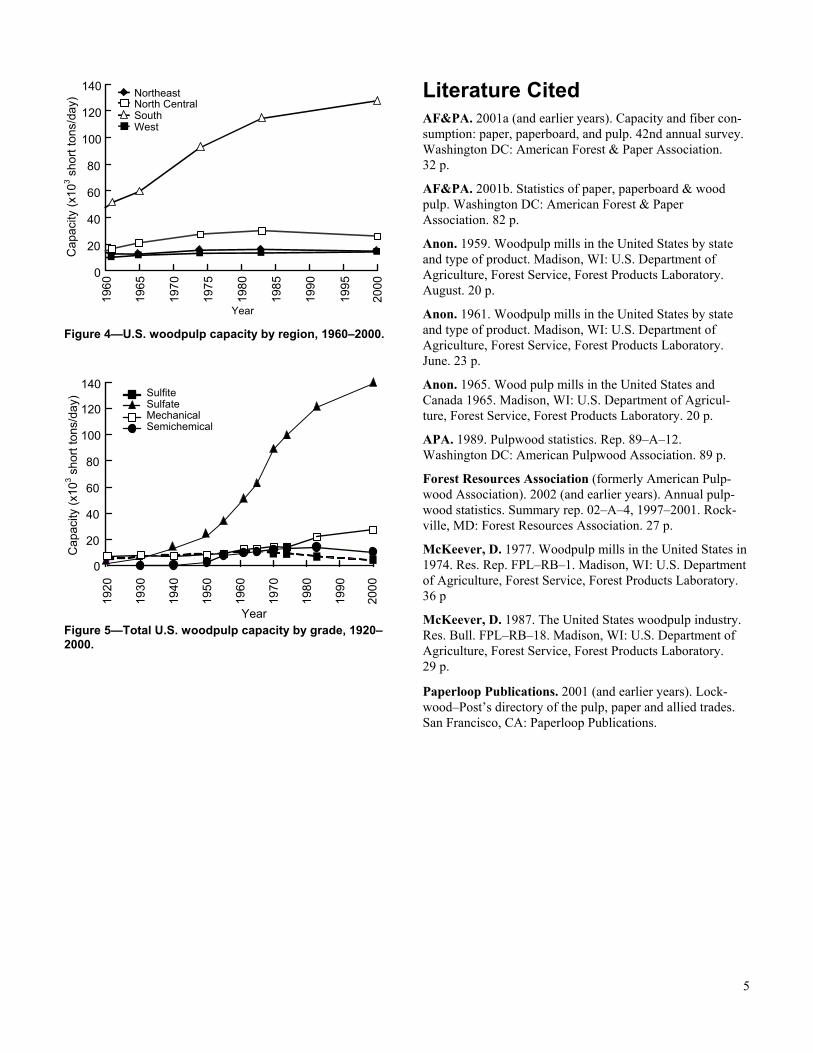
Another change in the woodpulp industry is the shift in capacity towards the South and away from the Northeast, the North Central, and the West regions, as shown by Figure 4 (Paperloop Publications 2001). About 70% of the nation�s capacity to manufacture woodpulp lies in the South, an increase from 55% in 1959. In other regions, woodpulp capacity remained flat or decreased over the same period.
Concluding Remarks After growing at an annual rate of 5.4%/year between 1940 and 1965, woodpulp production in the United States slowed to 2.6%/year between 1965 and 1990 and declined by 11.7% between 1995 and 2001. The strength of the U.S. dollar, soft economic conditions, and the increasing use of recovered paper are among the principal reasons for the decline in both capacity and production. Pulpwood receipts have followed similar trends.
Capacity data for U.S. woodpulp mills are shown in Tables 2 to 5 in the Appendix.
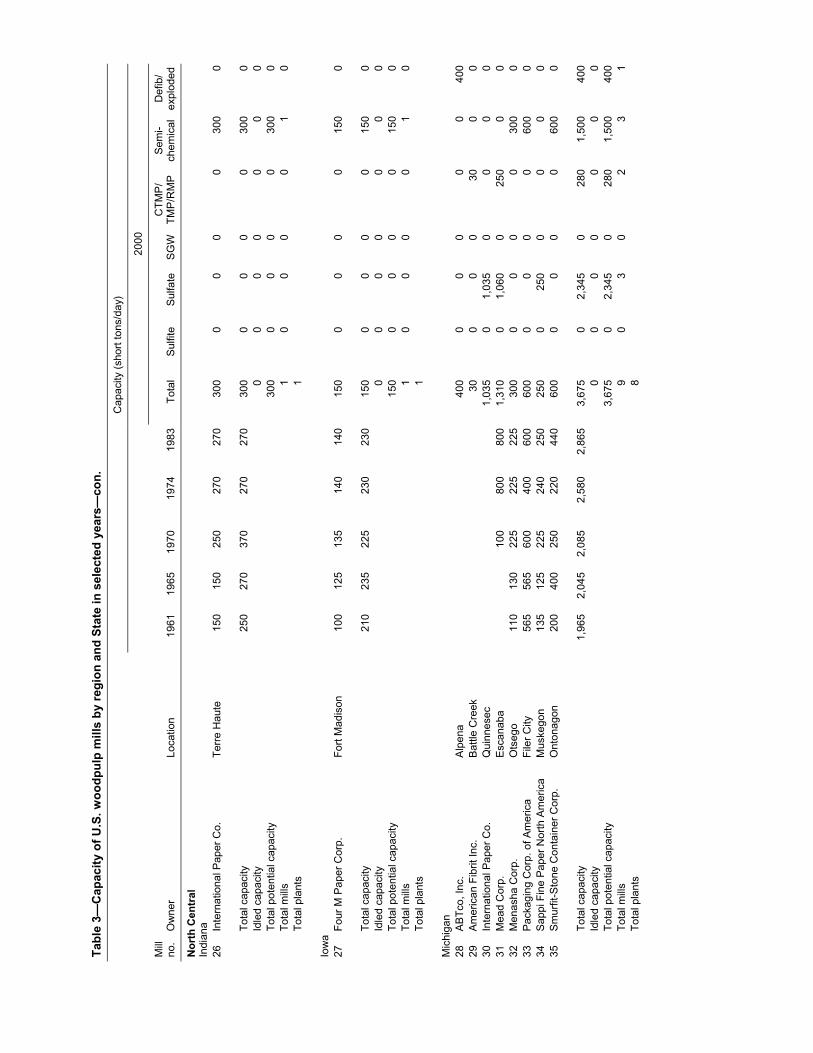
Grade Structure As shown in Figure 5, sulfate (kraft) pulp remains the most extensively produced woodpulp by a wide margin, making up 76% of total U.S. woodpulp manufacturing capacity, an increase of 3% since 1983. Approximately 139,000 TPD of kraft pulp can be produced in the United States by 114 mills, an increase from 121,000 TPD capacity among 122 mills in 1983. This net increase in capacity and loss in total produc-tion facilities means that the average kraft mill could pro-duce 160 more tons per day in 2000 than in 1983 (Table 1).
The period from 1920 to 2000 showed the effects of industry consolidation, shifts in pulp preferences, and industry reloca-tion. The number of mills producing pulp declined steadily while the average mill capacity increased.
Kraft pulp, which constituted about 16% of production in 1920, now accounts for about 76% of total production. Moreover, from 1920 to 2000, the average mill capacity for sulfate mills increased from 47 to 1,220 short tons/day. Capacity for semichemical pulp reversed its previous growth
trend and declined between 1983 and 2000. Semichemical capacity decreased by approximately 4,000 TPD (to 10,440 TPD), while the size of an average mill climbed considera-bly over that in 1983 (454 TPD). Mechanical pulp capacity increased by about 6,500 TPD (to 28,521 TPD, Table 5).
Relocation has also been an important factor. Although all regions were producing more pulp in 2000 than in 1960, the manufacture of pulp has become increasingly dominated by the Southern region and the percentage of the total produced by all other regions has declined.
4
Literature Cited
Figure 4�U.S. woodpulp capacity by region, 1960�2000.
20
40
60
80
100
120
140
0
1960
1965
1970
1975
1980
1985
1990
1995
2000
Year
Cap
acity
(x10
3 sho
rt to
ns/d
ay) Northeast
North Central South West
0
20
40
60
80
100
120 140
SulfiteSulfateMechanicalSemichemical
1920
1930
1940
1950
1960
1970
1980
1990
2000
Cap
acity
(x10
3 sho
rt to
ns/d
ay)
Year
AF&PA. 2001a (and earlier years). Capacity and fiber con-sumption: paper, paperboard, and pulp. 42nd annual survey. Washington DC: American Forest & Paper Association. 32 p.
AF&PA. 2001b. Statistics of paper, paperboard & wood pulp. Washington DC: American Forest & Paper Association. 82 p.
Anon. 1959. Woodpulp mills in the United States by state and type of product. Madison, WI: U.S. Department of Agriculture, Forest Service, Forest Products Laboratory. August. 20 p.
Anon. 1961. Woodpulp mills in the United States by state and type of product. Madison, WI: U.S. Department of Agriculture, Forest Service, Forest Products Laboratory. June. 23 p.
Anon. 1965. Wood pulp mills in the United States and Canada 1965. Madison, WI: U.S. Department of Agricul-ture, Forest Service, Forest Products Laboratory. 20 p.
APA. 1989. Pulpwood statistics. Rep. 89�A�12. Washington DC: American Pulpwood Association. 89 p.
Forest Resources Association (formerly American Pulp-wood Association). 2002 (and earlier years). Annual pulp-wood statistics. Summary rep. 02�A�4, 1997�2001. Rock-ville, MD: Forest Resources Association. 27 p.
McKeever, D. 1977. Woodpulp mills in the United States in 1974. Res. Rep. FPL�RB�1. Madison, WI: U.S. Department of Agriculture, Forest Service, Forest Products Laboratory. 36 p
McKeever, D. 1987. The United States woodpulp industry. Res. Bull. FPL�RB�18. Madison, WI: U.S. Department of Agriculture, Forest Service, Forest Products Laboratory. 29 p.
Figure 5�Total U.S. woodpulp capacity by grade, 1920�2000.
Paperloop Publications. 2001 (and earlier years). Lock-wood�Post�s directory of the pulp, paper and allied trades. San Francisco, CA: Paperloop Publications.
5

Appendix�Capacity Data Forest Service regions are defined in Figure 6.
Figure 6�Forest Service Regions.
Northeast�Connecticut, Maine, Massachusetts, New Hampshire, New Jersey, New York, Pennsylvania, Rhode Island, Vermont.
North Central�Illinois, Indiana, Iowa, Kansas, Michigan, Minnesota, Missouri, Nebraska, North Dakota, Ohio, South Dakota, Wisconsin.
South�Alabama, Arkansas, Delaware, Florida, Georgia, Kentucky, Louisiana, Maryland, Mississippi, North Caro-lina, Oklahoma, South Carolina, Tennessee, Texas, Virginia, West Virginia.
West�Alaska, Arizona, California, Colorado, Hawaii, Idaho, Montana, Nevada, New Mexico, Oregon, Utah, Washington, Wyoming.
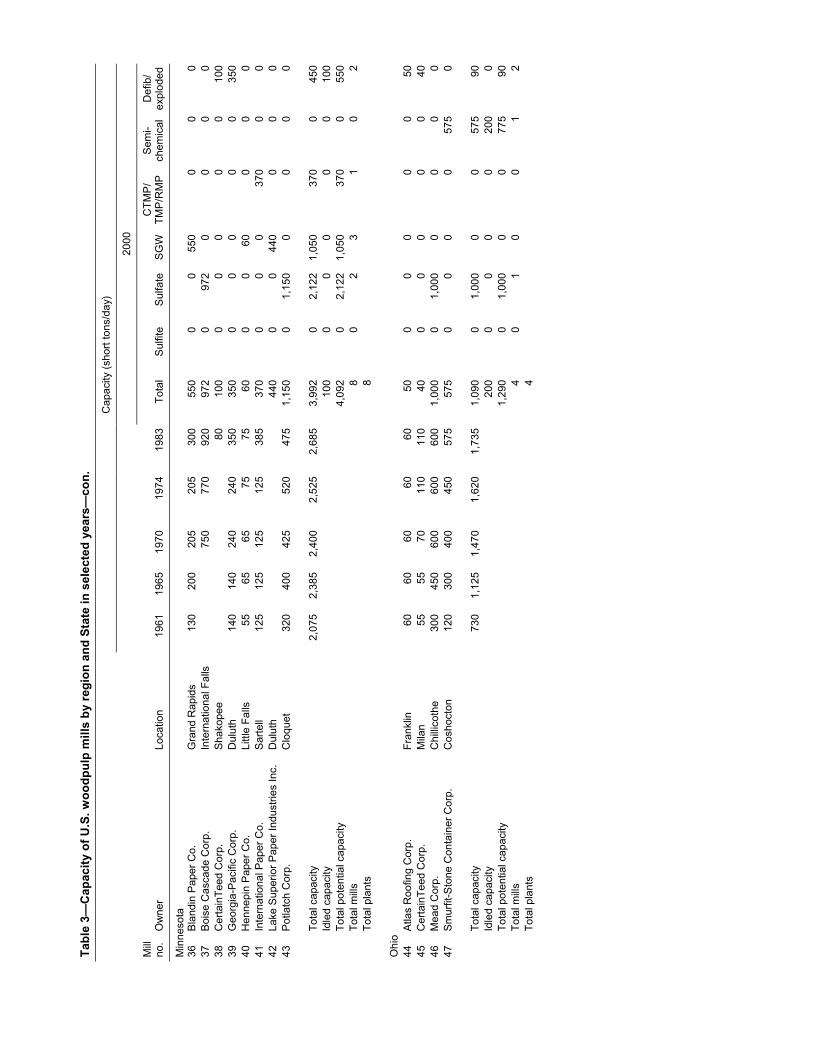
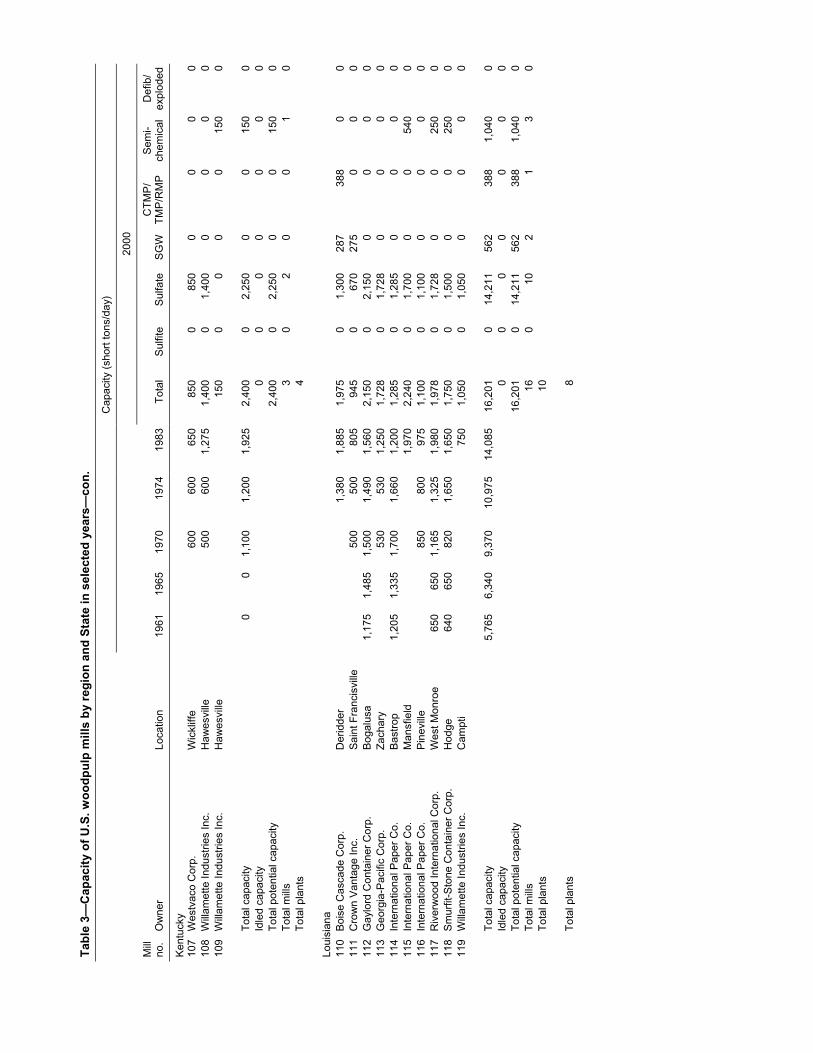
Capacity data for U.S. woodpulp mills are shown in Tables 2 to 5. Table 2 is a general summary of capacity data by Forest Service region, State, and type of mill as of the year 2000. Capacity data for specific mills by region, State, and type of mill for selected years are given in Table 3. Table 3 also includes total capacity, idled capacity, total potential capac-ity, total number of mills, and total number of plants for each State. Table 4 is a historical summary of regional capacity since 1959, and Table 5 summarizes capacity by grade since 1920.
6

Tabl
e 2�
Sum
mar
y of
woo
dpul
p m
ills
in th
e U
.S. b
y re
gion
and
sta
te, t
ype
of m
ill, a
nd c
apac
ity (s
hort
tons
/day
)�20
00
To
tal
Sulfi
te
Sulfa
te
SGW
TM
P/R
MP
Sem
i-che
mic
al
Def
ib./e
xplo
ded
Stat
e an
d re
gion
M
ills
Cap
acity
M
ills
Cap
acity
M
ills
Cap
acity
Mills
C
apac
ity
M
ills
Cap
acity
Mills
C
apac
ityM
ills
Cap
acity
Nor
thea
st
Mai
ne
16
8,79
61
539
6 4,
710
5 1,
420
65
6 0
0 0
0 la
nd
1 1
0 0
0 0
2 1
1 26
0 0
0 6
1 0
0 0
0 1
550
vani
a 5
4 0
0 1
700
30
13
4 65
6 1
260
2
1
0 1
300
0 0
1
0 1
150
0 0
9 3,
675
0 0
3 2,
345
0 0
2 28
0 3
1,50
0 1
400
8 3,
992
0 0
2 2,
122
3 1,
050
1 37
0 0
0 2
450
4 1
1 57
5 2
90
19
4 1
1,10
0 3
330
42
4 85
0 10
7
8
18
19
,913
0 0
12
17,4
950
0 3
2 1
48
9 6
0 0
2 42
0 5
6,73
81
473
4 6,
265
0 0
0 0
0 0
0 0
13
20,8
590
0 11
18
,334
0 0
1 1
525
0 0
3
2 1
150
0 0
16
16,2
010
0 10
14
,211
2 56
2 1
388
3 0
0 8
9,59
50
0 6
7,60
00
0 1
895
0 0
1 1,
100
11
8,63
50
0 5
7,29
00
0 2
300
1 25
0 3
795
3 1
1 50
0 1
50
Car
olin
a 10
6
2 1,
525
1 30
0 1
360
6 4,
875
0 0
3 3,
250
0 0
1 1,
100
1 40
0 1
125
8 7,
580
0 0
5 5,
830
1 80
0 1
450
0 0
1 50
0 8
9,52
10
0 3
6,61
11
400
1 88
0 2
1,30
0 1
330
118
127,
584
1 5
13
13
12
2 0
0 0
15
0 1
60
0 0
0 0
4 2
0 0
2 40
0 1
1 0
0 0
0 1
1 0
0 0
0 16
8,
100
0 0
7 5,
355
0 0
3 1,
235
1 40
0 5
1,11
0 17
6
0 0
1 34
0 0
0 41
26
,029
5 17
16
,814
1 15
0 9
2 74
0 7
231
182,
440
13
114
139,
062
20
32
23
29
4M
ary
882
0 0
882
0 0
0 0
New
Ham
pshi
re
rk
610
0 0
350
0 0
0 0
New
Yo
2,02
02
470
530
2 47
0 Pe
nnsy
l2,
330
0 0
2,23
00
0 0
0 To
tal
14,6
383
1,00
9 8,
702
7 1,
890
1,25
0 N
orth
Cen
tral
In
dian
a
30
00
0 0
0 0
0 0
Iow
a15
00
0 0
0 0
0 0
Mic
higa
n M
inne
sota
O
hio
1,09
00
0 1,
000
0 0
0 0
Wis
cons
in
4,98
24
850
2,14
54
693
3 57
4 To
tal
14,1
897,
612
7 1,
743
6 1,
224
3,62
5 1,
270
Sout
h
Al
abam
a 1,
020
1,35
0 Ar
kans
as
7,63
40
0 5,
900
1 0
0 0
Flor
ida
Geo
rgia
2,
000
Kent
ucky
2,40
00
0 2,
250
0 0
0 0
Loui
sian
a 1,
040
Mis
siss
ippi
N
orth
Car
olin
a O
klah
oma
2,20
00
0 1,
650
0 0
0 0
Sout
h 11
,433
0 0
9,24
80
0 Te
nnes
see
Texa
s Vi
rgin
ia
Tota
l 47
3 74
10
5,93
4
1,76
2 8,
558
5,81
5 3,
728
Wes
t
Ariz
ona
210
01
Cal
iforn
ia
Idah
o 1,
350
0 0
950
0 0
0 0
1,30
00
0 1,
300
0 0
0 0
Mon
tana
1,
800
0 0
1,80
00
0 0
0 O
rego
n W
ashi
ngto
n 13
,269
5 2,
035
7,40
95
3,48
5 To
tal
2,03
5 4,
780
1,51
0 U
.S. T
otal
4,
367
5,54
5 15
,218
10
,440
7,
758

Tabl
e 3�
Cap
acity
of U
.S. w
oodp
ulp
mill
s by
regi
on a
nd S
tate
in s
elec
ted
year
s
C
apac
ity (s
hort
tons
/day
)
2000
Mill
no.
Ow
ner
Loca
tion
1961
1965
1970
1974
1983
To
tal
Sulfi
teSu
lfate
SGW
CTM
P/
TMP/
RM
P Se
mi-
chem
ical
Def
ib/
expl
oded
Nor
thea
st
M
aine
T
land
0
T
0
0
0
T
0
1 Ea
ster
n Pa
per C
o, In
c.
Linc
oln
175
195
210
340
340
440
044
00
00
0 2
Geo
rgia
-Pac
ific
Cor
p.
Old
Tow
n 28
035
055
055
060
0 60
00
600
00
00
3 G
eorg
ia-P
acifi
c C
orp.
W
oodl
and
510
510
950
1,04
01,
040
1,40
00
1,40
00
00
04
Gre
at N
orth
ern
Pape
r, In
c.
East
Milli
nock
et
880
970
920
920
725
600
00
600
00
0 5
Gre
at N
orth
ern
Pape
r, In
c.
Milli
nock
et
1,13
51,
225
1,20
01,
350
1,48
5 64
553
90
010
60
0 6
Inte
rnat
iona
l Pap
er C
o.
Buck
spor
t 32
032
527
533
045
0 60
00
035
025
00
0 7
Inte
rnat
iona
l Pap
er C
o.
Jay
675
775
1,39
0 1,
471
0un
k.un
k.0
00
8 M
adis
on P
aper
Indu
strie
s M
adis
on
7017
017
017
030
0 28
00
028
00
00
9 M
ason
ite C
orp.
Li
bson
Fal
ls
100
100
100
100
100
135
00
013
50
0 10
M
ead
Cor
p.
Rum
ford
59
060
067
067
093
5 1,
525
01,
170
190
165
00
11
Sapp
i Fin
e Pa
per N
orth
Am
eric
a H
inck
ley
90
0 1,
100
01,
100
00
00
Tota
l cap
acity
5,87
56,
225
7,02
07,
365
8,83
5 8,
796
539
4,71
01,
420
656
00
Id
led
capa
city
1,00
00
300
375
325
00
To
tal p
oten
tial c
apac
ity
9,79
653
95,
010
1,79
598
10
0 ot
al m
ills
161
65
40
0
Tota
l pla
nts
11
Mar
y
12
Wes
tvac
o C
orp.
Lu
ke
60
068
074
572
079
5 88
20
882
00
00
Tota
l cap
acity
630
780
845
820
845
882
088
20
00
0
Idle
d ca
paci
ty0
00
00
0
Tota
l pot
entia
l cap
acity
88
20
882
00
00
otal
mills
1
01
00
0
Tota
l pla
nts
1
New
Ham
pshi
re
13
G
rove
ton
Pape
r Boa
rd In
c.
Gro
veto
n 30
033
043
030
030
0 26
00
00
026
00
14
Pulp
and
Pap
er o
f Am
eric
a Be
rlin
87
545
085
095
01,
050
350
035
00
00
0
To
tal c
apac
ity1,
265
870
1,38
01,
250
1,35
0 61
00
350
00
260
Id
led
capa
city
00
00
00
To
tal p
oten
tial c
apac
ity
610
035
00
026
00
otal
mills
2
01
00
1
Tota
l pla
nts
2

Tabl
e 3�
Cap
acity
of U
.S. w
oodp
ulp
mill
s by
regi
on a
nd S
tate
in s
elec
ted
year
s�co
n.
Cap
acity
( sho
rt to
ns/d
ay)
20
00
Mill
no.
Ow
ner
Loca
tion
1961
1965
1970
1974
1983
To
tal
Sulfi
teSu
lfate
SGW
CTM
P/
TMP/
RM
P Se
mi-
chem
ical
Def
ib/
expl
oded
New
Yor
k
15
Def
erie
t Pap
er C
o.
Def
erie
t 32
032
037
524
031
0 31
00
031
00
00
16
Fitc
h, P
ruyn
, & C
o., I
nc.
Gle
ns F
alls
20
012
025
025
035
0 35
035
00
00
00
17
Inte
rnat
iona
l Pap
er C
o.
Cor
inth
23
025
525
516
0 16
00
016
00
00
18
Inte
rnat
iona
l Pap
er C
o.
Tico
nder
oga
125
155
190
590
530
530
053
00
00
0 19
Ly
ons
Falls
Pul
p &
Pape
r Inc
. Ly
ons
Falls
13
518
012
012
012
0 12
012
00
00
00
20
Nor
boar
d In
dust
ries
Inc.
D
epos
it
150
100
100
100
550
00
00
055
0
550
0
T
1
vani
a
70
0
0
T
1
1,25
0
Tota
l cap
acity
2,51
01,
830
1,98
02,
120
1,80
0 2,
020
470
530
470
00
Id
led
capa
city
500
00
500
To
tal p
oten
tial c
apac
ity
2,07
047
053
047
050
055
0 ot
al m
ills
62
12
00
To
tal p
lant
s 6
Pe
nnsy
l
21
Appl
eton
Pap
ers
Inc.
R
oarin
g Sp
ring
110
175
180
180
190
200
020
00
00
0 22
In
tern
atio
nal P
aper
Co.
Er
ie
250
400
375
640
640
800
080
00
00
0 23
M
ason
ite C
orp.
To
wan
da
500
600
700
00
00
070
0 24
P.
H. G
latfe
lter C
o.
Sprin
g G
rove
19
024
550
050
050
0 63
00
630
00
00
25
Willa
met
te In
dust
ries
Inc.
Jo
hnso
nbur
g
235
260
270
190
180
600
060
00
00
0
To
tal c
apac
ity1,
610
1,86
52,
245
2,66
52,
840
2,33
00
2,23
00
00
Id
led
capa
city
225
00
00
225
To
tal p
oten
tial c
apac
ity
2,55
50
2,23
00
022
570
0 ot
al m
ills
50
40
00
To
tal p
lant
s 5
Nor
thea
st R
egio
n To
tal c
apac
ity
11
,890
11,5
7013
,470
14,2
2015
,670
14
,638
1,00
98,
702
1,89
065
626
01,
250
N
orth
east
Reg
ion
Idle
d ca
paci
ty
2,15
70
1,18
237
537
522
50
N
orth
east
Reg
ion
Tota
l pot
entia
l ca
paci
ty
16,7
951,
009
9,88
42,
265
1,03
148
5
N
orth
east
Reg
ion
Tota
l mills
30
313
74
12
N
orth
east
Reg
ion
Tota
l pla
nts
25
Tabl
e 3�
Cap
acity
of U
.S. w
oodp
ulp
mill
s by
regi
on a
nd S
tate
in s
elec
ted
year
s�co
n.
Cap
acity
(sho
rt to
ns/d
ay)
20
00
Mill
no.
Ow
ner
Loca
tion
1961
1965
1970
1974
1983
To
tal
Sulfi
teSu
lfate
SGW
CTM
P/
TMP/
RM
P Se
mi-
chem
ical
Def
ib/
expl
oded
Nor
th C
entr
al
In
dian
a
0
0
T
0
0
0
T
0
Mic
higa
n
0
0
40
0
0
T
1
26
Inte
rnat
iona
l Pap
er C
o.
Terre
Hau
te
15
015
025
027
027
0 30
00
00
030
00
Tota
l cap
acity
250
270
370
270
270
300
00
00
300
Id
led
capa
city
00
00
00
To
tal p
oten
tial c
apac
ity
300
00
00
300
0 ot
al m
ills
10
00
01
To
tal p
lant
s 1
Io
wa
27
Fo
ur M
Pap
er C
orp.
Fo
rt M
adis
on
10
012
513
514
014
0 15
00
00
015
00
Tota
l cap
acity
210
235
225
230
230
150
00
00
150
Id
led
capa
city
00
00
00
To
tal p
oten
tial c
apac
ity
150
00
00
150
0 ot
al m
ills
10
00
01
To
tal p
lant
s 1
28
AB
Tco,
Inc.
Al
pena
40
00
00
040
0 29
Am
eric
an F
ibrit
Inc.
Ba
ttle
Cre
ek
30
00
030
00
30
Inte
rnat
iona
l Pap
er C
o.
Qui
nnes
ec
1,
035
01,
035
00
00
31
Mea
d C
orp.
Es
cana
ba
100
800
800
1,31
00
1,06
00
250
00
32
Men
asha
Cor
p.
Ots
ego
110
130
225
225
225
300
00
00
300
33
Pack
agin
g C
orp.
of A
mer
ica
File
r City
56
556
560
040
060
0 60
00
00
060
00
34
Sapp
i Fin
e Pa
per N
orth
Am
eric
a M
uske
gon
135
125
225
240
250
250
025
00
00
0 35
Sm
urfit
-Sto
ne C
onta
iner
Cor
p.
Ont
onag
on
20
040
025
022
044
0 60
00
00
060
00
Tota
l cap
acity
1,96
52,
045
2,08
52,
580
2,86
5 3,
675
02,
345
028
01,
500
Id
led
capa
city
00
00
00
To
tal p
oten
tial c
apac
ity
3,67
50
2,34
50
280
1,50
040
0 ot
al m
ills
90
30
23
To
tal p
lant
s 8
Tabl
e 3�
Cap
acity
of U
.S. w
oodp
ulp
mill
s by
regi
on a
nd S
tate
in s
elec
ted
year
s�co
n.
Cap
acity
( sho
rt to
ns/d
ay)
20
00
Mill
no.
Ow
ner
Loca
tion
1961
1965
1970
1974
1983
To
tal
Sulfi
teSu
lfate
SGW
CTM
P/
TMP/
RM
P Se
mi-
chem
ical
Def
ib/
expl
oded
Min
neso
ta
36
Bl
andi
n Pa
per C
o.
Gra
nd R
apid
s 13
020
020
520
530
0 55
00
055
00
00
37
Bois
e C
asca
de C
orp.
In
tern
atio
nal F
alls
75
077
092
0 97
20
972
00
00
38
Cer
tain
Teed
Cor
p.
Shak
opee
80
10
00
00
00
100
39
Geo
rgia
-Pac
ific
Cor
p.
Dul
uth
140
140
240
240
350
350
00
00
035
0 40
H
enne
pin
Pape
r Co.
Li
ttle
Falls
55
6565
7575
60
00
600
00
41
Inte
rnat
iona
l Pap
er C
o.
Sarte
ll 12
512
512
512
538
5 37
00
00
370
00
42
Lake
Sup
erio
r Pap
er In
dust
ries
Inc.
D
ulut
h
440
00
440
00
0 43
Po
tlatc
h C
orp.
C
loqu
et
32
040
042
552
047
5 1,
150
01,
150
00
00
45
0
100
T
2
90
0
T
2
Tota
l cap
acity
2,07
52,
385
2,40
02,
525
2,68
5 3,
992
02,
122
1,05
037
00
Id
led
capa
city
100
00
00
0
Tota
l pot
entia
l cap
acity
4,
092
02,
122
1,05
037
00
550
otal
mills
8
02
31
0
Tota
l pla
nts
8
Ohi
o
44
At
las
Roo
fing
Cor
p.
Fran
klin
60
6060
6060
50
00
00
050
45
C
erta
inTe
ed C
orp.
M
ilan
5555
7011
011
0 40
00
00
040
46
M
ead
Cor
p.
Chi
llicot
he
300
450
600
600
600
1,00
00
1,00
00
00
047
Sm
urfit
-Sto
ne C
onta
iner
Cor
p.
Cos
hoct
on
12
030
040
045
057
5 57
50
00
057
50
Tota
l cap
acity
730
1,12
51,
470
1,62
01,
735
1,09
00
1,00
00
057
5
Idle
d ca
paci
ty20
00
00
020
0
Tota
l pot
entia
l cap
acity
1,
290
01,
000
00
775
90
otal
mills
4
01
00
1
Tota
l pla
nts
4

Tabl
e 3�
Cap
acity
of U
.S. w
oodp
ulp
mill
s by
regi
on a
nd S
tate
in s
elec
ted
year
s�co
n.
Cap
acity
( sho
rt to
ns/d
ay)
20
00
Mill
no.
Ow
ner
Loca
tion
1961
1965
1970
1974
1983
To
tal
Sulfi
teSu
lfate
SGW
CTM
P/
TMP/
RM
P Se
mi-
chem
ical
Def
ib/
expl
oded
Wis
cons
in
48
Ap
plet
on C
oate
d L.
L.C
. C
ombi
ned
Lock
s 50
5017
520
020
0 10
00
00
100
00
49
Fras
er P
aper
s In
c.
Park
Fal
ls
100
115
115
115
110
150
150
00
00
0 50
G
eorg
ia-P
acifi
c C
orp.
N
ekoo
sa
250
290
310
310
335
430
043
00
00
0
52
G.
750
1,04
5
64
Wey
0
330
0
T
1,37
0
51
Geo
rgia
-Pac
ific
Cor
p.
Port
Edw
ards
12
016
021
521
523
5 24
024
00
00
00
eorg
ia-P
acifi
c C
orp
Philli
ps
4040
4040
40
900
00
00
90
53
Geo
rgia
-Pac
ific
Cor
p.
Supe
rior
180
180
180
140
00
00
014
0 54
G
lobe
Bui
ldin
g M
ater
ials
Inc.
C
orne
ll 50
5050
5010
0 10
00
00
00
100
55
Inte
r Lak
e Pa
pers
, Inc
. Ki
mbe
rly
280
280
150
115
180
145
00
145
00
0 56
In
tern
atio
nal P
aper
Co.
Ka
ukau
na
250
300
375
400
400
420
042
00
00
0 57
Pa
ckag
ing
Cor
p. o
f Am
eric
a To
mah
awk
360
475
615
620
1,00
0 1,
100
00
00
1,10
00
58
Stor
a En
so N
orth
Am
eric
a N
iaga
ra
245
275
150
150
210
350
00
350
00
0 59
St
ora
Enso
Nor
th A
mer
ica
Stev
ens
Poin
t 45
9010
010
023
0 24
50
090
155
00
60
Stor
a En
so N
orth
Am
eric
a W
isco
nsin
Rap
idsa
42
80
010
832
00
0 61
St
ora
Enso
Nor
th A
mer
ica
Wis
cons
in R
apid
sa 31
054
565
562
50
1,04
50
00
062
W
ausa
u-M
osin
ee P
aper
Cor
p.
Brok
aw
100
145
145
140
185
260
260
00
00
0 63
W
ausa
u-M
osin
ee P
aper
Cor
p.
Mos
inee
16
520
020
017
521
0 25
00
250
00
00
erha
euse
r Co.
R
oths
child
155
170
190
200
200
200
200
00
00
Tota
l cap
acity
4,18
04,
810
5,01
54,
875
5,40
5 4,
982
850
2,14
569
357
41,
100
Id
led
capa
city
00
00
00
To
tal p
oten
tial c
apac
ity
4,98
285
02,
145
693
574
1,10
033
0 ot
al m
ills
194
44
31
3
Tota
l pla
nts
17
a Wis
cons
in R
apid
s kr
aft a
nd m
echa
nica
l pul
p m
ills h
isto
rical
ly c
ombi
ned
in o
ne p
lant
N
orth
Cen
tral R
egio
n To
tal c
apac
ity
9,
410
10,8
7011
,565
12,1
0013
,190
14
,189
850
7,61
21,
743
1,22
43,
625
1,27
0
Nor
th C
entra
l Reg
ion
Idle
d ca
paci
ty
300
00
00
200
100
N
orth
Cen
tral R
egio
n To
tal p
oten
tial
capa
city
:
14
,489
850
7,61
21,
743
1,22
43,
825
N
orth
Cen
tral R
egio
n To
tal m
ills:
424
107
67
8
Nor
th C
entra
l Reg
ion
Tota
l pla
nts:
39

C
apac
ity
Tabl
e 3�
Cap
acity
of U
.S. w
oodp
ulp
mill
s by
regi
on a
nd S
tate
in s
elec
ted
year
s�co
n.
( s
hort
tons
/day
)
20
00
Mill
no.
Ow
ner
Loca
tion
1961
1965
1970
1974
1983
To
tal
Sulfi
teSu
lfate
SGW
CTM
P/
TMP/
RM
P Se
mi-
chem
ical
Def
ib/
expl
oded
Sout
h
Alab
ama
0
nes
960
1,73
0
48
T
1
Arka
nsas
42
0
T
2
65
Alab
ama
Pine
Pul
p C
o., I
nc.
Perd
ue H
ill
1,37
50
1,37
50
00
0 66
Al
abam
a R
iver
New
sprin
t Co.
Pe
rdue
Hill
60
00
00
600
00
67
Alab
ama
Riv
er P
ulp
Co.
, Inc
. Pe
rdue
Hill
1,00
0 1,
265
01,
265
00
00
68
Arm
stro
ng W
orld
Indu
strie
s In
c.
Mob
ile
30
00
00
300
00
69
Bois
e C
asca
de C
orp.
Ja
ckso
n 30
047
050
060
0 80
00
800
00
00
70
GAF
Mat
eria
ls C
orp.
M
obile
480
00
00
48
71
Geo
rgia
-Pac
ific
Cor
p.
Penn
ingt
on
420
490
930
930
1,00
0 1,
100
01,
100
00
00
72
Gul
f Sta
tes
Pape
r Cor
p.
Dem
opol
is
400
400
360
360
500
975
097
50
00
0 73
In
tern
atio
nal P
aper
Co.
C
ourtl
and
500
550
1,30
0 2,
430
02,
430
00
00
74
Inte
rnat
iona
l Pap
er C
o.
Prat
tville
86
087
02,
220
2,52
50
2,52
50
00
0 75
In
tern
atio
nal P
aper
Co.
Se
lma
400
500
1,10
0 1,
375
01,
375
00
00
76
Mea
d C
oate
d Bo
ard
Cot
tont
on
800
1,00
01,
000
2,20
00
2,20
00
00
0 77
M
ead
Con
tain
erbo
ard
Stev
enso
n 57
5 75
00
00
075
078
Sm
urfit
-Sto
ne C
onta
iner
Cor
p.
Brew
ton
300
700
800
900
1,10
0 1,
100
01,
100
00
00
79
U.S
. Allia
nce
Coo
sa P
ines
Cor
p.
Coo
sa P
i1,
005
1,52
51,
525
1,22
00
1,10
00
120
00
80
Wey
erha
euse
r Co.
Pi
ne H
ill
900
1,00
01,
505
1,85
00
1,25
00
060
00
Tota
l cap
acity
4,96
55,
910
11,3
7012
,035
16,6
40
19,9
130
17,4
950
1,02
01,
350
Id
led
capa
city
2,97
50
2,97
50
00
0
Tota
l pot
entia
l cap
acity
22
,888
020
,470
01,
020
1,35
048
ot
al m
ills
180
120
32
To
tal p
lant
s 16
81
G
aylo
rd C
onta
iner
Cor
p.
Pine
Blu
ff n 15
015
020
020
028
0 50
00
500
00
00
82
Geo
rgia
-Pac
ific
Cor
p.
Ashd
ow40
040
01,
285
2,45
00
2,45
00
00
083
G
eorg
ia-P
acifi
c C
orp.
C
ross
ett
655
815
815
1,05
01,
400
1,60
00
1,60
00
00
084
G
eorg
ia-P
acifi
c C
orp.
N
orth
Litt
le R
ock
150
150
170
170
00
00
017
0 85
G
reen
Bay
Pac
kagi
ng In
c.
Mor
rilto
n 30
036
080
0 80
00
800
00
00
86
Inte
rnat
iona
l Pap
er C
o.
Pine
Blu
ff 1,
105
1,30
01,
550
1,62
01,
455
1,31
40
unk.
unk.
00
0 87
Po
tlatc
h C
orp.
M
cgeh
ee
450
550
055
00
00
088
W
illam
ette
Indu
strie
s In
c.
Mal
vern
25
00
00
00
250
Tota
l cap
acity
2,52
52,
890
4,16
54,
530
6,56
5 7,
634
05,
900
00
0
Idle
d ca
paci
ty72
30
723
00
00
To
tal p
oten
tial c
apac
ity
8,35
70
6,62
30
00
420
otal
mills
9
06
10
0
Tota
l pla
nts
8

Tabl
e 3�
Cap
acity
of U
.S. w
oodp
ulp
mill
s by
regi
on a
nd S
tate
in s
elec
ted
year
s�co
n.
Cap
acity
( sho
rt to
ns/d
ay)
20
00
Mill
no.
Ow
ner
Loca
tion
1961
1965
1970
1974
1983
To
tal
Sulfi
teSu
lfate
SGW
CTM
P/
TMP/
RM
P Se
mi-
chem
ical
Def
ib/
expl
oded
Flor
ida
89
Bu
ckey
e Fl
orid
a L.
P.
Perry
88
091
090
090
01,
100
1,20
00
1,20
00
00
0 90
G
eorg
ia-P
acifi
c C
orp.
Pa
latk
a 85
085
095
095
01,
200
1,51
00
1,51
00
00
0
92
Ray
0
T
0
Geo
rgia
104
Ray
106
Wey
0
T
0
91
Inte
rnat
iona
l Pap
er C
o.
Can
tonm
ent
900
1,73
0 1,
355
01,
355
00
00
onie
r Fe
rnan
dina
Bea
ch
350
375
400
420
450
473
473
00
00
93
Smur
fit-S
tone
Con
tain
er C
orp.
Fe
rnan
dina
Bea
ch
65
070
085
01,
700
1,70
0 2,
200
02,
200
00
00
Tota
l cap
acity
8,43
08,
435
8,64
59,
695
11,6
75
6,73
847
36,
265
00
00
Id
led
capa
city
5,80
60
5,80
60
00
0
Tota
l pot
entia
l cap
acity
12
,544
473
12,0
710
00
0 ot
al m
ills
51
40
00
To
tal p
lant
s 5
94
Ar
mst
rong
Wor
ld In
dust
ries
Mac
on
90
00
00
900
00
95
Augu
sta
New
sprin
t Co.
Au
gust
a 30
030
01,
200
1,10
00
00
1,10
00
0 96
D
uran
go G
eorg
ia P
aper
Co.
St
. Mar
ys
800
950
1,00
01,
110
1,22
5 1,
125
01,
125
00
00
97
Geo
rgia
-Pac
ific
Cor
p.
Brun
swic
k 55
01,
120
1,19
01,
550
1,70
0 2,
280
02,
280
00
00
98
Geo
rgia
-Pac
ific
Cor
p.
Ced
ar S
prin
gs
750
2,00
02,
120
2,27
0 2,
825
02,
300
00
525
0 99
In
land
Pap
erbo
ard
& Pa
ckag
ing
Rom
e 76
01,
375
1,50
00
0 2,
350
02,
350
00
00
100
Inte
rnat
iona
l Pap
er C
o.
Augu
sta
475
350
700
800
1,20
0 1,
700
01,
700
00
00
101
Inte
rnat
iona
l Pap
er C
o.
Sava
nnah
2,
575
2,68
02,
900
2,90
03,
000
2,70
00
2,70
00
00
0 10
2 In
ters
tate
Pap
er L
.L.C
. R
iceb
oro
450
525
525
700
070
00
00
0 10
3 Pa
ckag
ing
Cor
p. o
f Am
eric
a Va
ldos
ta
630
760
870
950
900
1,13
00
1,13
00
00
0 on
ier
Jesu
p 67
567
575
01,
200
1,40
0 1,
694
01,
694
00
00
105
Riv
erw
ood
Inte
rnat
iona
l Cor
p.
Mac
on
675
700
825
900
900
1,20
00
1,20
00
00
0 er
haeu
ser
Ogl
etho
rp
75
0 1,
155
01,
155
00
00
Tota
l cap
acity
8,10
510
,475
13,4
5514
,870
18,6
15
20,8
590
18,3
340
2,00
052
5
Idle
d ca
paci
ty1,
690
01,
590
010
00
0
Tota
l pot
entia
l cap
acity
22
,549
019
,924
02,
100
525
0 ot
al m
ills
130
110
11
To
tal p
lant
s 12
Tabl
e 3�
Cap
acity
of U
.S. w
oodp
ulp
mill
s by
regi
on a
nd S
tate
in s
elec
ted
year
s�co
n.
Cap
acity
(sho
rt to
ns/d
ay)
20
00
Mill
no.
Ow
ner
Loca
tion
1961
1965
1970
1974
1983
To
tal
Sulfi
teSu
lfate
SGW
CTM
P/
TMP/
RM
P Se
mi-
chem
ical
Def
ib/
expl
oded
Kent
ucky
107
Wes
tvac
o C
orp.
W
ickl
iffe
600
600
650
850
085
00
00
0
0
0
T
0
Loui
sian
a
0
0
T
0
108
Willa
met
te In
dust
ries
Inc.
H
awes
ville
50
060
01,
275
1,40
00
1,40
00
00
0 10
9 W
illam
ette
Indu
strie
s In
c.
Haw
esvi
lle
150
00
00
150
0
To
tal c
apac
ity0
01,
100
1,20
01,
925
2,40
00
2,25
00
015
0
Idle
d ca
paci
ty0
00
00
0
Tota
l pot
entia
l cap
acity
2,
400
02,
250
00
150
0 ot
al m
ills
30
20
01
To
tal p
lant
s 4
11
0 Bo
ise
Cas
cade
Cor
p.
Der
idde
r 1,
380
1,88
5 1,
975
01,
300
287
388
00
111
Cro
wn
Vant
age
Inc.
Sa
int F
ranc
isvi
lle
500
500
805
945
067
027
50
00
112
Gay
lord
Con
tain
er C
orp.
Bo
galu
sa
1,17
51,
485
1,50
01,
490
1,56
0 2,
150
02,
150
00
00
113
Geo
rgia
-Pac
ific
Cor
p.
Zach
ary
530
530
1,25
0 1,
728
01,
728
00
00
114
Inte
rnat
iona
l Pap
er C
o.
Bast
rop
1,20
51,
335
1,70
01,
660
1,20
0 1,
285
01,
285
00
00
115
Inte
rnat
iona
l Pap
er C
o.
Man
sfie
ld
1,97
0 2,
240
01,
700
00
540
0 11
6 In
tern
atio
nal P
aper
Co.
Pi
nevi
lle
850
800
975
1,10
00
1,10
00
00
0 11
7 R
iver
woo
d In
tern
atio
nal C
orp.
W
est M
onro
e 65
065
01,
165
1,32
51,
980
1,97
80
1,72
80
025
00
118
Smur
fit-S
tone
Con
tain
er C
orp.
H
odge
64
065
082
01,
650
1,65
0 1,
750
01,
500
00
250
0 11
9 W
illam
ette
Indu
strie
s In
c.
Cam
pti
75
0 1,
050
01,
050
00
00
Tota
l cap
acity
5,76
56,
340
9,37
010
,975
14,0
85
16,2
010
14,2
1156
238
81,
040
Id
led
capa
city
00
00
00
To
tal p
oten
tial c
apac
ity
16,2
010
14,2
1156
238
81,
040
0 ot
al m
ills
160
102
13
To
tal p
lant
s 10
Tota
l pla
nts
8

Tabl
e 3�
Cap
acity
of U
.S. w
oodp
ulp
mill
s by
regi
on a
nd S
tate
in s
elec
ted
year
s�co
n.
Cap
acity
( sho
rt to
ns/d
ay)
20
00
Mill
no.
Ow
ner
Loca
tion
1961
1965
1970
1974
1983
To
tal
Sulfi
teSu
lfate
SGW
CTM
P/
TMP/
RM
P Se
mi-
chem
ical
Def
ib/
expl
oded
Mis
siss
ippi
120
Geo
rgia
-Pac
ific
Cor
p.
Mon
ticel
lo
1,62
01,
620
1,70
0 2,
500
02,
500
00
00
127
Wey
0
T
1
137
Wey
79
5
0
T
121
Geo
rgia
-Pac
ific
Cor
p.
New
Aug
usta
1,
000
1,55
00
1,55
00
00
0 12
2 In
tern
atio
nal P
aper
Co.
M
oss
Poin
t 65
066
070
071
566
0 45
00
450
00
00
123
Inte
rnat
iona
l Pap
er C
o.
Nat
chez
90
095
095
01,
000
1,11
0 1,
225
01,
225
00
00
124
Inte
rnat
iona
l Pap
er C
o.
Red
woo
d 1,
200
1,20
01,
200
685
068
50
00
0 12
5 M
ason
ite C
orp.
La
urel
80
01,
200
1,00
01,
000
1,10
0 1,
100
00
00
01,
100
126
New
sprin
t Sou
th In
c.
Gre
nada
675
00
067
50
0 er
haeu
ser C
o.
Col
umbu
s
220
1,41
00
1,19
00
220
00
Tota
l cap
acity
3,09
03,
635
6,00
56,
000
6,48
0 9,
595
07,
600
089
50
1,10
0
Idle
d ca
paci
ty0
00
00
0
Tota
l pot
entia
l cap
acity
9,
595
07,
600
089
50
1,10
0 ot
al m
ills
80
60
10
To
tal p
lant
s 8
N
orth
Car
olin
a
128
ABTc
o, In
c.
Roa
ring
Riv
er
100
330
475
00
00
047
5 12
9 Bl
ue R
idge
Pap
er P
rodu
cts
Inc.
C
anto
n 98
098
01,
290
1,40
01,
390
1,45
00
1,45
00
00
0 13
0 G
AF M
anuf
actu
ring
Cor
p.
Dud
ley
100
100
00
010
00
0 13
1 G
eorg
ia-P
acifi
c C
orp.
C
onw
ay12
020
0 20
00
00
200
00
132
Inte
rnat
iona
l Pap
er C
o.
Rie
gelw
ood
725
960
1,05
01,
100
1,87
5 2,
260
02,
260
00
00
133
Inte
rnat
iona
l Pap
er C
o.
Roa
noke
Rap
ids
750
850
900
830
600
1,43
00
1,43
00
00
0 13
4 In
tern
atio
nal P
aper
Co.
Sp
ring
Hop
e
210
00
00
021
0 13
5 Si
erra
Pain
e Lt
d.
Mon
cure
10
011
0 11
00
00
00
110
136
Wey
erha
euse
r Co.
N
ew B
ern
600
640
725
950
095
00
00
0 er
haeu
ser C
o.
Plym
outh
1,45
01,
500
1,55
01,
600
1,65
5 1,
450
01,
200
00
250
0
To
tal c
apac
ity4,
130
4,56
55,
660
6,16
06,
985
8,63
50
7,29
00
300
250
Id
led
capa
city
00
00
00
To
tal p
oten
tial c
apac
ity
otal
mills
8,
635 11
0 07,
290
0 030
0 225
0 179
5 35
To
tal p
lant
s 10

Tabl
e 3�
Cap
acity
of U
.S. w
oodp
ulp
mill
s by
regi
on a
nd S
tate
in s
elec
ted
year
s�co
n.
Cap
acity
( sho
rt to
ns/d
ay)
2000
Mill
no.
Ow
ner
Loca
tion
1961
1965
1970
1974
1983
To
tal
Sulfi
teSu
lfate
SGW
CTM
P/
TMP/
RM
P Se
mi-
chem
ical
Def
ib/
expl
oded
Okl
ahom
a
138
G-P
Gyp
sum
Cor
p.
Pryo
r 90
4550
5013
9 W
ey1,
800
1,65
0
50
0
1,65
050
0
T
1
00
11
plan
ts
1,41
0 2,
350
1,35
00
1,00
00
0 22
5 0
225
00
0
300
00
600
00
00
1,40
0 30
0 2,
050
7,74
5 0
1,52
536
0
00
0
T
50
500
00 0
00
50
erha
euse
r Cor
p.
Vallia
nt
2,
150
2,15
00
050
00
Tota
l cap
acity
140
9550
02,
300
2,20
0 2,
200
01,
650
00
500
Id
led
capa
city
00
00 0
0 00
To
tal p
oten
tial c
apac
ity
2,20
0 30
50
otal
mills
Tota
l 0
2
Sout
h C
arol
ina
140
Bow
ater
Inc.
C
ataw
ba
400
700
750
1,09
00
141
Geo
rgia
-Pac
ific
Cor
p.
Cat
awba
30
022
50
014
2 G
eorg
ia-P
acifi
c C
orp.
H
olly
Hill
300
00
143
Inte
rnat
iona
l Pap
er C
o.
East
over
2,
083
02,
083
144
Inte
rnat
iona
l Pap
er C
o.
Geo
rget
own
1,99
02,
130
2,23
02,
310
1,50
0 36
0 98
50
985
0 00
00
145
Inte
rnat
iona
l Pap
er C
o.
Mar
ion
360
00
00
360
146
Smur
fit-S
tone
Con
tain
er C
orp.
Fl
oren
ce
460
600
660
1,53
00
1,53
00
00
0 14
7 So
noco
Pro
duct
s C
o.
Har
tsvi
lle
700
375
400
400
300
00
00
300
0 14
8 W
estv
aco
Cor
p.
Nor
th C
harle
ston
1,
550
1,60
02,
000
2,00
02,
300
02,
300
0 00 0
00
149
Willa
met
te In
dust
ries
Inc.
Be
nnet
tsvi
lle
1,
000
01,
000
00
Tota
l cap
acity
4,84
05,
465
6,48
07,
260
11,4
330
9,24
830
0
Idle
d ca
paci
ty0
00
0
Tota
l pot
entia
l cap
acity
11
,433
09,
248
01,
525
300
360
otal
mills
10
06
02
11
To
tal p
lant
s 10

Tabl
e 3�
Cap
acity
of U
.S. w
oodp
ulp
mill
s by
regi
on a
nd S
tate
in s
elec
ted
year
s�co
n.
Cap
acity
( sho
rt to
ns/d
ay)
20
00
Mill
no.
Ow
1983
To
tal
Sulfi
teSu
lfate
SGW
CTM
P/
TMP/
RM
P ne
r Lo
catio
n 19
6119
6519
7019
74Se
mi-
chem
ical
Def
ib/
expl
oded
Tenn
esse
e
150
Bow
ater
New
sprin
t C
alho
un
1,37
51,
475
1,47
51,
200
2,55
0 2,
100
1,00
00
1,10
00
40
00
00
400
1,95
01,
950
0
250
300
3,
180
125
0
T
1
1,20
0 80
00
01,
775
045
00
0 1,
150
1,15
01,
215
1,78
5D
ibol
l 13
00
00
050
0
1,85
01,
850
00
00
5,
470
500
0
T
1
00
151
Inla
nd P
aper
boar
d &
Pack
agin
g In
c.
New
Joh
nson
ville
39
539
539
5 0
0 0 15
2 Pa
ckag
ing
Cor
p. o
f Am
eric
a C
ounc
e 50
065
070
070
01,
500
00
015
3 Ta
mko
Roo
fing
Prod
ucts
, Inc
. Kn
oxvi
lle
120
125
300
0 00
0 00 0
0 012
5 0 15
4 W
illam
ette
Indu
strie
s In
c.
King
spor
t
240
225
250
250
Tota
l cap
acity
2,38
02,
700
3,22
05,
385
4,87
50
3,25
00
1,10
040
0
Idle
d ca
paci
ty67
50
045
00
225
To
tal p
oten
tial c
apac
ity
5,55
00
3,25
045
01,
100
625
125
otal
mills
6
03
01
1
Tota
l pla
nts
5
Texa
s
0 15
5 Ab
itibi
-Con
solid
ated
Inc.
Lu
fkin
1,
250
1,25
01,
200
1,20
01,
345
0 054
550
015
6 Ab
itibi
-Con
solid
ated
Inc.
Sh
eldo
n 95
095
01,
000
950
157
Inla
nd P
aper
boar
d &
Pack
agin
g In
c.
Ora
nge
1,00
01,
150
00 0
0 00 0
0 0 15
8 In
tern
atio
nal P
aper
Co.
D
omin
o 61
01,
785
500
500
015
9 Te
mpl
e-In
land
For
est P
rodu
cts
Cor
p.
130
180
300
0
160
Wes
tvac
o C
orp.
Ev
adal
e
425
770
1,20
01,
250
1,52
0 0
Tota
l cap
acity
2,59
03,
005
6,20
58,
175
7,58
00
5,83
080
045
00
Id
led
capa
city
925
087
550
00
To
tal p
oten
tial c
apac
ity
8,50
50
6,70
585
045
00
500
otal
mills
8
05
11
0
Tota
l pla
nts
6
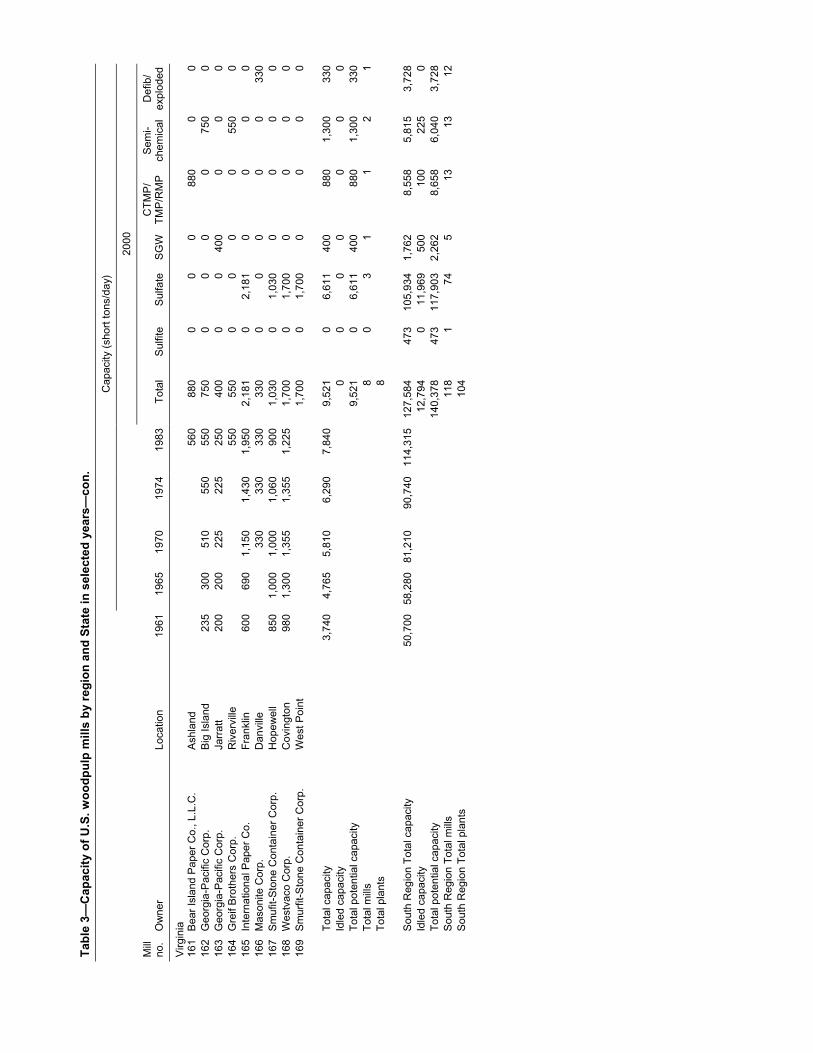
Tabl
e 3�
Cap
acity
of U
.S. w
oodp
ulp
mill
s by
regi
on a
nd S
tate
in s
elec
ted
year
s�co
n.
Cap
acity
( sho
rt to
ns/d
ay)
20
00
Mill
no.
Ow
ner
Loca
tion
1961
1965
1970
1974
1983
To
tal
Sulfi
teSu
lfate
SGW
CTM
P/
TMP/
RM
P Se
mi-
chem
ical
Def
ib/
expl
oded
Virg
inia
161
Bear
Isla
nd P
aper
Co.
, L.L
.C.
Ashl
and
560
880
00
023
530
055
075
022
540
040
0
1,43
02,
181
330
330
00
085
01,
000
1,06
01,
030
01,
030
098
01,
300
1,22
5 1,
700
01,
700
0
1,70
00
4,76
533
0
0
T
1
127,
584
473
0
880
00
162
Geo
rgia
-Pac
ific
Cor
p.
Big
Isla
nd
510
225
550
0 00 0
00 0
750 0
0 16
3 G
eorg
ia-P
acifi
c C
orp.
Ja
rratt
200
200
250
0 16
4 G
reif
Brot
hers
Cor
p.
Riv
ervi
lle
550
550
2,18
10 0
00 0
055
00
165
Inte
rnat
iona
l Pap
er C
o.
Fran
klin
60
069
01,
150
1,95
0 0
00
166
Mas
onite
Cor
p.
Dan
ville
33
033
0 90
0 0
033
0 16
7 Sm
ufit-
Ston
e C
onta
iner
Cor
p.
Hop
ewel
l 1,
000
00 0
0 016
8 W
estv
aco
Cor
p.
Smur
fit-S
tone
Con
tain
er C
orp.
C
ovin
gton
W
est P
oint
1,
355
1,35
50 0
169
0
1,70
00
0
To
tal c
apac
ity3,
740
5,81
06,
290
7,84
0 9,
521
06,
611
400
880
1,30
0
Idle
d ca
paci
ty0
00
00
0
Tota
l pot
entia
l cap
acity
9,
521
06,
611
400
880
1,30
033
0 ot
al m
ills
80
31
12
To
tal p
lant
s 8
Sout
h R
egio
n To
tal c
apac
ity
50,7
0058
,280
81,2
1090
,740
114,
315
105,
934
1,76
28,
558
5,81
53,
728
Id
led
capa
city
12,7
940
11,9
6950
010
022
5
Tota
l pot
entia
l cap
acity
14
0,37
847
311
7,90
32,
262
8,65
86,
040
3,72
8
Sout
h R
egio
n To
tal m
ills
118
104
174
513
1312
Sout
h R
egio
n To
tal p
lant
s
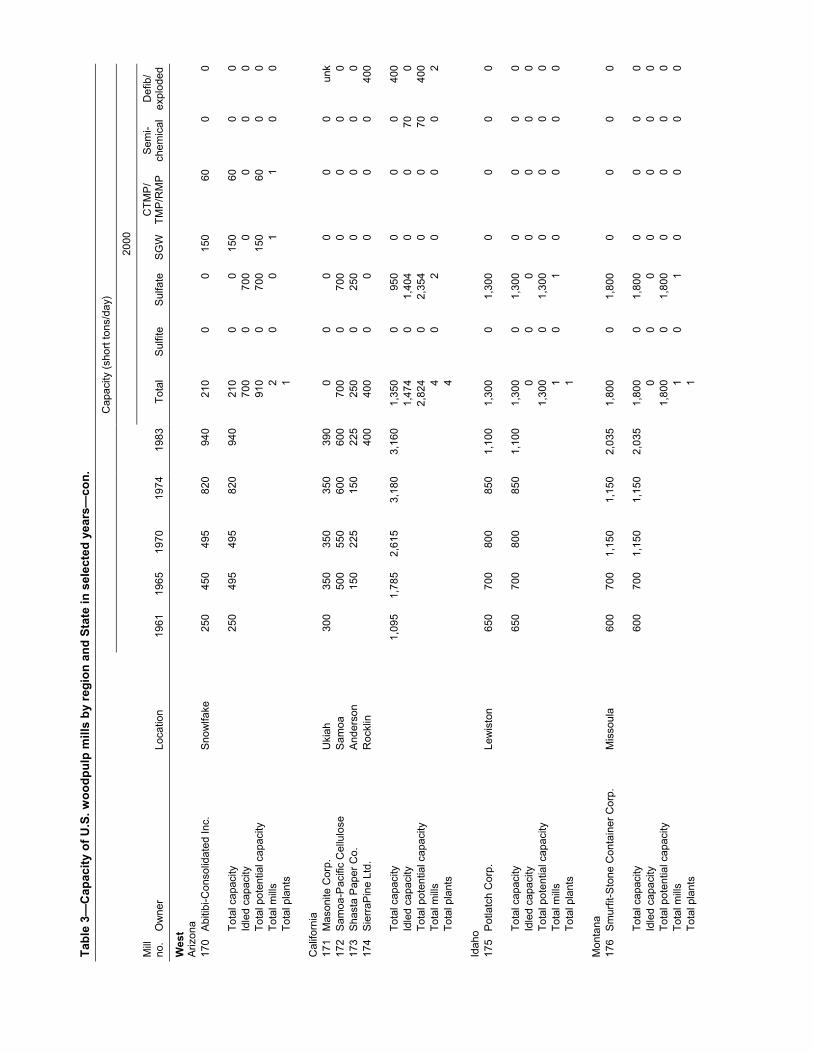
C
apac
ity
Tabl
e 3�
Cap
acity
of U
.S. w
oodp
ulp
mill
s by
regi
on a
nd S
tate
in s
elec
ted
year
s�co
n.
( s
hort
tons
/day
)
20
00
Mill
no.
Ow
ner
Loca
tion
1961
1965
1974
1970
1983
To
tal
Sulfi
teSu
lfate
SGW
CTM
P/
TMP/
RM
P Se
mi-
chem
ical
Def
ib/
expl
oded
Wes
t
Ariz
ona
495
820
210
00
250
495
820
210
00
600
0
700
070
00
0
Tota
l pot
entia
l cap
acity
T
10
C
alifo
rnia
40
0
0
T
2
Idah
o
0
T
0
Mon
tana
0
0
00
1,80
01,
800
0
T
0
0
170
Abiti
bi-C
onso
lidat
ed In
c.
Snow
lfake
250
450
940
150
600
0
To
tal c
apac
ity
Idle
d ca
paci
ty49
594
0 15
0 00
91
0 20 0
700
150
600
0 ot
al m
ills
01
0
Tota
l pla
nts
1
171
Mas
onite
Cor
p.
Uki
ah
300
350
350
350
390
00
00
00
unk
172
Sam
oa-P
acifi
c C
ellu
lose
Sa
moa
50
055
060
060
0 70
00
700
00
00
173
Shas
ta P
aper
Co.
An
ders
on
150
225
150
225
250
025
00
00
0 17
4 Si
erra
Pine
Ltd
. R
ockl
in
40
0 40
00
00
00
400
Tota
l cap
acity
1,09
51,
785
2,61
53,
180
3,16
0 1,
350
095
00
00
Id
led
capa
city
1,47
42,
824
01,
404
00
70
Tota
l pot
entia
l cap
acity
0
2,35
40
070
400
otal
mills
4
02
00
0
Tota
l pla
nts
4
175
Potla
tch
Cor
p.
Lew
isto
n
650
700
800
850
1,10
0 1,
300
01,
300
00
00
Tota
l cap
acity
650
700
800
850
1,10
0 1,
300
01,
300
00
00
Id
led
capa
city
00
00
00
To
tal p
oten
tial c
apac
ity
1,30
00
1,30
00
00
0 ot
al m
ills
10
10
00
To
tal p
lant
s 1
17
6 Sm
urfit
-Sto
ne C
onta
iner
Cor
p.
Mis
soul
a
600
700
1,15
01,
150
2,03
5 1,
800
01,
800
00
0
To
tal c
apac
ity60
070
01,
150
1,15
02,
035
1,80
00
1,80
00
00
Id
led
capa
city
00
00 0
0
Tota
l pot
entia
l cap
acity
0
00
otal
mills
1
01
00
To
tal p
lant
s 1

Tabl
e 3�
Cap
acity
of U
.S. w
oodp
ulp
mill
s by
regi
on a
nd S
tate
in s
elec
ted
year
s�co
n.
Cap
acity
( sho
rt to
ns/d
ay)
20
00
Mill
no.
Ow
ner
Loca
tion
1961
1965
1970
1974
1983
To
tal
Sulfi
teSu
lfate
SGW
CTM
P/
TMP/
RM
P Se
mi-
chem
ical
Def
ib/
expl
oded
Ore
gon
17
7 Bl
ue H
eron
Pap
er C
o.
Ore
gon
City
42
042
057
065
042
0 35
00
00
350
00
178
Bois
e C
asca
de C
orp.
St
. Hel
ens
375
385
825
850
150
965
955
095
5 00 0
00
0 17
9 C
ollin
s Pr
oduc
ts
Klam
ath
Falls
15
015
015
0 15
00
00
150
180
Evan
ite F
iber
Cor
p.
Cor
vallis
30
3010
010
010
0 12
00
00
00
120
181
Geo
rgia
-Pac
ific
Inc.
C
lats
kani
e 97
096
01,
160
1,32
50
1,00
00
325
00
189
Wey
0
T
182
Geo
rgia
-Pac
ific
Inc.
To
ledo
60
090
01,
075
1,32
51,
340
1,50
00
1,10
00
040
00
183
Geo
rgia
-Pac
ific
Inc.
Le
bano
n 19
0 19
00
00
00
190
184
Mas
onite
Cor
p.
Pilo
t Roc
k 13
013
013
013
013
0 13
00
00 0
00
130
185
Pope
& T
albo
t Inc
. H
alse
y 30
030
035
0 53
00
530
00
0 18
6 Si
erra
Pine
Ltd
. M
edfo
rd
52
00
00 0
00
520
187
SP N
ewsp
rint C
o.
New
berg
15
015
052
052
090
0 42
00
042
00
0 18
8 St
imso
n Lu
mbe
r Co.
G
asto
n 70
100
100
100
140
140
00
014
00
0 er
haeu
ser C
o.
Sprin
gfie
ld
400
1,15
01,
150
1,15
01,
090
1,09
00
1,09
00
00
019
0 W
illam
ette
Indu
strie
s In
c.
Al
bany
240
400
500
700
800
680
068
00
00
0
Tota
l cap
acity
3,49
05,
700
8,27
58,
720
8,94
5 8,
100
05,
355
01,
235
400
1,11
0
Idle
d ca
paci
ty2,
100
01,
800
00
300
To
tal p
oten
tial c
apac
ity
10,2
000
7,15
50
1,23
570
01,
110
otal
mills
16
07
03
15
To
tal p
lant
s 15

Tabl
e 3�
Cap
acity
of U
.S. w
oodp
ulp
mill
s by
regi
on a
nd S
tate
in s
elec
ted
year
s�co
n.
Cap
acity
( sho
rt to
ns/d
ay)
20
00
Mill
no.
Ow
ner
Loca
tion
1961
1965
1970
1974
1983
To
tal
Sulfi
teSu
lfate
SGW
CTM
P/
TMP/
RM
P Se
mi-
chem
ical
Def
ib/
expl
oded
W
ashi
ngto
n
191
Abiti
bi-C
onso
lidat
ed In
c.
Stei
laco
om
300
450
660
00
066
00
0
485
1,
555
1,78
02,
100
203
Wey
204
Wey
0
0
0
T
Tota
l pla
nts
0 To
tal p
oten
tial c
apac
ity
1,
110
Wes
t Reg
ion
Tota
l mills
2W
est R
egio
n To
tal p
lant
s
10,4
401,
020
11,4
60 23
192
Bois
e C
asca
de C
orp.
W
allu
la
375
500
630
700
910
1,07
90
859
00
220
0 19
3 D
aish
owa
Amer
ica
Co.
, Ltd
. Po
rt An
gele
s 50
050
519
530
071
0 38
00
00
380
00
194
Geo
rgia
-Pac
ific
Cor
p.
Cam
as
1,06
51,
300
1,22
51,
200
1,25
0 1,
800
500
1,30
00
00
0 19
5 G
eorg
ia-P
acifi
c W
est,
Inc.
Be
llingh
am
470
520
550
580
620
650
650
00
00
0 19
6 In
land
Em
pire
Pap
er C
o.
Spok
ane
140
135
820
125
850
140
835
170
835
310
485
00 0
0 031
0 00 0
0 0 19
7 Ki
mbe
rly-C
lark
Cor
p.
Long
view
Fib
re C
o.
Ever
ett
Long
view
790
1,39
019
8 2,
100
2,52
00
2,40
00
012
00
199
Nor
th P
acifi
c Pa
per C
orp.
Lo
ngvi
ew
1,40
0 1,
435
00
01,
435
00
200
Pond
eray
New
sprin
t Co.
U
sk
70
00
00
700
00
201
Port
Tow
nsen
d Pa
per C
orp.
Po
rt To
wns
end
420
420
420
420
445
550
055
00
00
0 20
2 Si
mps
on T
acom
a Kr
aft C
o.
Taco
ma
800
800
900
1,09
01,
090
1,20
00
1,20
00
00 0
0 er
haeu
ser C
o.
Cos
mop
olis
400
350
400
400
450
400
400
00
00
erha
euse
r Co.
Lo
ngvi
ew
730
1,08
01,
200
1,32
595
0 1,
100
01,
100
00
0
Tota
l cap
acity
9,18
510
,350
10,7
3511
,350
12,7
40
13,2
692,
035
7,40
90
3,48
534
0
Idle
d ca
paci
ty82
582
50
00
0
Tota
l pot
entia
l cap
acity
ot
al m
ills
14,0
942,
860
7,40
90
3,48
534
00 0
17 155
60
51
Wes
t Reg
ion
Tota
l cap
acity
Idle
d ca
paci
ty
15
,270
19,7
3024
,070
26,0
7028
,920
26
,029
2,03
516
,814
150
4,78
074
037
01,
510
5,09
982
53,
904
00
31,1
282,
860
20,7
1815
04,
780
1,51
0
41
517
19
7
37
US
Tota
l cap
acity
U
S Id
led
capa
city
87,2
7010
0,45
013
0,31
514
3,13
017
2,09
5 18
2,44
04,
367
139,
062
5,54
515
,218
7,75
8
20,3
5082
517
,055
875
475
100
U
S To
tal p
oten
tial c
apac
ity
202,
790
5,19
215
6,11
76,
420
15,6
937,
858
U
S To
tal m
ills
231
1311
420
3229
US
Tota
l pla
nts
Tab
le 3
cor
rect
ed J
anua
ry 2
004.
Cap
acity
in s
hort
tons
/day
.
20
5

Table 4�Number and capacity (short tons/day) of woodpulp mills by region
Northeast North Central South West
Capacity Capacity Capacity
Year Number Total Average Number Total Average Number Total AverageTotal Average Number
1959 80 13,910 174 70 9,870 141 76 44,750 589 56 13,625 243 75 12,700 169 71 10,130 143 85 51,130 602 52 16,635 320
1965 67 12,520 187 69 11,605 168 87 59,440 683 57 21,030 369 1974 52 15,434 297 63 13,097 208 120 92,723 773 57 27,508 483 1983 16,035 401 50 13,370 267 117 114,315 977 47 30,135 641 2000 30 14,638 488 42 14,189 338 118 127,584 1,081 41 26,029 635
Capacity
1961
40
Table 5�Total capacity (short tons/day) of U.S. pulp mills by grade
Year Sulfite Sulfate Mechanicala Semichemical Total
1920 5,490 2,420 7,430 � 15,340 295
1940 8,675 13,055 7,425 685 29,840 1950 9,115 22,970 8,640 2,935
61,800 1961 11,130 51,050 12,805 9,960 84,945
11,260 10,205 88,850 14,670 12,515 126,240
1974 9,801 14,494 137,090 22,080 14,160 164,795
2000 4,367 139,062 28,521 10,440 182,440
aMechanical includes difibrated/exploded pulp.
1930 7,115 5,585 8,190 21,185
43,660 1955 10,020 33,910 9,560 8,310
1965 62,530 13,270 10,860 97,920 1970
99,060 13,735 1983 7,650 120,905
23