pulmonary physiology:. electron micrograph showing a pulmonary capillary (c) in the alveolar wall
Post on 22-Dec-2015
222 views
TRANSCRIPT
Pulmonary Physiology:
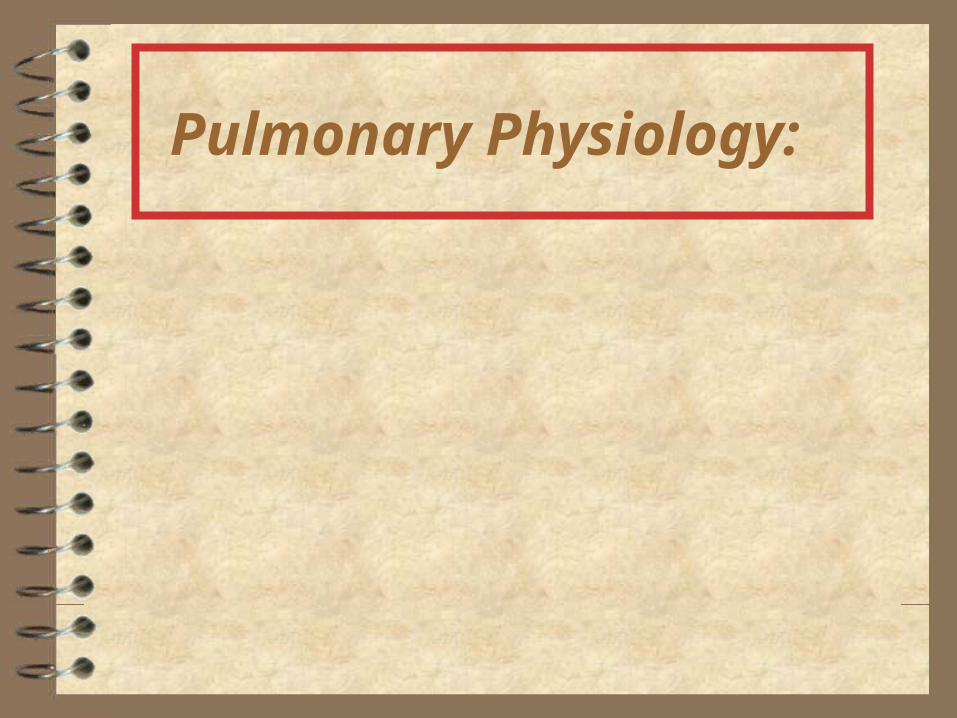
Electron micrograph showing a pulmonary capillary (C) in the alveolar wall.

Figure 4.02. Changes in cross-sectional area of airways through successive generations of branchings

The Pulmonary Tree with some blood vessels as seen in a "corrosion" preparation: 1 = trachea; 2 = left principal bronchus; 3 = right principal
bronchus; 4 = aorta, 5 = thoracic aorta; 6,7,8 = bronchial arteries.

Scanning electron micrograph of a section of lung showing
many alveoli and a small bronchiole

Lung Composition. Left: Percentages of liquids and solids on a weight
basis; Right: Percentages of gas, liquids and solids on a volume basis
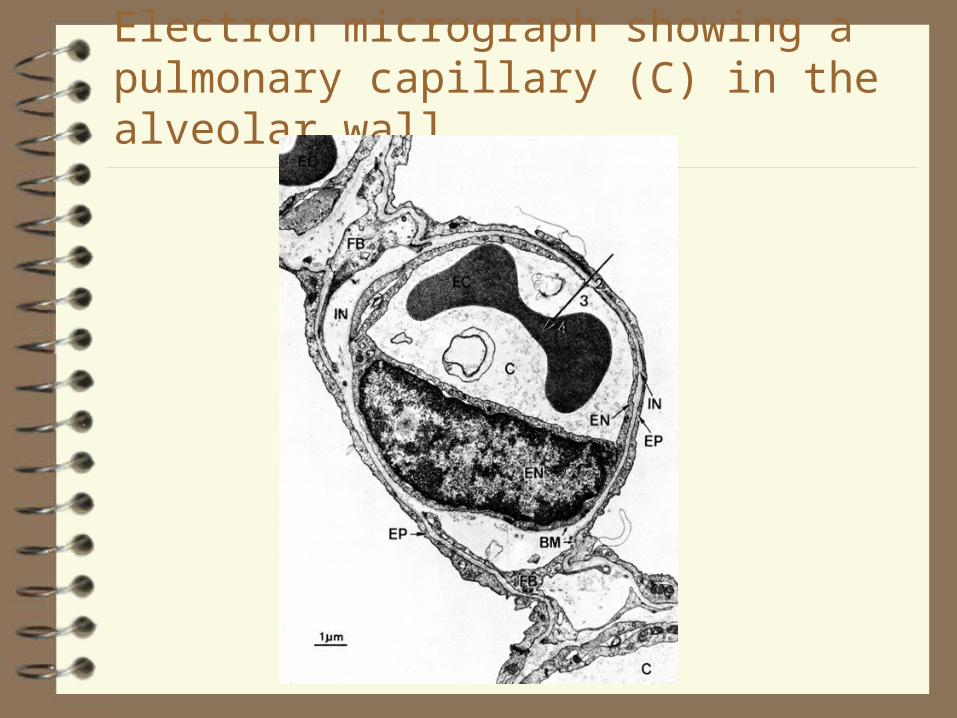
To understand how the values of the partial pressures of the three respiratory gases change from the point of inspiration, through the "respiratory compartments" - to the expiration point, including the FRC's
buffer role.

The Ventilatory Cycle, showing Tidal Volume.
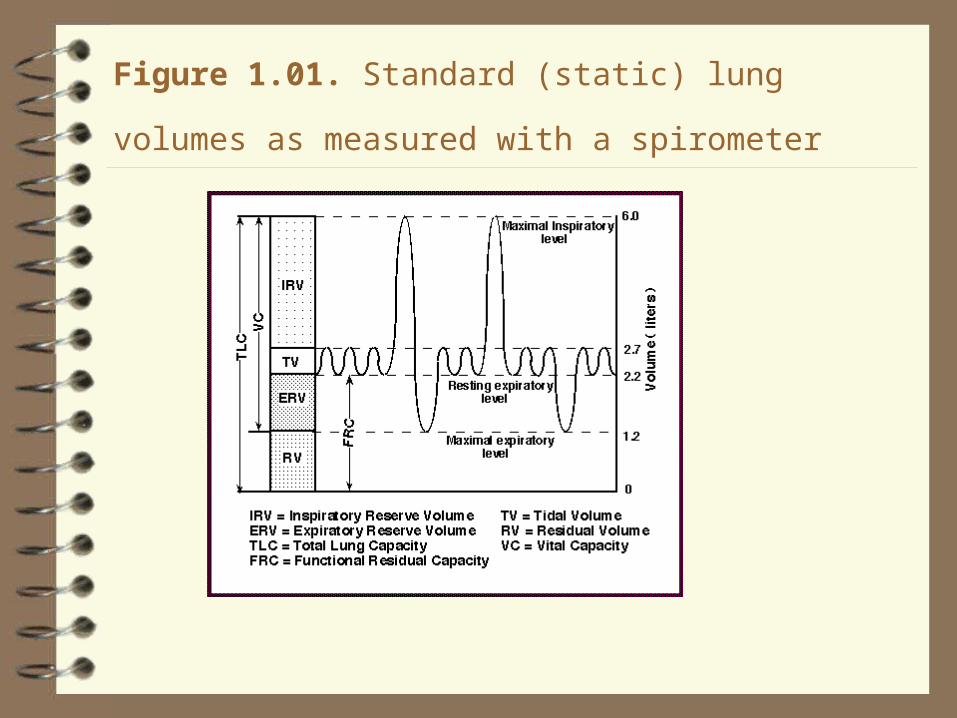
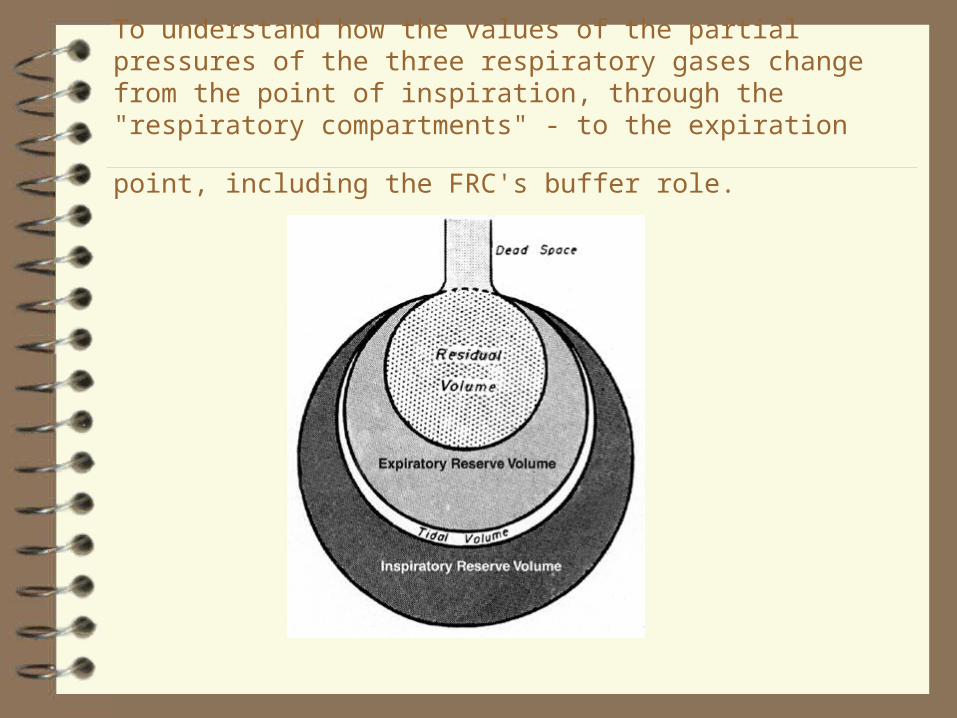
Figure 1.01. Standard (static) lung volumes as measured with
a spirometer

Another graphical representation of Lung Volumes
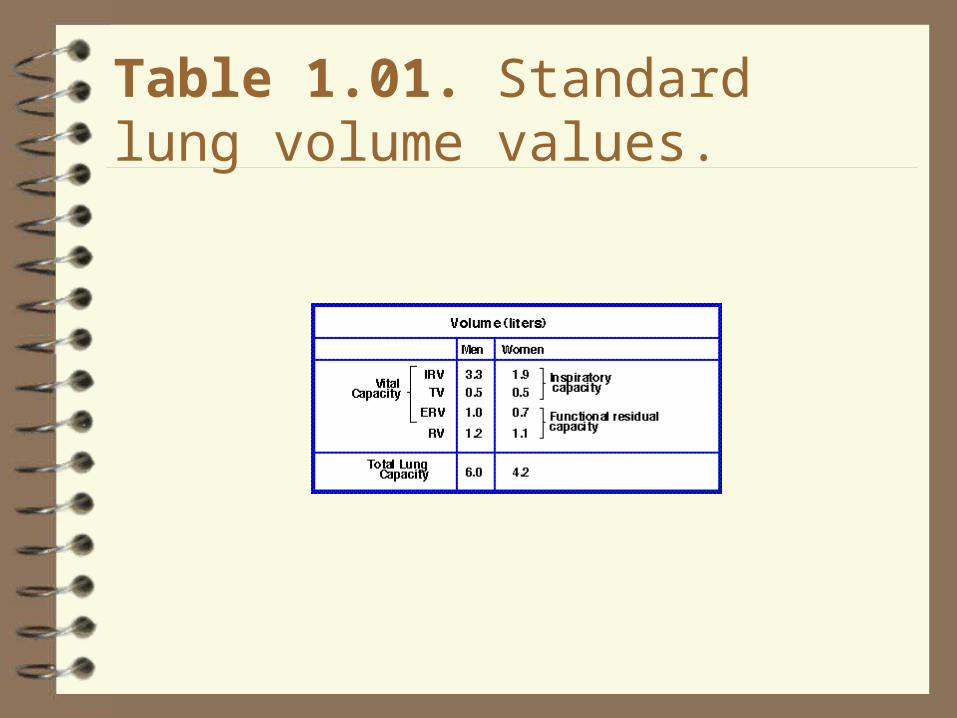
Table 1.01. Standard lung volume values.
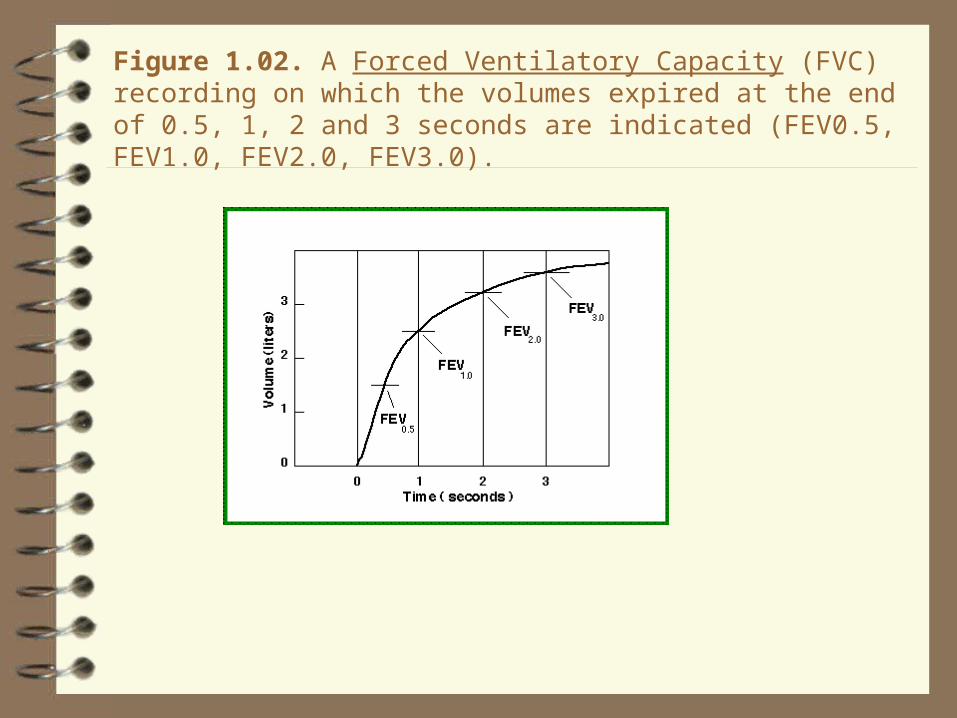
Figure 1.02. A Forced Ventilatory Capacity (FVC) recording on which the volumes expired at the end of 0.5, 1, 2 and 3 seconds are indicated (FEV0.5, FEV1.0, FEV2.0, FEV3.0).
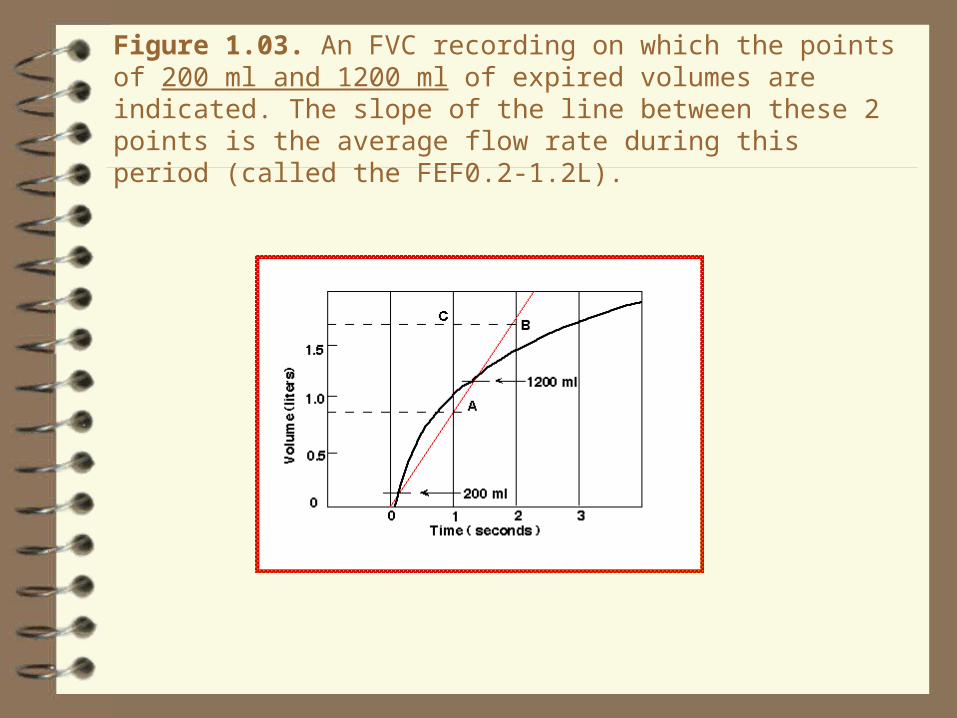
Figure 1.03. An FVC recording on which the points of 200 ml and 1200 ml of expired volumes are indicated. The slope of the line between these 2 points is the average flow rate during this period (called the FEF0.2-1.2L).

Figure 1.04. An FVC recording on which the 25% and 75% points of the FVC have been indicated. The slope of the line between these 2 points is the average flow rate during this period (called the FEF25-75%). The same FVC maneuver is again used and the average flow rate during the middle 50% of the FVC is shown (i.e. between points where 25% and 75% of the FVC has been expired).
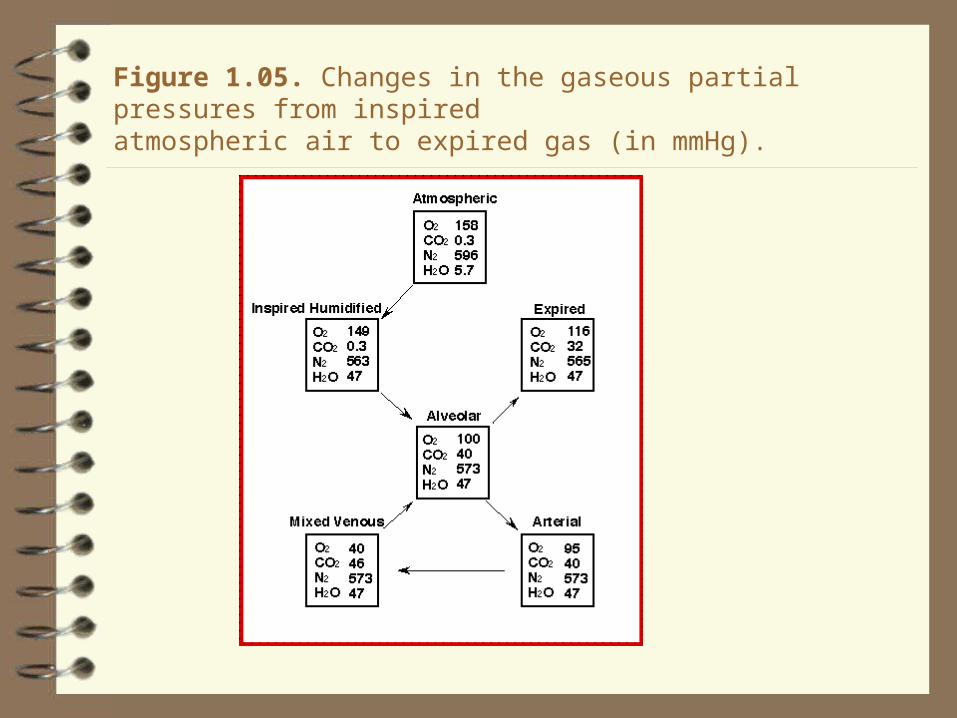
Figure 1.05. Changes in the gaseous partial pressures from inspiredatmospheric air to expired gas (in mmHg).
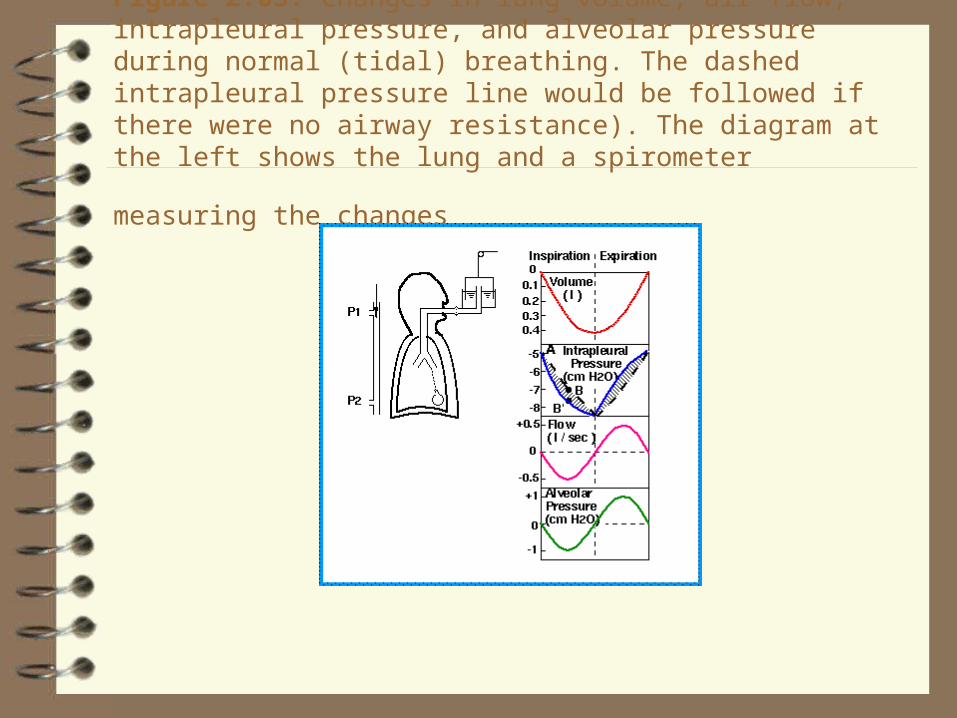
Figure 2.03. Changes in lung volume, air flow, intrapleural pressure, and alveolar pressure during normal (tidal) breathing. The dashed intrapleural pressure line would be followed if there were no airway resistance). The diagram at the left shows the lung and a spirometer measuring the
changes
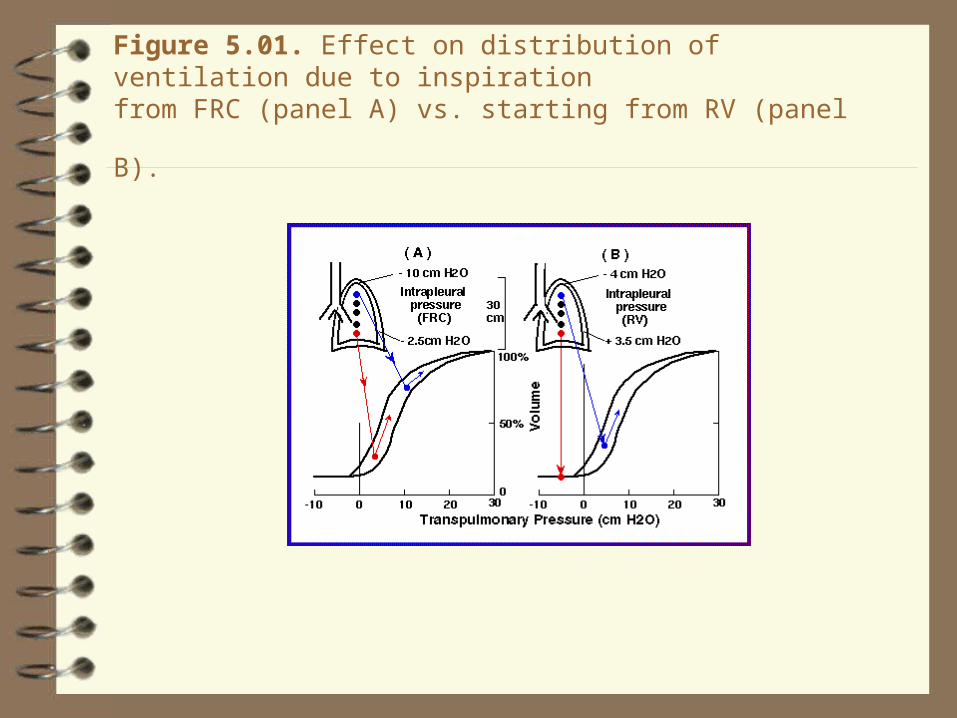
Figure 5.01. Effect on distribution of ventilation due to inspiration
from FRC (panel A) vs. starting from RV (panel B).

Table 6.01. Comparison of pulmonary and systemic hemodynamic variables during rest and exercise of moderate severity in normal adult
man.

Figure 6.01. Pulmonary vs. systemic circulation pressures (mmHg).
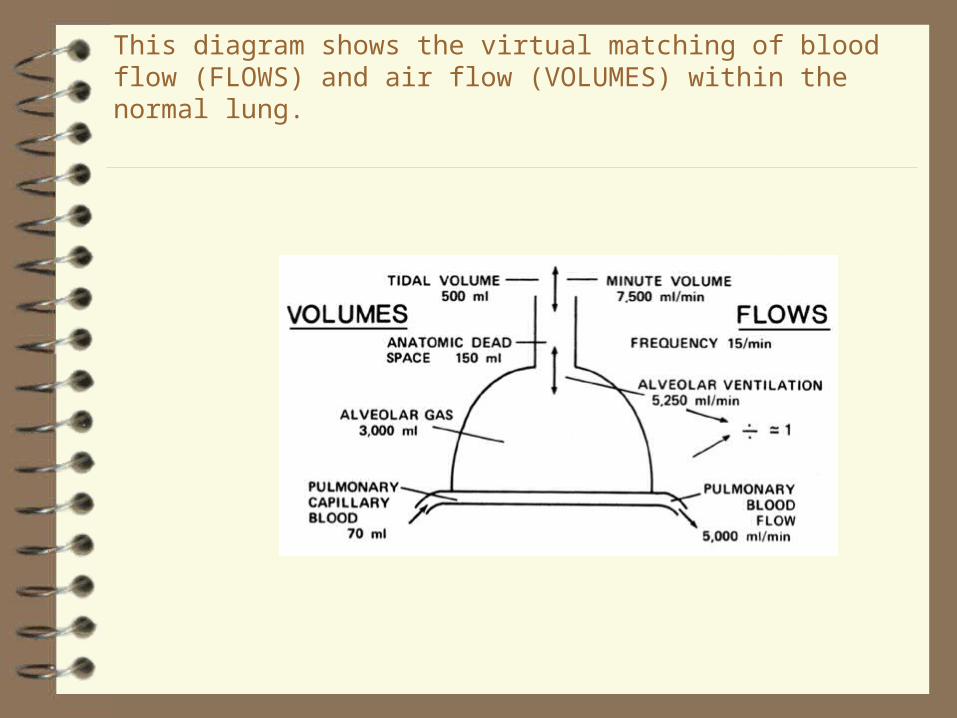
This diagram shows the virtual matching of blood flow (FLOWS) and air flow (VOLUMES) within the normal lung.
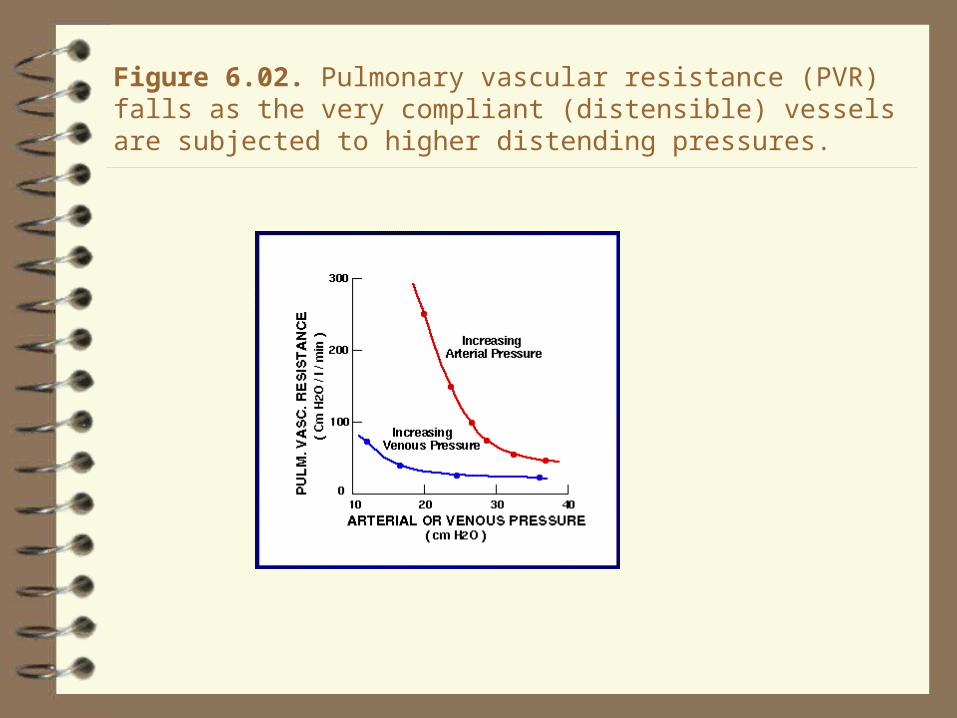
Figure 6.02. Pulmonary vascular resistance (PVR) falls as the very compliant (distensible) vessels are subjected to higher distending pressures.

Table 6.02. Factors that when varied cause "passive" changes in
pulmonary vascular resistance (PVR) and the direction of the responses.
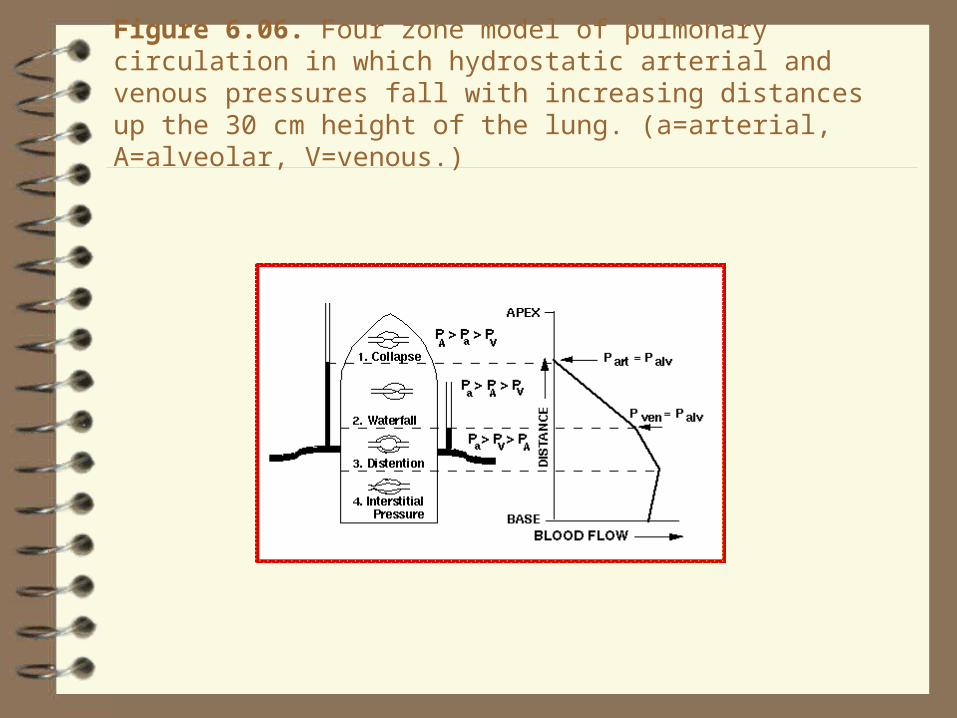
Figure 6.06. Four zone model of pulmonary circulation in which hydrostatic arterial and venous pressures fall with increasing distances up the 30 cm height of the lung. (a=arterial, A=alveolar, V=venous.)

Table 6.03. Important causes of "active" changes in pulmonary vascular
resistance (PVR) and the direction of the responses
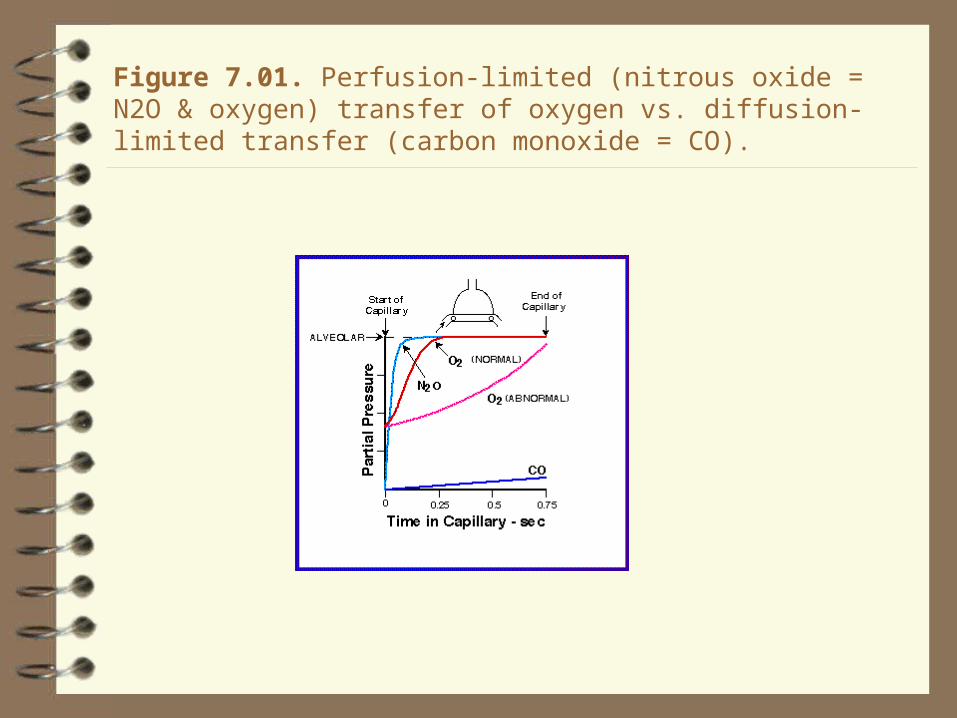
Figure 7.01. Perfusion-limited (nitrous oxide = N2O & oxygen) transfer of oxygen vs. diffusion-limited transfer (carbon monoxide = CO).

Figure 7.06. Hemoglobin-oxygen association-dissociation curve at pH 7.4 and 37o C.

Figure 7.07. Changes in the Hb-oxygen association-dissociation curve with temperature, pH and 2-3 DPG.

Figure 7.08. Comparison of P80 of Quechua (Andes Mountains) inhabitants with Western Europeans (sea level) under normal conditions and after pH is lowered from 7.4 to 6.7. "Double effect" rightward shifts of Quechuas aids unloading of oxygen from blood to tissues.

Figure 7.09. Loading of CO2 from tissure to blood and associated O2 release from blood to tissue.
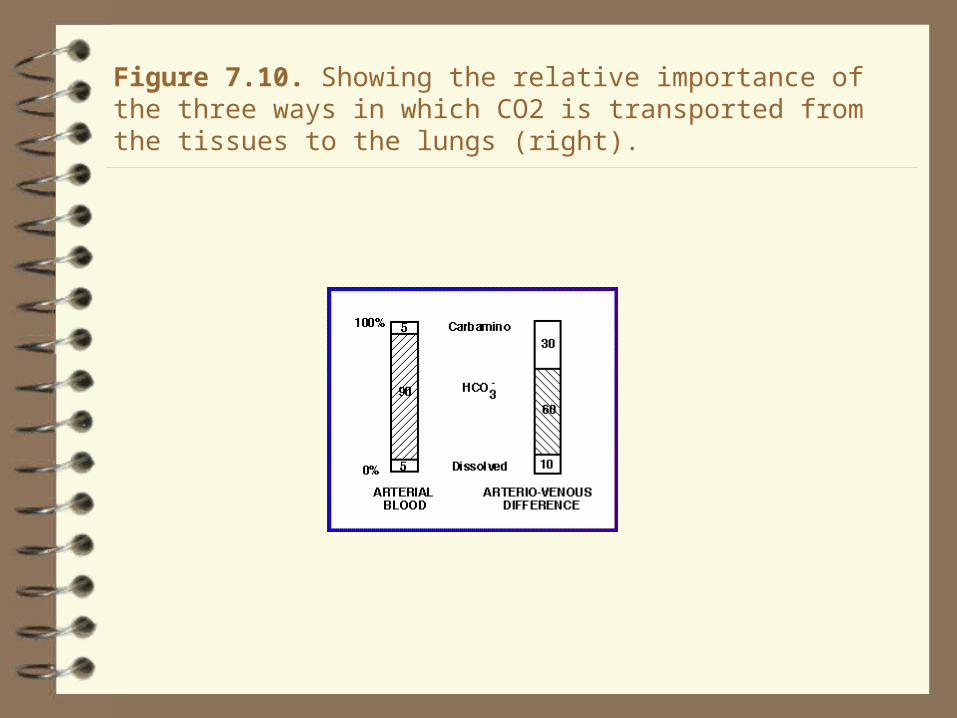
Figure 7.10. Showing the relative importance of the three ways in which CO2 is transported from the tissues to the lungs (right).

Figure 9.01. Characteristics of the four classical hypoxias compared with the normal state (see Table 9.01 for more details).
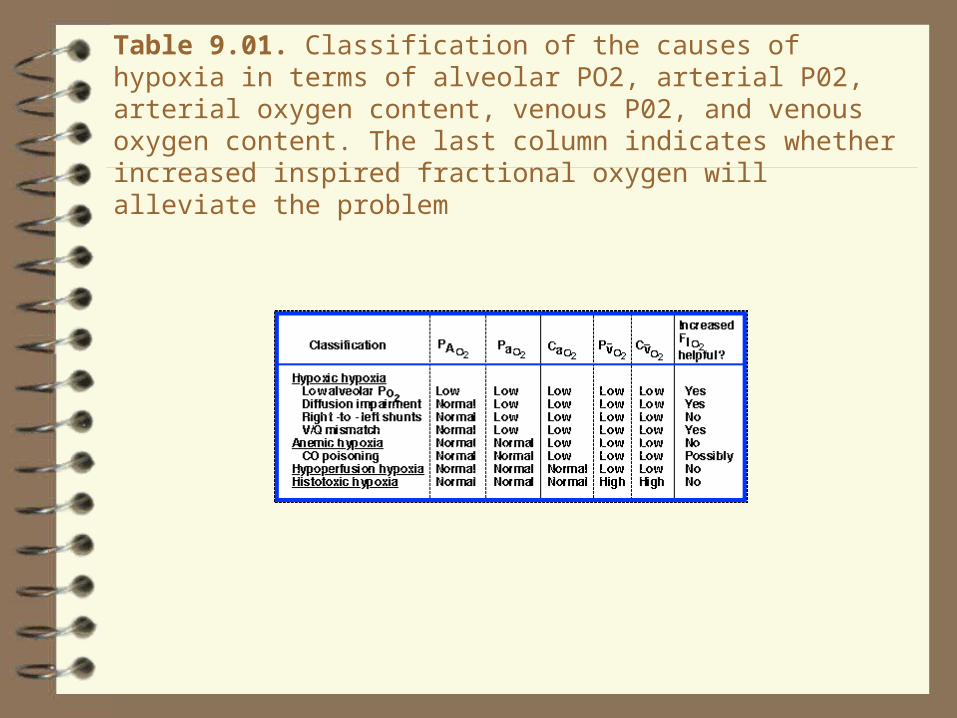
Table 9.01. Classification of the causes of hypoxia in terms of alveolar PO2, arterial P02, arterial oxygen content, venous P02, and venous oxygen content. The last column indicates whether increased inspired fractional oxygen will alleviate the problem

Figure 9.02. Comparison of the oxygen dissociation curves of normal blood, blood containing 20%, 40% and 60% carboxyhemoglobin (COHb), and blood from a severely anemic patient.

Figure 9.03. Increasing 2,3-diphosphoglyceric acid (DPG) concentration causes the hemoglobin-oxygen association-dissciation curve to shift to the right, ie. to decrease Hb's affinity for oxygen (P50 values are 15, 20, 27, 34, and 42 mm Hg from left to right).

Table 13.01. Mechanisms that contribute to the defense of
the respiratory tract

Figure 13.01. Mechanisms of aerosol particle deposition include sedimentation via gravity, inertial impaction, and diffusion by Brownian
motion

Figure 13.02. Ciliary action and mucous movement
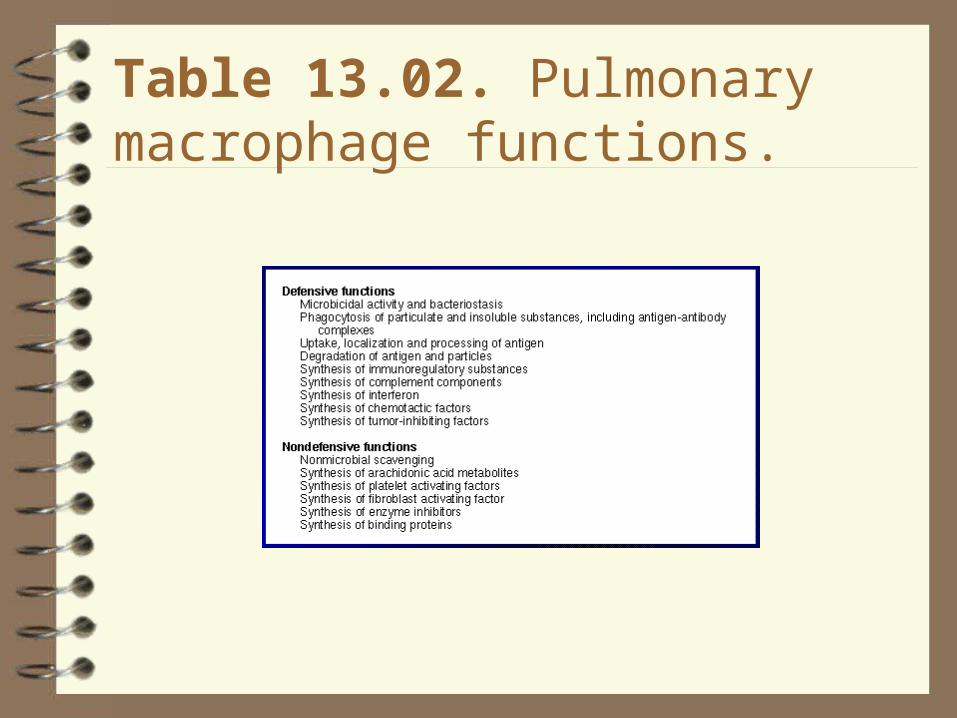
Table 13.02. Pulmonary macrophage functions.

Table 13.03. Summary of the fate of circulating substances during a
single passage through the intact pulmonary circulation.

Fig. 17-1

The Respiratory System
1) The lung ‑‑ two functional components:
Airways (convection of gas) (p. 550-2, 499-502, 475-7,
480; Fig. 17-2)
Alveoli (site of gas exchange or diffusion; (also includes respiratory bronchioles and alveolar sacs) (p. 551, 502, 477; Fig. 17-2))
2) The pump muscles (p. 548, 500, 499-500, 476; Fig. 17-2a):
Inspiratory: diaphragm, external intercostals, other accessory muscles when respiratory drive increases
Expiratory: internal intercostals, abdominals; typically inactive at rest (in humans)

Consider flow from a tube at the bottom of a bucket:
The higher the level of water in the bucket, the greater the pressure of the water at the bottom and, therefore, the greater the flow. Therefore, flow is proportional to the pressure gradient.
The greater the resistance of the tube, the less the flow. Therefore, flow is inversely proportional to resistance.
Flow = Δ P/R This is the most important equation you will need.

ΔP
R
The pressure gradient and resistance determine flow
Hydraulic version of Ohm's law used to determine electric current flow through a circuit (see section related to membrane potential) and is identical to that used to describe blood flow (pp. 453-4, 408-10).
Flow to and from the alveoli depends on:
a) the resistance (R) to flow offered by the airways (reflecting their size), and
b) the pressure generated (ΔP) by the respiratory pump muscles.

Airway resistance: Depends on the physical properties of the fluid (air) and the geometry of the tubes (airways); given by Poiseuille's Law (p. 560, 513, 490):
R = 8 η l / π r 4 where:
η = the density of the fluid
l = the length of the tube
r = the radius of the tube.
r is the most important because it is raised to the fourth power.

Airway resistance is controlled:
passively (lung volume, strength of airway wall)
actively (degree of contraction of airway smooth muscle).

Control of airway smooth muscle tone
(the “R” in V = ΔP/R)
(p. 560-1, 513-4, 490-1)
Depends on:
• sympathetic (dilator) and
• parasympathetic (constrictor)
activity in branches of the autonomic nervous system.
.
Sympathetic (dilator) effects can be:
direct ‑‑ release of norepinephrine from sympathetic terminals into the ganglia containing the parasympathetic fibres, thereby reducing the level and/or effectiveness of parasympathetic activity, or
indirect ‑‑ epinephrine released from the adrenal medulla into the circulation, causes relaxation of airway smooth muscle.
Parasympathetic (constrictor) effects are:
direct -- via release of acetylcholine from postganglionic fibres directly onto airway smooth muscle.
Also depends on local levels of O2 and CO2 (p. R19-20 in notes; Fig. 17‑17 p 576-7, 519, 497)
The “ΔP” in V = ΔP/R
Barometric pressure, PB (p. 552, 503, 480) ‑‑ the "weight" of the atmosphere.
Pressures are relative to PB at sea level, PB = 760 mmHg (or 1 ATA or 100 kPa or 1000 hPa or 1000 cmH2O)
The local (ambient) PB is set equal to zero; all other pressures are relative to this value. Thus:
pressures > PB are positive
pressures < PB are negative
Units: most respiratory physiologists and clinicians still use cmH2O. 1 mmHg = 13.6 mmH2O (mercury is 13.6 times as dense as water) = 1.36 cmH2O
.
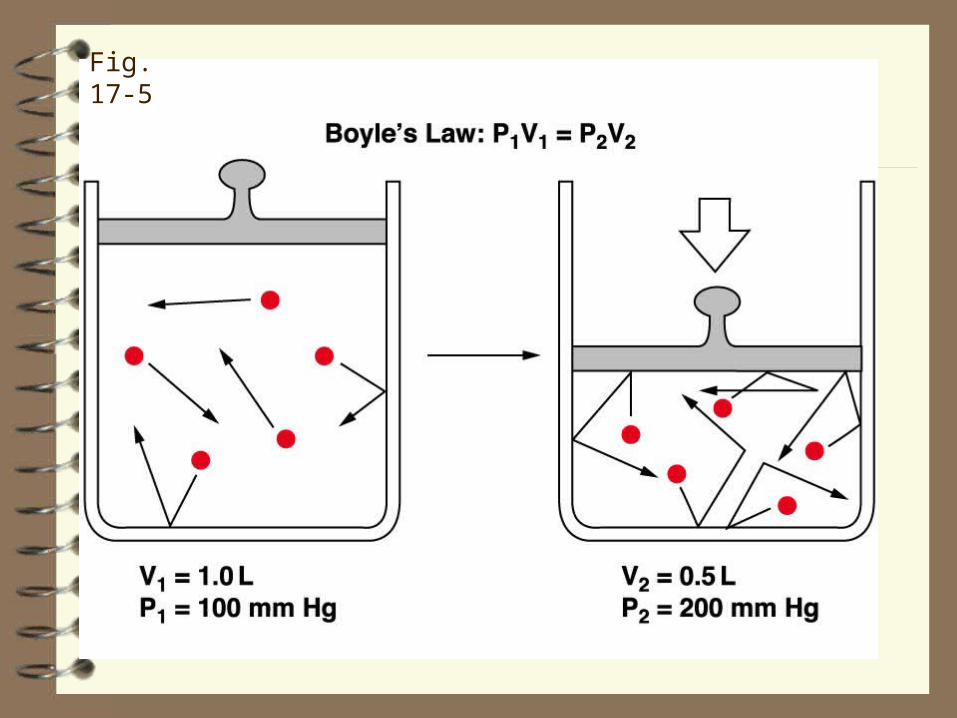
Fig. 17-5
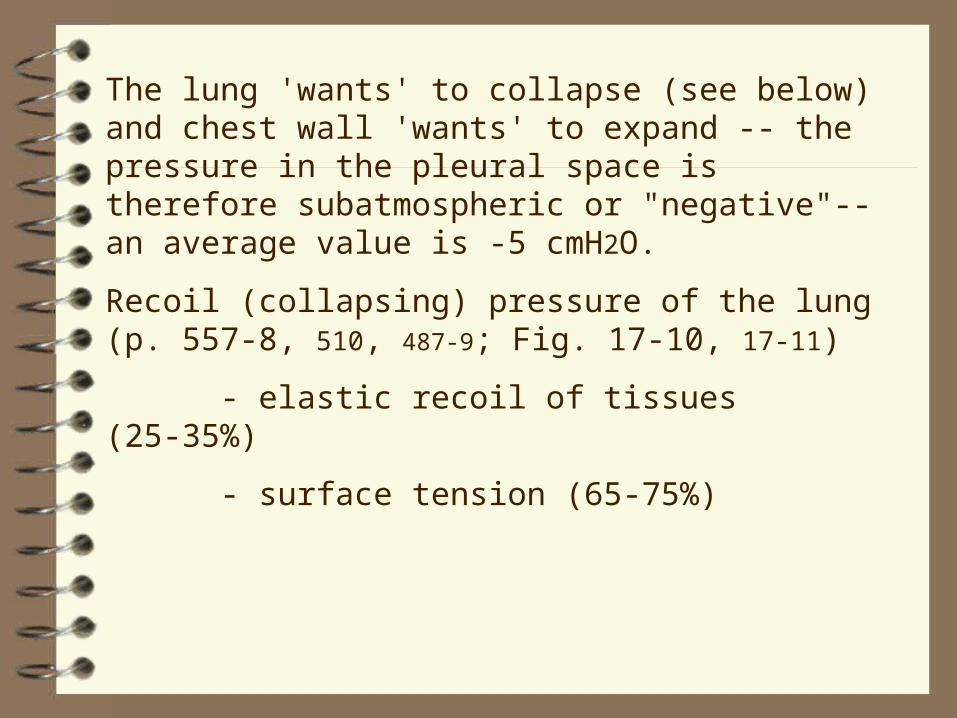
The lung 'wants' to collapse (see below) and chest wall 'wants' to expand ‑‑ the pressure in the pleural space is therefore subatmospheric or "negative"‑‑ an average value is ‑5 cmH2O.
Recoil (collapsing) pressure of the lung (p. 557-8, 510, 487‑9; Fig. 17‑10, 17-11)
- elastic recoil of tissues (25‑35%)
- surface tension (65‑75%)

Relations between Volume and Pressure
Compare the volume‑pressure curves of the lungs when filled with saline and with air.
The air‑filled lung generates more recoil pressure because of surface tension at the air‑liquid interface. Surface tension is only possible at a surface.
More pressure is required to inflate the air‑filled lung.
The 'ease' with which volume can be changed is expressed by the term compliance (p. 559, 511, 488); the greater the compliance, the greater the change in volume for a given pressure applied.
C = ΔV / Δ P (notes, p. R8)
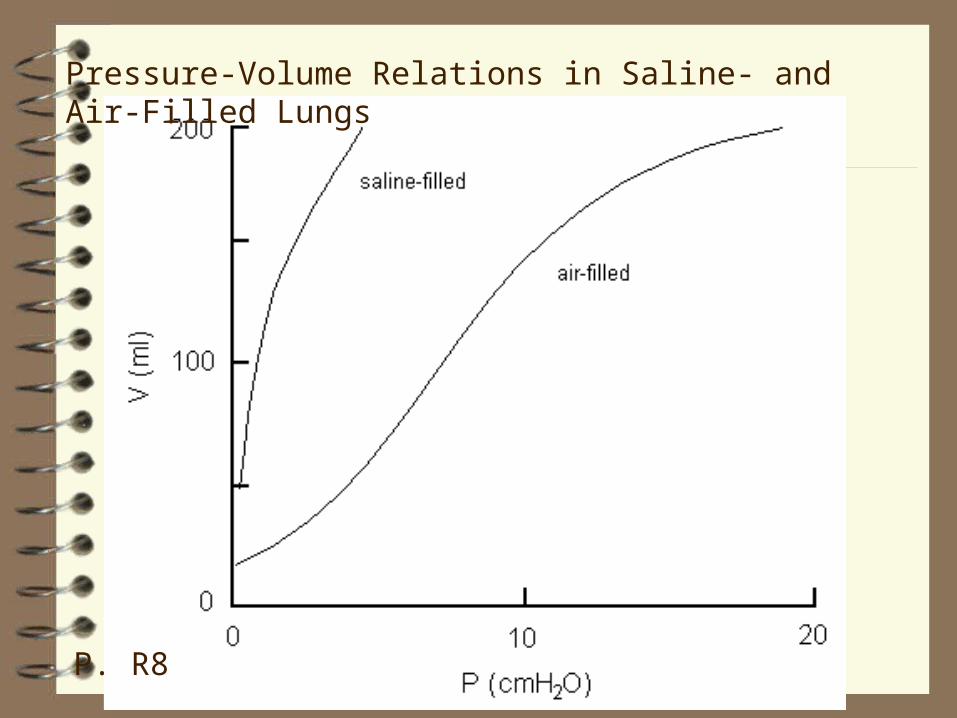
Pressure-Volume Relations in Saline- and Air-Filled Lungs
P. R8

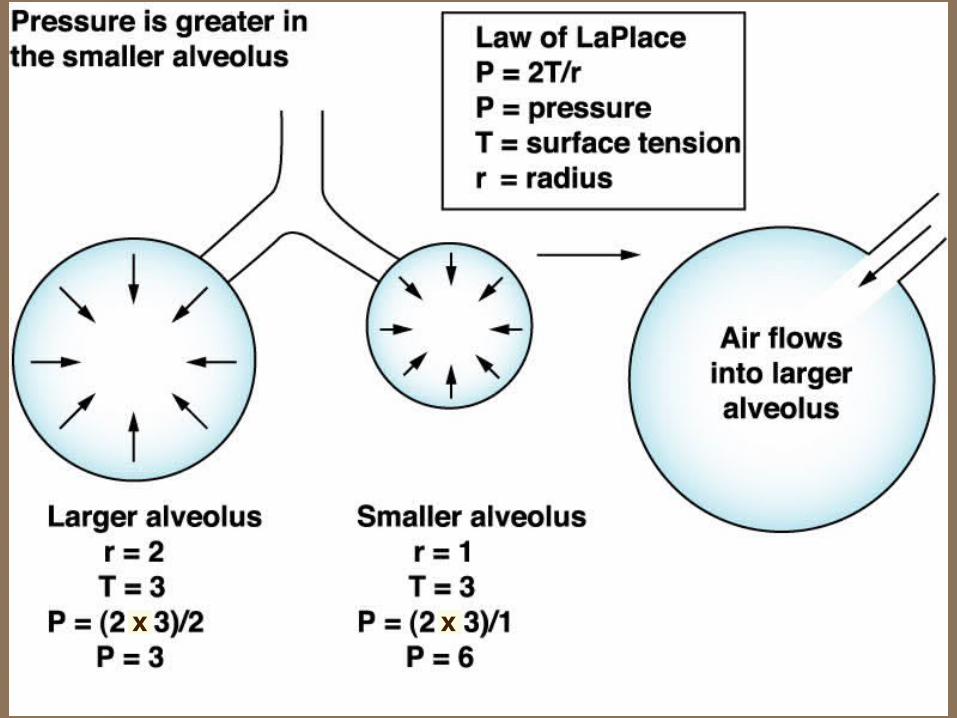
LaPlace's Law
relates recoil pressure, surface tension and size
P = 2 T / r
where
P = internal pressure
T = tension in the wall of the structure ( = surface tension)
r = radius of the structure

Unstable Bubbles and Stable Alveoli
p. 560, 512-3, 489‑90
Surfactant: surface active (i.e., surface tension) causes surface tension to vary with surface area.
Increased surface tension of a large alveolus offsets its larger radius, making its recoil pressure equal to that of a smaller alveolus (Fig. 17-11 right, 17‑12 right). This prevents small alveoli emptying into large alveoli.
Interdependence (not in Silverthorn): stabilization of alveoli by the connective tissue between different parts of the lung. One lung region cannot get smaller without making another region larger.
xx

x x

Relevance of Surfactant
Surfactant reduces surface tension and thereby reduces work of breathing. It allows our alveoli to remain expanded to maintain gas exchange. Without it, our alveoli would collapse and gas exchange would deteriorate rapidly.
As happens in . . . .
Natural and artificial replacements for surfactant are now routinely administered to premature infants.

Relevance of LaPlace's Law
• why capillaries are so "strong"
• bicycle and automobile tires
Rearrange LaPlace’s Law to get
T = P × r
(The strength (T) of the wall of the structure needed to withstand the product of the internal pressure and the radius of the structure)
Respiratory Mechanics
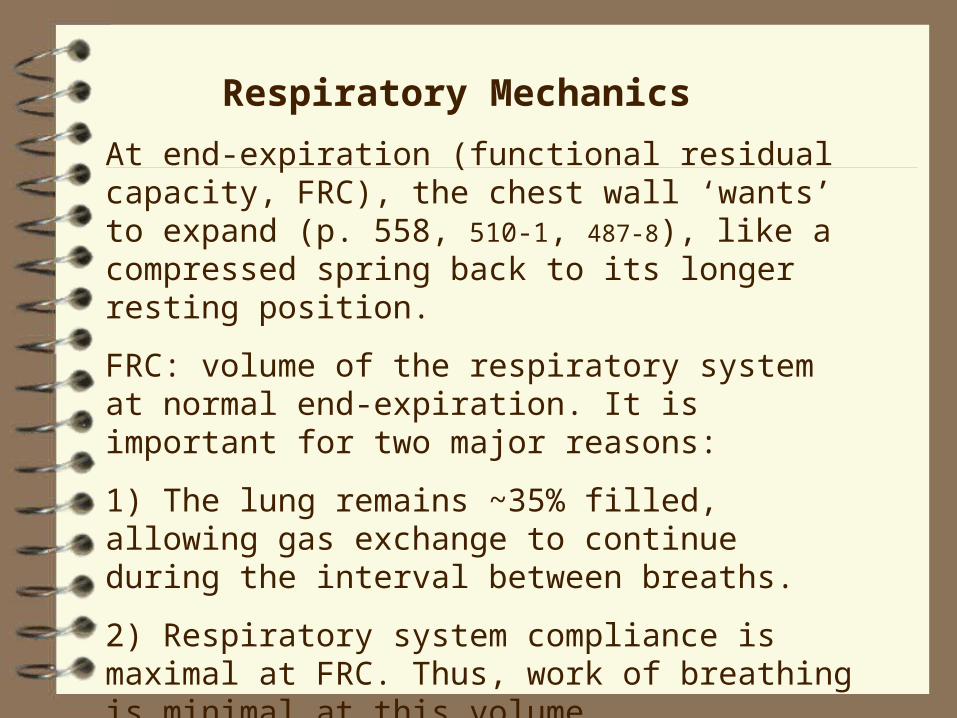
At end‑expiration (functional residual capacity, FRC), the chest wall ‘wants’ to expand (p. 558, 510-1, 487‑8), like a compressed spring back to its longer resting position.
FRC: volume of the respiratory system at normal end‑expiration. It is important for two major reasons:
1) The lung remains ~35% filled, allowing gas exchange to continue during the interval between breaths.
2) Respiratory system compliance is maximal at FRC. Thus, work of breathing is minimal at this volume.

Mechanics of the Respiratory System
most compliant part of curve
P. R9
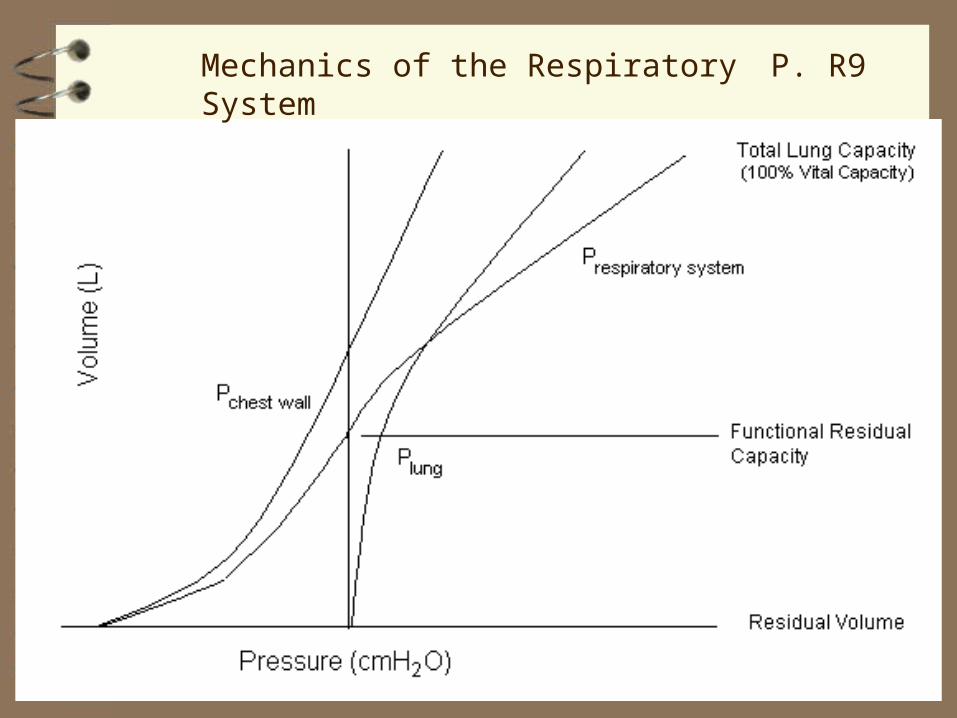
Mechanics of the Respiratory System P. R9
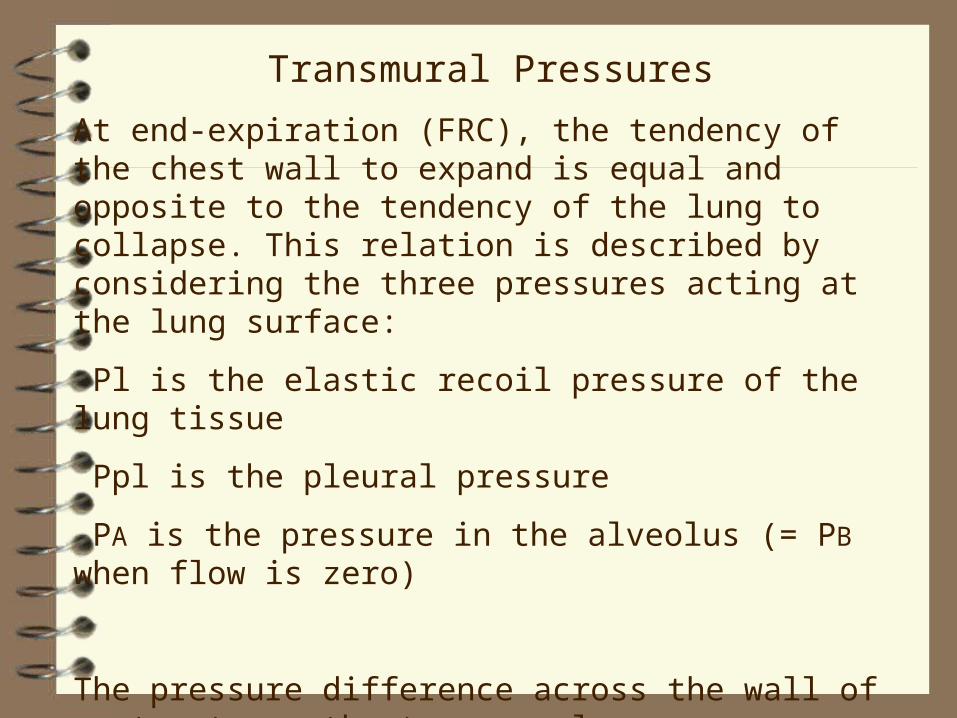
Transmural Pressures
At end‑expiration (FRC), the tendency of the chest wall to expand is equal and opposite to the tendency of the lung to collapse. This relation is described by considering the three pressures acting at the lung surface:
Pl is the elastic recoil pressure of the lung tissue
Ppl is the pleural pressure
PA is the pressure in the alveolus (= PB when flow is zero)
The pressure difference across the wall of a structure, the transmural pressure, equals the internal pressure less the external pressure.

Transmural pressure =
internal pressure ‑ external pressure, or
Transmural pressure =
alveolar pressure ‑ pleural pressure
Therefore: Pl = PA‑ Ppl
At end‑expiration ( = 0 ),
PA = 0 cmH2O
Ppl = ‑5 cmH2O (Silverthorn ‑3 mmHg),
Pl = 0 ‑ (‑5) = +5 cmH2O
Note: Pl must be equal and opposite to Ppl to give
PA = 0 cmH2O (required for V = 0) .

Inspiration
To produce inspiratory flow, PA must be negative (subatmospheric). Rearranging the equation:
PA = Pl + Ppl
Thus, alveolar pressure (PA) is the sum of elastic recoil pressure (Pl) and pleural pressure (Ppl).
To make PA 'negative,' Ppl must be more negative than Pl is positive. When the diaphragm (p. 507, 485), contracts, it descends, lowers Ppl, decompresses the gas in the lungs and, therefore, makes PA 'negative.' This causes inspiratory flow.

A model to illustrate this is shown in the Figure (p. R11), in which the elastic recoil pressure of the balloon is designated as the transpulmonary pressure (Ptp). In this example, PA = Ptp + Ppl
Because of the resistance to airflow, lung expansion lags the pressure which causes inspiratory flow. Therefore, as long as inspiratory muscles contract enough to cause flow, the elastic recoil of the lung, Pl, will not 'catch up' to the more negative Ppl.
When inspiratory muscle (diaphragm) contraction eventually decreases, Pl does catch up to and equals Ppl (but now, for example, Ppl = ‑8 cmH2O and Pl = +8 cmH2O). Because PA = Pl + Ppl, therefore, PA = +8 + (‑8) = 0 cmH2O. Inspiration now stops.

0-5
-10 0 -10-5
PA
Ppl
Ptp
pressure (cmH2O)
rest (end-expiration)inspiration
Page R11

Relation between PA and Flow
As flow decreases towards zero, the pressure needed to produce flow approaches zero regardless of resistance.
Rearranging V = ΔP/R gives
ΔP = V R
Thus, PA would hardly change during inspiration; i.e., the tracing of PA would be 'flat' (red line at ~PB or "0" mmHg) (Fig. 17-9, 17-10, top right; same figure in 1st
edition but the tracing is called intrapulmonary pressure).
..

Moreover, the tracing of Ppl would be straight (red line), not curved, lines. Because some pressure is needed (and occasionally a lot) to overcome flow resistance, not just to expand the lung (i.e., overcome its elastic recoil), PA falls below PB (subatmospheric) during inspiration and above PB (supra‑ atmospheric) during expiration.
This is also why the tracing of Ppl is slightly concave to the time axis.
Were the subject to breathe faster (e.g., blue line), both lines would deviate even more because of the extra pressure required to overcome the increased flow resistance.

Fig. 17-9 17-10

pressure trajectories with infinitely slow inspiration or if flow resistance (R) is zero
pressure trajectory at higher flow

The reason why the pressure curve is straight for the Ppl and flat (at zero) for the PA can be explained using the basic equation
V = ΔP / R
Rearranging:
ΔP = V • R
For a given R, as the flow (V) decreases towards zero, ΔP must also decrease towards zero.
This ΔP is the flow resistive component of the total pressure required to change lung volume. Therefore, Ppl still falls from –5 to –8 cmH2O but this reflects only the elastic, not the flow-resistive, component.
..
.
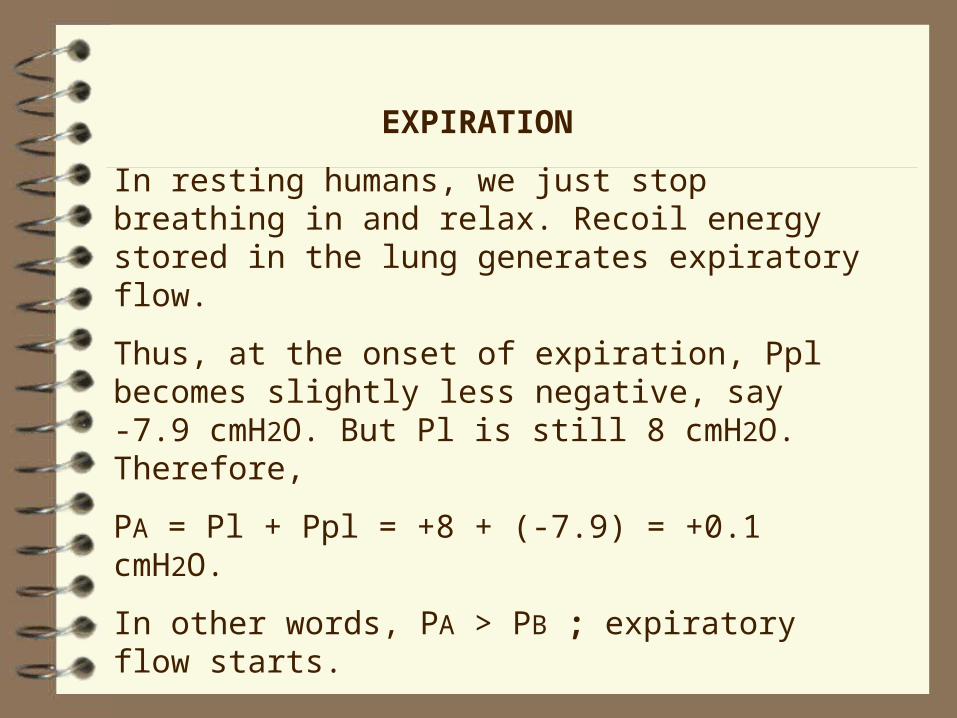
EXPIRATION
In resting humans, we just stop breathing in and relax. Recoil energy stored in the lung generates expiratory flow.
Thus, at the onset of expiration, Ppl becomes slightly less negative, say ‑7.9 cmH2O. But Pl is still 8 cmH2O. Therefore,
PA = Pl + Ppl = +8 + (‑7.9) = +0.1 cmH2O.
In other words, PA > PB ; expiratory flow starts.

Dynamics of Flow
Expiratory Flow Limitation (not in Silverthorn; p. R13 in notes
Objectives: see notes, p. R13

Pressures and Flows during Breathing
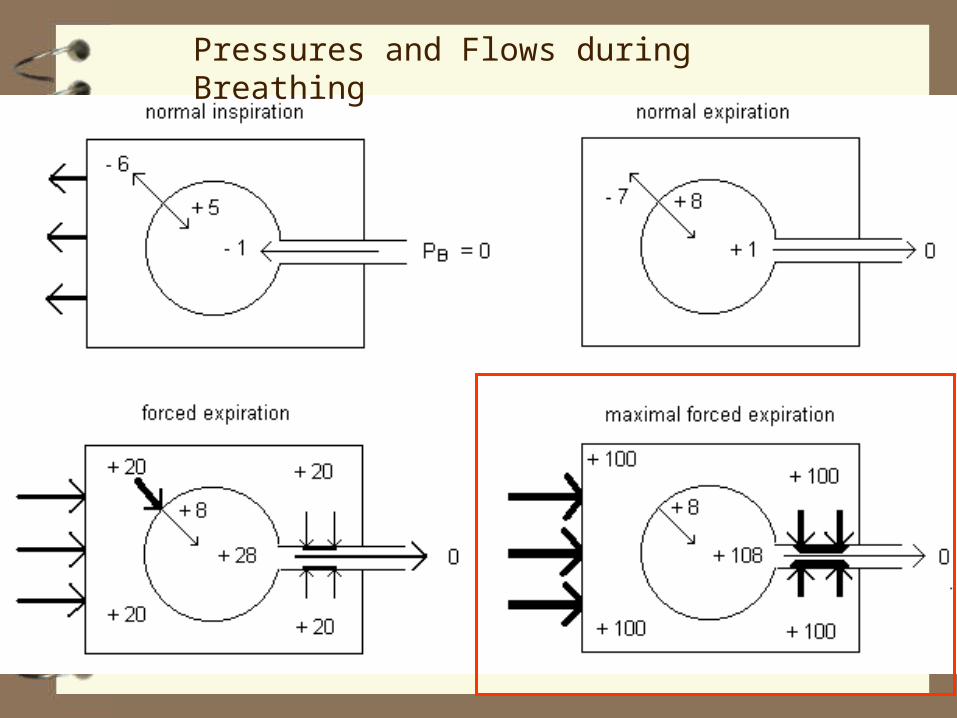
Pressures and Flows during Breathing

0
+108
+1
0
normal expiration
cough

Flow, Linear Velocity and Cross-Sectional Area
Appendix 3, Equation 6
flow (cm3/s) = cross-sectional area (cm2) × velocity (cm/s)
If flow remains constant but cross-sectional area decreases, linear velocity of the gas must increase.
In cough and sneeze, this is important because the kinetic energy of the expired gas must increase in order to have sufficient energy to move debris in the airways.
Kinetic Energy = ½ mass × velocity2

Fig. 17-13 (17-14)

Optimization of O2 Delivery to Alveoli
The lungs have two ventilatory functions ‑‑ move gas to and from the alveoli (convection) and provide a surface for gas exchange (diffusion). To optimize convection, the airways should be as large as possible (minimal resistance to flow). To optimize diffusion, there should be as many alveoli as possible (maximal area). These goals are incompatible; the lungs we have represent a compromise between alveolar and airway volume. When mammals breathe in, some gas stays in the airways ‑‑ the anatomic dead space VD (which affects alveolar ventilation, VA ‑‑ p. 565, 516, 494).
. .
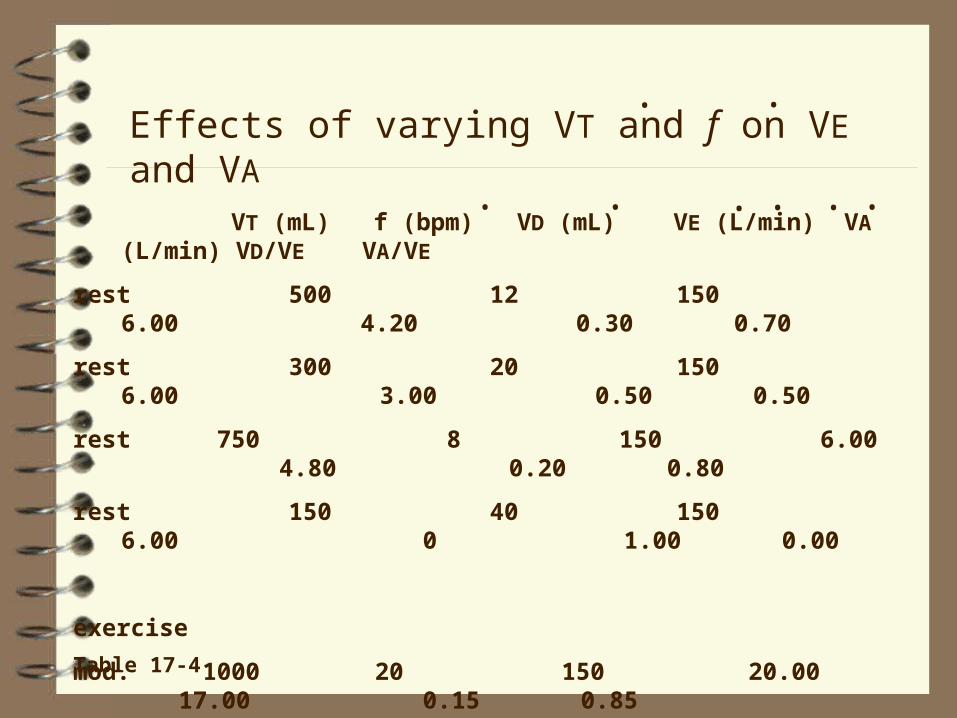
VT (mL) f (bpm) VD (mL) VE (L/min) VA (L/min) VD/VE VA/VE
rest 500 12 150 6.00 4.20 0.30 0.70
rest 300 20 150 6.00 3.00 0.50 0.50
rest 750 8 150 6.00 4.80 0.20 0.80
rest 150 40 150 6.00 0 1.00 0.00
exercise
mod. 1000 20 150 20.00 17.00 0.15 0.85
heavy 1500 30 150 45.00 40.50 0.10 0.90
... ...
Effects of varying VT and f on VE and VA..
Table 17-4

If maximizing VA represents the primary objective of breathing, then the ideal breathing pattern should consist of slow deep breathing pattern, when VT >> VD. (Indeed, during exercise, VT increases but VD does not, resulting in less "wasted ventilation".) But we do not breathe this way because of the
work of breathing
.
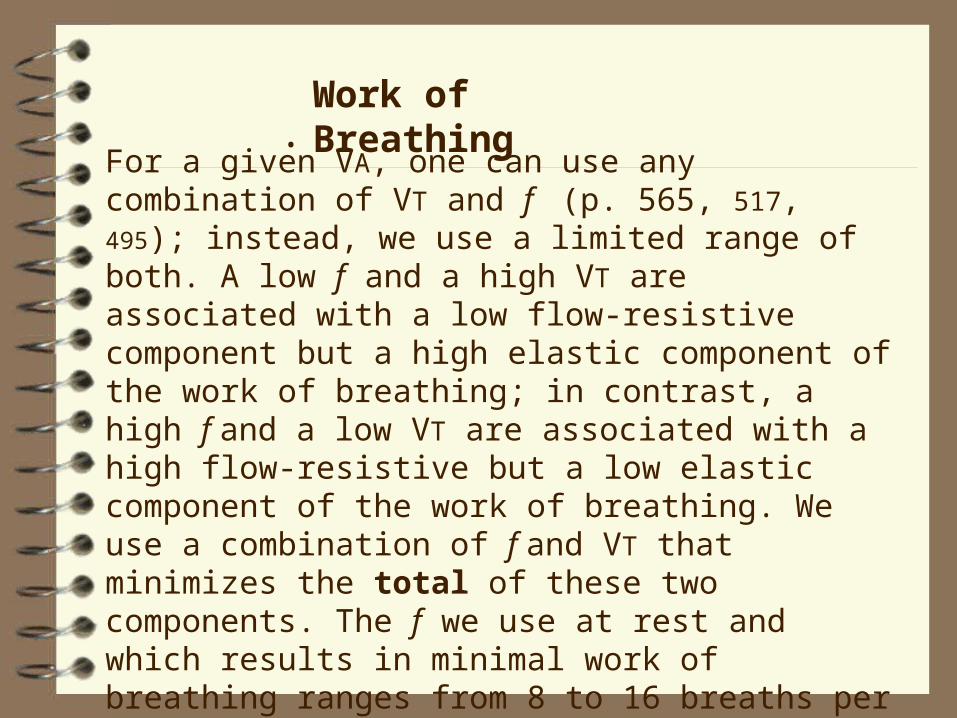
Work of Breathing
For a given VA, one can use any combination of VT and f (p. 565, 517, 495); instead, we use a limited range of both. A low f and a high VT are associated with a low flow‑resistive component but a high elastic component of the work of breathing; in contrast, a high f and a low VT are associated with a high flow‑resistive but a low elastic component of the work of breathing. We use a combination of f and VT that minimizes the total of these two components. The f we use at rest and which results in minimal work of breathing ranges from 8 to 16 breaths per minute.
.

flow-resistive work
elastic work
total workWork of breathing (at fixed VA)
Respiratory Frequency
.
range used
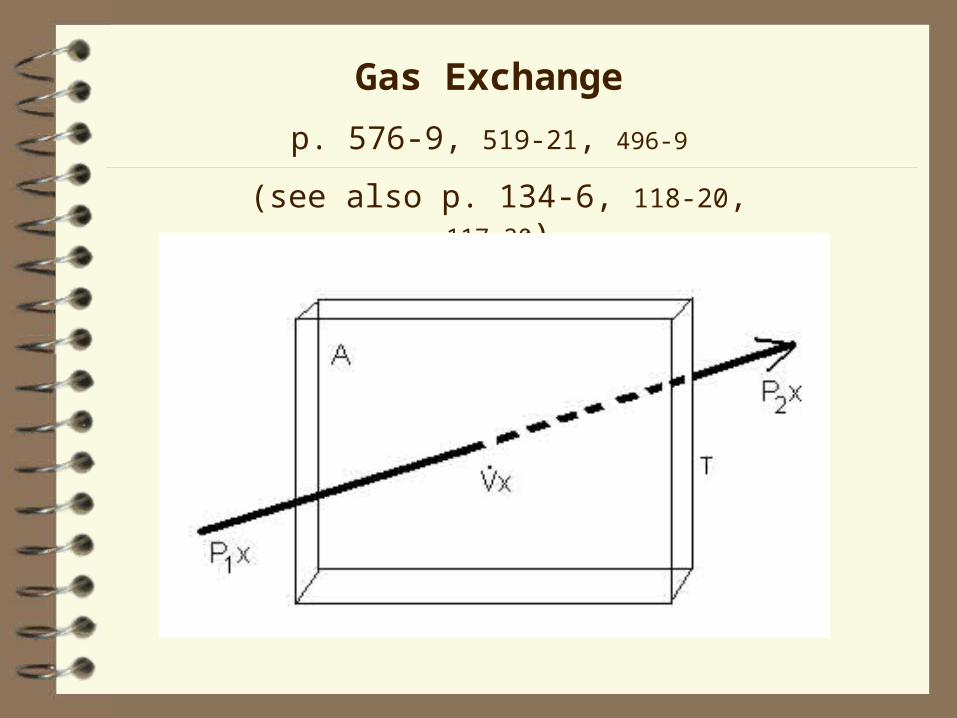
Gas Exchange
p. 576-9, 519-21, 496‑9
(see also p. 134-6, 118-20, 117‑20)

Gas Exchange
• diffusion of O2 from alveoli to pulmonary capillary blood
• diffusion of CO2 in the reverse direction.
Principles of diffusion are identical to those of convective flow:
• a pressure gradient ( ΔP)
• a resistance, R, related to the physical properties of the gas and the structures through which it diffuses.
For diffusion, ΔP is not hydraulic but based on the partial pressure of the gas (see below).

Fig. 18-2 17-6

Fig. 18-2 17-6

Fig. 18-2 17-6
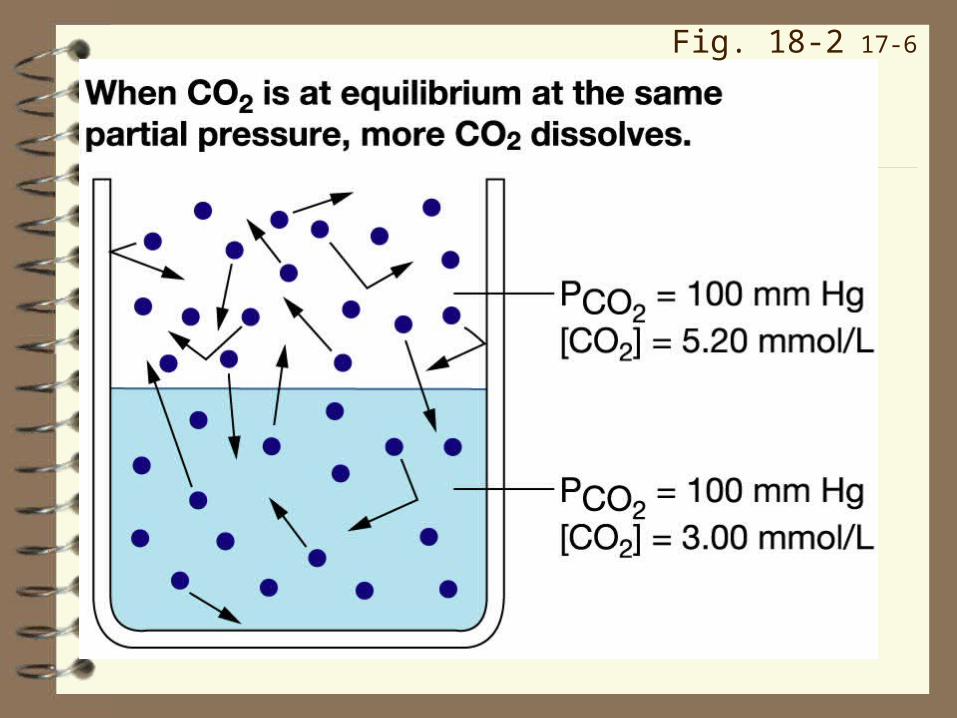
Fig. 18-2 17-6

The basic equation is:
Vgas = ΔP / R
R: for both O2 and CO2
R = T / AD
Where
A is the surface area available for diffusion
D is the diffusion constant for O2 or CO2, and
T is the thickness of the alveolar‑capillary membrane
Since D is constant for each gas,
R = T / A
.
(see p. 575, 3rd edition)

ΔP :
for O2, ΔP = PAO2 ‑ PvO2
for CO2, ΔP = PvCO2 ‑ PACO2
Therefore:
VO2 = (PAO2 ‑ PvO2) x A D / T
and
VCO2 = (PvCO2 ‑ PACO2) x A D / T
where VO2 and VCO2 are the diffusion rates of O2 and CO2.
These equations are another form of V = ΔP/R, where:
ΔP = (PAO2 ‑ PvO2) for O2,
or (PvCO2 ‑ PACO2) for CO2
.
...
.
-
-
-
-
-
-

R, referring to gas flux across a surface rather than bulk flow through a tube, is related to the
• Area for diffusion ( radius of tube, Poiseuille's Law)
• Thickness of the alveolar‑capillary membrane ( length of tube, Poiseuille's Law)
• Diffusibility of the gas ( viscosity of the fluid, Poiseuille's Law)
~
~~
~~
~~

In summary, we have:
a ΔP term (the gradient), and
a structural resistive term (T/A = thickness/area) which determines how easily the gas diffuses.
Because D for O2 and CO2 do not change, the only factors which affect diffusion of either gas are changes in:
PAO2 or PvO2 (for O2)
PACO2, PvCO2 (for CO2)
T, the diffusion distance
A, the surface area
-
-

Partial Pressure Gradients p. 576-7, 520-1, 497‑8
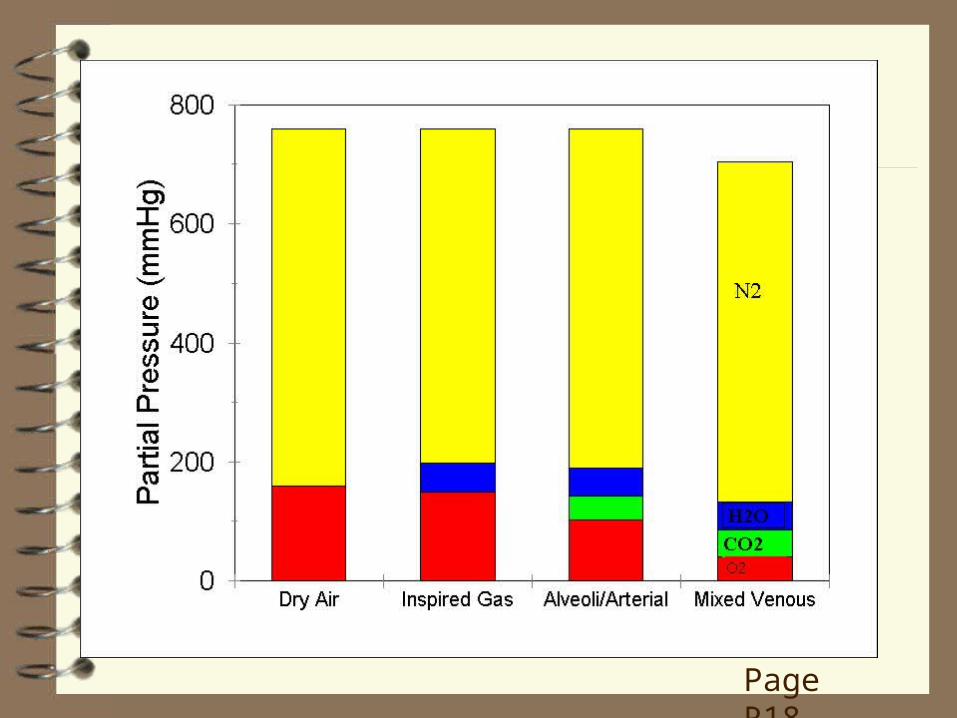
OXYGEN In dry air, the PO2 depends on its concentration in air, which is ~21% or 0.21. If PB = 760 mmHg, then the partial pressures of all gases must sum to 760 mmHg. Therefore, the PO2 is 0.21 x 760 = 160 mmHg (Dalton's Law of Partial Pressures) (p. 552-3, 503-4, 481).
During inspiration, the gas is saturated with H2O: at 37C, the PH2O is 47 mmHg. Therefore, all the other gases, including O2, must add up to 760‑47 = 713 mmHg. Since O2 occupies 0.21 of this, the PIO2 = 0.21 x 713 mmHg = 150 mmHg (p. 553, 504, 481).
In the alveoli, CO2 is also present. The PACO2 is ~40 mmHg. This reduces the PAO2 to ~100 mmHg (Silverthorn does not deal with this issue; p. 576, 520, Table 18-1, 17-7; not in 1st
edition).
Page R18

This value, 100 mmHg, represents the top end of the gradient causing diffusion of O2 into the pulmonary capillary blood.
At rest in a normal individual, the lower end of the gradient (i.e., in the mixed venous ( v ) blood, in the pulmonary artery and the start of the pulmonary capillaries) is ~40 mmHg (PvO2 = 40 mmHg). Therefore, the gradient for diffusion of O2 is 100 ‑ 40 = 60 mmHg.
-
-
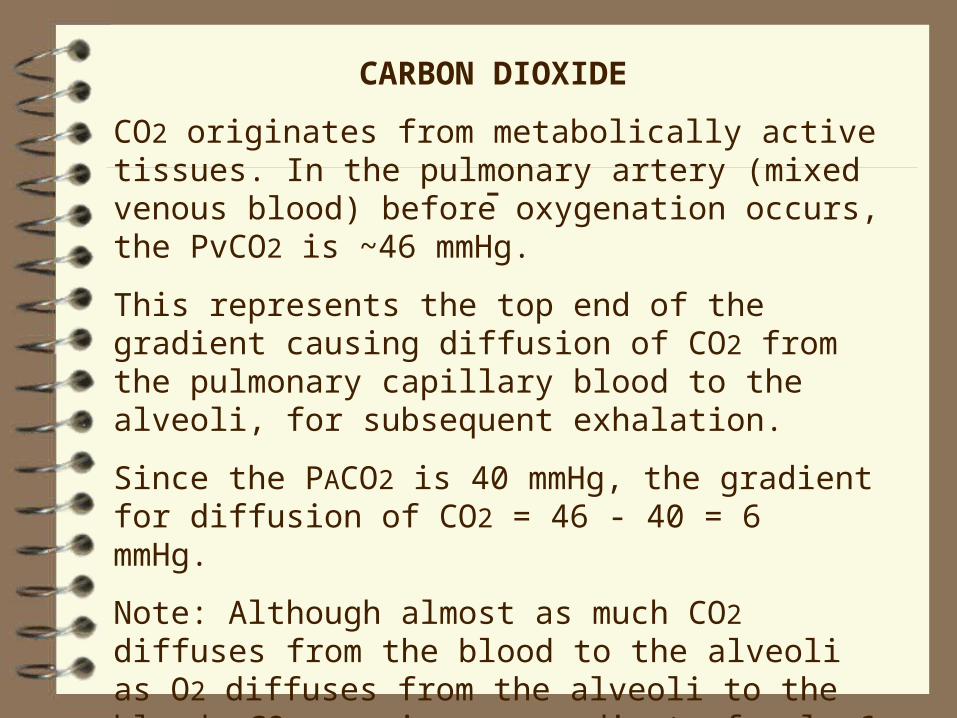
CARBON DIOXIDE
CO2 originates from metabolically active tissues. In the pulmonary artery (mixed venous blood) before oxygenation occurs, the PvCO2 is ~46 mmHg.
This represents the top end of the gradient causing diffusion of CO2 from the pulmonary capillary blood to the alveoli, for subsequent exhalation.
Since the PACO2 is 40 mmHg, the gradient for diffusion of CO2 = 46 ‑ 40 = 6 mmHg.
Note: Although almost as much CO2 diffuses from the blood to the alveoli as O2 diffuses from the alveoli to the blood, CO2 requires a gradient of only 6 mmHg compared to the 60 mmHg) required for O2. Why?
-

Effects of Airway and Blood Gases on Distribution of Gas and Blood Within the
Lung
(p. 566-7, 518, 496‑7; Table 17-6; Figure 17-16, 17-17)
Dynamics of Diffusion
(p. 576-7, 519, 497)
Transport of O2 and CO2 by Blood
(p. 579-87, 522-9, 500‑6)

Alveolar Gas Pressures: the Bathtub Analogy
Oxygen
Page R19

Alveolar Gas Pressures: the Bathtub Analogy
Carbon Dioxide
Page R19

Page R20
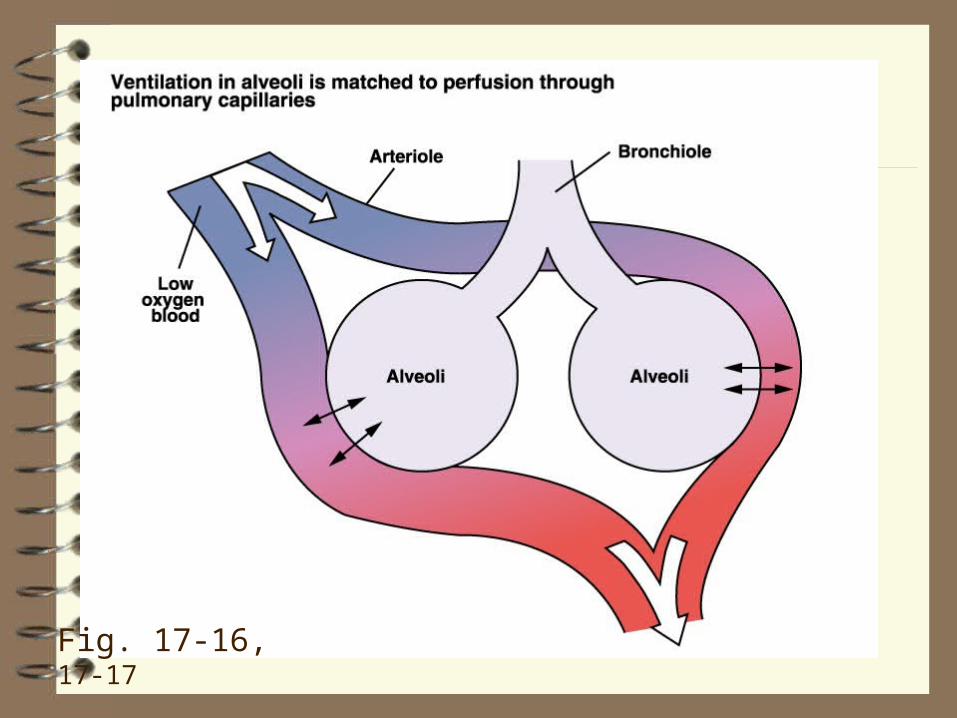
Fig. 17-16, 17-17

Fig. 17-16, 17-17

PO2 and PCO2
PO2 and PCO2
bronchoconstriction
vasoconstriction
bronchodilation
vasoconstriction

OXYGEN
Air contains about 21% O2, or about 210 ml O2 per litre of air; plasma, a water based solution, equilibrated with gas with a PO2 of 100 mmHg contains only 0.3% O2, or about 3 ml O2 per litre plasma.
At this concentration, delivering enough O2 to satisfy metabolic requirements would require a cardiac output of ~100 L/min, a value ~20 times that at rest and about triple the maximum during severe exercise.
Evolution has solved this problem in 'higher' animals by increasing the carrying capacity of blood with erythrocytes containing haemoglobin which reversibly binds O2.
Each litre of blood contains ~150 g of haemoglobin and each gram of haemoglobin binds 1.34 ml O2; therefore, a litre of blood, in addition to any dissolved O2, can bind about 200 ml O2.
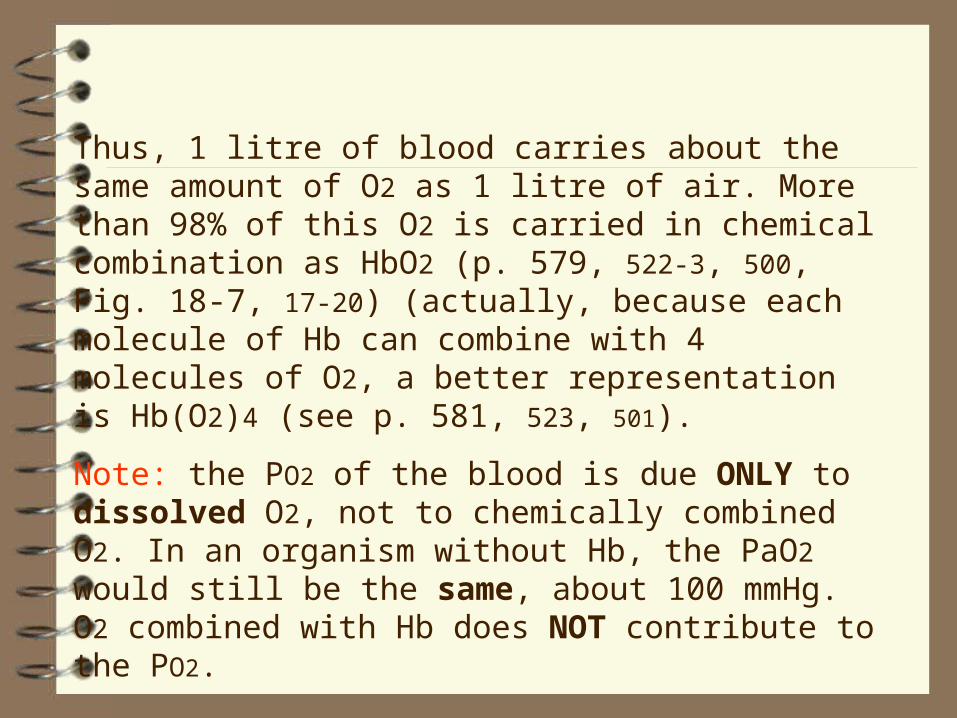
Thus, 1 litre of blood carries about the same amount of O2 as 1 litre of air. More than 98% of this O2 is carried in chemical combination as HbO2 (p. 579, 522-3, 500, Fig. 18-7, 17‑20) (actually, because each molecule of Hb can combine with 4 molecules of O2, a better representation is Hb(O2)4 (see p. 581, 523, 501).
Note: the PO2 of the blood is due ONLY to dissolved O2, not to chemically combined O2. In an organism without Hb, the PaO2 would still be the same, about 100 mmHg. O2 combined with Hb does NOT contribute to the PO2.

The O2 Dissociation Curve
Fig. 18-8 17-21

The O2 Dissociation Curve
steep part – for loading or unloading O2
plateau – prevents desaturation even if PO2 falls
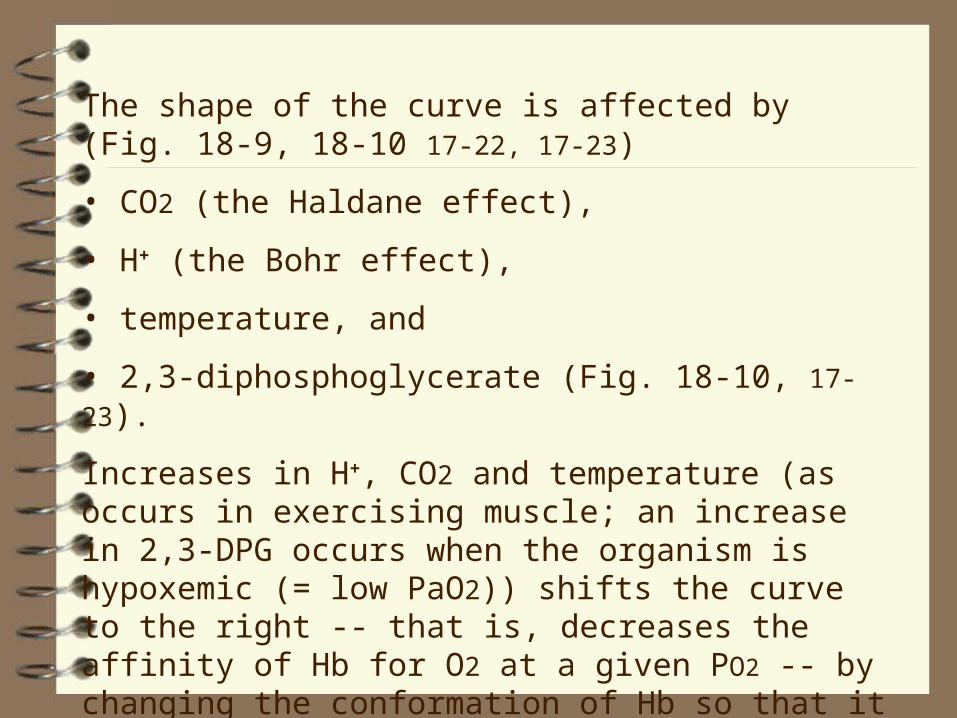
The shape of the curve is affected by (Fig. 18-9, 18-10 17-
22, 17‑23)
• CO2 (the Haldane effect),
• H+ (the Bohr effect),
• temperature, and
• 2,3‑diphosphoglycerate (Fig. 18-10, 17-23).
Increases in H+, CO2 and temperature (as occurs in exercising muscle; an increase in 2,3-DPG occurs when the organism is hypoxemic (= low PaO2)) shifts the curve to the right ‑‑ that is, decreases the affinity of Hb for O2 at a given PO2 ‑‑ by changing the conformation of Hb so that it binds less well to O2. This helps unload O2 to the tissue.

The rightward shift of the O2 dissociation curve due to increases in PCO2 is called the Haldane effect.
In other words, Hb can hold less O2 in the presence of a high CO2. This is good because it helps O2 unloading to cells of metabolically active tissues.
Effect of CO2 (Haldane effect)
Fig. 18-9c 17-22c
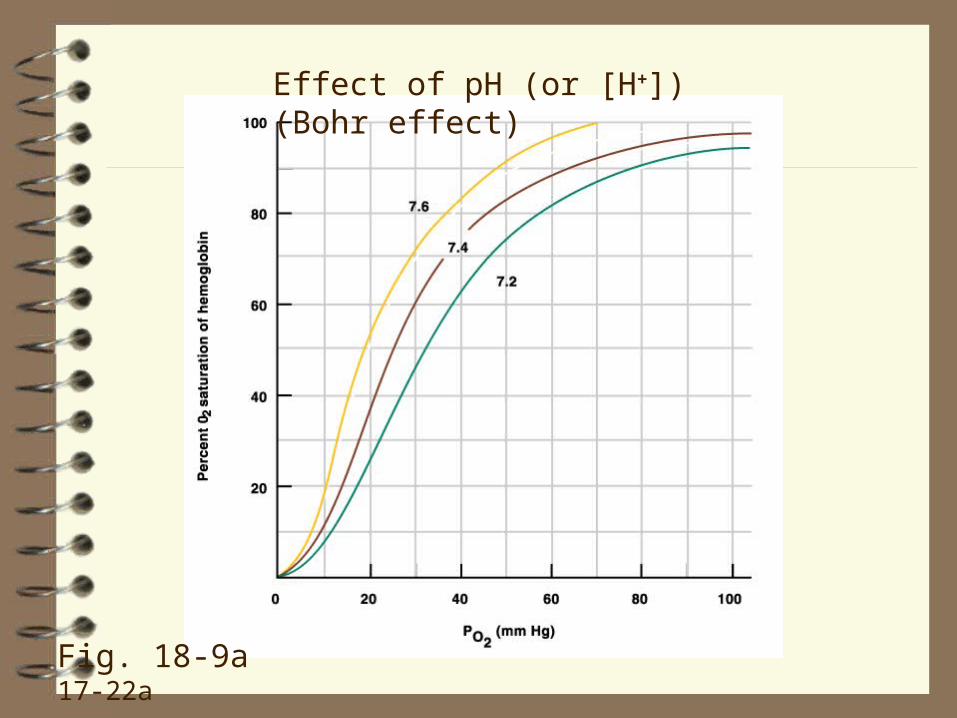
Effect of pH (or [H+]) (Bohr effect)
Fig. 18-9a 17-22a

Effect of Temperature
Fig. 18-9b 17-22b

The O2 Dissociation Curve200
100
0 O2
Con
cent
ratio
n (m
L O
2 / l
itre
bloo
d)

The O2 Dissociation Curve in Anemia
normalanemia
Despite a reduced O2 carrying capacity (for whatever reason), the O2 dissociation curve (when the Y axis is expressed as percent O2 saturation of Hb) is unaffected.

The O2 Dissociation Curve in Anemia (2)
200
100
0 O2
Con
cent
ratio
n (m
L O
2 / l
itre
bloo
d)
When the O2 dissociation curve is expressed as O2 content, the curve shifts down (in this case, by 50% since the Hb concentration is reduced by half.

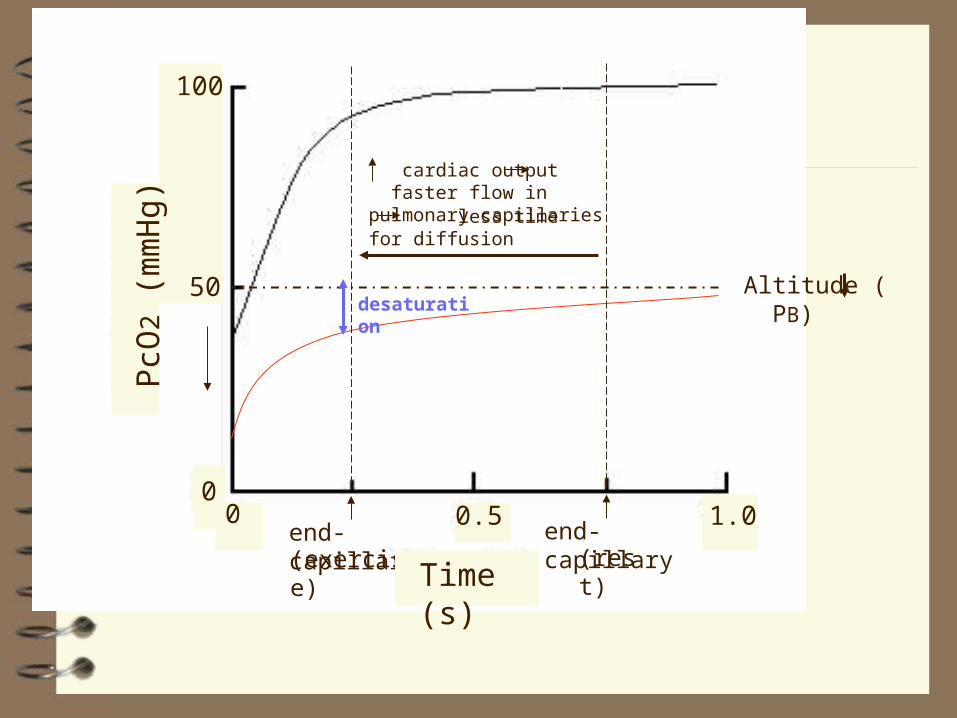
Dynamics of Diffusion of Gases at the
Alveolar-Pulmonary Capillary Interface
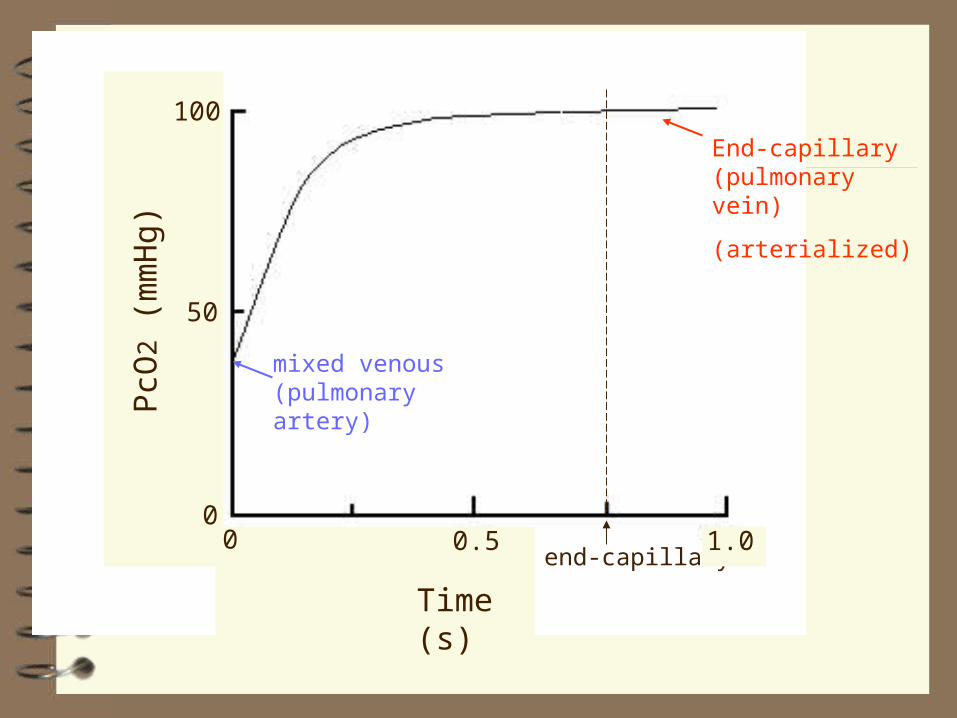
end-capillary0 0.5
01.0
50
100
Time (s)
PcO
2 (
mm
Hg)
mixed venous (pulmonary artery)
End-capillary (pulmonary vein)
(arterialized)

Altitude ( PB)
end-capillary0.5
01.0
50
100
Time (s)
PcO
2 (
mm
Hg)
0

Altitude ( PB)
PvO2 ΔPO2
end-capillary0.50
1.0
50
100
Time (s)
PcO
2 (
mm
Hg)
0
Altitude ( PB)
end-capillary(rest)
end-capillary(exercise)
desaturation
cardiac output faster flow in pulmonary capillaries less time for diffusion
0.5 1.0
50
100
Time (s)
PcO
2 (
mm
Hg)
00

CARBON DIOXIDE
p. 584-6, 527-9, 504‑6
CO2 is relatively soluble in water/plasma/blood. Thus ~7% (as opposed to O2's 0.3%, i.e., ~ 20 times as much, reflecting CO2’s 20 x solubility) of CO2 is transported as CO2 dissolved in plasma and red blood cells.
(Note: The percentages in which CO2 is carried in blood differ according to who you read; I have used the values given in Silverthorn.
The values also depend on the site of sampling, arterial or venous).
About 23% of CO2 chemically combines with Hb as carbaminohaemoglobin (HbCO2). Loss of O2 from Hb increases Hb's affinity for CO2.
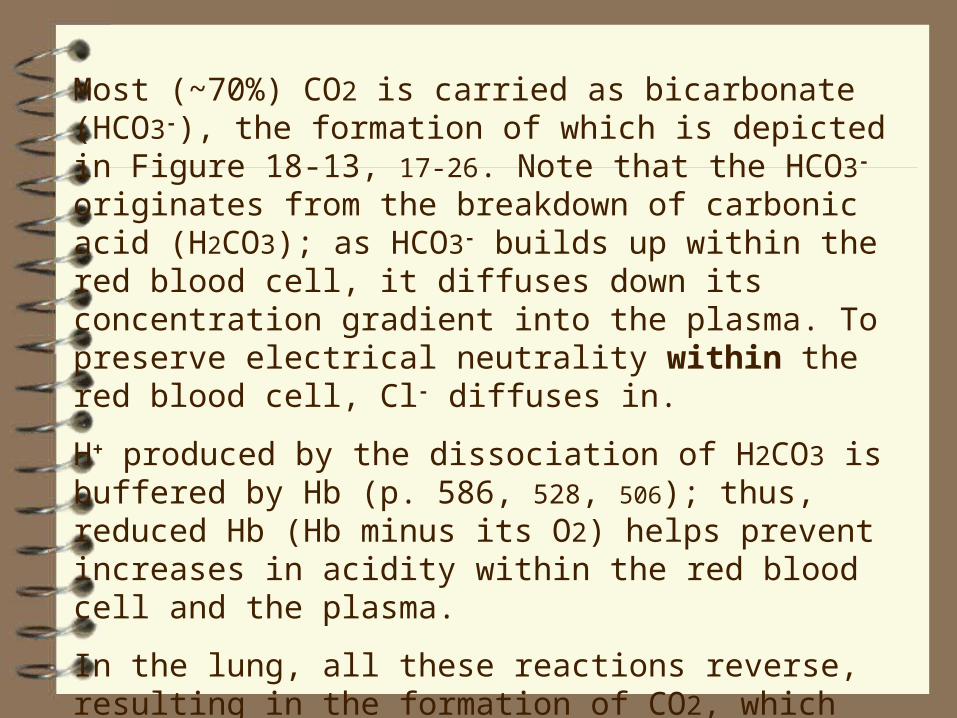
Most (~70%) CO2 is carried as bicarbonate (HCO3‑), the formation of which is depicted in Figure 18-13, 17-26. Note that the HCO3‑ originates from the breakdown of carbonic acid (H2CO3); as HCO3‑ builds up within the red blood cell, it diffuses down its concentration gradient into the plasma. To preserve electrical neutrality within the red blood cell, Cl‑ diffuses in.
H+ produced by the dissociation of H2CO3 is buffered by Hb (p. 586, 528, 506); thus, reduced Hb (Hb minus its O2) helps prevent increases in acidity within the red blood cell and the plasma.
In the lung, all these reactions reverse, resulting in the formation of CO2, which then diffuses into the alveoli for exhalation.

CO2 Transport
CO2 + H2O H2CO3 H+ + HCO3-
carbonic anhydrase
Fig. 18-13, 17-26
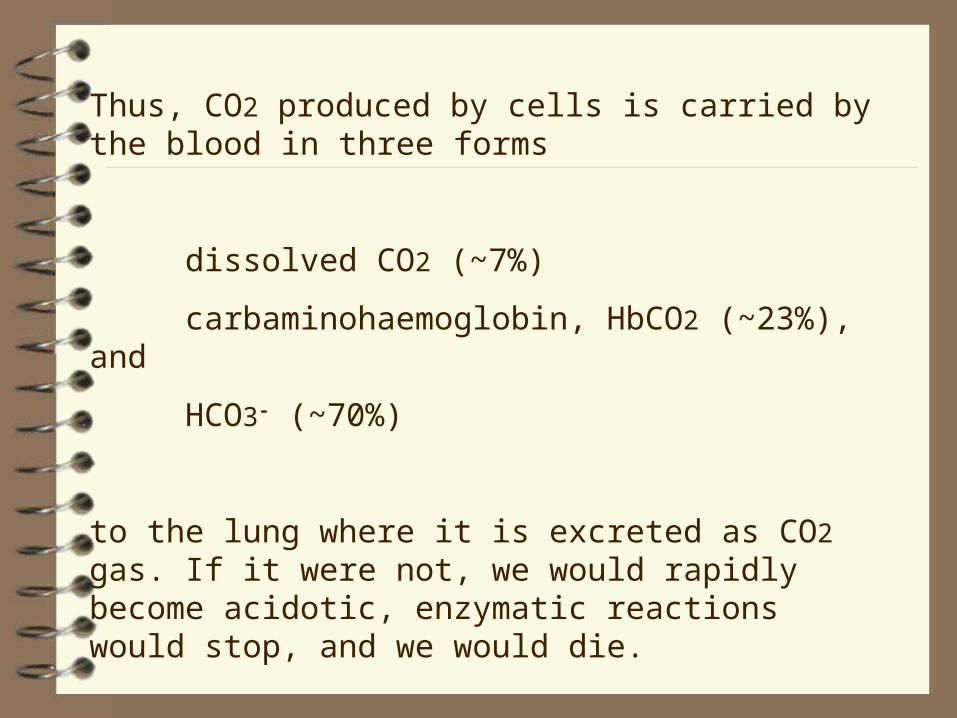
Thus, CO2 produced by cells is carried by the blood in three forms
dissolved CO2 (~7%)
carbaminohaemoglobin, HbCO2 (~23%), and
HCO3‑ (~70%)
to the lung where it is excreted as CO2 gas. If it were not, we would rapidly become acidotic, enzymatic reactions would stop, and we would die.

Control of Ventilation
p. 587-92, 529-35, 506‑13
Objectives : see page R23
(see Fig. 18-19, 17-32, 18-18 17-31; 20-19 19-19 for respiratory acidosis)
All control systems include:
• sensors (to monitor controlled variables)
• controller(s), and
• effector(s).
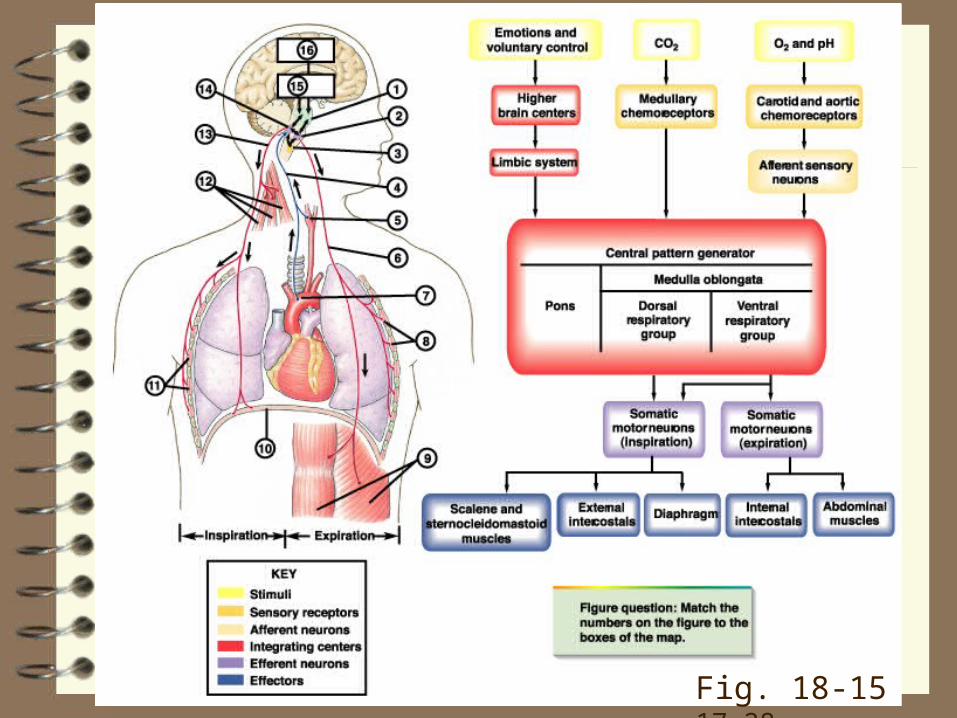
Fig. 18-15 17-28

Sensors: monitor the levels of O2, H+, and, especially, CO2 in the blood (or tissues) with special cells called chemoreceptors. They signal the
Controller(s) neurons in the respiratory control centres in the brainstem, which then signal the
Effectors, respiratory pump (inspiratory and expiratory) muscles or airway smooth muscle
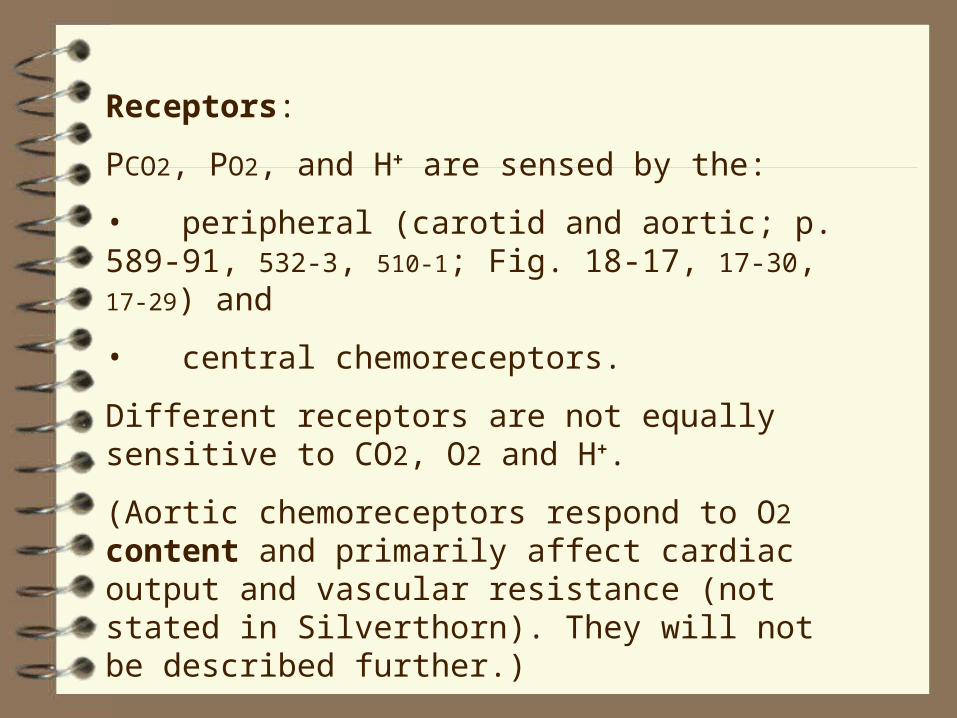
Receptors:
PCO2, PO2, and H+ are sensed by the:
• peripheral (carotid and aortic; p. 589-91, 532-3, 510‑1; Fig. 18-17, 17-30, 17-29) and
• central chemoreceptors.
Different receptors are not equally sensitive to CO2, O2 and H+.
(Aortic chemoreceptors respond to O2 content and primarily affect cardiac output and vascular resistance (not stated in Silverthorn). They will not be described further.)

Fig. 18-19 17-32
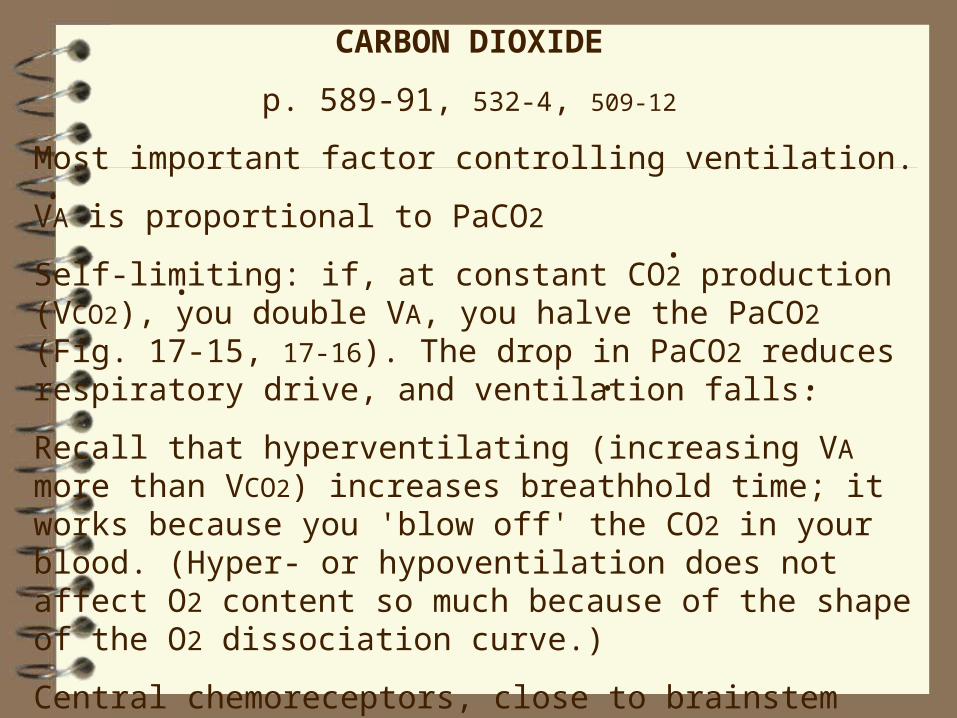
CARBON DIOXIDE
p. 589-91, 532-4, 509‑12
Most important factor controlling ventilation.
VA is proportional to PaCO2
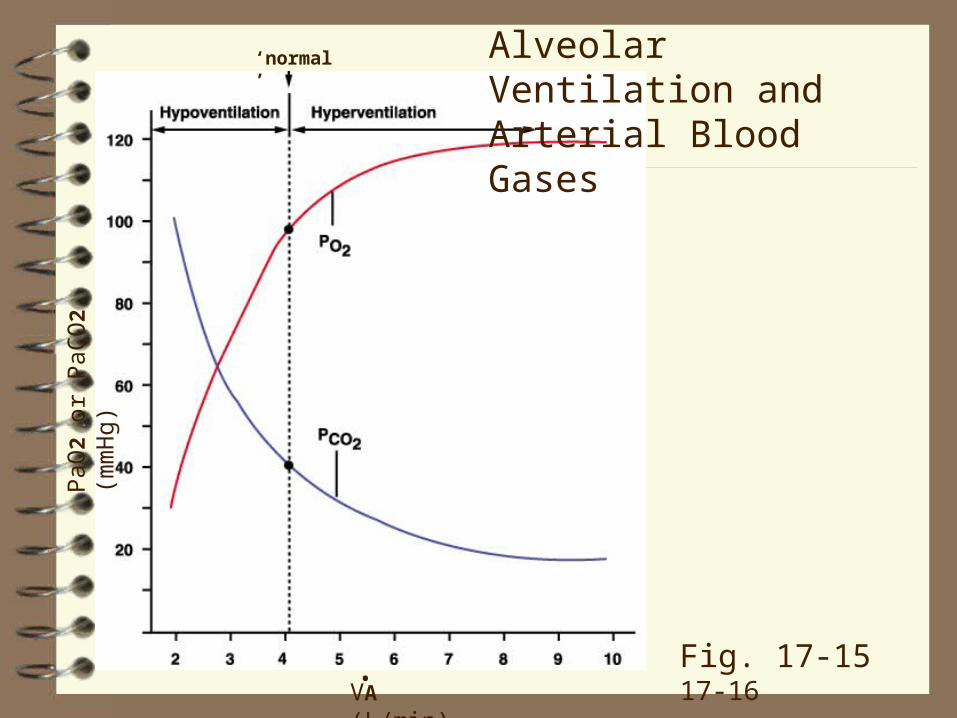
Self‑limiting: if, at constant CO2 production (VCO2), you double VA, you halve the PaCO2 (Fig. 17-15, 17‑16). The drop in PaCO2 reduces respiratory drive, and ventilation falls.
Recall that hyperventilating (increasing VA more than VCO2) increases breathhold time; it works because you 'blow off' the CO2 in your blood. (Hyper‑ or hypoventilation does not affect O2 content so much because of the shape of the O2 dissociation curve.)
Central chemoreceptors, close to brainstem respiratory neurons and the cerebrospinal fluid, are responsible for ~65% of the ventilatory response to CO2.
..
.
..
PaO
2 or
PaC
O2
(mm
Hg)
VA (L/min).
‘normal’ Alveolar Ventilation and Arterial Blood Gases
Fig. 17-15 17-16

2 x VA.
VA (L/min)
PaO
2 or
PaC
O2
(mm
Hg)
.
Note:
Doubling VA halves PaCO2 but does not double PaO2.
Why?
‘normal’
.
Alveolar Ventilation and Arterial Blood Gases

Standard Story
(See textbook p. 590, 533, 511‑2, Figs. 18-17, 17‑30 and 18-18 17‑31; even better p. 647-8, 591-2, 566-7).
Increased CO2 increases [H+] which stimulates the central chemoreceptors. (This is a hypothesis, not fact.) Brain [H+] does reflect CO2 levels (law of mass action, p. 590, 533, 511 and 647-8, 591-2, 565).
Peripheral (carotid) chemoreceptors are activated by increases in PCO2. Their increased input to the respiratory centres contributes to the increase in ventilation. But at least 65% of the ventilatory response to CO2 remains after cutting their afferents.

Fig. 18-18, 17-31
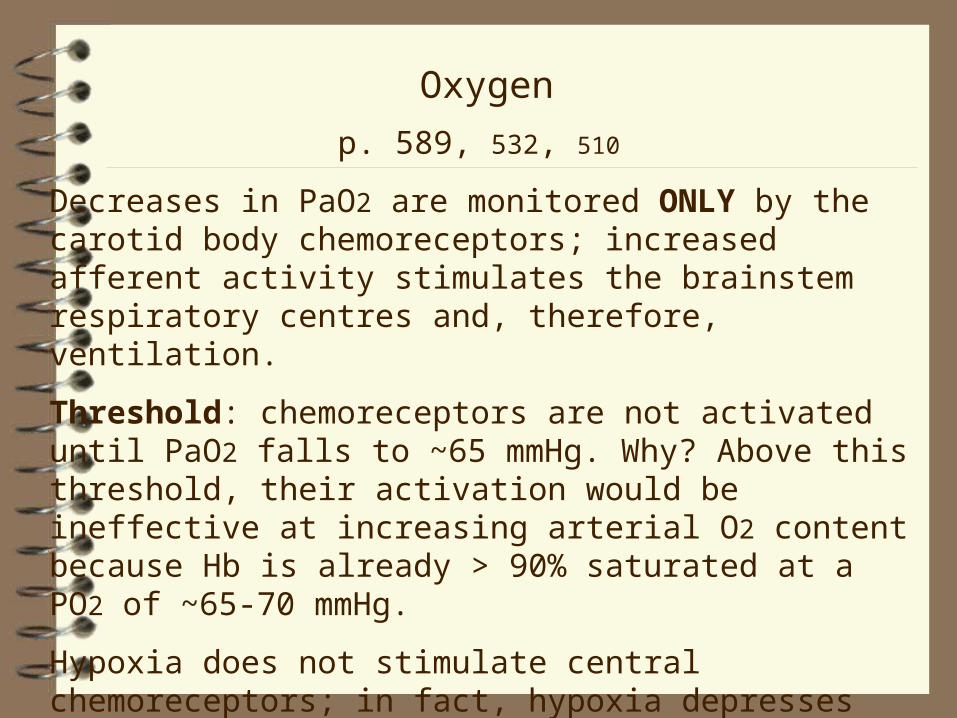
Oxygen
p. 589, 532, 510
Decreases in PaO2 are monitored ONLY by the carotid body chemoreceptors; increased afferent activity stimulates the brainstem respiratory centres and, therefore, ventilation.
Threshold: chemoreceptors are not activated until PaO2 falls to ~65 mmHg. Why? Above this threshold, their activation would be ineffective at increasing arterial O2 content because Hb is already > 90% saturated at a PO2 of ~65‑70 mmHg.
Hypoxia does not stimulate central chemoreceptors; in fact, hypoxia depresses (often after a transient excitation) neurons of the central nervous system. Thus, the ventilatory response to hypoxia requires the carotid chemoreceptors.

H+
pp. 689-91, 532-4, 511‑2 and 647-53, 590-7, 563‑7
Peripheral chemoreceptors also respond to changes in [H+] independent of changes in PCO2 (e.g., metabolic acidosis in a diabetic). The increase in ventilation represents a respiratory compensation for a metabolic problem.
Use of the lungs to excrete CO2 has a major advantage: it is fast (the response occurs in minutes versus hours or days using the kidneys).
This important topic is covered in Ch. 20, 19, especially pp. 647-53, 590-7, 563‑571).
The Central Controller
p. 587-9, 530-2, 506-9
Breathing requires neurons in the brainstem (unlike the heart beat which originates in specialized pacemaker cells of the heart; the heart rate can be modified, but not initiated, by cells in the brainstem).
Pacemaker cells may be important in newborn mammals, but there appears to be a rapid switch to a respiratory "network" (i.e., based on connections between populations of cells).
How respiratory rhythm originates and is maintained is still incompletely understood.
Negative Feedback
The Breuer‑Hering Reflexes
p. 592, 535, 512‑3
The first example of biological feedback.
Lung inflation prematurely terminated inspiration and delayed the onset of the next inspiration. In contrast, prevention of inspiration prolonged the duration of the inspiratory effort and delayed the onset of the next expiration.
Thus, lung inflation reflexly results in its termination, a process Breuer and Hering referred to as "selbst‑steurung" (or self‑steering; the term "feedback" did not exist).
The reflex is present in most anesthetized animals and newborn animals, but is weak, absent, or too subtle to detect in non‑anesthetized animals, especially adults.
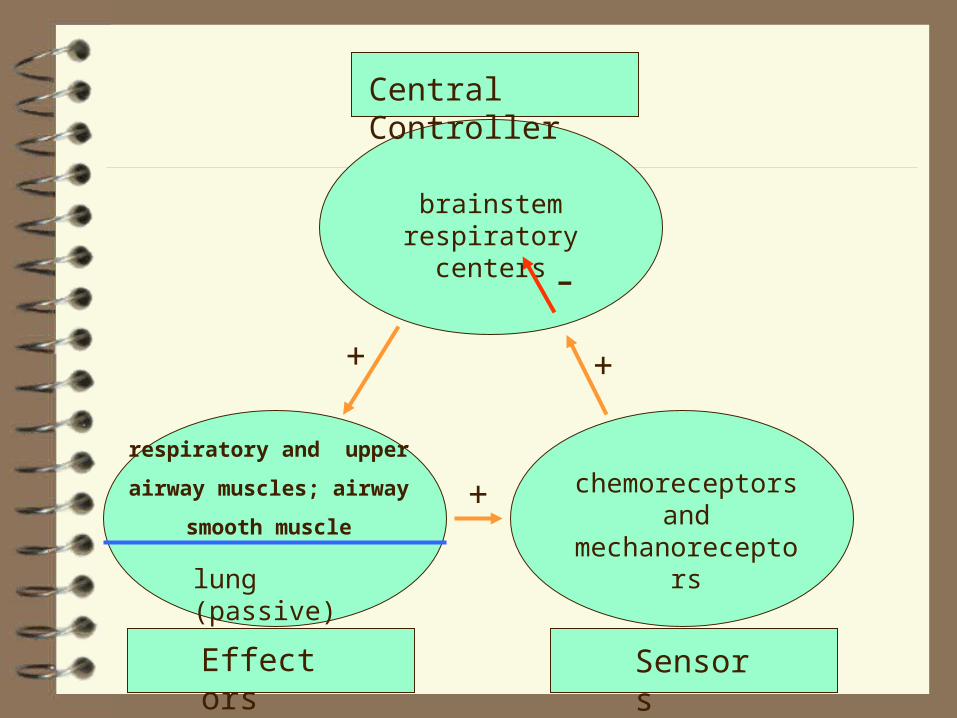
Central Controller
respiratory and upper
airway muscles; airway
smooth muscle
lung (passive)
brainstem respiratory centers
Effectors Sensors
chemoreceptors and
mechanoreceptors
+
+
+
-

Central Controller
phrenic motoneurons
brainstem respiratory centers
Effectors Sensors
Mechanoreceptors (pulmonary slowly adapting
receptors)
+
+
+
-
diaphragm
lung
Vagus nerve
Descending nerves (bulbo-spinal axons in spinal cord)
Breuer-Hering reflex
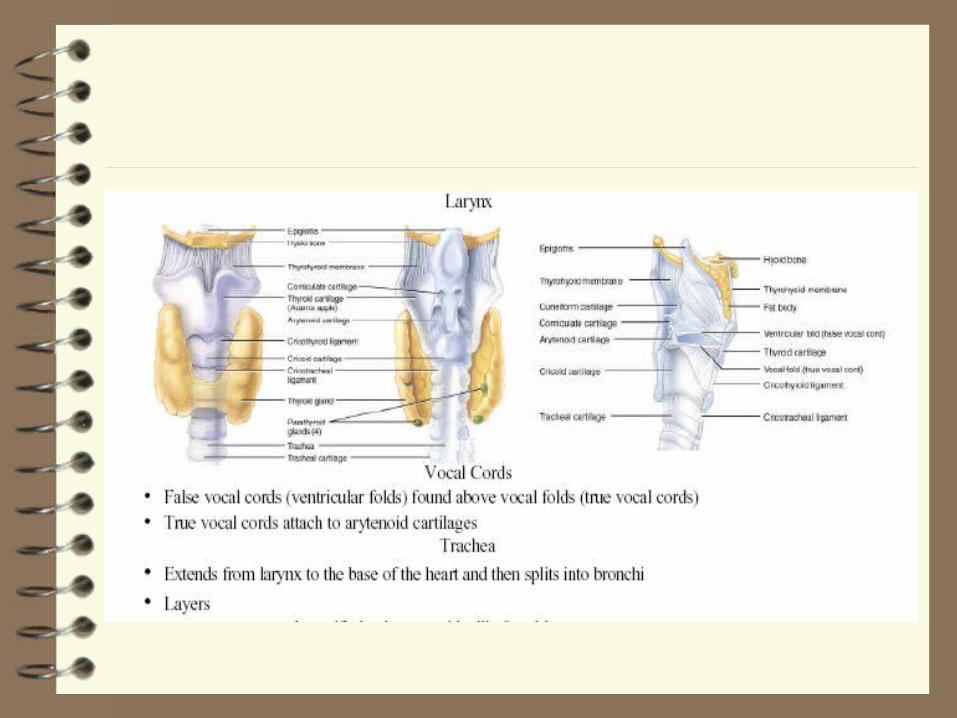

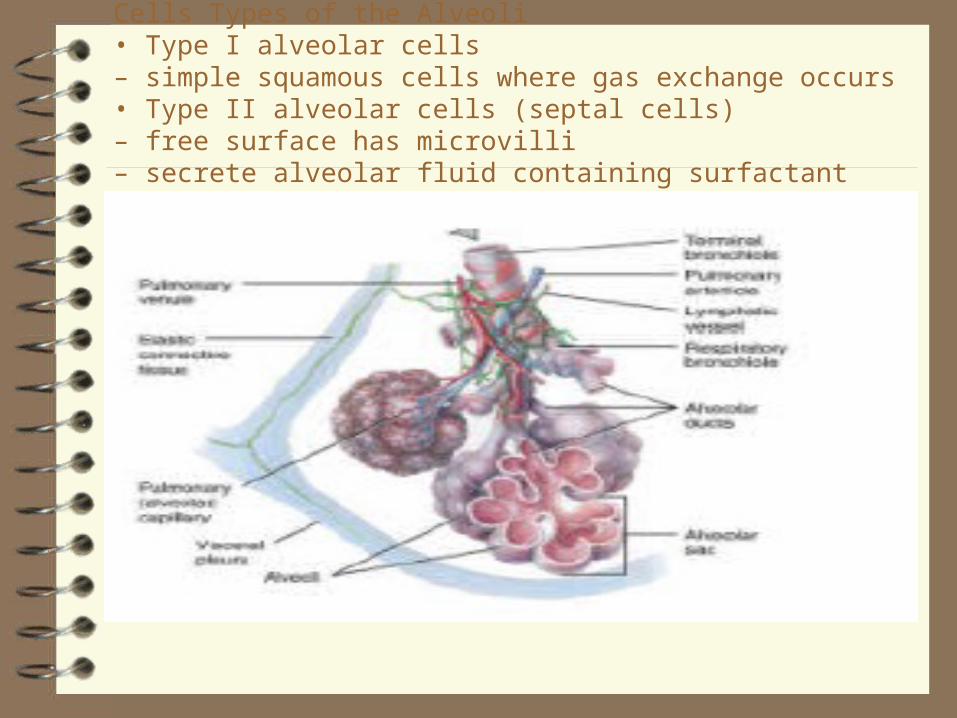
Cells Types of the Alveoli• Type I alveolar cells– simple squamous cells where gas exchange occurs• Type II alveolar cells (septal cells)– free surface has microvilli– secrete alveolar fluid containing surfactant
