pulmonary gas exchange - carefusion.co.uk · knowledge about pulmonary gas exchange, which is...
TRANSCRIPT
CHAPTER 6
Pulmonary gas exchange
J.M.B. Hughes
National Heart and Lung Institute, Imperial College Faculty of Medicine, Hammersmith Hospital, London,UK.
Correspondence: J.M.B. Hughes, 4 Cedars Road, London SW13 0HP, UK.
In this "overview", pulmonary gas exchange is considered in three sections. The firstsection (Normal values, Causes of hypoxaemia I, Respiratory failure) contains "basic"knowledge about pulmonary gas exchange, which is relevant to all who work in clinicalmedicine. Normal values for arterial oxygen partial pressure, content and Hb saturation(Pa,O2, Ca,O2, Sa,O2) are reviewed, and ventilation–perfusion mismatch and alveolarhypoventilation are highlighted as the two commonest causes of a low Pa,O2 andrespiratory failure. Different types of respiratory failure are discussed, with specialemphasis on the hypoxaemia and hypercapnia occurring in chronic obstructivepulmonary disease (COPD) patients in failure (alveolar ventilation–perfusion (V9A/Q9)mismatch effect) and the rise in arterial carbon dioxide partial pressure (Pa,CO2) withuncontrolled O2 therapy (alveolar hypoventilation effect).
The next section (Oxygen carriage in blood, Heterogeneity of ventilation andperfusion, Causes of hypoxaemia II) focuses on "intermediate" knowledge, with which allrespiratory specialists should be familiar. First, the relationship between oxygen content(CO2) (and oxygen Hb saturation (SO2)) and oxygen partial pressure (PO2), the so-calledoxygen dissociation curve (ODC), is introduced. The P50 (partial pressure at halfmaximum blood concentration) for oxygen is defined. Heterogeneity of V9A and Q9
(leading to V9A/Q9 mismatch) is analysed using the PO2–PCO2 diagram, the Riley threecompartment model (physiological shunt flow/total pulmonary blood flow [Q9s/Q9T] anddead space (dead space/tidal volume [VD/VT])), and the ideal alveolar–arterial PO2
gradient. The causes of hypoxaemia are outlined, and a possible overlap betweenintrapulmonary shunt and diffusion limitation is discussed using the hepatopulmonarysyndrome as an example. The theoretical basis of transcutaneous measurements of Pa,O2
and Pa,CO2 (high skin blood flow and a narrow arteriovenous partial pressure difference)and Sa,O2 is mentioned.
The last section (Oxygen affinity in special situations, Diffusion, Inert gas transport)contains "advanced" knowledge, appropriate for staff in intensive care units,anaethesiology or rehabilitation, or those undertaking research. The P50 for oxygen isreviewed in special situations (right shift in exercise and some haemoglobinopathies, leftshift in CO poisoning, in utero and on the Mt Everest summit). The importance of gasphase diffusion within the acinus is emphasised. The pathogenesis of alveolar–capillarydiffusion and diffusion limitation for oxygen on exercise (in lung fibrosis and at extremealtitude) is explained. Lastly, inert gas transport is reviewed, focusing on the multipleinert gas elimination technique (MIGET), a sophisticated analysis of V9A/Q9 mismatch,which has provided information on the pathogenesis of hypoxaemia in different clinicalsituations.
Eur Respir Mon, 2005, 31, 106–126. Printed in UK - all rights reserved. Copyright ERS Journals Ltd 2005.
106

Normal values
Arterial oxygen tension
Pa,O2 in normal subjects is affected by several factors: age, body mass index (BMI),posture, altitude and inspired oxygen fraction (FI,O2: normal=0.21 or 21%).
The units of Pa,O2, Pa,CO2 are kilopascals (kPa) in Europe, but mmHg in North America(1 kPa=7.5 mmHg).
Pa,O2(kPa)~19:15{(0:052|age){(0:075|BMI){(0:076|Pa,CO2) ½SEE 1:0� ð1ÞThese values [1] were established in lifelong nonsmoking subjects with normalpulmonary function. Pa,O2 on average declines by 0.55 kPa per 10 yrs from 13.3 kPaat age 20 yrs to 10.7 kPa at age 70 yrs. Pa,O2 rises by about 1.3 kPa in pregnancy(with a corresponding fall in Pa,CO2) [2], but there are no other sex effects. The fall inPa,O2 with age is caused by an increase in V9A/Q9 mismatching. In obese middle agedand elderly subjects, Pa,O2 is lower in the supine position [3] due to dependent zonebronchiolar collapse (and possibly atelectasis). People living or climbing at altitude,or flying in pressurised aircraft at 9,850–10,770 m have a reduced partial pressure ofinspired oxygen (PI,O2) and, as a result, a low Pa,O2 [4]. They may compensate, to someextent, by hyperventilating, which lowers Pa,CO2 and raises Pa,O2 (by a roughlyequivalent amount). The FI,O2 of air (y21%) is unchanged at altitude, but totalbarometric pressure and the partial pressures of O2 and N2 fall.
Clinically, FI,O2 is often increased as a therapeutic measure; if 100% O2 is breathed atsea level, Pa,O2 in normal subjects may rise from 13.3 to 80 kPa. It is important to knowthe inspired concentration of oxygen when interpreting a Pa,O2 value.
The Pa,CO2 is not affected by age, but it is lowered by hyperventilation, the usual causesbeing hypoxaemia, metabolic acidosis (e.g. diabetic) and anxiety.
Arterial oxygen content and saturation
Breathing air, 98.5% of oxygen in arterial blood is bound to haemoglobin. At a"normal" Hb concentration (say 14.8 g?dL-1) each litre of arterial blood carries 200 mLof oxygen, but only 100 mL?L-1 if [Hb] is 7.4 g?dL-1. At rest, the arteriovenous (a–v)oxygen content difference is 50 mL?L-1 so that mixed venous blood (assuming a normalcardiac output) contains 150 mL?L-1 (75% of the arterial value), but only 50 mL?L-1
(25% of the normal arterial content) at [Hb] 7.4 g?dL-1.Ca,O2 is not measured routinely. It can be calculated (in mL?L-1) by plotting Pa,O2 on a
standard oxygen dissociation curve (ODC) (see section Oxygen carriage in blood and fig. 1)reading off the percentage saturation of Hb (HbO2) with oxygen at that Pa,O2 and thenmultiplying by the [Hb] and the O2 capacity of blood (1.39 g?dL-1). Nevertheless, it is nowvery easy to measure HbO2 % saturation with a pulse oximeter attached to a finger or an earlobe. Pulse oximetry detects light transmitted at two wavelengths, corresponding todeoxygenated and oxygenated haemoglobin. The signal is the difference in absorbancebetween the peripheral systolic pulse wave and the subsequent diastole, a difference ofonly 1–10% of the total light absorbance. Carboxyhaemoglobin (HbCO) (and met-haemoglobin) absorb light at the same wavelength as deoxyhaemoglobin, so that HbO2 %is overestimated in the presence of HbCO.
The requirements and reservations of pulse oximetry (Sp,O2) are shown in table 1. Withthese reservations, pulse oximetry is acceptably accurate at rest and on exercise whencompared with simultaneous estimates of Sa,O2 from arterial blood samples (v2%difference between estimates) [5]. The weakness of pulse oximetry is that it is insensitive
GAS EXCHANGE PRINCIPLES
107
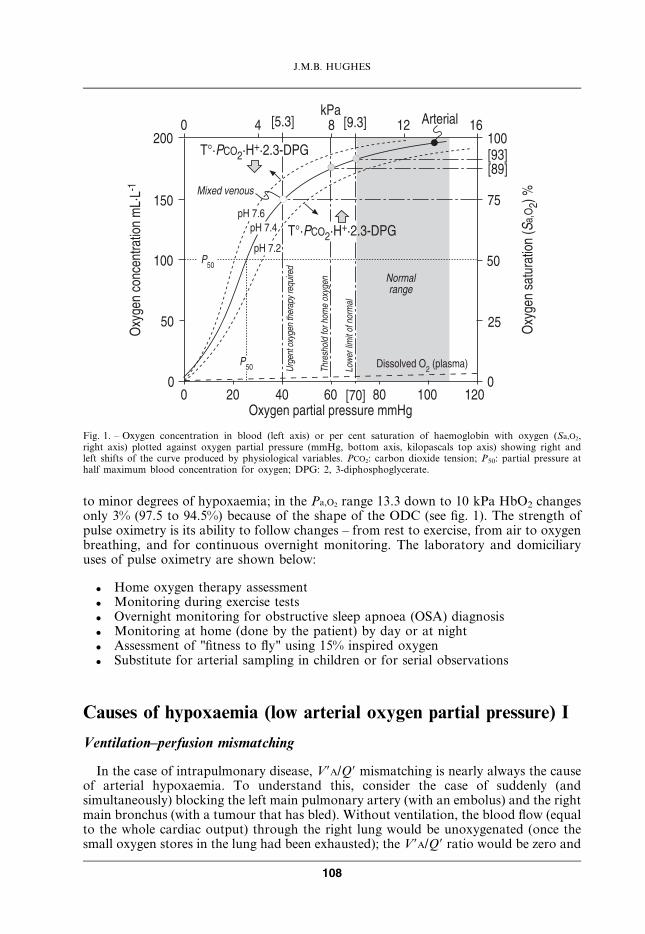
to minor degrees of hypoxaemia; in the Pa,O2 range 13.3 down to 10 kPa HbO2 changesonly 3% (97.5 to 94.5%) because of the shape of the ODC (see fig. 1). The strength ofpulse oximetry is its ability to follow changes – from rest to exercise, from air to oxygenbreathing, and for continuous overnight monitoring. The laboratory and domiciliaryuses of pulse oximetry are shown below:
. Home oxygen therapy assessment
. Monitoring during exercise tests
. Overnight monitoring for obstructive sleep apnoea (OSA) diagnosis
. Monitoring at home (done by the patient) by day or at night
. Assessment of "fitness to fly" using 15% inspired oxygen
. Substitute for arterial sampling in children or for serial observations
Causes of hypoxaemia (low arterial oxygen partial pressure) I
Ventilation–perfusion mismatching
In the case of intrapulmonary disease, V9A/Q9 mismatching is nearly always the causeof arterial hypoxaemia. To understand this, consider the case of suddenly (andsimultaneously) blocking the left main pulmonary artery (with an embolus) and the rightmain bronchus (with a tumour that has bled). Without ventilation, the blood flow (equalto the whole cardiac output) through the right lung would be unoxygenated (once thesmall oxygen stores in the lung had been exhausted); the V9A/Q9 ratio would be zero and
��� ���
���
���
��
�
� � � �� ��
��
��
��
����������������
�� ������������ ���� �����
�� ������ ���������������
� �
�� �������������!��"�#�$
%�&'( %)&'( *�� ����
%)'(%�)(
%��(
����������
����&�����&�
����&� ��
��
���������
+,� -���.��&'�/ 0
+,� -���.��&'�/ 0
/�����1 2���!������#���������������������������
��������������������
�����������������
�
��
�
Fig. 1. – Oxygen concentration in blood (left axis) or per cent saturation of haemoglobin with oxygen (Sa,O2,right axis) plotted against oxygen partial pressure (mmHg, bottom axis, kilopascals top axis) showing right andleft shifts of the curve produced by physiological variables. PCO2: carbon dioxide tension; P50: partial pressure athalf maximum blood concentration for oxygen; DPG: 2, 3-diphosphoglycerate.
J.M.B. HUGHES
108
the Pa,O2 and Pa,CO2 of the blood leaving the right lung would have the same compositionas the mixed venous blood entering it. The other lung with ventilation but no blood flowwould act as a dead space with a V9A/Q9 ratio of infinity and an alveolar PO2 and PCO2
equal to that in inspired air. A mixture of V9A/Q9 ratios of zero and infinity means noeffective gas exchange. As V9A/Q9 ratios increase from zero and decrease from infinity,gas exchange efficiency increases until the optimum ratio (y0.86) is reached. In real life,there is a spread of V9A/Q9 values throughout the lung on either side of this "optimum"value. The larger the spread, the greater the inefficiency of gas exchange. Low V9A/Q9
units lead to arterial hypoxaemia (and hypercapnia). High V9A/Q9 units contributewasted ventilation or "dead space". For further information, consult the PO2–PCO2
diagram discussed in the section Heterogeneity of ventilation and perfusion (see below).The effect of V9A/Q9 mismatch raises Pa,CO2 as well as lowering Pa,O2, but the effect on
Pa,O2 is greater. In simple terms, this is because the "a–v" difference for PO2 (13.3–5.3=8 kPa) is much greater than the "v–a" PCO2 difference (0.8 kPa). The body’s compensationfor hypoxaemia and hypercapnia is to increase minute ventilation (hyperventilation). If, forexample, V9A/Q9 mismatch has caused Pa,O2 to fall to 8 kPa [D5.33 kPa from "normal"] andPa,CO2 to rise to 6.8 kPa [D1.5 kPa], hyperventilation sufficient to cause a 2 kPaimprovement in both blood gas values will result in Pa,O2 10 kPa (still abnormal) and Pa,CO2
4.8 kPa (slightly low). With V9A/Q9 mismatch, Pa,O2 is nearly always reduced, but Pa,CO2
may be raised, normal or low depending on the ventilatory response. In the"emphysematous" type of COPD, or "pink puffer", Pa,O2 may be surprisingly wellpreserved (e.g.w11 kPa) but at the expense of hyperventilation and a low Pa,CO2.
Alveolar hypoventilation
An inadequate level of ventilation is the other main cause (in y5% of cases) ofhypoxaemia; its origin is usually extrapulmonary and the Pa,CO2 is always raised. It iscaused by insufficient alveolar ventilation [V9A] (total (V9E) minus anatomic dead space(V9D) ventilation) in relation to metabolic demands of oxygen consumption (V9O2) andcarbon dioxide production (V9CO2). Respiratory centre depression (from anaesthetic,sedative or analgesic drugs) or diseases affecting the diaphragm or its nerve supply, orgross restriction of the chest wall (such as severe kyphoscoliosis) all lead to shallowbreathing, low V9E and inadequate V9A. Shallow breathing, in the long term, may lead toretention of secretions and atelectasis (deep breaths assist in the renewal of the alveolarsurfactant lining). Oxygen breathing in exacerbations of COPD may lead to shallowerbreathing and a further rise in Pa,CO2 (see section on Respiratory failure). Theconsequence of alveolar hypoventilation for arterial blood gases is that Pa,O2 falls andPa,CO2 rises in roughly equal amounts. In theory, DPa,CO2/DPa,O2=0.8 (where 0.8 is therespiratory quotient (RQ) imposed on the lung by body metabolism), but because ofaccompanying V9A/Q9 mismatch, the fall in Pa,O2 may equal or exceed the rise in Pa,CO2.Recognition of hypoventilation must take the clinical context into account rather thanrelying on the Pa,O2–Pa,CO2 pattern, though a rise in Pa,CO2 is mandatory.
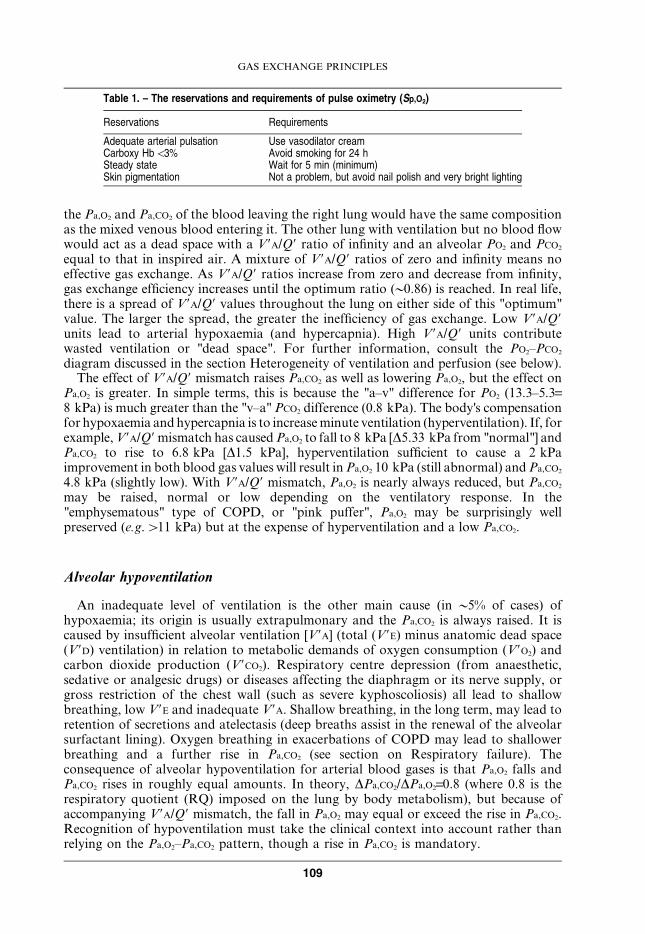
Table 1. – The reservations and requirements of pulse oximetry (Sp,O2)
Reservations Requirements
Adequate arterial pulsation Use vasodilator creamCarboxy Hb v3% Avoid smoking for 24 hSteady state Wait for 5 min (minimum)Skin pigmentation Not a problem, but avoid nail polish and very bright lighting
GAS EXCHANGE PRINCIPLES
109
Respiratory failure
There is no precise definition of respiratory failure in terms of Pa,O2 and Pa,CO2. Inclinical terms, acute respiratory failure is an unstable condition when Pa,O2 and Pa,CO2 areprogressively falling and rising respectively. Chronic respiratory failure is a stablecondition associated with: 1) severe hypoxaemia (e.g. Pa,O2v8 kPa, Sa,O2v90%) without(Type I) or with (Type II) hypercapnia; or 2) severe hypercapnia (Pa,CO2 w7 kPa) withmild hypoxaemia (Pa,O2 w10 kPa) – the latter occurs with extrapulmonary conditionsassociated with hypoventilation. The actual Pa,O2 and Pa,CO2 values defining "failure" aresomewhat arbitrary. The common causes of respiratory failure are shown in table 2.
The pathophysiology of different types of acute or acute-on-chronic respiratory failureare set out in table 3. In acute pulmonary gas exchange failure (ARDS), with severeV9A/Q9 mismatch and many gas exchange units flooded with plasma transudate orexudates, corresponding to a V9A/Q9 of zero, i.e. "physiological shunt", severe hypoxa-emia is the problem (Pa,O2v5 kPa) and a high FI,O2 (w60%) may be required to achieve a"safe" Pa,O2 level (w8 kPa). Central CO2 sensitivity remains normal, so hypercapnia doesnot occur, if hyperventilation can be sustained. Nevertheless, such severe hypoxaemiacannot be tolerated for long, and intermittent positive pressure ventilation (IPPV) withpositive end-expiratory pressure will be required. In extrapulmonary failure – whetheroriginating in the brain stem, phrenic nerves or the diaphragm itself – the weak link is notpulmonary gas exchange, but the ability of brain, nerves or muscle to respond to thehypercapnic stimulus. Since gas exchange is nearly normal, FI,O2 needs to be increasedonly slightly, if at all. Ventilatory assistance with nasal intermittent positive pressure(NIPPV), particularly at night, is the cornerstone of treatment.
Chronic obstructive pulmonary disease and respiratory failure
Some patients with stable COPD (those with a less intense ventilatory response toCO2) have a high Pa,CO2. Compared with normocapnic COPD patients, hypercapnicsubjects have low Pa,O2, higher [Hb] (secondary polycythaemia) and lower resting V9E
(table 4), with shallower and more rapid breathing [6]. They are often oedematous, and
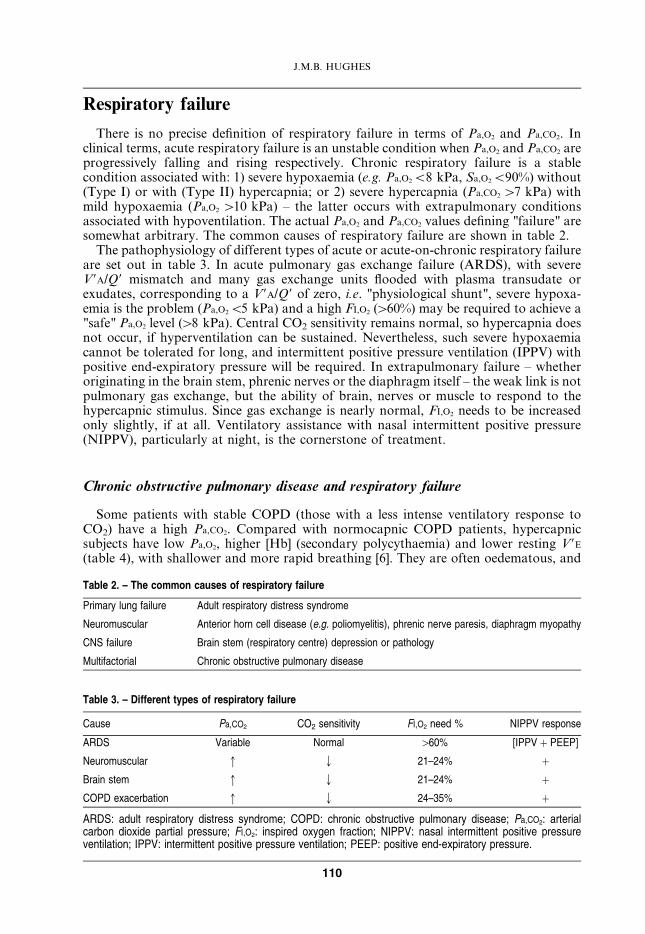
Table 2. – The common causes of respiratory failure
Primary lung failure Adult respiratory distress syndrome
Neuromuscular Anterior horn cell disease (e.g. poliomyelitis), phrenic nerve paresis, diaphragm myopathy
CNS failure Brain stem (respiratory centre) depression or pathology
Multifactorial Chronic obstructive pulmonary disease
Table 3. – Different types of respiratory failure
Cause Pa,CO2 CO2 sensitivity FI,O2 need % NIPPV response
ARDS Variable Normal w60% [IPPV z PEEP]
Neuromuscular q Q 21–24% z
Brain stem q Q 21–24% z
COPD exacerbation q Q 24–35% z
ARDS: adult respiratory distress syndrome; COPD: chronic obstructive pulmonary disease; Pa,CO2: arterialcarbon dioxide partial pressure; FI,O2: inspired oxygen fraction; NIPPV: nasal intermittent positive pressureventilation; IPPV: intermittent positive pressure ventilation; PEEP: positive end-expiratory pressure.
J.M.B. HUGHES
110
have been referred to as "blue bloaters". The hypercapnia of COPD patients is attributedto alveolar hypoventilation. In this case, the hypoventilation is "functional" rather than"actual", meaning that a large proportion of the VT is ineffective, going to units with ahigh V9A/Q9 ratio, and acting as alveolar dead space. COPD is associated with severeV9A/Q9 mismatch [7], with about one third of pulmonary blood flow going to alveolarunits with very low alveolar ventilation and contributing little to CO2 excretion (wastedperfusion); thus, y33% of pulmonary blood flow receives 10% of total alveolarventilation, and the resulting low V9A/Q9 and its uneven distribution is responsible for thehypoxaemia and hypercapnia. In fact, total V9E is normal (table 4).
In an exacerbation of COPD, Pa,CO2 rises and hypercapnia worsens, especially ifuncontrolled inspired oxygen (FI,O2 w28%) is prescribed [8]. The rise in Pa,CO2 due to therespiratory infection alone is caused by increasing V9A/Q9 mismatch (bronchiolar
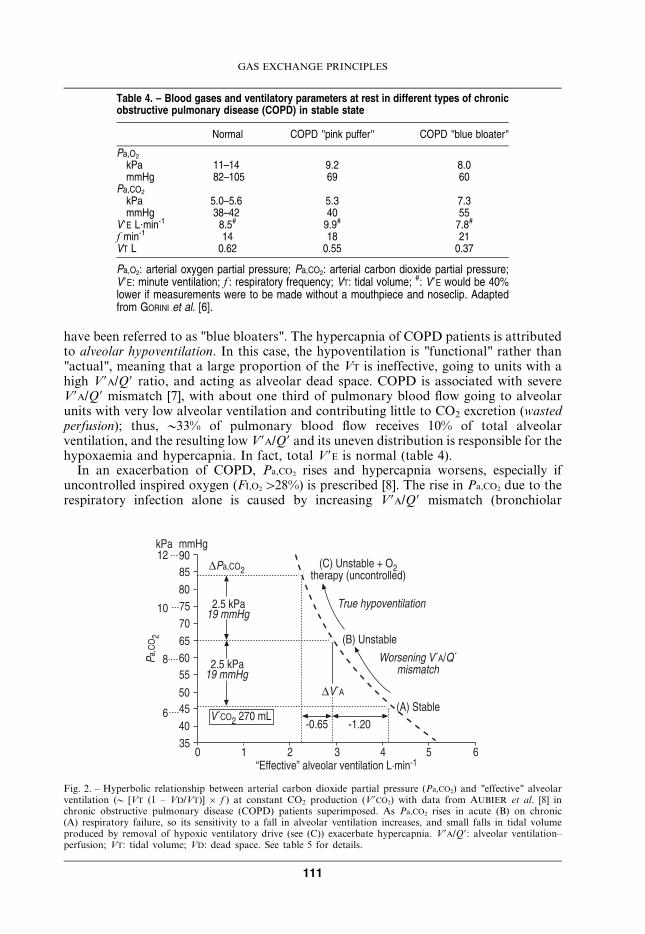
Table 4. – Blood gases and ventilatory parameters at rest in different types of chronicobstructive pulmonary disease (COPD) in stable state
Normal COPD "pink puffer" COPD "blue bloater"
Pa,O2
kPa 11–14 9.2 8.0mmHg 82–105 69 60
Pa,CO2
kPa 5.0–5.6 5.3 7.3mmHg 38–42 40 55
V9E L?min-1 8.5# 9.9# 7.8#
f min-1 14 18 21VT L 0.62 0.55 0.37
Pa,O2: arterial oxygen partial pressure; Pa,CO2: arterial carbon dioxide partial pressure;V9E: minute ventilation; f : respiratory frequency; VT: tidal volume; #: V9E would be 40%lower if measurements were to be made without a mouthpiece and noseclip. Adaptedfrom GORINI et al. [6].
�"-�
�� )�
��
��
��
��
��
��
�
�
� � ����
� �"-�
�&��� ������ �
�&��� ������ �
!3-�������� ��&�� ��&��!*#�4��5�
"������!3*6#3������$�
!7#�8����5�
����������������
!-#�8����5� �.���9 �����!���������� 2#
�!3*
� � � ' � � �:;<< ���1 =���1 �����1 �����������������
�
�
�
'�
��
��
��
��
��
Fig. 2. – Hyperbolic relationship between arterial carbon dioxide partial pressure (Pa,CO2) and "effective" alveolarventilation (y [VT (1 – VD/VT)] 6 f ) at constant CO2 production (V9CO2) with data from AUBIER et al. [8] inchronic obstructive pulmonary disease (COPD) patients superimposed. As Pa,CO2 rises in acute (B) on chronic(A) respiratory failure, so its sensitivity to a fall in alveolar ventilation increases, and small falls in tidal volumeproduced by removal of hypoxic ventilatory drive (see (C)) exacerbate hypercapnia. V9A/Q9: alveolar ventilation–perfusion; VT: tidal volume; VD: dead space. See table 5 for details.
GAS EXCHANGE PRINCIPLES
111
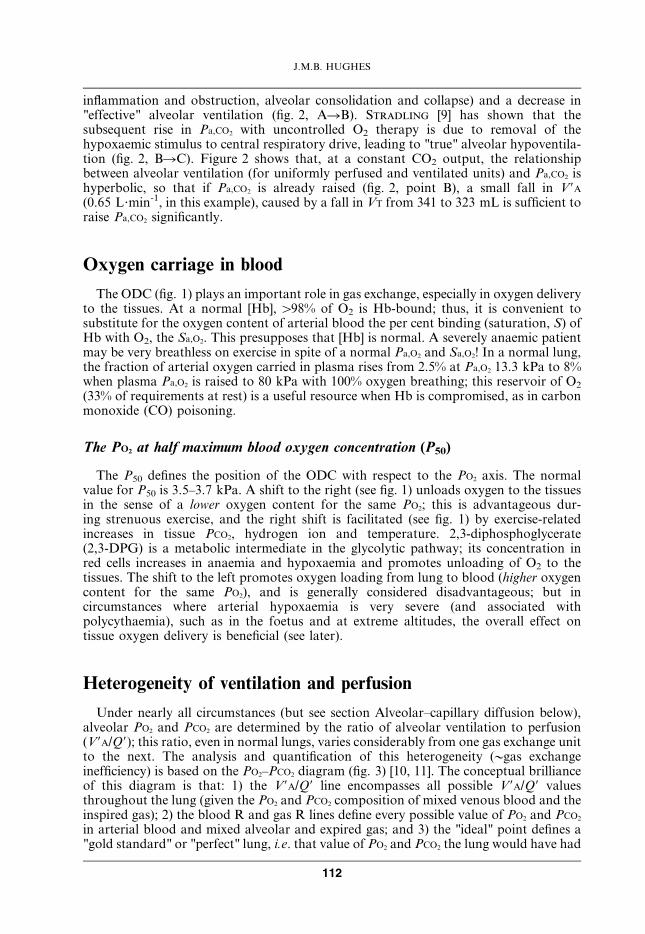
inflammation and obstruction, alveolar consolidation and collapse) and a decrease in"effective" alveolar ventilation (fig. 2, ARB). Stradling [9] has shown that thesubsequent rise in Pa,CO2 with uncontrolled O2 therapy is due to removal of thehypoxaemic stimulus to central respiratory drive, leading to "true" alveolar hypoventila-tion (fig. 2, BRC). Figure 2 shows that, at a constant CO2 output, the relationshipbetween alveolar ventilation (for uniformly perfused and ventilated units) and Pa,CO2 ishyperbolic, so that if Pa,CO2 is already raised (fig. 2, point B), a small fall in V9A
(0.65 L?min-1, in this example), caused by a fall in VT from 341 to 323 mL is sufficient toraise Pa,CO2 significantly.
Oxygen carriage in blood
The ODC (fig. 1) plays an important role in gas exchange, especially in oxygen deliveryto the tissues. At a normal [Hb], w98% of O2 is Hb-bound; thus, it is convenient tosubstitute for the oxygen content of arterial blood the per cent binding (saturation, S) ofHb with O2, the Sa,O2. This presupposes that [Hb] is normal. A severely anaemic patientmay be very breathless on exercise in spite of a normal Pa,O2 and Sa,O2! In a normal lung,the fraction of arterial oxygen carried in plasma rises from 2.5% at Pa,O2 13.3 kPa to 8%when plasma Pa,O2 is raised to 80 kPa with 100% oxygen breathing; this reservoir of O2
(33% of requirements at rest) is a useful resource when Hb is compromised, as in carbonmonoxide (CO) poisoning.
The PO2 at half maximum blood oxygen concentration (P50)
The P50 defines the position of the ODC with respect to the PO2 axis. The normalvalue for P50 is 3.5–3.7 kPa. A shift to the right (see fig. 1) unloads oxygen to the tissuesin the sense of a lower oxygen content for the same PO2; this is advantageous dur-ing strenuous exercise, and the right shift is facilitated (see fig. 1) by exercise-relatedincreases in tissue PCO2, hydrogen ion and temperature. 2,3-diphosphoglycerate(2,3-DPG) is a metabolic intermediate in the glycolytic pathway; its concentration inred cells increases in anaemia and hypoxaemia and promotes unloading of O2 to thetissues. The shift to the left promotes oxygen loading from lung to blood (higher oxygencontent for the same PO2), and is generally considered disadvantageous; but incircumstances where arterial hypoxaemia is very severe (and associated withpolycythaemia), such as in the foetus and at extreme altitudes, the overall effect ontissue oxygen delivery is beneficial (see later).
Heterogeneity of ventilation and perfusion
Under nearly all circumstances (but see section Alveolar–capillary diffusion below),alveolar PO2 and PCO2 are determined by the ratio of alveolar ventilation to perfusion(V9A/Q9); this ratio, even in normal lungs, varies considerably from one gas exchange unitto the next. The analysis and quantification of this heterogeneity (ygas exchangeinefficiency) is based on the PO2–PCO2 diagram (fig. 3) [10, 11]. The conceptual brillianceof this diagram is that: 1) the V9A/Q9 line encompasses all possible V9A/Q9 valuesthroughout the lung (given the PO2 and PCO2 composition of mixed venous blood and theinspired gas); 2) the blood R and gas R lines define every possible value of PO2 and PCO2
in arterial blood and mixed alveolar and expired gas; and 3) the "ideal" point defines a"gold standard" or "perfect" lung, i.e. that value of PO2 and PCO2 the lung would have had
J.M.B. HUGHES
112
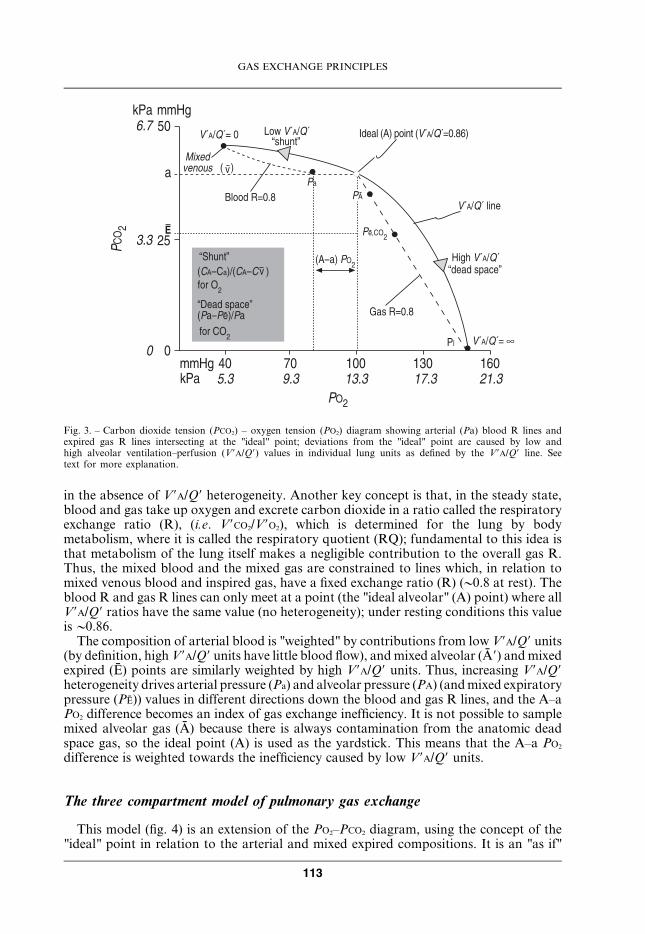
in the absence of V9A/Q9 heterogeneity. Another key concept is that, in the steady state,blood and gas take up oxygen and excrete carbon dioxide in a ratio called the respiratoryexchange ratio (R), (i.e. V9CO2/V9O2), which is determined for the lung by bodymetabolism, where it is called the respiratory quotient (RQ); fundamental to this idea isthat metabolism of the lung itself makes a negligible contribution to the overall gas R.Thus, the mixed blood and the mixed gas are constrained to lines which, in relation tomixed venous blood and inspired gas, have a fixed exchange ratio (R) (y0.8 at rest). Theblood R and gas R lines can only meet at a point (the "ideal alveolar" (A) point) where allV9A/Q9 ratios have the same value (no heterogeneity); under resting conditions this valueisy0.86.
The composition of arterial blood is "weighted" by contributions from low V9A/Q9 units(by definition, high V9A/Q9 units have little blood flow), and mixed alveolar (A9) and mixedexpired (E) points are similarly weighted by high V9A/Q9 units. Thus, increasing V9A/Q9heterogeneity drives arterial pressure (Pa) and alveolar pressure (PA) (and mixed expiratorypressure (PE)) values in different directions down the blood and gas R lines, and the A–aPO2 difference becomes an index of gas exchange inefficiency. It is not possible to samplemixed alveolar gas (A) because there is always contamination from the anatomic deadspace gas, so the ideal point (A) is used as the yardstick. This means that the A–a PO2
difference is weighted towards the inefficiency caused by low V9A/Q9 units.
The three compartment model of pulmonary gas exchange
This model (fig. 4) is an extension of the PO2–PCO2 diagram, using the concept of the"ideal" point in relation to the arterial and mixed expired compositions. It is an "as if"
%&% ��
����'������������� � '&% �&% �%&% �(&% )�&%
�
��
*
+&( -
�
����� �
���������
!3*6#3>�� ��?�!3*6#3:�9���=
@2 ���!*#�������!!3*6#3>�&��#
!3*6#3����
���9�!3*6#3:2 �2����� =
0���A>�&�
!3*6#3>�� �
"-�
* �
7���2�A>�&�
!*B�#� �:49���=!,*B-�#6!,*B,���#<����
:/ �2����� =! �B #6 �<���-�
�
�
�
�
�
�
�
!���#�
�
1
1
Fig. 3. – Carbon dioxide tension (PCO2) – oxygen tension (PO2) diagram showing arterial (Pa) blood R lines andexpired gas R lines intersecting at the "ideal" point; deviations from the "ideal" point are caused by low andhigh alveolar ventilation–perfusion (V9A/Q9) values in individual lung units as defined by the V9A/Q9 line. Seetext for more explanation.
GAS EXCHANGE PRINCIPLES
113
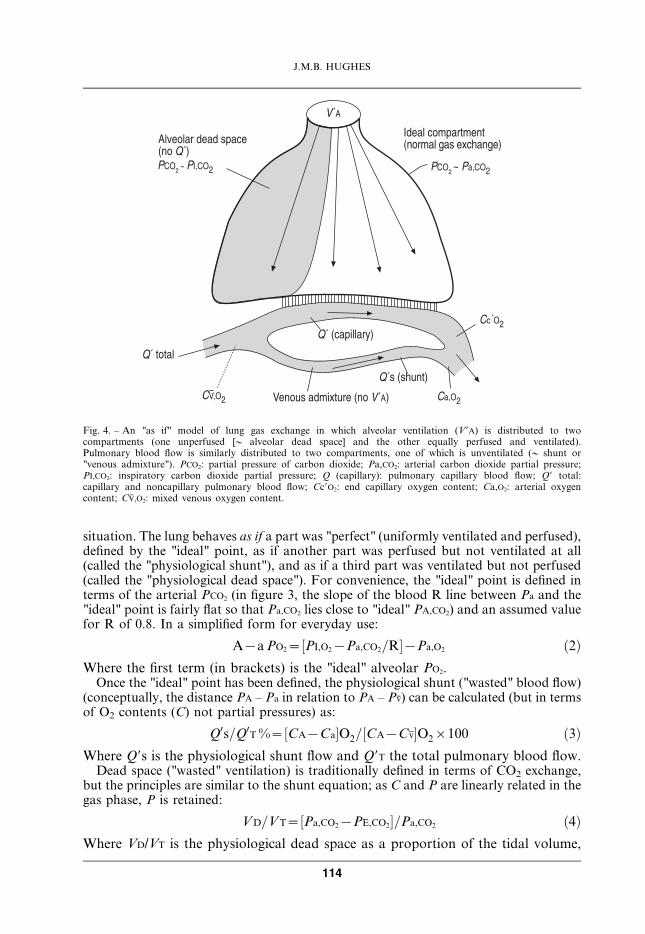
situation. The lung behaves as if a part was "perfect" (uniformly ventilated and perfused),defined by the "ideal" point, as if another part was perfused but not ventilated at all(called the "physiological shunt"), and as if a third part was ventilated but not perfused(called the "physiological dead space"). For convenience, the "ideal" point is defined interms of the arterial PCO2 (in figure 3, the slope of the blood R line between Pa and the"ideal" point is fairly flat so that Pa,CO2 lies close to "ideal" PA,CO2) and an assumed valuefor R of 0.8. In a simplified form for everyday use:
A{a PO2~½PI,O2{Pa,CO2=R�{Pa,O2 ð2ÞWhere the first term (in brackets) is the "ideal" alveolar PO2.
Once the "ideal" point has been defined, the physiological shunt ("wasted" blood flow)(conceptually, the distance PA – Pa in relation to PA – Pv) can be calculated (but in termsof O2 contents (C) not partial pressures) as:
Q0s=Q0T %~½CA{Ca�O2=½CA{Cv�O2|100 ð3ÞWhere Q9s is the physiological shunt flow and Q9T the total pulmonary blood flow.
Dead space ("wasted" ventilation) is traditionally defined in terms of CO2 exchange,but the principles are similar to the shunt equation; as C and P are linearly related in thegas phase, P is retained:
VD=VT~½Pa,CO2{PE,CO2�=Pa,CO2 ð4ÞWhere VD/VT is the physiological dead space as a proportion of the tidal volume,
!3*
@2 ����������� ��!����������� �9��� #*�1 �����2 �2�����
!���#3# -��C� �"-�
,�3�
,�"�
#3��!�9���#
D ������2����� �!���!3*#,D"�
#3������
#3�!���������#
-��C� @"-�
Fig. 4. – An "as if" model of lung gas exchange in which alveolar ventilation (V9A) is distributed to twocompartments (one unperfused [y alveolar dead space] and the other equally perfused and ventilated).Pulmonary blood flow is similarly distributed to two compartments, one of which is unventilated (y shunt or"venous admixture"). PCO2: partial pressure of carbon dioxide; Pa,CO2: arterial carbon dioxide partial pressure;PI,CO2: inspiratory carbon dioxide partial pressure; Q (capillary): pulmonary capillary blood flow; Q9 total:capillary and noncapillary pulmonary blood flow; Cc9O2: end capillary oxygen content; Ca,O2: arterial oxygencontent; CV,O2: mixed venous oxygen content.
J.M.B. HUGHES
114
Pa,CO2 is assumed to equal the "ideal" PA,CO2 and PI,CO2 has been omitted from thedenominator.
Shunt and dead space are called "physiological" rather than "alveolar", because theyboth contain an "obligatory" anatomical component, bronchial venous and Thebesianblood flow in the case of shunt and the anatomic dead space in the case of VD/VT.
Quantitating gas exchange inefficiency for oxygen
In an earlier section, the Pa,O2 was interpreted solely in terms of the normal value forage, BMI and posture. In equations 2, 3 and 4 (see above), gas exchange efficiency isassessed in relation to the "ideal" or perfect lung.
The A–a PO2 gradient can be calculated from the Pa,O2 and Pa,CO2, assuming (at rest)R=0.8. Normal values are a function of the inspired PO2 when FI,O2 i21%; forconvenience, the estimates are usually made during air breathing. The normal A–a PO2
(air) increases with age from 0.8–1.3 kPa at age 20 yrs to 3.5–4.0 kPa at age 70 yrs [12].For the same amount of physiological shunt (Q9s/Q9T) and FI,O2, the A–a PO2 declines asPa,CO2 rises (and PA,O2 falls). In spite of these limitations, the A–a PO2 has been usedextensively, and for minor fluctuations in Pa,CO2 (5.33¡1.0 kPa), gives a better assessmentof gas exchange efficiency than Pa,O2 alone. In the intensive care setting, A–a PO2 is verysensitive to FI,O2, and may increase seven-fold from 5.4 to 38 kPa, for the same Q9s/Q9T
(20%), just with an increase in FI,O2 from 21 to 60%. An empirical index, the Pa,O2/FI,O2
ratio, reduces these fluctuations, but does not abolish them.Q9s/Q9T requires arterial O2 contents (or saturations) to be calculated from Pa,O2 and
"ideal" PA,O2 values, and an estimate made of mixed venous (pulmonary arterial) O2
content or saturation (unless right heart catheterisation has been performed). In normalsubjects at rest, an a–v difference of 50 mL?L-1 (or DSa,O2 25%) may be assumed, but inpatients with pulmonary hypertension or heart failure that assumption may be wrong.
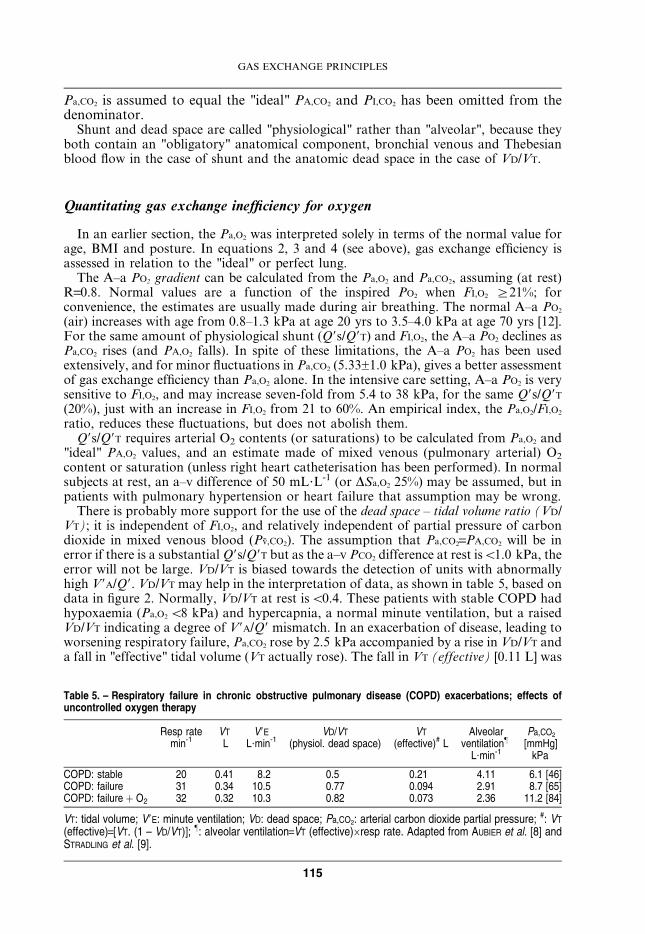
There is probably more support for the use of the dead space – tidal volume ratio (VD/VT); it is independent of FI,O2, and relatively independent of partial pressure of carbondioxide in mixed venous blood (Pv,CO2). The assumption that Pa,CO2=PA,CO2 will be inerror if there is a substantial Q9s/Q9T but as the a–v PCO2 difference at rest isv1.0 kPa, theerror will not be large. VD/VT is biased towards the detection of units with abnormallyhigh V9A/Q9. VD/VT may help in the interpretation of data, as shown in table 5, based ondata in figure 2. Normally, VD/VT at rest isv0.4. These patients with stable COPD hadhypoxaemia (Pa,O2 v8 kPa) and hypercapnia, a normal minute ventilation, but a raisedVD/VT indicating a degree of V9A/Q9 mismatch. In an exacerbation of disease, leading toworsening respiratory failure, Pa,CO2 rose by 2.5 kPa accompanied by a rise in VD/VT anda fall in "effective" tidal volume (VT actually rose). The fall in VT (effective) [0.11 L] was
Table 5. – Respiratory failure in chronic obstructive pulmonary disease (COPD) exacerbations; effects ofuncontrolled oxygen therapy
Resp ratemin-1
VT
LV9E
L?min-1VD/VT
(physiol. dead space)VT
(effective)# LAlveolar
ventilation}
L?min-1
Pa,CO2
[mmHg]kPa
COPD: stable 20 0.41 8.2 0.5 0.21 4.11 6.1 [46]COPD: failure 31 0.34 10.5 0.77 0.094 2.91 8.7 [65]COPD: failure z O2 32 0.32 10.3 0.82 0.073 2.36 11.2 [84]
VT: tidal volume; V9E: minute ventilation; VD: dead space; Pa,CO2: arterial carbon dioxide partial pressure; #: VT
(effective)=[VT. (1 – VD/VT)]; }: alveolar ventilation=VT (effective)6resp rate. Adapted from AUBIER et al. [8] andSTRADLING et al. [9].
GAS EXCHANGE PRINCIPLES
115

much greater than the fall in VT (actual) [0.07 L], indicating severely worsening V9A/Q9mismatch. Finally (table 5, bottom row), with uncontrolled O2 therapy, there wasanother substantial rise in Pa,CO2 but very little change in VD/VT; DVT (effective) was thesame as DVT (actual), indicating that true hypoventilation was the reason for the rise ofPa,CO2 on oxygen [6].
Causes of hypoxaemia (low arterial oxygen partial pressure) II
The cause of the hypoxaemia (table 6) is usually obvious from the clinical diagnosis.Hypoventilation and V9A/Q9 mismatch have been discussed already. In V9A/Q9 mismatch,Pa,O2 will only exceed 80 kPa with 15 min 100% O2 breathing if all parts of the lung areaerated (as in COPD), with oxygen diffusing to obstructed alveoli through collateralpathways. In ARDS or pulmonary oedema, waterlogged gas exchange units will beunable to take up oxygen. Diffusion limitation, also called "alveolar–capillary block",occurs on exercise at high altitude, and on exercise in patients with interstitial pulmonaryfibrosis (cryptogenic fibrosing alveolitis) whose transfer factor of the lung for carbonmonoxide (TL,CO; at rest) is v50% predicted. Intrapulmonary anatomic right to leftshunts (intracardiac R–L shunts behave similarly as regards Pa,O2) are unusual. The mostfrequent causes are pulmonary arteriovenous malformations (PAVMs), associated withhereditary haemorrhagic telangiectasia [13], and the hepatopulmonary syndrome (HPS),associated with liver disease and portal hypertension [14]. PAVMs can be demonstratedwith high resolution computed tomography scans or pulmonary angiography. The shuntchannels in HPS are too small to be demonstrated by these techniques; contrast echo-bubble or albumin macroaggregate radionuclide (99mTc-MAA) lung scans will showcontrast material passing through the lung to reach the left side of the heart, or (in thecase of 99mTc-MAA) the kidneys or brain.
HPS is an interesting condition physiologically because it has features of diffusionlimitation as well as those of a R–L intrapulmonary shunt. Many of the capillaries in thealveolar septa are remodelled (cause unknown) with diameters as large as 100–200 mM(normal 7–15 mM). The TL,CO is very reduced (decreased capillary surface area andincreased intracapillary diffusion distances) and Pa,O2 is low and has a variable responseto breathing 100% oxygen. In HPS, a poor response to 100% O2 (Pa,O2 vv80 kPa)suggests very widened capillaries that act as an intrapulmonary anatomic R–L shunt. Onthe other hand, a good response to 100% O2 (Pa,O2 w73.3 kPa) in some HPS patientssuggests smaller channels in which diffusion equilibration can be established when the[PA,O2–PV,O2] gradient is raised. With 100% O2 breathing, and arterial sampling for PO2,the R–L shunt can be quantitated, as Qs/QT % using equation (3); this gives a"physiological" estimate. The R–L shunt can also be measured (as Qs/QT %)
Table 6. – The causes of arterial hypoxaemia
Altitude Low PI,O2
Hypoventilation V9E inadequate for V9O2; Pa,CO2 always raised
Diffusion limitation DL,O2 inadequate for V9O2; Pa,O2 falls zz on exercise
V9A/Q9 mismatch Pa,O2 w73.3 kPa on 100% oxygen
Anatomic R–L shunt Pa,O2 v73.3 kPa on 100% oxygen
PI,O2: partial pressure of inspired oxygen; V9E: minute ventilation; V9O2: oxygen production;Pa,CO2: arterial carbon dioxide partial pressure; Pa,O2: arterial oxygen partial pressure; DL,O2:oxygen diffusing capacity of the lung; V9A/Q9: alveolar ventilation–perfusion ratio; R: right; L:Left.
J.M.B. HUGHES
116
"anatomically" using a 99mTc-MAA lung-kidney scan technique, and in large-channel R–L shunts (as in PAVMs) these physiological and anatomic estimates are in agreement. InHPS, the oxygen shunt (low Pa,O2) and the 99mTc-MAA shunt were the same breathingair, but with 100% O2 breathing, the physiological shunt was less than the anatomic99mTc-MAA shunt. This suggests an interesting scenario. Breathing air, the low Pa,O2 inHPS behaves as an intrapulmonary R–L shunt, but conceptually (from the 100% O2 data)it should be regarded as an extreme example of diffusion limitation [14, 15].
Noninvasive measurements of arterial oxygenation
The convenience of measuring arterial oxygen saturation (Sa,O2) with a finger or earlobe probe has been stressed earlier. The advantage of sampling arterial blood is thatPa,CO2 and pH can also be measured. But, arterial sampling is invasive, particularly whenrepeat measurements are required in ambulatory patients; in intensive care, arterialcannulas will be inserted.
Arterialised capillary blood
A less invasive method of obtaining Pa,O2, Pa,CO2 and pH is to sample arterialisedcapillary blood, obtained by making a small cut in the periphery of the ear lobe, afterprevious warming with vasodilator cream. Blood, which must be freely flowing, iscollected as anaerobically as possible (with stringent precautions to avoid blood spillageand skin pricks), and analysed immediately. Good technique is crucial. The sample is amixture of capillary and venular blood. The principle is that vasodilatation increaseslocal blood flow up to 10-fold; from the Fick equation, if local V9O2 does not change, thearterio–venous content and PO2 difference will narrow sufficiently so that capillary andvenous PO2 approach Pa,O2. In normoxia, the a–v PO2 gradient is large (8 kPa) andarterialised samples tend to underestimate the true arterial value (by 0.6 kPa). But, inhypoxaemia, on the steep part of the ODC, with a smaller a–v PO2 difference (v4 kPa),there is good convergence of arterialised PO2 and Pa,O2 at Pa,O2 levelsv9.3 kPa [16]. Theresults on exercise are similar to those at rest. The overall message is that false negatives(falsely normal Pa,O2) are less of a problem than false positives, i.e. a misleadingly lowPa,O2.
Transcutaneous measurements (Ptc,O2)
A Clark polarographic electrode placed on the skin measures the PO2 in subdermaltissues. The principle is the same as when arterialised capillary blood is sampled.Vasodilatation is achieved by heating the skin to 40–42uC, and this narrows the a–v PO2
difference. The method works best in neonates where the epidermis is very thin.Substantial underestimates may occur in adults, even with gentle abrasion of theepidermis. Calibration against a simultaneous arterial sample is needed. In adults,transcutaneous oxygen tension (Ptc,O2) may be able to follow trends in Pa,O2 over time,but spot samples are not reliable.
Measurement of Pa,CO2 with transcutaneous electrodes is well established as a reliablemonitor of long-term trends, i.e. overnight in patients with nocturnal hypoventilation.The small arteriovenous difference for Pa,CO2 at rest is an advantage.
GAS EXCHANGE PRINCIPLES
117
Oxygen affinity in special situations
Haemoglobinopathies
The importance of the position of the ODC, as defined by the P50 (normal value 3.5–3.7 kPa), was stressed earlier. Shifts to the right in anaemia and hypoxaemia, producedby an increase in red cell 2,3-DPG, promotes efficient oxygen unloading to tissues (largerarteriovenous oxygen content difference (D[Ca–Cv]O2) for the same arteriovenous PO2
difference (D[Pa–Pv]O2)). In normoxia, shifts to the left (less O2 unloading) areconsidered disadvantageous. Certain congenital haemoglobinopathies are associatedwith large right or left P50 shifts (table 7). A right shift, such as occurs in Hb Seattle isassociated with anaemia (Hb 60% normal); even so, the normal a–v O2 content differenceat rest (45–50 mL?L-1) can be unloaded at a nearly normal PvO2 (4.7–5.1 kPa); exercisecapacity is relatively unimpaired. On the other hand, haemoglobinopathies with a leftshift develop erythrocytosis to compensate for their difficulty in O2 unloading. HbAndrew–Minneapolis [17] has [Hb] 117% normal. Because of the increase in the O2
content of arterial blood, such patients can deliver 45–50 mL?L-1 to the tissues in thenormal range of PvO2 (6.1 kPa).
Apart from haemoglobinopathies, shifts to the left (Q P50) occur in three othersituations: 1) CO poisoning; 2) at extreme altitudes, and 3) in the foetus. The P50 shift,accompanied by polycythaemia, is beneficial in (2) and (3) but, accompanied by an"effective" anaemia, it is disastrous in (1).
Carbon monoxide poisoning
Life is possible with a severe anaemia (Hb 5.8 g?dL-1: 40% normal), but replacement of60% HbO2 with HbCO in acute CO poisoning would be fatal. The very high affinity ofCO for Hb (250 timeswoxygen), actually caused by its very slow dissociation from Hb,shifts the curve of the residual HbO2/deoxyHb to the left (a competitive antagonismeffect) so that P50 at HbCO 60% is very low (table 7); at a PvO2 of 2.66 kPa, only14 mL?L-1 of O2 would be unloaded, just 27% of the oxygen requirements at rest. Inacute poisoning, the situation is made worse by: 1) absence of a compensatoryerythrocytosis; and 2) a normal Pa,O2, and thus no ventilatory or cardiac stimulus totissue anoxia from the carotid body. At low levels of HbCO%, syncope is common whenmild exercise is taken because the increased oxygen demand cannot be met due to the P50
shift and the anaemia effect of replacement of HbO2 with HbCO. In severe cases, tissue
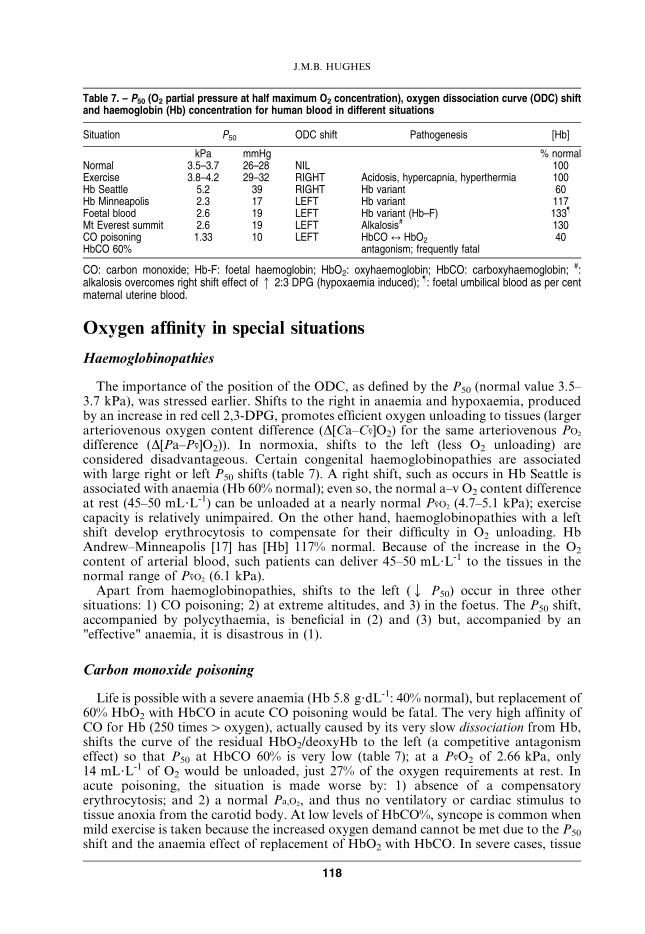
Table 7. – P50 (O2 partial pressure at half maximum O2 concentration), oxygen dissociation curve (ODC) shiftand haemoglobin (Hb) concentration for human blood in different situations
Situation P50 ODC shift Pathogenesis [Hb]
kPa mmHg % normalNormal 3.5–3.7 26–28 NIL 100Exercise 3.8–4.2 29–32 RIGHT Acidosis, hypercapnia, hyperthermia 100Hb Seattle 5.2 39 RIGHT Hb variant 60Hb Minneapolis 2.3 17 LEFT Hb variant 117Foetal blood 2.6 19 LEFT Hb variant (Hb–F) 133}
Mt Everest summit 2.6 19 LEFT Alkalosis# 130CO poisoning 1.33 10 LEFT HbCO q HbO2 40HbCO 60% antagonism; frequently fatal
CO: carbon monoxide; Hb-F: foetal haemoglobin; HbO2: oxyhaemoglobin; HbCO: carboxyhaemoglobin; #:alkalosis overcomes right shift effect of q 2:3 DPG (hypoxaemia induced); }: foetal umbilical blood as per centmaternal uterine blood.
J.M.B. HUGHES
118
anoxia causes loss of consciousness and ischaemic damage to the brain and heart.Hyperbaric oxygen is an effective therapy if administered in time. At 3.0 ATM, about50 mL?L-1 of O2 is dissolved in plasma, which is sufficient to meet O2 demand at rest [18].The rate of dissociation of HbCO can be increased from a half time of 5 h on air to90 min on O2 at 1.0 ATM or to 23 min at 3.0 ATM [19]. Time is of the essence, but 100%oxygen administered in an ambulance will treat effectively those with mild COintoxication.
Extreme altitude
Ascending to the summit of Mt Everest (8,848 m) is an increasingly popular challenge.Since the first ascent in 1953 by Hilary and Tensing, about 1,400 people have reached thesummit (another 180 have died on the mountain). The ascent is generally done breathingoxygen, but a successful ascent has been made, by Messner and Habeler in 1978,breathing air. Pulmonary gas exchange at these extreme altitudes has been studied bothin the field (American Medical Research Expedition to Everest (AMREE) 1981) and inhypobaric chamber simulations (Operation Everest II, 1985); some measurements (PI,O2,PA,O2, PA,CO2, heart rate) have been made standing on the summit itself [20].
The most remarkable feature of gas exchange under these extreme conditions (at thelimit of the ability of humans to cope with hypoxia [PI,O2 on the summit=5.73 kPa] is theability of the body to defend the arterial oxygen tension (P) and content/saturation (C,S). The Pa,O2 on the summit was 4.7 kPa, Sa,O2 was 71% and Ca,O2 was 182 mL?L-1 (91%of normal at sea level) [21]. The very small [PI–Pa] difference for O2 was produced byextreme hyperventilation (at least five times normal) at rest, lowering arterial PCO2 to1.0 kPa and raising pH to 7.7 (normal 7.4). The respiratory alkalosis shifted theestimated P50 to 2.59 kPa and raised Sa,O2 from 40% (at normal P50) to 71% [22].Secondary polycythaemia raised Ca,O2 from 142 mL?L-1 (at a normal Hb) to 90% of thenormal sea level value. At lower altitudes (6,300 m), resting hyperventilation was less,Pa,CO2 was 2.45 kPa, respiratory alkalosis was mild (pH 7.47) and in vivo P50 was normalat 3.7 kPa (the alkalosis effect being offset by a hypoxia-induced 2,3-DPG increase) [22].The measurements of gas exchange on exercise will be considered in a later section(section Alveolar–capillary diffusion).
Gas exchange in the foetus
The P50 of foetal Hb, and the Pa,O2 in the foetal aorta, are similar to the values onthe summit of Everest (see previous paragraph), supporting Joseph Barcroft’s 1933description of the foetal environment as "Mt Everest in utero". Foetal [Hb] is also higherthan postnatally. There is no alkalosis (Pa,CO2 5.7 kPa [43 mmHg]), so the P50 shift isdriven entirely by the structure of foetal Hb. For an a–v PO2 difference of 45 mL?L-1,foetal venous PO2 is low,y2.7 kPa [20 mmHg] [23]. Exercise requirements are minimal!
Diffusion
The acinus as the gas exchange unit
Experimentally, pulmonary arteries w150 mM diameter have to be blocked (withbeads) before high V9A/Q9 regions emerge [24]. 150 mM corresponds to the diameter ofthe artery supplying the acinus, supporting the notion that the acinus is the effective gasexchanging unit. There are 33–50,000 (diameter 0.06 mM) acini in the human lung [25].
GAS EXCHANGE PRINCIPLES
119
The entry bronchiole (terminal bronchiole) branches into three generations of alveolatedrespiratory bronchioles, four generations of alveolar ducts and one of alveolar sacs.There are 250 alveolar sacs per acinus and 30–40 alveoli per sac (1,750 alveoli per acinus).The distance from the terminal bronchiole to the alveolar sacs averages 8 mM (range 5–13 mM); over this distance the cross-sectional area increases exponentially 64 times, likea trumpet. During normal breathing, the acinus and its components expand andcontract, but the convective flow in and out contributes little, if anything, to the mixingof inspired oxygen with the residual O2 present throughout the acinus at the end of thepreceding expiration; the same arguments apply, in reverse, to CO2. Alveolar ventilation,in the sense of bringing inspired O2 molecules into contact with the alveolar epithelium,occurs entirely by molecular diffusion, which is proportional to the physical diffusivity ofO2 in air multiplied by the surface area/distance ratio. This ratio, because of the anatomyof the acinus, is so high (200 cm2/0.5 cm) that uniformity of alveolar PO2 has occurred bydiffusive mixing throughout the acinus by the end of inspiration [26]. Differences inventilation that occur because of differences in local compliance and resistance (as aresult of convective flow inequalities), cause gas concentration differences between acini,but not within acini.
In contrast to the uniformity of acinar ventilation, acinar blood flow may be veryuneven in time and space, chiefly due to recruitment and derecruitment of pre-capillaryarterioles and alveolar septal vessels, which tend to be either "open" or "shut". Thisintra-acinar non-uniformity is less evident in the dependent zones and on exercise.Nevertheless, the uniformity of end-inspiratory PA,O2 as a result of molecular gaseousdiffusion implies uniformity of end-capillary PO2 despite non-uniform blood flow withinthe acinus [26]. Thus, acinar gas exchange is determined by mean ventilation and meanblood flow, and the resulting mean V9A/Q9 ratio. The acinus may not behave as theultimate gas exchange unit in disease when its architecture has been distorted, individualalveoli flooded or alveolar-capillary membranes thickened.
Alveolar–capillary diffusion
Oxygen is transferred from gas to blood, from the alveolar epithelial surface to the Hbmolecule in the pulmonary capillary erythrocytes, according to the relationship [27]:
V 0O2~DL ½PA{Pc�O2 ð5ÞWhere DL is the oxygen diffusing capacity (DL,O2), Pc is the mean capillary PO2 and[PA – Pc] is the effective (mean) driving pressure. DL,O2 is a conductance with units ofmmol?min-1?kPa-1. V9O2 [lung] must match V9O2 [body tissues]. Thus, a low exerciseDL,O2, due to interstitial lung disease (ILD), will limit V9O2,max unless the gradient [PA
– Pc] can be increased proportionately by increasing PA,O2 (by hyperventilation) or bylowering Pc,O2 by a decrease of Pv,O2 on exercise. While Pc,O2 is one of the determinantsof V9O2,max, it is the end-capillary PO2 (Pc9,O2) which, in a uniform lung, influences thePa,O2. In an ideal lung (or gas exchange unit), there is diffusion equilibrium, i.e.Pc9,O2=Pa,O2, before blood has left the alveolar region. The end gradient [PA – Pc9] foroxygen, the existence of which implies "diffusion limitation", is a function of thediffusion–perfusion conductance ratio:
½PA{Pc0�=½PA{Pv�~e
{DL=Q0b ð6Þwhere [PA – Pv] is the initial gradient at the mixed venous entry point, DL=DL,O2, andb for O2 is the oxygen capacitance of blood (y the slope of the ODC at any givenPO2). bO2 is high when PA,O2 and Pc9,O2 are low and the ODC slope is high. Q9b is theperfusion conductance whose units are (if Q9 is L?min-1) mmol?min-1?kPa-1 – similar
J.M.B. HUGHES
120
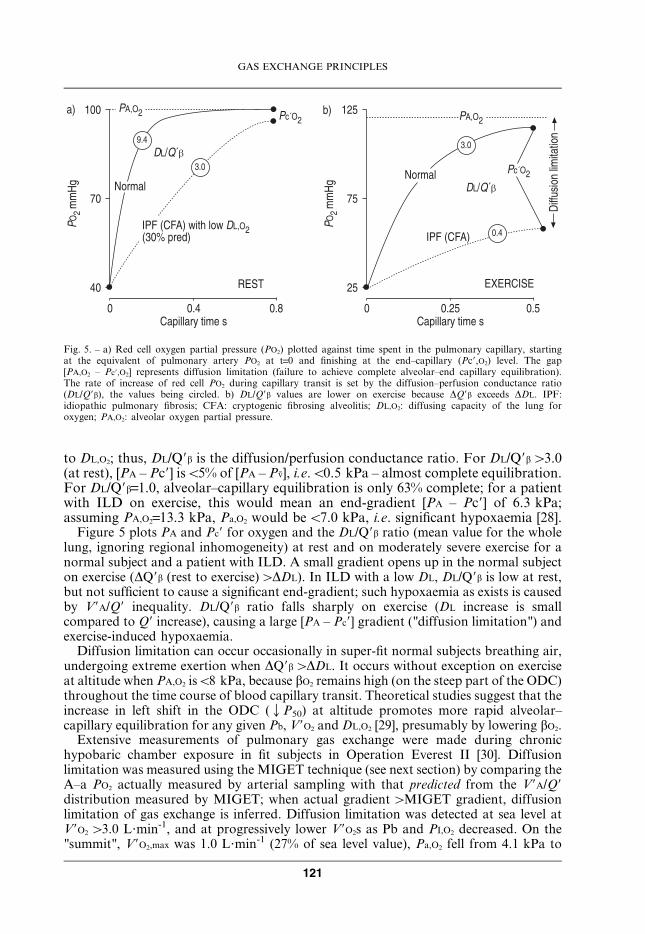
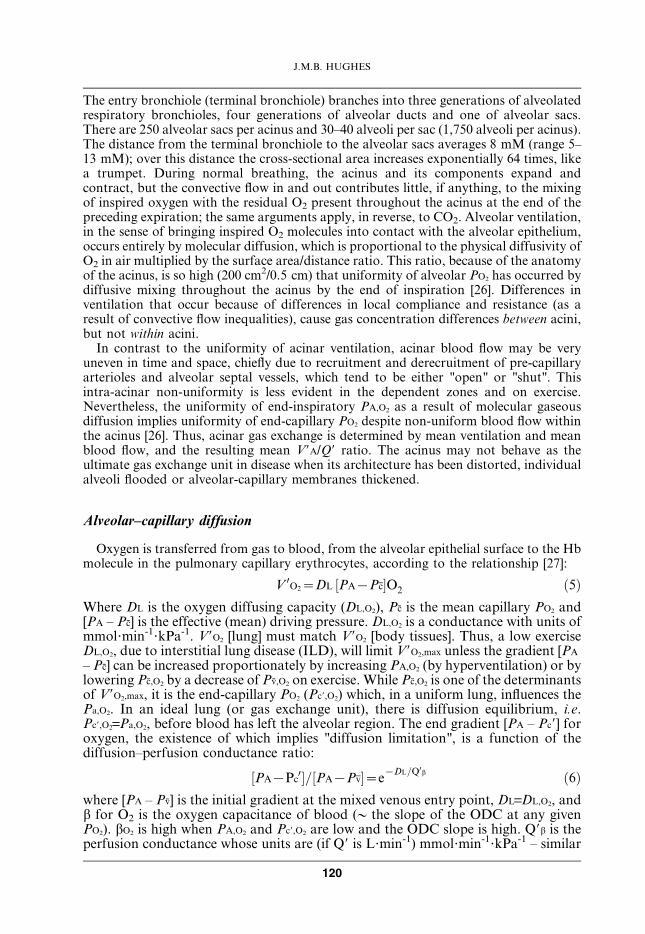
to DL,O2; thus, DL/Q9b is the diffusion/perfusion conductance ratio. For DL/Q9bw3.0(at rest), [PA – Pc9] isv5% of [PA – Pv], i.e.v0.5 kPa – almost complete equilibration.For DL/Q9b=1.0, alveolar–capillary equilibration is only 63% complete; for a patientwith ILD on exercise, this would mean an end-gradient [PA – Pc9] of 6.3 kPa;assuming PA,O2=13.3 kPa, Pa,O2 would be v7.0 kPa, i.e. significant hypoxaemia [28].
Figure 5 plots PA and Pc9 for oxygen and the DL/Q9b ratio (mean value for the wholelung, ignoring regional inhomogeneity) at rest and on moderately severe exercise for anormal subject and a patient with ILD. A small gradient opens up in the normal subjecton exercise (DQ9b (rest to exercise)wDDL). In ILD with a low DL, DL/Q9b is low at rest,but not sufficient to cause a significant end-gradient; such hypoxaemia as exists is causedby V9A/Q9 inequality. DL/Q9b ratio falls sharply on exercise (DL increase is smallcompared to Q9 increase), causing a large [PA – Pc9] gradient ("diffusion limitation") andexercise-induced hypoxaemia.
Diffusion limitation can occur occasionally in super-fit normal subjects breathing air,undergoing extreme exertion when DQ9bwDDL. It occurs without exception on exerciseat altitude when PA,O2 isv8 kPa, because bO2 remains high (on the steep part of the ODC)throughout the time course of blood capillary transit. Theoretical studies suggest that theincrease in left shift in the ODC (QP50) at altitude promotes more rapid alveolar–capillary equilibration for any given Pb, V9O2 and DL,O2 [29], presumably by lowering bO2.
Extensive measurements of pulmonary gas exchange were made during chronichypobaric chamber exposure in fit subjects in Operation Everest II [30]. Diffusionlimitation was measured using the MIGET technique (see next section) by comparing theA–a PO2 actually measured by arterial sampling with that predicted from the V9A/Q9distribution measured by MIGET; when actual gradient wMIGET gradient, diffusionlimitation of gas exchange is inferred. Diffusion limitation was detected at sea level atV9O2 w3.0 L?min-1, and at progressively lower V9O2s as Pb and PI,O2 decreased. On the"summit", V9O2,max was 1.0 L?min-1 (27% of sea level value), Pa,O2 fell from 4.1 kPa to
���
��
��
������
*"�
E�����
-�6#3�)&�
'&�
�3�
@ F�!-F*#�?��9���?�-�"�!'�$��� 2#
� �&� �&�-������������ ��
�
��
���
��
��
������
*"�
E�����-�6#3�
�&�
'&�
�3�
� �&�� �&�-������������ ��
�
�
�
@ F�!-F*#
/�<<����������������
�# 5#
A;4+ ;G;A-@4;
Fig. 5. – a) Red cell oxygen partial pressure (PO2) plotted against time spent in the pulmonary capillary, startingat the equivalent of pulmonary artery PO2 at t=0 and finishing at the end–capillary (Pc9,O2) level. The gap[PA,O2 – Pc9,O2] represents diffusion limitation (failure to achieve complete alveolar–end capillary equilibration).The rate of increase of red cell PO2 during capillary transit is set by the diffusion–perfusion conductance ratio(DL/Q9b), the values being circled. b) DL/Q9b values are lower on exercise because DQ9b exceeds DDL. IPF:idiopathic pulmonary fibrosis; CFA: cryptogenic fibrosing alveolitis; DL,O2: diffusing capacity of the lung foroxygen; PA,O2: alveolar oxygen partial pressure.
GAS EXCHANGE PRINCIPLES
121

3.7 kPa (rest to exercise), and A–aPO2 increased from 0.2 kPa to 0.96 kPa due todiffusion limitation [30].
Interestingly, patients with Hb Andrew–Minneapolis with a left shift (P50 2.3 kPa) had(at sea level) a lower V9O2,max compared with controls, but a higher V9O2,max than those atmoderate altitude (PI,O2 13.3 kPa). The authors, somewhat fancifully, termed them"Human Llamas" [17].
Inert gas transport and the MIGET technique
The multiple inert gas elimination technique (MIGET), pioneered by Wagner et al.[31] measures the distribution of V9A/Q9 in an "as if" 50 compartment model of thelung; there are 48 compartments with discrete V9A/Q9 values from 0.01 to 10 plus shunt(V9A/Q9=0) and dead space (V9A/Q9=‘) compartments. MIGET is a considerable advanceon the three compartment model (fig. 4) of Riley and Cournand [10], but it istechnologically complex and suitable only for research studies. Six inert (nonreactivewith Hb) gases with a wide range of solubilities (l), (l is similar to the capacitancecoefficient, b, except for the units (ATM-1, not kPa-1 or mmHg-1)) are dissolved andinfused intravenously for 30 min, after which mixed venous, arterial and mixed expiredblood and gas samples are taken and analysed by gas chromatography for the arterialretention (Pa/Pv) and alveolar excretion (PA/Pv) ratio of each gas (fig. 6). The keyrelationship is:
Pa=Pv~l= lzV 0A=Q0½ � ð7ÞFigure 6 shows that 50% retention (Pa/Pv=0.5) occurs with a V9A/Q9 ratio v0.1 for
�&�
���
�6 1
�&�
��&�� �&� � ��
4F�
;�9��
-����������
�����9��
;�9 �
*� ���
�#
!3*6#3 �&� �&' �&�� ' ��
�&�
���
*6 1���2� �6
1
�&�
��&�� �&� � ��
4F�
;�9��
-����������
�����9��
;�9 �
*� ���
5# ���
��
��
�
�
�
�
�
*
9
�
�������
�&�
��
�&�
�&�
���&��
�#
D ���������
7���2<��?
49���/ �2����
D ���������B� �<�����������-��������� ��� <<��� ���!�#���������*����
� �
Fig. 6. – a) Theory: each tracer gas has a unique arterial retention (Pa/Pv) for a given V9A/Q9 ratio. b) Retentionand excretion: values of arterial (a) retention [Pa/Pv] and alveolar (A) excretion [PA/Pv] for all six tracer gases ina lung with moderate V9A/Q9 dispersion compared to a theoretical "ideal" lung (h) with no V9A/Q9 dispersion.c) Analysis: presentation: plot of ventilation and blood flow (smoothed) for 48 notional compartments (plus oneeach for shunt and dead space) against V9A/Q9 as a best fit to explain the data in figure b) on the basis oftheory in a).
J.M.B. HUGHES
122
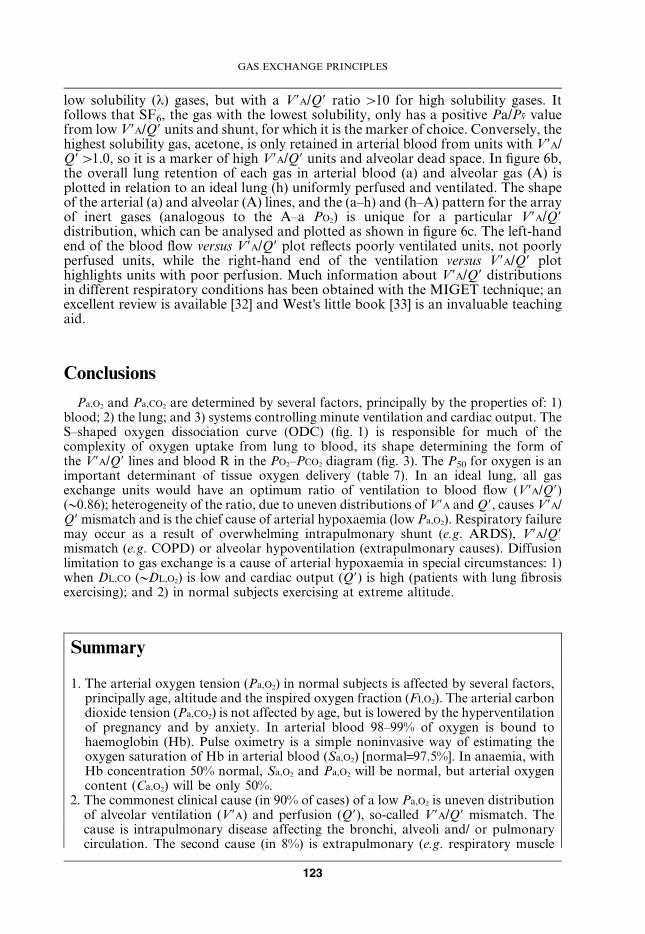
low solubility (l) gases, but with a V9A/Q9 ratio w10 for high solubility gases. Itfollows that SF6, the gas with the lowest solubility, only has a positive Pa/Pv valuefrom low V9A/Q9 units and shunt, for which it is the marker of choice. Conversely, thehighest solubility gas, acetone, is only retained in arterial blood from units with V9A/Q9w1.0, so it is a marker of high V9A/Q9 units and alveolar dead space. In figure 6b,the overall lung retention of each gas in arterial blood (a) and alveolar gas (A) isplotted in relation to an ideal lung (h) uniformly perfused and ventilated. The shapeof the arterial (a) and alveolar (A) lines, and the (a–h) and (h–A) pattern for the arrayof inert gases (analogous to the A–a PO2) is unique for a particular V9A/Q9distribution, which can be analysed and plotted as shown in figure 6c. The left-handend of the blood flow versus V9A/Q9 plot reflects poorly ventilated units, not poorlyperfused units, while the right-hand end of the ventilation versus V9A/Q9 plothighlights units with poor perfusion. Much information about V9A/Q9 distributionsin different respiratory conditions has been obtained with the MIGET technique; anexcellent review is available [32] and West’s little book [33] is an invaluable teachingaid.
Conclusions
Pa,O2 and Pa,CO2 are determined by several factors, principally by the properties of: 1)blood; 2) the lung; and 3) systems controlling minute ventilation and cardiac output. TheS–shaped oxygen dissociation curve (ODC) (fig. 1) is responsible for much of thecomplexity of oxygen uptake from lung to blood, its shape determining the form ofthe V9A/Q9 lines and blood R in the PO2–PCO2 diagram (fig. 3). The P50 for oxygen is animportant determinant of tissue oxygen delivery (table 7). In an ideal lung, all gasexchange units would have an optimum ratio of ventilation to blood flow (V9A/Q9)(y0.86); heterogeneity of the ratio, due to uneven distributions of V9A and Q9, causes V9A/Q9 mismatch and is the chief cause of arterial hypoxaemia (low Pa,O2). Respiratory failuremay occur as a result of overwhelming intrapulmonary shunt (e.g. ARDS), V9A/Q9mismatch (e.g. COPD) or alveolar hypoventilation (extrapulmonary causes). Diffusionlimitation to gas exchange is a cause of arterial hypoxaemia in special circumstances: 1)when DL,CO (yDL,O2) is low and cardiac output (Q9) is high (patients with lung fibrosisexercising); and 2) in normal subjects exercising at extreme altitude.
Summary
1. The arterial oxygen tension (Pa,O2) in normal subjects is affected by several factors,principally age, altitude and the inspired oxygen fraction (FI,O2). The arterial carbondioxide tension (Pa,CO2) is not affected by age, but is lowered by the hyperventilationof pregnancy and by anxiety. In arterial blood 98–99% of oxygen is bound tohaemoglobin (Hb). Pulse oximetry is a simple noninvasive way of estimating theoxygen saturation of Hb in arterial blood (Sa,O2) [normal=97.5%]. In anaemia, withHb concentration 50% normal, Sa,O2 and Pa,O2 will be normal, but arterial oxygencontent (Ca,O2) will be only 50%.
2. The commonest clinical cause (in 90% of cases) of a low Pa,O2 is uneven distributionof alveolar ventilation (V9A) and perfusion (Q9), so-called V9A/Q9 mismatch. Thecause is intrapulmonary disease affecting the bronchi, alveoli and/ or pulmonarycirculation. The second cause (in 8%) is extrapulmonary (e.g. respiratory muscle
GAS EXCHANGE PRINCIPLES
123

weakness, loss of CO2 chemosensitivity), involving insufficient total ventilation,often with a tidal volume that is too small to clear the obligatory anatomic deadspace completely.
3. In chronic respiratory failure, the Pa,O2 and Sa,O2 are severely reduced (Pa,CO2 may below, normal or high). In acute respiratory failure, often associated with shallowbreathing and an extrapulmonary cause, the Pa,CO2 is usually raised as much as thePa,O2 is lowered. An increase in FI,O2 restores Pa,O2 to a "normal" level for airbreathing, whatever the cause of the respiratory failure. In the acute on chronicrespiratory failure of chronic obstructive pulmonary disease (COPD), an FI,O2
increase may exacerbate the shallow breathing and lead to a further rise in Pa,CO2.4. The relationship between the oxygen content (CO2) of blood and its partial pressure
(PO2) – the oxygen dissociation curve (ODC) – is sigmoid in shape. The position ofthe curve on the PO2 axis is defined by the PO2 at half maximum blood oxygenconcentration (ySO2 50%) - the P50). A left shift (low P50) promotes oxygen loadingin the lung, and a right shift increases oxygen unloading to the tissues. Both may beadvantageous in the right circumstances – the left shift in the foetus, and at extremealtitude (though the left shift in carbon monoxide poisoning may be fatal), and theright shift in strenuous exercise.
5. The normal range for Pa,O2 is quite wide. The "efficiency" of pulmonary gas exchangeis often assessed, on a quantitative basis, in terms of a physiological dead space/tidalvolume ratio (VD/VT), reflecting abnormally high V9A/Q9 ratios, physiological shunt(Q9s/Q9T) or alveolar–arterial oxygen tension gradients (A–a PO2), reflecting the lowV9A/Q9 units.
6. Apart from V9A/Q9 mismatch and hypoventilation, a low Pa,O2 can be caused bydiffusion limitation or an anatomic shunt (either intrapulmonary or intracardiac).The hepatopulmonary syndrome (HPS), with microvascular dilatations, is anexample of a low Pa,O2, which could be due to either or both of these causes,depending on one’s point of view.
7. The passage of oxygen from terminal bronchioles to red cells is principally bymolecular diffusion, the final step being chemical combination with intra-red cellHb. The process is super-efficient, and only breaks down clinically when the surfacearea for exchange is reduced by alveolar destruction (a low oxygen diffusingcapacity (DL,O2)) and pulmonary blood flow (ycardiac output) is high (e.g. onexercise), giving a low DL/Q9 ratio.
8. The multiple inert gas elimination technique (MIGET) is a research tool formeasuring V9A/Q9 distribution in a 50 compartment model of the lung, which givesinsights into the pathogenesis of intrapulmonary disease.
Keywords: Diffusion limitation, hypoxaemia, oxygen and carbon dioxide tension inarterial blood, partial pressure at half maximum blood concentration, respiratoryfailure, ventilation–perfusion mismatch.
References
1. Cerveri I, Zoia MC, Spagnolatti L, Berrayah L, Grassi M, Tinelli T. Reference values of arterial
oxygen tension in the middle-aged and elderly. Am J Resp Crit Care Med 1995; 152: 934–941.
2. Templeton A, Kelman GR. Maternal blood gases (PAO2–PaO2), physiological shunt and VD/VT in
normal pregnant women. Br J Anaesth 1976; 48: 1001–1004.
3. Rea HH, Withy SJ, Seelye ER, Harris EA. The effects of posture in venous admixture and
respiratory dead space in health. Am Rev Resp Dis 1977; 115: 571–580.
J.M.B. HUGHES
124
4. BTS Statement. Managing passengers with respiratory disease planning air travel: British Thoracic
Society recommendations. Thorax 2002; 57: 289–304.
5. Powers SK, Dodd S, Freeman J, Ayers GD, Samson H, McNight T. Accuracy of pulse oximetry to
estimate HbO2 fraction of total Hb during exercise. J Appl Physiol 1989; 67: 300–304.
6. Gorini M, Spinelli A, Ginanni R, Duranti R, Gigliotti F, Scano G. Neural respiratory drive
and neuromuscular coupling in patients with chronic obstructive pulmonary disease. Chest 1990;
98: 1179–1186.
7. Wagner PD, Dantzker DR, Dueck R, Clausen JL, West JB. Ventilation–perfusion inequality in
chronic obstructive pulmonary disease. J Clin Invest 1977; 59: 203–216.
8. Aubier M, Murciano D, Milic–Emili J, et al. Effects of the administration of O2 on ventilation and
blood gases in chronic obstructive pulmonary disease during acute respiratory failure. Am Rev
Resp Dis 1980; 122: 747–754.
9. Stradling JR. Hypercapnia during oxygen therapy in airways obstruction: a reappraisal. Thorax
1986; 41: 897–902.
10. Riley RL, Cournand A. "Ideal" alveolar air and the analysis of ventilation–perfusion relationships
in the lungs. J Appl Physiol 1949; 1: 825–847.
11. Rahn H. A concept of mean alveolar air and the ventilation–blood flow relationships during
pulmonary gas exchange. Am J Physiol 1949; 158: 21–30.
12. Harris EA, Kenyon AM, Nisbet HD, Seelye ER, Whitlock RML. The normal alveolar–arterial
oxygen tension gradient in man. Clin Sci Mol Med 1974; 46: 89–104.
13. Whyte MKB, Hughes JMB, Jackson JE, Peters AM, Hempleman SC, Jones HA.
Cardiopulmonary response to exercise in patients with intrapulmonary intravascular shunts.
J Appl Physiol 1993; 75: 321–328.
14. Whyte MKB, Hughes JMB, Peters AM, Ussov W, Patel S, Burroughs AK. Analysis of right to left
shunt in the hepatopulmonary syndrome. J Hepatol 1998; 29: 85–93.
15. Crawford ABH, Regnis J, Laks L, Donnelly P, Engel LA, Young IH. Pulmonary vascular
dilatation and diffusion–dependent impairment of gas exchange in liver cirrhosis. Eur Respir J
1995; 8: 2015–2021.
16. Sauty A, Uldry C, Debetaz L-F, Leuenberger P, Fitting J-W. Differences on PO2 and PCO2
between arterial and arterialised ear lobe samples. Eur Respir J 1996; 9: 186–189.
17. Hebbel RP, Eaton JW, Kronenberg RS, Zanjani ED, Moore LG, Berger EM. Human llamas:
adaptation to altitude in subjects with high hemoglobin oxygen affinity. J Clin Invest 1978;
62: 593–600.
18. Ilano AL, Raffin TA. Management of carbon monoxide poisoning. Chest 1990; 97: 165–169.
19. Thom SP. Hyberbaric oxygen therapy. J Intensive Care 1989; 4: 58–74.
20. West JB. High Life: a history of high-altitude physiology and medicine. American Physiological
Society. Oxford, Oxford University Press, 1998.
21. West JB, Hackett PH, Maret JS, et al. Pulmonary gas exchange on the summit of Mt Everest.
J Appl Physiol Respir Environ Exerc Physiol 1983; 55: 678–687.
22. Winslow RM, Samaja M, West JB. Red cell function at extreme altitudes on Mt Everest. J Appl
Physiol Respir Environ Exerc Physiol 1984; 56: 109–116.
23. Longo CD, Nystrom GA. Fetal and newborn respiratory gas exchange. In: Crystal RG, West JB,
Barnes PJ, Weibel ER, eds. The Lung: Scientific Foundations. 2nd Edn. Philadelphia, Lippincott-
Raven Publishers, 1997; pp. 2141–2149.
24. Young IRW, Mazzone RW, Wagner PD. Identification of functional lung unit in the dog by
graded vascular embolization. J Appl Physiol 1980; 49: 132–141.
25. Weibel ER. Design of airways and blood vessels considered as branching trees. In: Crystal RG,
West JB, Barnes PJ, Weibel ER, eds. The Lung: Scientific Foundations. 2nd Edn. Philadelphia,
Lippincott-Raven Publishers 1997.
26. Paiva M, Engel LA. Model analysis of intra-acinar gas exchange. Respir Physiol 1985; 62: 257–272.
27. Scheid P, Piiper J. Diffusion. In: Crystal RG, West JB, Barnes PJ, Weibel ER, eds. The Lung:
Scientific Foundations. 2nd Edn. Philadelphia, Lippincott-Raven Publishers, 1997; pp. 1681–1691.
GAS EXCHANGE PRINCIPLES
125
28. Hughes JMB, Lockwood DNA, Jones HA, Clark RJ. DLCO/Q and diffusion limitation at rest and
on exercise in patients with interstitial fibrosis. Respir Physiol 1991; 83: 155–166.
29. Bencowitz HZ, Wagner PD, West JB. Effect of change in P50 on exercise tolerance at high altitude:
a theoretical study. J Appl Physiol Respir Environ Exerc Physiol 1982; 53: 1487–1495.
30. Wagner PD, Sutton JR, Reeves JT, Cymerman A, Groves BM, Malconian MK. Operation
Everest II. Pulmonary gas exchange during a simulated ascent of Mt Everest. J Appl Physiol 1987;
63: 2348–2359.
31. Wagner PD, Saltzman HA, West JB. Mesurement of continuous distributions of ventilation-
perfusion ratios: theory. J Appl Physiol 1974; 37: 588–599.
32. West JB, Wagner PD. Ventilation–perfusion relationships. In: Crystal RG, West JB, Barnes PJ,
Weibel ER, eds. The Lung: Scientific Foundations. 2nd Edn. Philadelphia, Lippincott-Raven
Publishers, 1997.
33. West JB. Pulmonary Physiology and Pathophysiology: an Integrated, Case-Based Approach.
Philadelphia, Lippincott, Williams and Wilkins Publishers, 2001.
J.M.B. HUGHES
126