pullout test on fully grouted bolt sheathed by different...
TRANSCRIPT

Research ArticlePullout Test on Fully Grouted Bolt Sheathed byDifferent Length of Segmented Steel Tubes
Xiaowei Feng, Nong Zhang, Guichen Li, and Gangye Guo
Key Laboratory of Deep Coal Resource Mining, Ministry of Education of China, School of Mines,China University of Mining and Technology, Xuzhou 221116, China
Correspondence should be addressed to Nong Zhang; [email protected]
Received 25 October 2016; Revised 28 December 2016; Accepted 11 January 2017; Published 20 February 2017
Academic Editor: Tai Thai
Copyright © 2017 Xiaowei Feng et al. This is an open access article distributed under the Creative Commons Attribution License,which permits unrestricted use, distribution, and reproduction in any medium, provided the original work is properly cited.
In order to evaluate the anchorage performance of rebar bolt sheathed by different length of segmented steel tubes, a total of eightgroups of pullout tests were conducted in this study. The steel tubes, segmented by 5 cm, 7 cm, 9 cm, 10 cm, and 15 cm, utilizedin current study were bonded together by a high performance two-component adhesive to form standard 30 cm long steel tube.Unlike axial stress distribution in bolt, the axial stress distribution in steel tube showed exponential decrease trend from tube-clampend to bolt-clamp end; thus a series of interesting results were observed. For instance, the sequence for segments detachment hadits specific order of priority; the failure form of bolting system, the load oscillation characteristics, and the final displacementwere highly determined by the length of the last segment, namely, the one fixed by clamp of testing machine. Moreover, the load-displacement relationship for some particular samples was further investigated from the perspective of energy transformation,and the disequilibrium extension of interfacial decoupling was also discussed. This paper, from a relatively idealized perspective,presents a laboratorial solution to interpret the mechanical performance of the bolt installed in layered strata; so far at least itdemonstrates that a bolt installed in comparatively thicker layer of strata can last more durable and stable.
1. Introduction
Among dozens of supporting components utilized in under-ground mining or construction activities around the world,the rock bolt is one of the most popular devices on accountof its series of superiorities, such as active support effectson rock surface, versatile applicability for different kinds ofgeological conditions, relatively low cost, convenient and fastinstallation, and so forth. After over one hundred years ofstep-by-step advancement and development of this technol-ogy since the end of 19th century, rock bolt now has manyderived species like bonded bolt, Swellex, the Split Set, theExpansion Shell, the cone bolt, Garford, Roofex, and the D-bolt. However, most of them only show minor differenceswith each other in their design and they almost share the sametheoretical background, like mechanically anchored bolts,fully/partially grouted bolts, and friction anchored bolts.
Generally, the fully grouted bolt using resin cartridgesis mostly utilized worldwide [1, 2]. In the U.S. roof boltinghas been the primary roof support method for underground
coal mines since the early 1970s [3]; more than 90% of theapproximately 68 million roof bolts installed annually inunderground coal mines in the USA belong to this kind ofbolt [4]. As compared with end-anchored one or frictionanchored one, the performance of fully grouted bolt is muchmore reliable and it can provide a full-range support torock mass all through its length [5]. But the performancealso depended on a series of important factors, such asthe bonding properties of bolt/grout interface, or grout/rockinterface, the mechanical properties of bolt rod and externalfaceplate (if installed), strength of grouting material, andproperties of rock mass, pretensioned or nonpretensioned.
Unlike other support methods adopted in undergroundoperations, rock bolt is installed within the rock mass toprovide reinforcement effects from interior, whereas struc-tures such as U-shaped steel, steel net, and hydraulic proppassively restrain the deformation of rock mass on the tunnelperimeter. This is also a distinction between reinforcementand support according toWindsor andThompson’s literature[6]. Hence it may be difficult to probe load-deformation
HindawiShock and VibrationVolume 2017, Article ID 4304190, 16 pageshttps://doi.org/10.1155/2017/4304190

2 Shock and Vibration
InterfacialAxial
P
Curve bCurve a
0 5 10 15 20 25Distance from borehole collar (cm)
0
1
2
3
Inte
rfaci
al sh
ear s
tress
on
bolt
(MPa
)
5 10 15 20 250Distance from borehole collar (cm)
Curve a1Curve b1
0
2
4
6
8
10
12
14
Axi
al st
ress
on
bolt
(MPa
)
(a)
Shear stress
Axial stress
Pick-up length
Anchor length
Neutral point
0
⨁
(b)
Figure 1: Comparison between axial stress and shear stress distribution along a rock bolt in pullout test and in situ. (a) Distribution patternsfor axial stress and interfacial shear stress of rock bolt under pullout test (after Hawkes and Evans [14]); (b) distribution of axial stress andinterfacial shear stress for rock bolt in situ (adapted from Farmer’s work [7]).
mechanism in engineering field because of multivariatefactors. Generally, laboratory pullout test is utilized to inves-tigate the reinforcement effects of bolts. Regardless of thegreat number of pullout tests conducted around the world invarious types [7–13], certain mechanical differences betweenbolt in pullout test and bolt in situ should be noted.
2. Mechanical Differences between Bolt inPullout Test and Bolt In Situ
For a fully grouted bolt embedded in steel tube and then sub-jected tensile load in pullout test, Framer’s solution predictsthat both of the axial stress of bolt and the interfacial bondingstress will drop exponentially from the loading end to thefree-loading end [7]. Typical pullout test results conductedby Hawkes and Evans are plotted in Figure 1(a) [14]; curves aand b show two different states of axial stress along the boltwhen suffering tensile load. a indicates a coupling interfacialstate that the bolt is under a relatively low pullout load;b indicates a partially decoupled interfacial state which iscaused by overlarge pullout load. As for the shear stressdistribution pattern along the bonding interface, there hasbeen certain correspondencewith the axial stress distributionpattern hereinbefore shown. Curves 𝑎
1and 𝑏1in Figure 1(a)
show the interfacial stress distribution mode; the formerindicates a case that the pullout load is relatively low, whereasthe latter indicates a case that the overlarge pullout load leadsto certain amount of interfacial bonding failure. It has beencompletely testified that the peak bonding shear stress willgradually move from loading end to the free-loading end fora bolt subjected tensile load [10]; then a complete bonding
failure should firstly occur at a section close to the loadingend, causing a zero shear stress at the beginning of curve 𝑏
1,
which is then followed by certain range of partial bondingfailure towards the peak stress point. Beyond the section, theshear stress decreases exponentially to the free-loading endin accordance with Farmer’s solution [7].
For an in situ installed rock bolt, however, some par-ticular differences should be addressed. Figure 1(b) showsaxial/shear stress distribution along a rock bolt installed insitu; it can be seen that distribution patterns of both axialstress and shear stress show obvious differences with whatFigure 1(a) presents. However, for the section close to theborehole end, the axial stress exhibits similar trend to that inpullout test. The explanation for these differences mainly liesin the fact that the bolt in pullout test only has an anchoringlengthwhereas the bolt in situ has another pick-up length andneutral point.
3. Scope and Theoretical Background ofThis Study
Due to the millions of years’ strata sedimentary on earth,many strata in deep coal mines show laminated occurrence.Bolt installed in this kind of strata should be able to sustainsevere disturbance of serial decoupling along the bondinginterface or strata separation; it may be difficult to directlyconduct real-time monitoring on bolting failure process andevaluate relevant bearing capacity in practical engineeringsites. Here in this study, we design an experimental setupwhich we hope to present certain contributions to corre-sponding underground supporting theories. A total of eight

Shock and Vibration 3
Grout Bolt Rock
Interfacedecoupling
Grout cracking
Decoupling stagePlastic stageElastic stage
Necking
Groutundamaged
Intactinterface
Partiallydamaged
Figure 2: Description for failure process of a passively installed rock bolt under pullout load.
groups of pullout tests on fully grouted bolt embedded insegmented steel tubes were conducted. The segmented steeltubes, varied by length as 5 cm, 7 cm, 9 cm, 10 cm, and15 cm, utilized in current study were bonded together by ahigh performance two-component adhesive to form standard30 cm long steel tube. Before we conduct the experiment,some notable theoretical tips need to be proposed firstly forclarification.
For a passively installed rock bolt, the “passive” meansno pretension force was applied on the bolt-exposed endduring bolt installation process, and its support effects willbe only activated provided that the rock mass deforms firstly[15]. Generally, its final failure is caused by decoupling ofbolt/grout interface or grout/rock interface if the bolt tensilefracture is excluded, depending on which one is the weakest[16]. This failure process progressively extends from loadedend (borehole collar) to unloaded end (borehole bottom)and finally leads to the total failure of bolting system;Figure 2 schematically describes the specific mechanismunder pullout load, which is similar to the situation inlaboratorial test. Three different kinds of stages, decouplingstage, plastic stage, and elastic stage, are observed fromloaded end (exposed end) to unloaded end (embedded end)in sequence. The elastic range is decreasing whereas thedecoupling range is increasing under ascending pullout load,whereas the plastic range plays a transitional role whichalters a specific elastic section into a decoupling section, andplastic range generally keeps an approximately fixed lengthunder an idealized theoretical situation.The peak shear stressduring this process is associated with elastic stage; its movingpace keeps identical as that of elastic range. Actually, many
literatures have reported this kind of evolution process; formore details, please refer to relevant works [15, 17–19], and soforth.
Themechanical interactionmechanism among steel tube,bonding material, and bolt is drawn in Figure 3; for a specificsegment taken from the bolting system, it always keepsaxial mechanical equilibrium, which means that the overallresultant force applied on the upper end equals that of thelower end. Hence, the axial stress distribution in steel tubeshows a completely opposite pattern as what exists in boltrod, considering that the axial stress distribution of bolt hasalready been explained in Section 2; hence axial stress in steeltube shows an exponential increase from bolt-clamp end totube-clamp end. Based on aforementioned theories, it can beconcluded that section nearby the tube-clamp end bears arelatively larger force for steel tube. Due to the fact that the30 cm long steel tube is axially bonded by segmented tubeswith different lengths, thus the separation of bonded steeltubes subjected to pullout load under laboratorial conditionwill firstly occur at the bonding ends closing to tube-clampend; study hereinafter gives specific explanations for variedforms of bolting failures under this experimental setup.
4. Laboratory Study
4.1. Samples Preparation Procedure. Layered strata in engi-neering field can have different thicknesses, and their bedsuccession also shows an unordered status. In this experi-ment, steel tubes with varied lengths were utilized to simulatelayered strata. In the past study, adopting steel tube tosimulate rock mass in laboratory is generally accepted, and

4 Shock and Vibration
Tube-clamp end
Bondingmaterial
Steel tube
Bolt-clamp end
P
P
Bolt
Bolt
Cem
ent
Axial stress in tube
Dist
ance
to tu
be-c
lam
p en
d
Axial stress in bolt
(x)
(x)
Dist
ance
to b
olt-c
lam
p en
dt (x)
b(x)
Stee
l tub
e
t(x) + dt(x)
b(x) + db(x)
Figure 3: Mechanical interaction mechanism of a bolting system.
Table 1: Samples grouping and labels specification.
Sample labels Combining forms Sample labels Combining formsS1 (S1-1, S1-2, S1-3) 15 + 5 + 5 + 5∗ S5 (S5-1, S5-2, S5-3) 9 + 7 + 7 + 7S2 (S2-1, S2-2, S2-3) 15 + 5 + 10 S6 (S6-1) 10 + 5 + 15S3 (S3-1, S3-2, S3-3) 15 + 10 + 5 S7 (S7-1, S7-2) 10 + 10 + 10S4 (S4-1, S4-2) 15 + 15 S8 (S8-1, S8-2) 10 + 15 + 5∗The terms sequence means the order for different lengths of segments from tube-clamp end to bolt-clamp end.
this kind of test measure was also widely adopted in earlyliteratures [20, 21]. It is surely that this testing measure canevaluate the bearing capacity of a bolting system; a speciallydesigned sample that is able to sustain a large pullout loadunder laboratorial environment will undoubtedly providebetter reinforcement to rock in practical trials.
Generally, each sample was comprised of a rebar rockbolt (35 cm in length and 18mm in diameter) and a 30 cmlong steel tube; the steel tube was combined by several steeltube segments. The inner diameter and outer diameter forthe segment were 30mm and 50mm, respectively. But theirlength, intercepted by 7 cm, 9 cm, and 10 cm, varied from5 cmto 15 cm; then the segments with varied lengths combinedwith others tomake a standard steel tubewith a unified lengthof 30 cm. In accordance with this pattern, a total of 8 forms ofsteel tubes were finally created, and they are listed in Table 1.For the sake of clarification, we hereinafter define the firstsegment as the one close to bolt-clamp end, and the lastsegment is the one clamped by MTS machine. For further
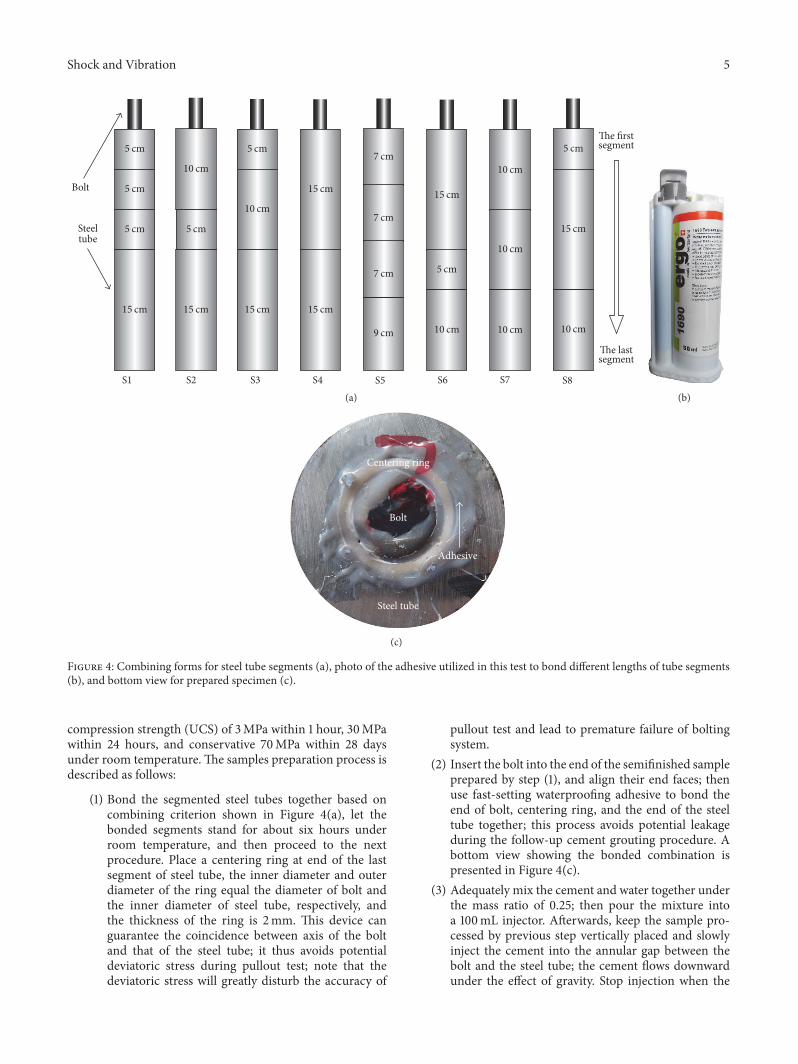
clarification, all of these combining forms are schematicallydrawn in Figure 4(a). The segments were bonded togetherby a high performance two-component adhesive named Ergo(see Figure 4(b)), which could produce a much better bond-ing strength on the ends than traditional welding measure.This adhesive has a series of advantages like high viscosity,high strength, and high temperature resistance; its ultimatestrength for a metal-to-metal bonding can reach up to20N/mm2, and hence its application in this test is reasonable.In addition, the last segment aligned along the bolting systemshould avoid being 5 cm and 7 cm; otherwise the pullout testwould cause a premature failure close to the tube-clamp endconsidering mechanical equilibrium illustrated in Figure 3.For example, a combining form like 15 + 10 + 5 should beavoided.
The grouting material in this test was a special kindof modified cement, which was mainly utilized for fullygrouting bolt support in coalmine roadway.The cement, withcement to water ratio predefined as 0.25, can have a uniaxial
Shock and Vibration 5
5 cm
5 cm
5 cm
15 cm
5 cm
10 cm
15 cm
5 cm
15 cm
10 cm
10 cm
5 cm
15 cm
10 cm
10 cm
10 cm
15 cm
15 cm
7 cm
7 cm
7 cm
9 cm
15 cm
5 cm
10 cm
Bolt
Steeltube
S1 S2 S3 S4 S5 S6 S7 S8
The firstsegment
The lastsegment
(a) (b)
Bolt
Steel tube
Centering ring
Adhesive
(c)
Figure 4: Combining forms for steel tube segments (a), photo of the adhesive utilized in this test to bond different lengths of tube segments(b), and bottom view for prepared specimen (c).
compression strength (UCS) of 3MPa within 1 hour, 30MPawithin 24 hours, and conservative 70MPa within 28 daysunder room temperature. The samples preparation process isdescribed as follows:
(1) Bond the segmented steel tubes together based oncombining criterion shown in Figure 4(a), let thebonded segments stand for about six hours underroom temperature, and then proceed to the nextprocedure. Place a centering ring at end of the lastsegment of steel tube, the inner diameter and outerdiameter of the ring equal the diameter of bolt andthe inner diameter of steel tube, respectively, andthe thickness of the ring is 2mm. This device canguarantee the coincidence between axis of the boltand that of the steel tube; it thus avoids potentialdeviatoric stress during pullout test; note that thedeviatoric stress will greatly disturb the accuracy of
pullout test and lead to premature failure of boltingsystem.
(2) Insert the bolt into the end of the semifinished sampleprepared by step (1), and align their end faces; thenuse fast-setting waterproofing adhesive to bond theend of bolt, centering ring, and the end of the steeltube together; this process avoids potential leakageduring the follow-up cement grouting procedure. Abottom view showing the bonded combination ispresented in Figure 4(c).
(3) Adequately mix the cement and water together underthe mass ratio of 0.25; then pour the mixture intoa 100mL injector. Afterwards, keep the sample pro-cessed by previous step vertically placed and slowlyinject the cement into the annular gap between thebolt and the steel tube; the cement flows downwardunder the effect of gravity. Stop injection when the

6 Shock and Vibration
Slick lead
Separator lifting motor
Actuator
Pedestal
Test bed
Lower separator
Screw lead
Upper separator
(a)
Sample undertensile test
(b)
Sample under uniaxial compression test
(c)
Figure 5: Schematic sketch for the testing machine (a) and its front views for tensile test (b) and compression test (c).
fluid level reaches to the top end of the steel tube; theadoption of injector in this step guarantees a uniformand stable grouting speed of the cement, and thusvoids in the cement column surrounding the bolt canbe avoided.
(4) Place a similar top centering ring to fill the annularspace between bolt and steel tube after the cementpaste reaches the upper limit of the steel tube;similarly, the top centering ring can cooperate withthe bottom centering ring to insure the coincidencebetween the axis of bolt and the axis of steel tube.
4.2. Brief Introduction for Test Machine. The tensile test wasconducted on a MTS criterion 64 series testing machine;it mainly consists of assembly parts as follows: pedestal,actuator, test bed, lower separator, upper separator, screwlead, and slick lead. The test bed is connected with the upperseparator by lead to form a stiff frame, and the test bed isalso connected with the actuator by load cell. This machinehas two testing spaces; the first one is designed for tensile testlocating between the lower separator and the upper separator;the second one is designed for compression test locatingbetween the test bed and the lower separator. Both of thespaces can be adjusted by moving the lower separator. Theschematic sketch for the machine is shown in Figure 5.
Here in this test, the bolt-cement-steel bolting systemis pulled by the movement of lower separator and upperseparator; the bolt-exposed end is fixed by lower clampwhereas the steel tube end is fixed by upper clamp, and thenthe moving directions for bolt and the tube suffering pulloutload are downward and upward, respectively.
5. Results and Discussion
5.1. Standard Tensile Test on Bolt. The mechanical prop-erty of the bolt under tensile load is vital to subsequent
23.40 mm
18 m
m
11.7
0 m
m16
.80 m
m
Yield load
Tensile load
Necking
20 40 60 80 1000Deformation (mm)
0
20
40
60
80
100
120
140
160
Load
(kN
)
Figure 6: Deformation-load behavior of a standard bolt undertensile test.
pullout tests; thus a standard tensile test was carried outfirstly. The deformation-load relationship can be plotted outby recording changing amount of tensile load at differentintervals of deformation; the result is shown in Figure 6. Theinitial diameter and rib spacing of the bolt were 18mm and11.70mm, respectively.The bolt was elongated elastically untilthe deformation reached 8.5mm, which was then followed bya yield load at 96 kN or so lasting for a deformation of 6.1mm.Afterwards, the curve showed a convex trend until a tensileload of 145 kN was reached, where the deformation was66.50mm. The bolt continued to elongate at the level of thetensile load until the initiation of necking at a displacementof approximately 95.02mm. Finally, the bolt failed at adeformation of 107.43mm, accompanied by a brittle failure.Bolt diameter at the failure point was 11.70mm, and therib spacing neighboring the failure point was extended to16.80mm.

Shock and Vibration 7
0
20
40
60
80
100
120
140
160Lo
ad (k
N)
7020 400 50 6010 30Displacement (mm)
S1-2S1-3S2-1S3-1
S4-1S4-2
S3-3
(a)
0
20
40
60
80
100
120
140
160
Load
(kN
)
7020 400 50 6010 30Displacement (mm)
Ave-S1Ave-S2
Ave-S3Ave-S4
(b)
Figure 7: Load-displacement relationship (a) and average curves (b) for samples terminated by bolt fracture during pullout tests.
5.2. Testing Results for Samples Damaged by Bolt Fracture.The termination of the pullout tests is mainly caused bydecoupling at bolt-grout interface if bolt tensile strengthis large enough; the decoupling progressively extends in away from bolt-clamp end to tube-clamp end in theory, andthe interface successively undergoes three kinds of contact-ing states, namely, the elastic, softening, and decouplingstate [19]. However, several pullout tests were prematurelyinterrupted due to the unpredictable tensile fracture ofthe bolt. This was mainly caused by the dramatic contraston ultimate strength between cement and bolt, and thebolt tensile strength was not large enough to transfer thepullout load to cement and further isolate the bonding statebetween bolt and cement. Their load-displacement curveswere gathered together in Figure 7(a). By overall analysis, acommon point could be observed, which showed the lengthfor the last segment of all fractured samples was 15 cm. The15 cm segment of steel tube was the longest one among allsegments, as can be interpreted from Table 1. Consider staticequilibrium relationship of a bolt suffering tensile test; theexposed bolt end undertook identical load as what the tube-clamp end did; then the last segment suffered the largestpullout load among all segments; this theory has already beenillustrated in Figure 3. Afterwards, the adhesive face betweenthe last segment and the last but one segment would be priordetached under the ascending pullout force sourcing fromMTS machine. This process was accompanied by decouplingat bolt-grout interface, and the decoupling would extend toboth sides of the separation [22, 23]. Afterwards, two formsof final fracture should exist; the first one was completeinterface decoupling, which might occur if the bolt couldbe finally pulled out from the tube; the second one was boltfracture during pullout procedure, which occurred if the boltelongation rate surpassed relative displacement between bolt
S1-2
S2-1
S3-1
S4
1st2nd3rd
1st
2nd
2nd
1st
1st
1st
3rd
2nd
2nd
Boltfractureplace
4th
3rd
Figure 8: Fracture forms for fractured samples S1-2, S2-1, S3-1, andgroup S4.
and grout. Failure for current case belonged to the secondone; if the bolt elongation between the detached segmentstook advantage, then the fracture place was as what samples 1-2 and 3-1 have shown in Figure 8; if the bolt elongation closingbolt-clamp end took advantage, then the fracture place was aswhat sample 2-1 and groups 4 have shown in Figure 8.
Plus, these curves showed high degree of similaritieswith each other; they almost shared the identical elastictrend and plastic trend; their peak strength also showed littledifference at 158 kN or so, with corresponding displacementapproximately positioned at 48mm. The pullout load firstlycame through an approximate linear increase to 105 kN withrespect to a displacement ranging from 7mm to 11mm,depending on their different combining forms. Then theyall experienced a similar yield process under relatively smallelongations no more than 4mm. Afterwards, they all showeda convex trend to their peak load and enduring certaindeformation until a sudden brittle bolt fracture occurred. In

8 Shock and Vibration
Table 2: Characteristic parameters for tensile test on bolt and pullout test interrupted by bolt-fracture.
Testing measure Yield load(kN)
Elastic elongation(mm)
Yield lasting(mm)
Peak load(kN)
Displacementversus peakload (mm)
Finaldisplacement
(mm)Tensile test 96 8.5 6.1 145 66.50 107.43Pullout test 105 7∼11 ≤4 158 48 55∼75
order to more clearly investigate the differences among them,here Figure 7(b) presents the respective average curves forthese four groups of pullout test; it can be seen that groupS3 had the largest displacement whereas group S1 had thesmallest one. And S2 had the largest load to displacementratio based on changing trend in linear increasing section, thelagging detachment between the last segment and the last butone segment contributed to a relatively longer sustainabilityof the whole intact interface; it thus intensified the rigidity ofthe bolting system.
Though in some ways all curves may look similar withthe bolt tensile test plotted in Figure 6, their characteristicpoints do show strengthened effects. The common point wasthat their fracture belonged to tensile fracture of bolt; hence itshould be meaningful if their characteristic parameters werecompared; see Table 2. It can be seen that the mechanicalproperties of grouted bolt were some kind of intensified;the yield load and peak load for pullout test were mag-nified whereas corresponding displacements were sharplydecreased. It is a remarkable fact that the elastic elongation fordifferent measures showed no big difference, which indicatesthat the early stage for pullout test was also determined bybolt elongating property. The yield lasting displacement forpullout test decreased to a value less than 4, which was dueto the fact that most length of bolt was annularly bondedby cement and its yield performance was restrained to someextent.
5.3. Testing Results for Groups S1–S3 Damaged by InterfacialDecoupling. As stated in former sections, the failure formsfor a bolting systemunder pullout test can be divided into twotypes; they are bolt fracture and interfacial decoupling; nowinterfacial decoupling is studied in this section.The length ofthe last segment for groups S1∼S3was 15 cm, and their pulloutresults showed certain similarities, but the samples failed bybolt fracture were excluded; they were S1-2, S1-3, S2-1, S3-1,and S3-3. S1-1 and S2-2 were also excluded due to the largesection of voids between bolt rod and steel tube; the tests onthem were terminated at a relatively low pullout load. Thevoids were caused by directly pouring cement during samplespreparation procedure, but the injector adopted later solvedthe problems. Hence, only samples S2-3 (15 + 5 + 10) and S3-2 (15 + 10 + 5) were left for analysis in this section, which wehope can reveal failure mechanism of bolting system underthis kind of segments combining form; the load-displacementrelationship for these two samples is plotted in Figure 9.
From the curves plotted in Figure 9, it seems that theearly linear section,mainly determined by displacement-loadmechanism of bolt, was well adapted to the equivalent linear
section of the curve shown in Figure 6. But the overall curvetrend in Figure 9 was multiply determined by mechanicalproperties of bolt, cement, and bolt-grout (or grout-tube)bonding effects, which sustained an overall stability of boltingsystem before failure occurred. For sample S2-3, the peakload was 156 kN with respect to a displacement of 48mm;then the load directly dropped from its peak load to 90 kNexperiencing a displacement of 6mm; sample S3-2 shared asimilar decreasing process as the former did. After the firstsignificant drop of load value, both of the samples enduredanother round of load increase, and this kind of similar loadoscillation repeated three or four times for both samples.Another observation was that the amplitude of the oscillationshowed a general increase trend; take S3-2 for example; thepeak loads from the first cycle to the third cycle were 132 kN,144 kN, and 146 kN, respectively. After the oscillations, theload rapidly decreased to an approximate zero level; the finaldisplacements for S2-3 and S3-2 were 129mm and 161mm,respectively. Figures 9(b) and 9(c) present the top-views of thelast segments (15 cm in length) of S2-3 and S3-2; it can be seenthat part of the cement close to the bonding end was highlydisintegrated; the largest breakage depths for S2-3 and S3-2are 34.95mm and 39.98mm, respectively. Cement breakagefor the rest section was invisible to the naked eye, but it wasfor sure that incubation of unobservable cracks should exist.
In actual mining sites, it is normal to observe loadoscillation of an installed bolt; the incentives can comefrom various aspects, such as nearby mechanized excavation,blasting, and strata stress variation. Figure 10 shows the crestsand troughs for oscillation section along the curves shownin Figure 9(a); it seems that the changing law for troughsfitted well a linear increasing trend whereas the changing lawfor crests showed a quadratic parabola relationship. Overall,the gradual approach trend for crests and troughs indicatedthe decreasing trend of oscillation amplitude. But it deservesattention that the amplitude for S2-3 was relatively smallerthan S3-2, which is reasonable if we take the length of middlesegments of S2-3 (5 cm) and S3-2 (10 cm) into consideration.After the occurrence of ends detachment between the lastsegment and the middle segment, the degree of decouplingbilateral the separation and the bolt elongation were vitalto overall stability of bolting system. A 5 cm long middlesegment in S2-3 was easier to be fully decoupled or bedetached with the first segment, causing energy consumptionon segments detachment and bolt elongation between thefirst segment and the middle segment. Then its first dropfrom peak load was brought forward to compensate theenergy consumption; the oscillation amplitude and breakagedepth were also comparatively smaller than those of S3-2,

Shock and Vibration 9
0
20
40
60
80
100
120
140
160
Load
(kN
)
1200 140 16010020 8040 60Displacement (mm)
S2-3S3-2
(a)
quad
34.95 mm
(b)
39.98 mm
(c)
Figure 9: Load-displacement relationship (a) for samples S2-3 (15 + 5 + 10) and S3-2 (15 + 10 + 5) terminated by interfacial decoupling andrespective end views ((b), (c)) for them.
as indicated by comparing subfigures in Figure 9; similarphenomenon will be further probed in Figure 14. Inspired bythe results, it can be concluded that a relatively thicker layerof rock mass is positive to bolt supporting in undergroundengineering.
5.4. Testing Results for Samples S5. The combination formfor samples S5 was 9 + 7 + 7 + 7; that is, the first seg-ment was 7 cm and the last one was 9 cm. Test results forthis group of samples showed some specialties, as plottedin Figure 11(a). Overall, the peak load was reached withrespect to a relatively smaller displacement as compared withaforementioned examples; all of the peak load was lowerthan 140 kN.However, their elastic stage, determined by bolt’selastic property, kept similar trend by a displacement range at10mm or so.
In view of curves trend, it seems that the failure form forsamples S5-1 and S5-3 was caused by sudden bolt fracture
as cases analyzed in Section 5.2, but their actual situationwas absolutely different. For sample S5-1, the load reachedits peak value 131 kN at an axial displacement of 23mm,when the interfacial decoupling had already fully developedat the last segment (9 cm). The rest bonding section betweenbolt and cement in this segment was not able to sustain theoverall stability of bolting system under the circumstance;hence the load rapidly dropped to zero level after the peakload point [22]. We manually pulled out the last segmentand measured the fracture length of the cement annulusafter the test; the fractured length was 56.95mm, accounting63.28% of the total length of the last segment; see Figure 11(b).Hence, the rest contact area was not able to sustain a relativelyhigh load of 131 kN; then the load rapidly dropped to zerounder the effects of sliding friction at bolt-cement interfacewith a final displacement of 44mm. S5-3 had undergone adifferent evolution mechanism; the load abruptly decreasedto zero from the peak value 140 kN with respect to the

10 Shock and Vibration
CrestTrough
Load
(kN
)120
105
100
115
110
95
90
y = −48.03 + 4.91x − 0.03x2
R2 = 0.9374
y = 66.48 + 0.415x
R2 = 0.9268
60 65 70 75 80 8555Displacement (mm)
(a)
CrestTrough
y = −89.16 + 5.02x − 0.03x2
R2 = 0.9999
y = 3.66 + 1.28x
R2 = 0.9530
80
90
100
110
120
130
140
150
Load
(kN
)
70 80 90 100 11060Displacement (mm)
(b)
Figure 10: Crests and troughs fitting for oscillation of samples S2-3 (a) and S3-2 (b).
0
20
40
60
80
100
120
140
Load
(kN
)
0 1006020 8040Displacement (mm)
S5-1S5-2
S5-3
(a)
S5-1
S5-2
S5-3
56.95 mm
19.69
mm
(b)
Figure 11: Load-displacement relationship for samples S5 (a) and their failure photos (b).
displacement of 42mm. However, its actual sharp decreaseof load was actually caused by severe deformation of boltend due to overlarge clamping force of the test machine (seedot-and-dash rectangle in Figure 11(b)), which incurred theunexpected detachment of the bolt from the clamp duringpullout test; otherwise the curve should have evolved further.
Unlike what S5-1 and S5-3 experienced, S5-2 presenteda complete process of load-displacement relationship; theprogressive interfacial decoupling wasmonitored during test.Different with samples S2-3 and S3-2, the cycle numberfor load oscillations only occurred once; relevant amplitudefor the oscillation, ranging from 64 kN to 76 kN, was alsocomparatively smaller than S2-3 and S3-2. Afterwards, it
gradually decreased to the approximate zero level withrespect to a final displacement of 92mm. By disclosingthe inner view of the last segment, see dotted circle inFigure 11(b), the maximum value for cement fracture depthwas 19.69mm,whereas the rest section kept a visualized intactstate; it thus confirms the evolution model for bolting failureprocedure presented in Figure 3. Even the last segment of S5-2 had a longer residual intact length as compared with S5-1; the stress state was identical when load dropped to zero,namely, decoupling state or fraction state. Aforementionedanalysis indicates that a 9 cm long steel tube positioned atthe last place cannot provide stable and long-term supporteffects.

Shock and Vibration 11
S7-1S7-2
0
20
40
60
80
100
120
140
160Lo
ad (k
N)
20 40 60 80 100 1200Displacement (mm)
(a)
S8-1S8-2
0
20
40
60
80
100
120
140
160
Load
(kN
)
20 40 60 80 1000Displacement (mm)
(b)
Figure 12: Load-displacement relationship for samples S7 and S8.
At last, the second segment and the third segment alsodetachedwith each other during test, as indicated in Figure 11,which lagged the detachment between the third one and thelast one; it demonstrates that both of the 5 cm long segmentand 7 cm long segment neighboring the last one are easilyisolated under ascending pullout force.
5.5. Testing Results for Samples S6, S7, and S8. The length forthe last segment of samples S6 (10 + 5 + 15), S7 (10 + 10 + 10),and S8 (10 + 15 + 5) was 10 cm long; their load-displacementrelationships are presented in Figure 12. As can be interpretedfromFigure 12(a), load-displacement relationship for samplesS7-1 and S7-2 almost kept an associated pattern. The linearincrease of load before 10mm was primarily determinedby bolt elastic response; consequent small shock on thecurves indicated the transition from linear reaction to plasticreaction of bolt; then the curves were followed by a durationof convex process till the arrival of the peak load, 153 kNaccompanied by a displacement of 43mm.Then the first cycleof sudden decrease started from peak load to 69 kN withrespect to a displacement variation of 8.6mm; afterwards,three cycles of load oscillations could be apparently observed;the oscillation law will be explicitly stated and compared aswhat occurred in S8-1 and S8-2 in following parts. At last,both of the curves headed to the zero-load level and finallyfinished the whole procedure with final displacements of106mm and 110mm, respectively.
Early-stage load-displacement evolution for group S8 wasidentical to group S7 (see Figure 12(b)), but the differencesshowed out after the arrival of peak load. For one thing,the oscillation pace for group S8 was not that coordinateas what group S7 experienced; for another, changing pacefor S8-2 lagged behind that of S8-1 when the displacementvaried between 9mm and 68mm. A possible explanationfor the lagging appearance should be the relatively lateroccurrence of first detachment of tubes for sample 8-2, and
the detachment acted as premature weakening effects tooverall stability of bolting system.
The length for the last segment of groups S6, S7, andS8 was unified 10 cm; hence it should be instructive tocomprehensively analyze their commons and differences. Asshown in Figure 13, the average curves for groups S7 and S8were fitted and testing curve for S6 was also added.The figureindicated that group S6 shared a high coordination with Ave-S7 before the end point of the last oscillation. However, thearrival of peak load, decreasing amplitude, and oscillationtimes for Ave-S8 showed a premature trend. Furthermore,fracture forms presented in Figure 13(b) can serve as anauxiliary interpretation; note that the separated segments(leftward 10 cm long ones for S6 and S7) were automaticallydetached during pullout test, but the rightward tube-bondedsections still kept tight and the tubes could not be manuallytaken off from the assembly due to the residual fractionalresistance along the interface.
The reason for cooperative changing pace between S6and Ave-S7 can be interpreted from energy transformationperspective. It has been acknowledged by scholars that boltpullout test is accompanied by energy-absorbing process [24],where the input source is MTS machine, and the outputpath contains heat generating of bolt, fracture of cement,fraction along bonding interfaces, acoustic energy, and soforth. Generally, the overall energy of a bolting systemunder pullout test can be described by the area coveredby load-displacement curve. On account of aforementionedexplanation, it can be understood that if the rest combiningsegments gradually detached with each other after the firstdetachment between the last segment and the middle one,then the detachment between segments gave space to con-sumemore energy, especially for bolt elongation. Figure 13(b)indicates that the first segment and the second segmentsubsequently detached with each other under the ascendingpullout load; thus energy was further consumed on bolt

12 Shock and Vibration
Ave-S8S6Ave-S7
0
20
40
60
80
100
120
140
160Lo
ad (k
N)
8040 60 100 1200 20Displacement (mm)
(a)
S6
S7
S8
10 cm
10 cm
10 cm 10 cm
10 cm 15 cm 5 cm
15 cm5 cm
Detached
(b)
Figure 13: Load-displacement relationship comparison among S6, S7, and S8 (a) and relevant fracture forms (b).
elongation and cement breakage around the separation; thenthe area under load-displacement curves for S6 and Ave-S7is larger than Ave-S8. On the contrary, if the rest bondedsegments kept original intact and integral state after the firstdetachment between the last segment and the middle one,then the energy consumption was largely concentrated at thebonding interface of the last segment (10 cm), which inducedstress concentration and rapid bonding state alteration alongthe interface; see example S8. This process played as anadverse effect to overall stability of the bolting system; thena premature failure of the system accompanied by lower peakload, lower oscillation duration, and smaller displacementwas apparent.
From another perspective, it can be seen that if the lengthfor the segment neighboring the last one was 10 cm or less,such as 5 cm and 7 cm, then its adhesion with the first (three-segment combination patterns such as groups S2, S3, S6, andS7) or the second (four-segment combination patterns suchas groups S1, S5) segment would be easily isolated. However,the situation would alter to reverse side if the segmentneighboring the last one was 15 cm; its right end detachmentwas hard to occur (group S8).Theoretically, the elongation ofthe exposed bolt rod contributed a relatively larger amountof displacement as compared with the rest section; this wasmainly because of the fact that the elongation along therest bolt rod was still some kind of “protected” by steeltube; the cement annulus in the tube coated the loaded boltto resist bolt elongation. The disequilibrium displacementwould evolve in the first and the second segments; the 15 cmlong segment had a larger contact area with the inner boltto sustain the deformation. It thus acted as protection effectsto its right-hand neighboring 5 cm long segment; then thecontacting ends between the first and the second segmentsof S8 kept intact during thewhole test whereas correspondingsegments of S6 and S7were detachedduring the test, as shown
in Figure 13(b). Aforementioned theory is vividly drawn inFigure 14; it thus demonstrates that the strata with relativelylarger thickness are positive to the stability of bolting system.
In order to analyze the oscillation mechanism in Fig-ure 13(a), the crest and trough for each cycle of load oscil-lation versus displacement are studied (see Figure 15). It maybe concluded from Figures 15(a) and 15(b) that the crests forS6 and S7 expressed a descending trend, and this trend met alinear expression verywell; both of the correlation coefficientsreached up to 0.99. Changing pattern for troughs, however,showed an ascending trend; the fitted equations revealedan approximate linear increasing relationship. The variationtrends of crests and troughs gradually approached to eachother as the oscillation continued, which indicates that theamplitude for oscillation was turning smaller. Load cycle forAve-S8 only recycled twice, and Figure 15(c) demonstratesthat the connecting lines almost parallel with each other; thisis because of the fact that decoupling length and load bearingcapacity loss in the second oscillation were almost identicalto the corresponding amounts in the first one.
5.6. Integral Comparison and Analysis. Based on all of thesetests, their characteristic parameters are gathered together inthis section; see Table 3. By extracting data and comparativeanalysis, following laws can be obtained from Table 3:
(1) For a failure caused by interfacial decoupling, thefinal displacement is closely related to the length ofthe last segment. The longer the last segment is, thelarger the final displacementwill be. Among them, thelargest final displacement is 161mm, which is almostfour times larger than the smallest one, only 44mm,reached by S5-1.
(2) Value for peak load and value for displacementcorresponding to peak load have a high correlationwith the length of the last segment; longer length

Shock and Vibration 13
Decoupling extension directions
Bolt elongation restrainedBolt elongates freely Prior occurring of interface decoupling
Bolt-clamp end
Lagging occurring of interface decouplingTube-clamp end
CementSteel tube
Bolt
Tube segment bonding face
LoadLoad
This segment is vital to sustainability
Figure 14: Disequilibrium relation between bolt elongation and interfacial decoupling.
CrestTrough
y = 135.21 − 0.6x
R2 = 0.9952
y = 59.98 + 0.28x
R2 = 0.9107
75
80
85
90
95
100
105
Load
(kN
)
50 55 60 65 70 75 8045
Displacement (mm)
(a)
y = 129.85 − 0.53x
R2 = 0.9999
y = 47.30 + 0.47x
R2 = 0.9149
CrestTrough
70
75
80
85
90
95
100
Load
(kN
)
50 55 60 65 70 75 8045
Displacement (mm)
(b)
CrestTrough
70
75
80
85
90
95
100
105
Load
(kN
)
44 46 48 50 52 54 56 58 60 6242
Displacement (mm)
(c)
Figure 15: Crests and troughs for load oscillation of samples S6 (a), S7 (b), and S8 (c).

14 Shock and Vibration
Table3:Pu
llout
results
fora
llsamples.
Group
sSamples
Linear
reactio
n(D
ispl.-load)
Peak
load
(kN)
Disp
l.correspo
ndsto
peak
load
(mm)
Oscillationtim
esFinalfract.form
Num
bersfor
segm
ents
detachment
Finald
ispl.
(mm)
S1(15+5+5+5)
1∗—
——
——
——
29-106
157
480
Boltfract.
264
310-100
156
490
Boltfract.
258
S2(15+5+10)
17-103
157
470
Boltfract.
165
2∗—
——
——
——
39-104
156
483
Decou
pling
2129
S3(15+10
+5)
17-107
158
490
Boltfract.
274
28-102
159
484
Decou
pling
2161
39-105
161
480
Boltfract.
269
S4(15+15)
17-104
160
470
Boltfract.
161
29-107
161
490
Boltfract.
166
S5(9
+7+7+7)
19-105
131
230
Decou
pling
244
214-106
142
431
Decou
pling
292
313-105
140
420
Clam
pdetachment
249
S6(10+5+15)
18-103
153
423
Decou
pling
2114
S7(10+10
+10)
18-102
153
433
Decou
pling
2106
28-103
154
423
Decou
pling
2110
S8(10+15
+5)
18-102
151
352
Decou
pling
1102
29-104
151
372
Decou
pling
192
∗Pu
llout
tests
onthem
werefaileddu
etothelarge
sectionof
grou
ping
gapbetweenbo
ltrodandste
eltube,w
hich
was
caused
byim
prop
erpreparationof
specim
ens.

Shock and Vibration 15
of the last segment will lead to the higher valuesfor peak load and corresponding displacement. TakeS5-1 for example; its peak load and correspondingdisplacement are 131 kN and 23mm, respectively,whereas the equivalent values for S3-1 are 158 kN and49mm, respectively.
(3) Failure caused by bolt tensile fracture is more likelyto occur if the length of the last segment is largerthan 15 cm; otherwise the failure caused by interfacialdecoupling is more likely to occur. Regardless of thedifference, the early stage of the linear relationship inL-D curves shows no obvious differences among dif-ferent groups of samples, which is mainly determinedby linear mechanical properties of the utilized boltunder tensile test.
(4) The segments detachment times during pullout testare some kind of related with the length of thelast segment but one in the combined tubes; if thissegment has a length of 15 cm or so, then the boltelongation in this segment is restrained to someextent, accompanied by relatively fewer detachmenttimes.
6. Conclusion Remarks
(1) Laboratorial pullout test on bolting system generallyadopts steel tube to simulate rock mass to evaluatemechanical capacity of a specific boltingmeasure.Thestress distribution of steel tube shows a reverse patternwith the stress distribution of the bolt under pullouttest; the stress exponentially drops from tube-clampend to bolt-clamp end. Under the combination ofvaried length of steel tubes, the detachment of twoneighboring tubes will firstly occur between the lasttwo segments; then the rest detachments will extendto bolt-clamp end. However, this kind of extensionwill be interrupted if an approximate 15 cm longsegment is met; it provides resistance effects to therelevant elongation of its inner bonded bolt, and thusits neighboring ends along extending direction areprotected from being detached.
(2) Bolt tensile fracture is the main factor that leadsto bolting system failure if the length of the lastsegment is 15 cm or more; though it shares identicalfracture form with individual bolt tensile test, themechanical properties of the former are intensified tosome extent. If the last segment is 10 cm or less, thenthe failure caused by interfacial decoupling is surelyto occur. No matter in what kind of failure forms, theearly stage along all of their load-displacement curvesis completely characterized by a linear increasingstage, which is mainly determined by linear mechan-ical properties of the utilized bolt under tensile test.
(3) In most circumstances, load oscillation occurs ifthe fracture form belongs to interfacial decoupling;the oscillation is induced by progressive decouplingat bolt-grout interface. The crest evolution shows a
quadratic parabola relationship whereas the troughshows a linear increasing trend for samples with thelast segment defined as 15 cm long; if this segment is10 cm long, then the crest evolution shows a lineardecreasing trend whereas the trough evolution showsa linear increasing trend.
(4) If the length for last segment is defined as 9 cm or less,then this segment will be too short to counterbalancethe steady growth of pullout load. It is believed thatthe segments detachment will occur in no time oncethe test begins, and the progressive decoupling atthe bolt-grout interface in the last segment will alsoprematurely show out, which directly leads to thebearing load deficiency during the load-ascendingprocedure.
(5) If the bolting system is terminated by interfacialdecoupling, then the final displacement in pullouttest is highly associated with the length of the lastsegment; the relationship shows a positive correlation.This correlation is also applicable to the peak loadand its corresponding displacement; their values alsoincrease as the length for the last segment rises.
Competing Interests
The authors declare that they have no competing interests.
Acknowledgments
The authors would like to acknowledge the financial supportfor this study from the Program (IRT 14R55) for InnovativeResearch Team in University by Ministry of Education ofChina, Project 51274193 supported by National Natural Sci-ence Foundation of China, Science and Technology Project ofMinistry of Education of China (113030A), and Priority Aca-demic Program Development of Jiangsu Higher EducationInstitutions. The comments and suggestions from WanxingSong in State Key Laboratory of Coal Resources and SafeMining (CUMT) are highly appreciated.
References
[1] G. S. Esterhuizen and I. B. Tulu, “Analysis of alternatives forusing cable bolts as primary support at two low-seam coalmines,” International Journal of Mining Science and Technology,vol. 26, no. 1, pp. 23–30, 2016.
[2] J. Chen, P. C. Hagan, and S. Saydam, “Parametric study on theaxial performance of a fully grouted cable bolt with a new pull-out test,” International Journal ofMining Science andTechnology,vol. 26, no. 1, pp. 53–58, 2016.
[3] S. S. Peng, “Topical areas of research needs in ground control—a state of the art review on coal mine ground control,” Interna-tional Journal of Mining Science and Technology, vol. 25, no. 1,pp. 1–6, 2015.
[4] A. J. S. Spearing, A. J. Hyett, T. Kostecki, and M. Gadde, “Newtechnology formeasuring the in situ performance of rock bolts,”International Journal of Rock Mechanics and Mining Sciences,vol. 57, pp. 153–166, 2013.

16 Shock and Vibration
[5] M. Ghadimi, K. Shahriar, and H. Jalalifar, “Optimization ofthe fully grouted rock bolts for load transfer enhancement,”International Journal of Mining Science and Technology, vol. 25,no. 5, pp. 707–712, 2015.
[6] C. R. Windsor and A. G. Thompson, “Rock reinforcement—technology, testing, design and evaluation,” ComprehensiveRock Engineering, vol. 4, pp. 451–484, 1993.
[7] I. W. Farmer, “Stress distribution along a resin grouted rockanchor,” International Journal of Rock Mechanics and MiningSciences & Geomechanics Abstract, vol. 12, no. 11, pp. 347–351,1975.
[8] A. Kilic, E. Yasar, and A. G. Celik, “Effect of grout properties onthe pull-out load capacity of fully grouted rock bolt,” Tunnellingand Underground Space Technology, vol. 17, no. 4, pp. 355–362,2002.
[9] Y. Chen, “Experimental study and stress analysis of rockbolt anchorage performance,” Journal of Rock Mechanics andGeotechnical Engineering, vol. 6, no. 5, pp. 428–437, 2014.
[10] J. Nemcik, S. Ma, N. Aziz, T. Ren, and X. Geng, “Numericalmodelling of failure propagation in fully grouted rock bolts sub-jected to tensile load,” International Journal of Rock Mechanicsand Mining Sciences, vol. 71, pp. 293–300, 2014.
[11] A. Kılıc, E. Yasar, and C. D. Atis, “Effect of bar shape on thepull-out capacity of fully-grouted rockbolts,” Tunnelling andUnderground Space Technology, vol. 18, no. 1, pp. 1–6, 2002.
[12] S. Ma, J. Nemcik, and N. Aziz, “An analytical model of fullygrouted rock bolts subjected to tensile load,” Construction andBuilding Materials, vol. 49, pp. 519–526, 2013.
[13] T.-B. Zhao, W.-Y. Guo, Y.-C. Yin, and Y.-L. Tan, “Bolt pull-outtests of anchorage bodyunder different loading rates,” Shock andVibration, vol. 2015, Article ID 121673, 8 pages, 2015.
[14] J. M. Hawkes and R. H. Evans, “Bond stresses in reinforced con-crete columns and beams,” Journal of the Institute of StructuralEngineers, vol. 10, no. 24, pp. 323–327, 1951.
[15] L. He, X. M. An, and Z. Y. Zhao, “Fully grouted rock bolts: ananalytical investigation,” Rock Mechanics and Rock Engineering,vol. 48, no. 3, pp. 1181–1196, 2015.
[16] C. Li and B. Stillborg, “Analytical models for rock bolts,”International Journal of Rock Mechanics and Mining Sciences,vol. 36, no. 8, pp. 1013–1029, 1999.
[17] L. Blanco Mart́ın, M. Tijani, and F. Hadj-Hassen, “A newanalytical solution to the mechanical behaviour of fully groutedrockbolts subjected to pull-out tests,”Construction and BuildingMaterials, vol. 25, no. 2, pp. 749–755, 2011.
[18] B. Benmokrane, A. Chennouf, and H. S. Mitri, “Laboratoryevaluation of cement-based grouts and grouted rock anchors,”International Journal of Rock Mechanics and Mining Sciences &Geomechanics Abstracts, vol. 32, no. 7, pp. 633–642, 1995.
[19] F. F. Ren, Z. J. Yang, J. F. Chen, and W. W. Chen, “An analyticalanalysis of the full-range behaviour of grouted rockbolts basedon a tri-linear bond-slip model,” Construction and BuildingMaterials, vol. 24, no. 3, pp. 361–370, 2010.
[20] C. C. Li, “A new energy-absorbing bolt for rock support in highstress rockmasses,” International Journal of RockMechanics andMining Sciences, vol. 47, no. 3, pp. 396–404, 2010.
[21] A. J. Hyett, W. F. Bawden, G. R. Macsporran, and M. Moosavi,“A constitutive law for bond failure of fully-grouted cablebolts using a modified hoek cell,” International Journal of RockMechanics andMining Sciences and, vol. 32, no. 1, pp. 11–36, 1995.
[22] X. Feng, N. Zhang, and C. Lv, “Effects of interface damageresulting from the separation of layered strata on bolt anchoring
systems,” Shock and Vibration, vol. 2016, Article ID 2590816, 13pages, 2016.
[23] A. J. Hyett, M. Moosavi, and W. F. Bawden, “Load distributionalong fully grouted bolts, with emphasis on cable bolt rein-forcement,” International Journal for Numerical and AnalyticalMethods in Geomechanics, vol. 20, no. 7, pp. 517–544, 1996.
[24] C. C. Li, G. Stjern, and A. Myrvang, “A review on theperformance of conventional and energy-absorbing rockbolts,”Journal of Rock Mechanics and Geotechnical Engineering, vol. 6,no. 4, pp. 315–327, 2014.

International Journal of
AerospaceEngineeringHindawi Publishing Corporationhttp://www.hindawi.com Volume 2014
RoboticsJournal of
Hindawi Publishing Corporationhttp://www.hindawi.com Volume 2014
Hindawi Publishing Corporationhttp://www.hindawi.com Volume 2014
Active and Passive Electronic Components
Control Scienceand Engineering
Journal of
Hindawi Publishing Corporationhttp://www.hindawi.com Volume 2014
International Journal of
RotatingMachinery
Hindawi Publishing Corporationhttp://www.hindawi.com Volume 2014
Hindawi Publishing Corporation http://www.hindawi.com
Journal ofEngineeringVolume 2014
Submit your manuscripts athttps://www.hindawi.com
VLSI Design
Hindawi Publishing Corporationhttp://www.hindawi.com Volume 2014
Hindawi Publishing Corporationhttp://www.hindawi.com Volume 2014
Shock and Vibration
Hindawi Publishing Corporationhttp://www.hindawi.com Volume 2014
Civil EngineeringAdvances in
Acoustics and VibrationAdvances in
Hindawi Publishing Corporationhttp://www.hindawi.com Volume 2014
Hindawi Publishing Corporationhttp://www.hindawi.com Volume 2014
Electrical and Computer Engineering
Journal of
Advances inOptoElectronics
Hindawi Publishing Corporation http://www.hindawi.com
Volume 2014
The Scientific World JournalHindawi Publishing Corporation http://www.hindawi.com Volume 2014
SensorsJournal of
Hindawi Publishing Corporationhttp://www.hindawi.com Volume 2014
Modelling & Simulation in EngineeringHindawi Publishing Corporation http://www.hindawi.com Volume 2014
Hindawi Publishing Corporationhttp://www.hindawi.com Volume 2014
Chemical EngineeringInternational Journal of Antennas and
Propagation
International Journal of
Hindawi Publishing Corporationhttp://www.hindawi.com Volume 2014
Hindawi Publishing Corporationhttp://www.hindawi.com Volume 2014
Navigation and Observation
International Journal of
Hindawi Publishing Corporationhttp://www.hindawi.com Volume 2014
DistributedSensor Networks
International Journal of