puerto rico urban garden soils and plants study summary · puerto rico urban garden soils and...
TRANSCRIPT

Final Report prepared by Karen Bradham for Region 2’s Evelyn Huertas May 12, 2015
Puerto Rico Urban Garden Soils and Plants Study Summary
United States Environmental Protection Agency’s (USEPA) Region 2 shipped soil and plant samples
collected at or near urban garden locations in San Juan, Puerto Rico. Soils and plants from the urban
garden areas were sent to USEPA’s Office of Research and Development (ORD) for total arsenic and lead
concentrations and bioaccessibility testing for these inorganics, which was conducted in Karen Bradham’s
lab (ORD, Research Triangle Park, North Carolina). After collecting weights for the soil containers and
contents, the soils were blended and spread out in drying trays. The trays containing the soil were placed
in an air-drying oven and dried for ~ 5 days at < 40 ºCelsius and sample weights were collected
subsequent to air-drying. The soil was then added to a vibrating 2 millimeter stainless steel sieve screen
to remove any large chunks of aggregated soil. Material remaining on the screen was disaggregated using
a gloved hand and rescreened. The soil was sieved to < 250 micrometers to maximize the quantity of soil
for bioaccessibility and total lead and arsenic analysis. The soil was passed through a riffler five times and
aliquots were collected in pre-cleaned 250 milliliter high-density polyethylene bottles. The soil samples
were extracted according to EPA Method 9200.2-86 Standard Operating Procedure for an In Vitro
Bioaccessibility Assay for Lead in Soil dated April 2012 with the following exceptions: duplicate
extractions of each soil sample were conducted (duplicate samples are only required once per batch
according to EPA Method 9200.2-86) and arsenic values are reported (method is in the process of being
validated for arsenic by the EPA Technical Review Workgroup Bioavailability Committee). The plant
samples were homogenized and freeze dried to collect dry weights. Microwave assisted digestion of the
plant and soil samples was completed using USEPA Method 3052 and 3051A, respectively. Lead and
arsenic analysis in the sample digests was completed by USEPA Method 6010C (Inductively Coupled
Plasma-Optical Emission Spectroscopy). All microwave assisted digestion and analysis qualtiy controls
(QCs) were within acceptable quality assurance parameters as described in USEPA Solid Waste methods
guidelines.
Site Descriptions
Soils and plants were taken from three urban garden sites, labeled Site 1, 2 and 3. Figure 1 below shows
the area around the Martin Peña Special Planning District (as designated by the Puerto Rico Planning
Board) in San Juan, Puerto Rico, which is where the three urban gardens are located. Some of these

Final Report prepared by Karen Bradham for Region 2’s Evelyn Huertas May 12, 2015
community vegetable gardens are the result of the efforts of empowered citizens who organized their
communities, cleaned up a parcel of land, and created a vegetable garden. Another of these gardens
were created in vacant lots that arose as result of housing demolitions and further relocations being
undertaking in the area. The district of interest (highlighted in yellow) is shown more closely in Figure 2.
The exact locations are not disclosed to preserve anonymity of these communities. As can be seen, the
area is urbanized, with a canal splitting the district.
Figure 1: Satellite Image of the area surrounding the Martin Peña District in San Juan, Puerto Rico.
Figure 2: A closer look at the proximity of the urban garden sites, as highlighted in yellow in Figure 1.

Final Report prepared by Karen Bradham for Region 2’s Evelyn Huertas May 12, 2015
Total soil and plant lead and arsenic concentrations
Total arsenic and lead concentrations in soils sampled across the conterminous United States of America
range from 0.1-55 and 2-300 milligrams per kilogram (mg/kg or parts per million), respectively (Adriano,
2001). We are currently conducting a literature review for soil and plant concentrations reported in
Puerto Rico. General plant concentrations within the conterminous USA for lead range from 0.7-7.2
mg/kg in background soils and 2.5-82 mg/kg in soils containing 200 mg/kg total lead. General plant
concentrations within the conterminous USA for arsenic range from 0.1-1000 mg/kg (high concentrations
found in rice and rice roots).
Ecological Soil Screening Levels (Eco-SSLs) are concentrations of contaminants in soil that are protective of
ecological receptors that commonly come into contact with and/or consume biota that live in or on soil.
Eco-SSLs are derived separately for four groups of ecological receptors: plants, soil invertebrates, birds,
and mammals. As such, these values are presumed to provide adequate protection of terrestrial
ecosystems. Eco-SSLs are derived to be protective of the conservative end of the exposure and effects

Final Report prepared by Karen Bradham for Region 2’s Evelyn Huertas May 12, 2015
species distribution, and are intended to be applied at the screening stage of an ecological risk
assessment. The Eco-SSLs are not designed to be used as cleanup levels and the USEPA emphasizes that it
would be inappropriate to adopt or modify the intended use of these Eco-SSLs as national cleanup
standards. The Eco-SSL for plants for As and Pb are 18 and 120 mg/kg, respectively. More information
about Eco-SSLs can be found at: http://www.epa.gov/ecotox/ecossl/.
For most common garden vegetables, the uptake of metals is not very high. For the most part, exposures
would tend to come from consuming adhered soil on unwashed produce (i.e., fruits, like tomatoes, would
be less of a problem than roots or tubers, although these are frequently scrubbed or peeled before
consumption). Nevertheless, EPA generally cautions against gardening in areas of known contamination.
Also, it may be advisable to NOT consume produce from a garden in the drip line of a home or building
structure or from areas where contamination is known to be located.
Another source of exposure related to gardening is handling/intensive contact with contaminated soil and
the potential for tracking the contaminated soil into the house (on tools, shoes, or clothing). Vegetables,
hands, clothing, and tools should be cleaned before being brought indoors to reduce tracking
contaminated soil into the residence.
Human health screening levels for arsenic vary by location throughout the US due to existing geological
sources of arsenic, which are above generic background concentrations. However, a screening level of 40
mg/kg (milligrams per kilogram or parts per million) of arsenic is generally considering an appropriate
screening level for soil arsenic (unrestricted residential contact with soils). While 400 mg/kg (milligrams
per kilogram or parts per million) lead in soil is OSWER’s human health soil screening concentration for
lead (unrestricted residential contact with soils). These recommendations address concerns with track-in
of contaminated soil and possible consumption of unwashed produce. The USEPA Technical Review
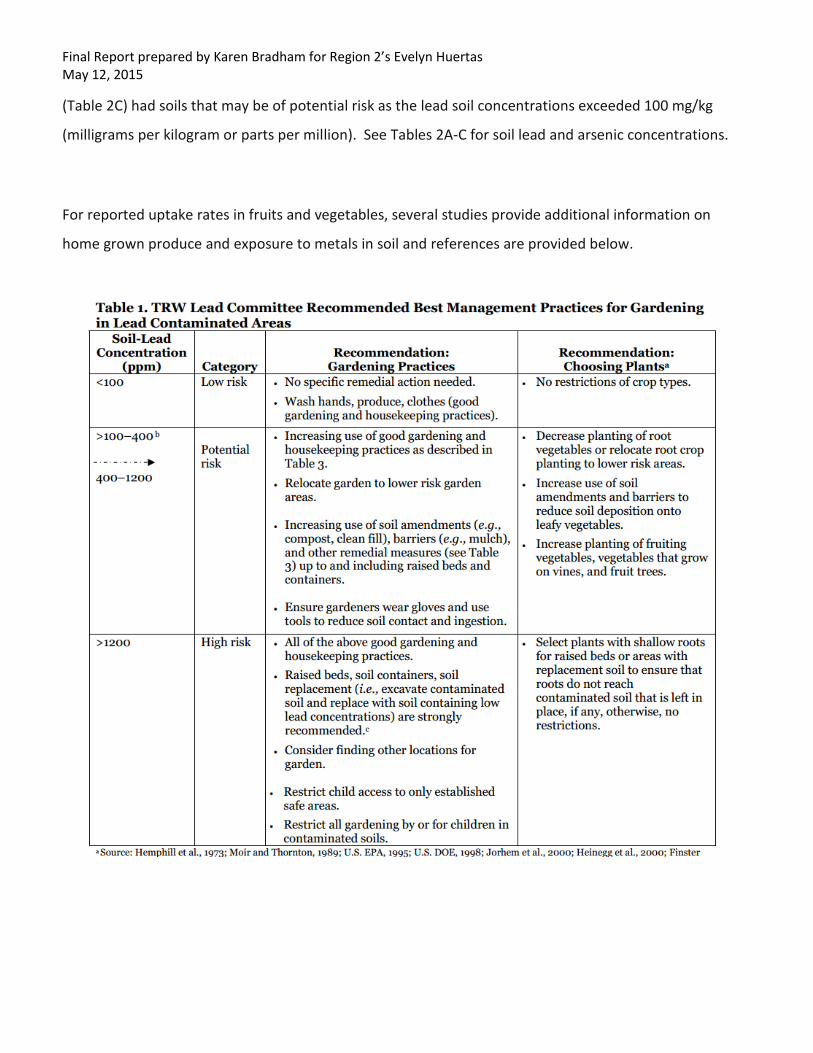
Workgroup (TRW) Lead Committee developed the recommendations located in Table 1 for urban gardens.
Based on the TRW’s recommendations soils from the Einstein School and Las Monjas locations had soil
lead concentrations below 100 mg/kg (milligrams per kilogram or parts per million), which indicates low
risk for potential exposure to contaminated soils and produce. However, 2 soils from the El Pilar location
Final Report prepared by Karen Bradham for Region 2’s Evelyn Huertas May 12, 2015
(Table 2C) had soils that may be of potential risk as the lead soil concentrations exceeded 100 mg/kg
(milligrams per kilogram or parts per million). See Tables 2A-C for soil lead and arsenic concentrations.
For reported uptake rates in fruits and vegetables, several studies provide additional information on
home grown produce and exposure to metals in soil and references are provided below.

Final Report prepared by Karen Bradham for Region 2’s Evelyn Huertas May 12, 2015
Bioaccessibility measurements
Human exposure to arsenic (As) in soils can have serious health impacts including increased cancer
risk associated with ingestion of As-contaminated soils (Calabrese et al. 1996; Davis et al. 1991; Dudka and
Miller 1999). Accurate assessment of human health risks from exposure to As-contaminated soils depends
on estimating its bioavailability, which is defined as the fraction of ingested As absorbed across the
gastrointestinal barrier and available for systemic distribution and metabolism. Arsenic bioavailability
varies among soils and is influenced by site-specific soil physical and chemical characteristics and internal
biological factors. U.S. Environmental Protection Agency guidance describes the need for development of
soil As bioavailability methods and data to improve the accuracy of human exposure and risk calculations
at As-contaminated sites (USEPA 2007). An understanding of arsenic bioavailability for dietary sources of
arsenic is important when comparing total arsenic intakes across populations with different exposure
patterns. Such patterns can affect the absorbed dose of arsenic, and thus also whether (and to what
extent) an adverse effect occurs.
Bioaccessibility refers to the physiological solubility of arsenic and lead, which is potentially bioavailable
for absorption from an environmental medium or diet fraction (e.g., soil, rice). The bioaccessible fraction
of ingested arsenic/lead is the portion of arsenic/lead that is available for absorption from the wall of the
gastrointestinal tract.
Arsenic and lead bioaccessibility was calculated and expressed on a percentage basis according to
equation 1.
𝐴𝑠 𝑏𝑖𝑜𝑎𝑐𝑐𝑒𝑠𝑠𝑖𝑏𝑖𝑙𝑖𝑡𝑦 (%) = ( 𝑖𝑛 𝑣𝑖𝑡𝑟𝑜 𝐴𝑠
𝑡𝑜𝑡𝑎𝑙 𝐴𝑠 ) 𝑥 100 Eq. (1)
Where:
In vitro As = As extracted during the in vitro assay
Total As = Amount of As in the contaminated soil used for bioaccessibility determination

Final Report prepared by Karen Bradham for Region 2’s Evelyn Huertas May 12, 2015
Table 2. Total soil element concentrations determined by microwave digestion in accordance with EPA
Method 3051 with analysis by Inductively Coupled Plasma-Optical Emissions Spectroscopy (ICP-OES) in
accordance with EPA method 6010. In vitro bioaccessibility (IVBA) values determined in accordance with
EPA method 9200.2-86 with analysis by Inductively Coupled Plasma-Mass Spectrometer (ICP-MS) in
accordance with EPA method 6020C. Soils listed by site location. Total soil concentrations that exceed
human health screening levels (40 ppm and 400 mg/kg for As and Pb, respectively) or recommended
guidelines for urban gardens (only available for Pb) at 100 mg/kg are highlighted in red text.
Table 2A: Einstein School Site Soil Totals and IVBA results
Soil ID As Totals (mg/kg)
± S.D. As IVBA
(%) ± S.D.
Pb Totals (mg/kg)
± S.D. Pb IVBA
(%) ± S.D.
tire 1 7.21 0.9 24.0 0.0 41.7 4.5 71.9 4.0
box 2 5.21 0.4 31.7 0.5 16.7 1.6 87.4 1.2
box 3 4.71 0.3 37.2 NA 23.5 1.2 78.2 NA
box 3 Dup A 4.11 2.8 42.0 0.4 18.9 9.4 100 2.5
soil box 4 9.3 0.2 31.3 1.2 44.9 0.0 74.3 0.2
box 4 Dup 8.6 0.4 30.8 0.4 39.6 1.7 75.2 2.1
ground 5 8.4 1.5 24.3 0.4 26.4 4.9 100 0.8
ground 5D 10.3 0.5 19.02 0.5 32.2 1.8 84.6 2.6
E.Composite 8.11 0.5 18.82 0.5 35.6 2.6 68.1 2.3
Table 2B: Las Monjas (LM) Site Soil Totals and IVBA results
Soil ID As Totals (mg/kg)
± S.D. As IVBA
(%) ± S.D.
Pb Totals (mg/kg)
± S.D. Pb IVBA
(%) ± S.D.
LM 1 9.01 1.3 23.3 1.0 33.5 0.1 66.3 0.4
LM 1 Dup A 8.71 0.7 24.3 1.6 35.6 1.8 64.6 5.9
LM 2 8.71 0.4 23.4 0.4 34.9 1.4 68.3 0.1
LM 2 Dup B 9.2 1.2 23.7 0.2 37.9 1.9 67.1 1.7
LM 3 9.0 0.6 24.0 0.9 53.4 2.4 74.0 0.4
LM 3 Dup C 9.2 1.2 23.33 0.8 57.3 6.5 71.1 3.0
LM 4 10.6 1.1 24.23 0.1 39.0 2.2 77.6 1.1
LM 4 Dup D 10.0 0.7 26.73 0.8 37.4 1.5 79.0 1.3
LM 5 6.11 0.2 18.33 0.3 21.9 1.2 63.1 5.1
LM 5 Dup E 5.41 0.1 21.4 0.8 21.3 0.5 59.0 1.7
LM 6 Comp.
8.8 0.1 28.9 1.2 34.7 0.6 76.3 0.9

Final Report prepared by Karen Bradham for Region 2’s Evelyn Huertas May 12, 2015
Table 2C: El Pilar (EP) Site Soil Totals and IVBA results
Soil ID As
Totals (mg/kg)
± S.D. As IVBA
(%) ± S.D.
Pb Totals (mg/kg)
± S.D. Pb IVBA
(%)
± S.D.
EP 1 55.4 3.4 31.6 0.1 130.9 29.3 74.1 4.1
EP 2 15.7 0.2 25.5 0.7 82.5 5.1 73.4 0.4
EP 2 Dup A 13.9 0.0 31.7 1.6 91.5 6.2 80.3 7.6
EP 3 10.5 0.6 16.7 0.1 59.2 1.7 64.3 0.5
EP 3 Dup B 12.1 0.6 21.0 0.4 53.9 2.7 65.7 0.7
EP 4 10.3 0.6 22.1 0.2 77.7 0.3 64.7 2.8
EP 4 Dup C 9.3 0.4 19.0 0.1 86.8 0.6 60.5 1.5
EP 5 12.8 1.1 20.0 0.2 59.2 1.3 63.6 0.1
EP 5 Dup D 11.3 0.1 20.0 1.2 50.1 0.1 57.7 0.4
EP 6 Comp. 14.1 0.4 26.1 1.6 172.0 13.1 77.5 5.8
¹ Values are estimates because ICP-OES raw values were below method reporting limits of 10 ppb for As
SD = standard deviation

Final Report prepared by Karen Bradham for Region 2’s Evelyn Huertas May 12, 2015
Table 3. Plant tissue concentrations, determined by microwave digestion in accordance with EPA Method 3052
with analysis by Inductively Coupled Plasma- Mass Spectrometer (ICP-MS), paired with soil concentrations as
presented in table 1. General plant concentrations within the conterminous USA for lead range from 0.7-7.2 mg/kg
in background soils and 2.5-82 mg/kg in soils containing 200 mg/kg total lead. General plant concentrations within
the conterminous USA for arsenic range from 0.1-1000 mg/kg (high concentrations found in rice and rice roots).
As ± S.D. Pb ± S.D. mg/kg mg/kg
Ein. Lettuce 0.87 0.00 2.85 0.03
Soil Box 3 4.7 0.3 23.5 1.2
Ein. Pumpkin 2.05 0.05 5.24 0.16
Soil 5D 10.3 0.5 32.2 1.8
Ein Basil¹ 0.31 - 0.44 -
Soil box 2 5.25 0.36 16.72 1.61
LM Eggplant 0.48 0.22 0.38 0.12
LM soil 2 8.7 0.4 34.9 1.4
LM Basil 0.66 0.00 2.13 0.05
LM soil 4 10.6 1.1 39.0 2.2
LM Yucca 0.17 0.00 0.2 0.01
LM soil 1 9.02 1.27 33.45 0.07
LM Cilantro¹ 3.2 - 8.6 -
LM soil 3 8.96 0.59 53.41 2.44
EP Avocado 0.51 0.03 0.22 0.02
EP soil 1 55.4 3.4 130.9 29.3
EP Tomatoes 0.03 0.01 0.09 0.00
EP soil 3 avg1 11.3 0.6 56.6 2.2
EP Pepper2 0.11 - 0.28 -
EP soil 2 avg1 14.81 0.11 87.00 5.67
1 Avg values were used because there were duplicate site soil samples
2 These plant samples only had enough mass to perform one extraction.

Final Report prepared by Karen Bradham for Region 2’s Evelyn Huertas May 12, 2015
Table 4. Quality Assurance/Quality Control (QA/QC) summary for 3051 soil digestions for totals
determination
QC Limit* frequency As Pb
blank < 50 µg/L once per batch 0 µg/L 0- 0.95 ug/L
blank spike 85 – 115 % recovery
once per batch 89 – 100 % 91– 103 %
matrix spike 75 – 125 % recovery
once per batch 95 - 101 % 94 - 121 %
Control soil (NIST 2710A)
Relative percent
recoveries ** once per batch 88 – 103 % 87 – 101 %
* EPA method 3051 does not define specific QC limits. Limits defined here have been set by EPA RTP
bioavailability lab.
** Percent recoveries have been normalized to reflect the normal percent recoveries as given in NIST
certification.
µg/L = micrograms/liter

Final Report prepared by Karen Bradham for Region 2’s Evelyn Huertas May 12, 2015
Table 5: QA/QC summary for Method 3052 plant tissue digests
QC Limit* frequency As Pb
bottle blank < 50 µg/L once per batch 0 µg/L 0.03 µg/L
blank spike 85 – 115 % recovery
once per batch 101 – 102 % 102 – 105 %
Control soil (NIST 2710A)
85 – 115 % recovery **
once per batch 100 – 113 % 88 – 99 %
* EPA method 3052 does not define specific QC limits. Limits defined here have been set by EPA RTP
bioavailability lab.
** Percent recoveries have been normalized to reflect the normal percent recoveries as given in NIST
certification.
µg/L = micrograms/liter
Table 6. QA/QC summary table for EPA Method 9200.2-86 IVBA extractions
QC Limit* frequency As Pb Pass (Y/N) ?
unprocessed < 25 µg/L once per
batch 0– 0.1 ppb 0 – 1.2 ppb Yes
bottle blank < 50 µg/L once per
batch 0 – 1.1 ppb 0.3 – 8.3 ppb Yes
blank spike 85 – 125 % recovery
once per batch
98 – 120 % 97 – 115 % Yes
duplicate sample
< 20 % standard deviation
each soil 0 – 1.6 %
S.D. 0.1 – 7.6 %
S.D. Yes
Control soil (NIST 2710A)
85 – 125 % recovery
once per batch
99 – 120 % 95 – 110 % Y
µg/L = micrograms/liter
S.D. = standard deviation

Final Report prepared by Karen Bradham for Region 2’s Evelyn Huertas May 12, 2015
Acknowledgement
We want to thank Katia Aviles of Enlace for her support in this study and for serving as link to the
community. We also want to thank Yolianne Maclay and Alex Rivera from the Caribbean Environmental
Protection Division (CEPD) for their role in collecting samples. We thank Evelyn Huertas for helping to
collect the samples, serving as a wonderful Regional contact to ORD, and disseminating this information
to the community.
References
Adriano, Domy. 2001. Trace elements in terrestrial environments. Biogeochemistry, bioavailability and risks of metals. Springer, NY, USA.
Bechtel, 1998, Empirical Models for the Uptake of Inorganic Chemicals by Plants, BJC/OR-133, Prepared for the U.S. Department of Energy, Office of Environmental Management by Bechtel Jacobs Company LLC, September 1998. http://www.esd.ornl.gov/programs/ecorisk/documents/bjcor-133.pdf
Boon DY, Soltanpour PN (1992) Lead, cadmium, and zinc contamination of Aspen garden soils and vegetation. J. Environ. Qual. 21: 82-86.
Calabrese EJ, Stanek E, Barnes R. 1996. Methodology to estimate the amount and particle size of soil ingested by children: implications for exposure assessment at waste sites. Regul Toxicol Pharmacol 24:264-268.
Davis A, Ruby MV, Bergstrom PD. 1991. Bioavailability of arsenic and lead in soils from the Butte, Montana mining district. Environ Sci Technol 26:461-468.
Corey, J.C., Boni, A.L., Watts, J.R., Adriano, D.C., McLeod, K.W. & Pinder, J.E.d. (1983). The relative importance of uptake and surface adherence in determining the radionuclide contents of subterranean crops. Health Phys, 44: 19-28.
Davies BE (1978) Plant-available lead and other metals in British garden soils. Sci. Total Environ. 9: 243-262
Gzyl, J. (1990). Lead and cadmium contamination of soil and vegetables in the Upper Silesia region of Poland. Sci Total Environ, 96: 199-209.
Hooda, P.S. & Alloway, B.J. (1996). The effect of liming on heavy metal concentrations in wheat, carrots and spinach grown on previously sludge-applied soils. Journal of Agricultural Science, 127: 289-294.
Peryea F. (2001). Gardening on Lead- and Arsenic-Contaminated Soils. EB1884. Washington State University Cooperative Extension http://caheinfo.wsu.edu
Pip E (1991) Cadmium, copper and lead in soils and garden produce near a metal smelter at Flin Flon. Manitoba. Bull. Environ. Contam. Toxicol. 46 : 790-796.
Preer JR, Sekhon HS (1980) Factors affecting heavy metal content of garden vegetables. Environ. Pollut. Ser. B. 1: 95-104.

Final Report prepared by Karen Bradham for Region 2’s Evelyn Huertas May 12, 2015
USEPA. 2007. Guidance for Evaluating the Oral Bioavailability of Metals in Soils for Use in Human Health Risk Assessment, U.S. Environmental Protection Agency, OSWER 9285.7-80.
USEPA. Ecological Soils Screening Levels. http://www.epa.gov/ecotox/ecossl/