publishing details statistics of medical professions 2017
TRANSCRIPT

Statistics of medical professions 2017
Publishing details
© Federal Office of Public Health FOPHPublished by: Federal Office of Public Health FOPHPublication date: June 2018This publication is also available in German and French.
Further Information:Federal Office of Public HealthHealthcare Professions Register3003 BernPhone +41 (0)58 464 02 99E-Mail: [email protected]
FOPH publication number: 2018-GP-39
Layout: Silversign GmbH, BernPictures: Fotolia.de Printed on free from chlorine bleached paper
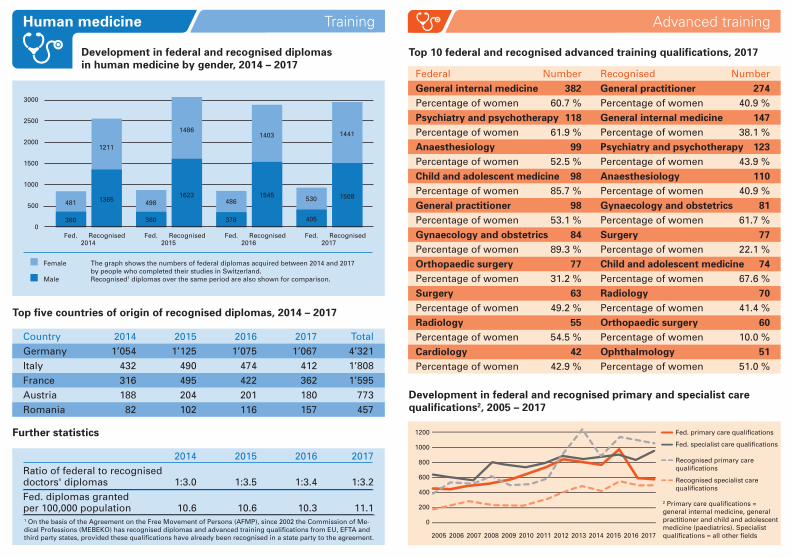
TrainingHuman medicine
Development in federal and recognised diplomas in human medicine by gender, 2014 – 2017
Fed. Recognised
The graph shows the numbers of federal diplomas acquired between 2014 and 2017 by people who completed their studies in Switzerland.Recognised1 diplomas over the same period are also shown for comparison.
Female
Male
Top five countries of origin of recognised diplomas, 2014 – 2017
Country 2014 2015 2016 2017 TotalGermany 1’054 1’125 1’075 1’067 4’321Italy 432 490 474 412 1’808France 316 495 422 362 1’595Austria 188 204 201 180 773Romania 82 102 116 157 457
Further statistics
1 On the basis of the Agreement on the Free Movement of Persons (AFMP), since 2002 the Commission of Me-dical Professions (MEBEKO) has recognised diplomas and advanced training qualifications from EU, EFTA and third party states, provided these qualifications have already been recognised in a state party to the agreement.
Fed. Recognised Fed. Recognised Fed. Recognised
2014 2015 2016 2017Ratio of federal to recogniseddoctors' diplomas 1:3.0 1:3.5 1:3.4 1:3.2Fed. diplomas granted per 100,000 population 10.6 10.6 10.3 11.1
2017201620152014
3000
2000
2500
1500
1000
500530
405
1441
1508
0
481
380
1211
1365 498
380
1486
1623486
378
1403
1545
Top 10 federal and recognised advanced training qualifications, 2017
Development in federal and recognised primary and specialist care qualifications2, 2005 – 2017
Federal Number Recognised NumberGeneral internal medicine 382 General practitioner 274Percentage of women 60.7 % Percentage of women 40.9 %Psychiatry and psychotherapy 118 General internal medicine 147Percentage of women 61.9 % Percentage of women 38.1 %Anaesthesiology 99 Psychiatry and psychotherapy 123Percentage of women 52.5 % Percentage of women 43.9 %Child and adolescent medicine 98 Anaesthesiology 110Percentage of women 85.7 % Percentage of women 40.9 %General practitioner 98 Gynaecology and obstetrics 81Percentage of women 53.1 % Percentage of women 61.7 %Gynaecology and obstetrics 84 Surgery 77Percentage of women 89.3 % Percentage of women 22.1 %Orthopaedic surgery 77 Child and adolescent medicine 74Percentage of women 31.2 % Percentage of women 67.6 %Surgery 63 Radiology 70Percentage of women 49.2 % Percentage of women 41.4 %Radiology 55 Orthopaedic surgery 60Percentage of women 54.5 % Percentage of women 10.0 %Cardiology 42 Ophthalmology 51Percentage of women 42.9 % Percentage of women 51.0 %
2 Primary care qualifications = general internal medicine, general practitioner and child and adolescent medicine (paediatrics). Specialist qualifications = all other fields
Fed. primary care qualifications
Fed. specialist care qualifications
Recognised primary care qualifications
Recognised specialist care qualifications
Advanced training
1200
1000
800
600
400
200
0
2005 2006 2007 2008 2009 2010 2011 2012 2013 2014 2015 2016 2017

Pratique professionnelle
Doctors with professional licence on 31 December 2017
Total: 30,779 doctors
Fed. diploma / advanced fed. training qualification Fed. diploma / advanced foreign training qualification Foreign diploma / advanced fed. training qualification Foreign diploma / advanced foreign training qualification Without advanced training qualification
The graph shows the number of doctors with a professional licence who were registered with MedReg on 31 December 2017. There has been an average annual increase of 6% since 2012.
Licensed practitioners with primary and specialist care qualifications
2013 2014 2015 2016 2017Male 1’978 1’075 1’255 1’348 1’331% 59.9 % 60.0 % 59.0 % 54.5 % 56.1 % Female 1’325 716 873 1’126 1’042% 40.1 % 40.0 % 41.0 % 45.5 % 43.9 % Total 3’303 1’791 2’128 2’474 2’373
Professional practice
Total Primary care qualifications 11’892Specialist care qualifications 14’926Primary and specialist care qualifications 3’961Total 30’779
Newly granted professional licences by gender, 2013 – 2017
20’372(66.2%)
55(0.2%)
931(3.0%)
6’596(21.4%)
2’825(9.2%)
TrainingDentistry
Development in federal and recognised diplomas in dentistry by gender, 2014 – 2017
Fed. Recognised2017
Fed. Recognised2016
The graph shows the numbers of federal diplomas acquired between 2014 and 2017 by people who completed their studies in Switzerland.Recognised diplomas over the same period are also shown for comparison.
Female
Male
Top five countries of origin of recognised diplomas, 2014 – 2017
Country 2014 2015 2016 2017 TotalGermany 95 100 95 88 378Italy 151 109 59 63 382France 74 72 49 62 257Romania 24 27 31 33 115Portugal 32 22 25 26 105
Further statistics
Fed. Recognised2014
2014 2015 2016 2017Ratio of federal /recognised dental diplomas 1:4.7 1:3.6 1:2.9 1:3.5Fed. diplomas granted per 100,000 population 1.1 1.5 1.4 1.4
Fed. Recognised2015
450
400
350
300
250
200
150
100
5064
50
174
22679
41
134
21381
45
186
273
60
30
188
291
0
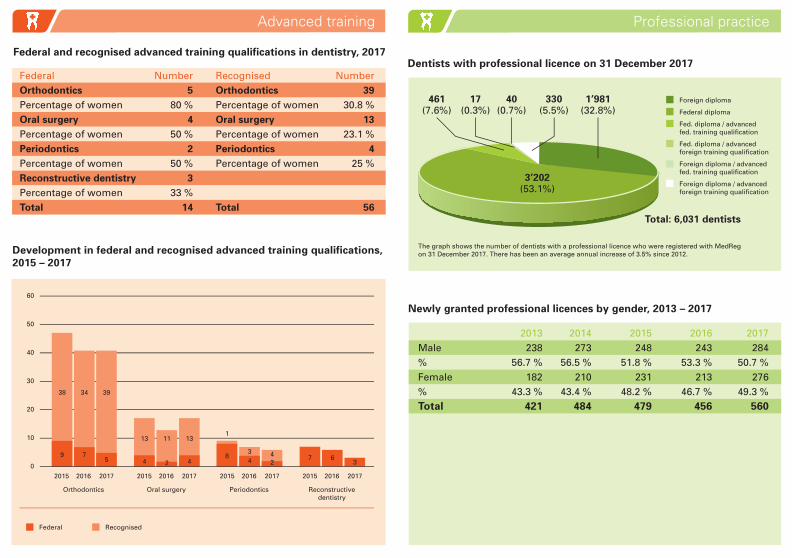
Federal and recognised advanced training qualifications in dentistry, 2017
Federal Number Recognised NumberOrthodontics 5 Orthodontics 39Percentage of women 80 % Percentage of women 30.8 %Oral surgery 4 Oral surgery 13Percentage of women 50 % Percentage of women 23.1 %Periodontics 2 Periodontics 4Percentage of women 50 % Percentage of women 25 %Reconstructive dentistry 3 Percentage of women 33 % Total 14 Total 56
Development in federal and recognised advanced training qualifications, 2015 – 2017
Oral surgery Periodontics Reconstructivedentistry
Federal Recognised
Orthodontics
Advanced training
50
40
30
20
10
60
2015 2016 2017 2015 2016 2017
42
2015 2016 20172015 2016 2017
39
5 30
34
7
38
9
11
2
13
434
1
8 67
13
4
Dentists with professional licence on 31 December 2017
Total: 6,031 dentists
Foreign diploma
Federal diploma
Fed. diploma / advanced fed. training qualification
Fed. diploma / advanced foreign training qualification
Foreign diploma / advanced fed. training qualification Foreign diploma / advanced foreign training qualification
The graph shows the number of dentists with a professional licence who were registered with MedReg on 31 December 2017. There has been an average annual increase of 3.5% since 2012.
Newly granted professional licences by gender, 2013 – 2017
2013 2014 2015 2016 2017 Male 238 273 248 243 284% 56.7 % 56.5 % 51.8 % 53.3 % 50.7 %Female 182 210 231 213 276% 43.3 % 43.4 % 48.2 % 46.7 % 49.3 %Total 421 484 479 456 560
Professional practice
330(5.5%)
1’981(32.8%)
461(7.6%)
17(0.3%)
40(0.7%)
3’202(53.1%)

TrainingChiropractic
Development in federal diplomas in chiropractic by gender, 2014 – 2017
2014 2015 2016 2017Federal examination for holders Male 3 2 3 2of foreign qualifications Female 2 0 4 2 Total 5 2 7 4
Federal examination as Male 2 2 3 0per MedPA Female 2 4 3 8 Total 4 6 6 8
Total Male 5 4 6 2 Female 4 4 7 10 Total 9 8 13 12
Further statistics
The University of Zurich introduced a new degree programme in chiropractic in 2008. The first students graduated with the federal diploma in 2014. Only one foreign qualification has been recognised since 2011, in 2013.
2014 2015 2016 2017Fed. diplomas granted per 100,000 population 0.11 0.10 0.15 0.14
Development in federal advanced training qualifications in chiropractic by type of qualification, 2014 – 2017
2014 2015 2016 2017With federal diploma 0 3 4 10Percentage of women - 66.6 % 25.0 % 40.0 %With MEBEKO recognised qualification 0 1 0 0Percentage of women - - - -Other3 0 1 0 0Percentage of women - - - -Total 0 5 4 10
3 "Other" here refers to intercantonal diplomas conferred before 2007. Only since the implementation of the Medical Professions Act (MedPA) has the profession been regulated at a federal level and have the corresponding diplomas been conferred.
Recognised advanced training qualifications, 2014 – 2017No advanced training qualifications were recognised in the years 2014 to 2017.
Advanced training

Chiropractors with professional licence on 31 December 2017
Total: 304 chiropractors
Fed. diploma / advanced fed. training qualification1 Swiss diploma2 / advancedfed. training qualification
Swiss diploma / advanced Swiss training qualification
Without advanced training qualification
Other combinations
The graph shows the number of chiropractors with a professional licence who were registered with MedReg on 31 December 2017. There has been an average annual increase of 1 % since 2012.
1 Diplomas and advanced training qualifications in accordance with the Medical Professions Act. 2 The designation "Swiss" stands for degrees before the implementation of the Medical Professions Act.
Newly granted professional licences by gender, 2013 – 2017
2013 2014 2015 2016 2017 Male 3 4 5 5 8 % 50.0 % 66.7 % 71.4 % 83.3 % 61.5 % Female 3 2 2 1 5 % 50.0 % 33.3 % 28.6 % 16.7 % 38.5 % Total 6 6 7 6 13
Professional practice
238(78.3%)
22(7.2%)
21(6.9%)
14(4.6%)
9(3.0%)
Development in federal and recognised diplomas in pharmacy by gender, 2014 – 2017
The graph shows the numbers of federal diplomas acquired between 2014 and 2017 by people who completed their studies in Switzerland.Recognised diplomas over the same period are also shown for comparison.
Female
Male
Top five countries of origin of recognised diplomas, 2014 – 2017
Country 2014 2015 2016 2017 TotalItaly 70 70 71 84 295France 55 86 27 89 257Germany 47 44 51 55 197Romania 3 7 3 10 23Austria 9 6 8 7 30
Further statistics
TrainingPharmacy
Fed. Recognised2015
Fed. Recognised2017
Fed. Recognised2016
2014 2015 2016 2017Ratio of federal to recognised diplomas in pharmacy 1:1.4 1:1.5 1:1.1 1:1.3Fed. diplomas grantedper 100,000 population 2.1 2.1 2.7 2.5
Fed. Recognised2014
250
200
150
100
50
166
43
199
93
135
38
152
82
167
57
167
79
142
32
196
68
0

Advanced federal training qualifications conferred, 2016 – 2017
2016 2017 Total � ♀ Total � ♀ Total � ♀ TotalCommunity pharmacyWith MEBEKO 0 0 0 1 0 1 1 0 1recognised qualificationWith federal diploma 1 17 18 1 9 10 2 26 28Total 1 17 18 2 9 11 3 26 29
Hospital pharmacyWith MEBEKO 0 3 3 1 0 1 1 3 4recognised qualification With federal diploma 0 2 2 1 1 2 1 3 4Total 0 5 5 2 1 3 2 6 8
Total With MEBEKO 0 3 3 2 0 2 2 3 5recognised qualification With federal diploma 1 19 20 2 10 12 3 29 32Total 1 22 23 4 10 14 5 32 37
Recognised advanced training qualifications, 2017
No advanced foreign training qualifications in pharmacy were recognised in 2017.
Advanced training
Pharmacists with professional licence on 31 December 2017
Total: 7,260 pharmacists
Fed. diploma, female
Fed. diploma, male
Foreign diploma, female
Foreign diploma, male
The graph shows the number of pharmacists with a professional licence who were registered with MedReg on 31 December 2017. There has been an average annual increase of 10% since 2012.
Newly granted professional licences by gender, 2013 – 2017
2013 2014 2015 2016 2017Male 107 116 111 221 321% 28.2 % 33.1 % 22.9 % 21.0 % 20.2 % Female 272 234 373 832 1’265% 71.8 % 66.9 % 77.1 % 79.0 % 79.8 % Total 379 350 484 1’053 1’586
Professional practice
4’152(57.2%)
1’434(19.8%)
491(6.8%)
1’183(16.3%)
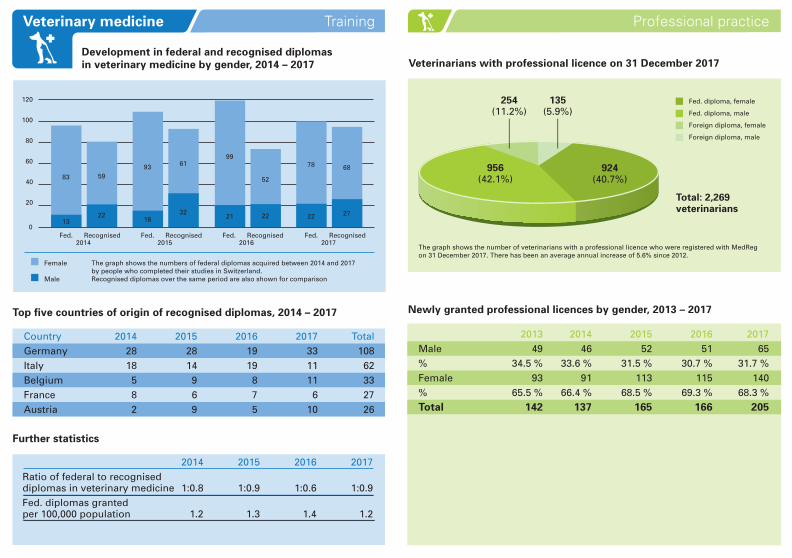
Development in federal and recognised diplomas in veterinary medicine by gender, 2014 – 2017
The graph shows the numbers of federal diplomas acquired between 2014 and 2017 by people who completed their studies in Switzerland.Recognised diplomas over the same period are also shown for comparison
Female
Male
Top five countries of origin of recognised diplomas, 2014 – 2017
Country 2014 2015 2016 2017 TotalGermany 28 28 19 33 108Italy 18 14 19 11 62Belgium 5 9 8 11 33France 8 6 7 6 27Austria 2 9 5 10 26
Further statistics
TrainingVeterinary medicine
2014 2015 2016 2017Ratio of federal to recognised diplomas in veterinary medicine 1:0.8 1:0.9 1:0.6 1:0.9Fed. diplomas granted per 100,000 population 1.2 1.3 1.4 1.2
Fed. Recognised2017
Fed. Recognised2016
Fed. Recognised2015
Fed. Recognised2014
120
100
80
60
20
40
78
22
68
27
0
99
21
52
22
93
16
61
32
83
13
59
22
Veterinarians with professional licence on 31 December 2017
Total: 2,269 veterinarians
Fed. diploma, female
Fed. diploma, male
Foreign diploma, female
Foreign diploma, male
The graph shows the number of veterinarians with a professional licence who were registered with MedReg on 31 December 2017. There has been an average annual increase of 5.6% since 2012.
Newly granted professional licences by gender, 2013 – 2017
2013 2014 2015 2016 2017Male 49 46 52 51 65% 34.5 % 33.6 % 31.5 % 30.7 % 31.7 % Female 93 91 113 115 140% 65.5 % 66.4 % 68.5 % 69.3 % 68.3 % Total 142 137 165 166 205
Professional practice
924(40.7%)
956(42.1%)
254(11.2%)
135(5.9%)