published in 2016-17 · published in 2016-17 ... our teachers are offered four districtwide...
TRANSCRIPT

SARC2015-16
School Accountability Report Card
Published in 2016-17
Albany USDValerie Williams, Superintendent • [email protected] • Phone: (510) 558-3750
Albany Unified School District • 1051 Monroe Street Albany, CA 94706 • www.ausdk12.org
Ocean View Elementary
SchoolTerry Georgeson
Principal [email protected]
1000 Jackson Street Albany, CA 94706
Grades: TK-5 Phone: (510) 558-4800
ov.ausdk12.org
CDS Code: 01-61127-61163222

Ocean View Elementary SchoolSARC 2
Principal’s MessageOcean View Elementary School is a part of the Albany Unified School District. We serve students from tran-sitional kindergarten through fifth grade. The school is located in Albany, California, approximately 15 miles northeast of San Francisco, near the shores of the San Francisco Bay and is a neighbor to the University of California, Berkeley Family Student Housing. Approximately 650 students attended Ocean View in 2015-2016 and over 30 languages were spoken by Ocean View students and their families. This international flavor is evident in each classroom and stated in our motto: Celebrate community, honor diversity.
Our goal for 2016-17 is to continue our development of instructional practices that support the California Common Core State Standards (CCSS). We embrace an Instructional Coaching model designed to support current research-based instructional strategies for student learning in the classroom. Ocean View teachers are committed to helping students achieve at a high level as we strive to provide a safe and welcoming school. All prospective parents are invited to attend a monthly guided tour of the school with the principal. Contact the school to make reservations.
District Mission StatementThe mission of Albany Unified
School District (AUSD) is to provide excellent public education, empowering
all to achieve their fullest potential as productive citizens.
AUSD is committed to creating comprehensive learning opportunities in a safe, supportive and collaborative
environment, addressing the individual needs of each student.
School Accountability Report Card
In accordance with state and federal requirements, the School Accountability
Report Card (SARC) is put forth annually by all public schools as a tool for parents and interested parties to stay informed of
the school’s progress, test scores and achievements.
Parental InvolvementParent support is the hallmark of any successful school. At Ocean View, we take great pride in our parent support and invite every parent to participate at the level they can. Here are a few examples of the many op-portunities: School Site Council (SSC), English Learner Advisory Committee (ELAC), Lunch Supervisor Club and the Parent Teacher Association (PTA). The Ocean View PTA organizes and facilitates parent education nights, community events and fun fundraising events, such as our annual Fall Festival in October. Our PTA is instrumental in building a strong parent-teacher community, and they are committed to supporting the vision of our School Site Plan by supplying materials, resources and supporting teacher professional development.
For more information on how you can become involved, please contact PTA President Ebba Chapman at [email protected].
Board MembersPaul Black, President
Ross Stapleton-Gray, Vice President
Charles Blanchard, Member
Jacob Clark, Member
Kim Trutane, Member
Professional DevelopmentOcean View staff development is aligned to district goals:
1. We will provide comprehensive educational experiences with expanded opportunities for demonstrat-ing and assessing student growth.
2. We will identify individual, social, emotional, and academic needs and apply collaborative appropriate interventions.
3. We will enhance the leadership capacity at the site, district, and community levels for collaborating with all stakeholders in making decisions, communicating and assessing site and district goals.
Our teachers are offered four districtwide professional development days each school year. In addition, meet-ings are held each Wednesday afternoon; these meetings offer teachers the opportunity to collaborate re-garding curriculum, instruction and assessments. In addition, site leadership teachers meet twice monthly as a standing committee and decision-making group that leads in the effort to improve instructional practices and student learning with an explicit focus on narrowing the achievement gap. This Instructional leadership team participates in the planning and execution of each staff meeting. Ocean View teachers also work closely with Cornell and Marin schools to align our instruction throughout the district. We are committed to the ongo-ing collaboration to always improve our instructional practices of California Common Core State Standards and better prepare students for the Smarter Balanced Assessments.
Three-Year DataProfessional Development Days
2014-15 2015-16 2016-17
Ocean View ES 4 days 4 days 4 days
School Mission StatementOcean View Elementary School’s mission is to provide a high-quality
education for all students. We place the highest value on meeting the needs of all our students while honoring the diversity of our community.

Ocean View Elementary SchoolSARC 3
Suspensions and ExpulsionsThis table shows the school, district, and state suspension and expulsion rates for the most recent three-year period. Note: Students are only counted one time, regardless of the number of suspensions.
Suspension and Expulsion Rates
Ocean View ES
13-14 14-15 15-16
Suspension rates 0.0% 0.0% 0.3%
Expulsion rates 0.0% 0.0% 0.0%
Albany USD
13-14 14-15 15-16
Suspension rates 2.5% 1.4% 1.6%
Expulsion rates 0.0% 0.1% 0.0%
California
13-14 14-15 15-16
Suspension rates 4.4% 3.8% 3.7%
Expulsion rates 0.1% 0.1% 0.1%
2013-14 2014-15 2015-16
GradeNumber of Students
1-20 21-32 33+ 1-20 21-32 33+ 1-20 21-32 33+
K 4 4 4
1 4 5 4
2 5 5 2 3
3 4 4 4 1
4 4 4 4
5 3 4 4
Three-Year DataNumber of Classrooms by Size
Enrollment by Student GroupThe total enrollment at the school was 652 students for the 2015-16 school year. The pie chart displays the percentage of students enrolled in each group.
2015-16 School YearDemographics
Socioeconomically disadvantaged
28.70%English
learners27.90%
Students with disabilities
7.10%Foster youth
0.00%
Hispanic or Latino19.8%
Asian33.4%
Native Hawaiian or Pacific Islander
0.2%
Filipino1.5%
Black or African-American
2.8%
White26.2%
Two or More Races16.0%
No Response 0.2%
Enrollment by GradeThe bar graph displays the total number of students enrolled in each grade for the 2015-16 school year.
2015-16 Enrollment by Grade
K
1
2
3
4
5
145
79
118
109
101
100
Class Size DistributionThe bar graph displays the three-year data for average class size, and the table displays the three-year data for the number of classrooms by size. The number of classes indicates how many classrooms fall into each size category (a range of total students per classroom). At the secondary school level, this information is reported by subject area rather than grade level.
14-1513-14 15-16
Three-Year DataAverage Class Size
K 1 2 3 4 5
21 2023
2725 26
22 2225 25 26 27
18 1821
19
25 24

Ocean View Elementary SchoolSARC 4
California Physical Fitness TestEach spring, all students in grades 5, 7 and 9 are required to participate in the California Physical Fitness Test (PFT). The Fitnessgram is the designated PFT for students in California public schools put forth by the State Board of Education. The PFT measures six key fitness areas:
1. Aerobic Capacity
2. Body Composition
3. Flexibility
4. Abdominal Strength and Endurance
5. Upper Body Strength and Endurance
6. Trunk Extensor Strength and Flexibility
Encouraging and assisting students in establishing lifelong habits of regular physical activity is the primary goal of the Fitnessgram. The table shows the percentage of students meeting the fitness standards of being in the “healthy fitness zone” for the most recent testing period. For more detailed information on the California PFT, please visit www.cde.ca.gov/ta/tg/pf.
Percentage of Students Meeting Fitness Standards
2015-16 School Year
Grade 5
Four of six standards 8.30%
Five of six standards 28.10%
Six of six standards 62.50%
Ocean View ES Albany USD
Program Improvement status In PI In PI
First year of Program Improvement 2012-2013 2013-2014
Year in Program Improvement Year 2 Year 1
Number of schools currently in Program Improvement 3
Percentage of schools currently in Program Improvement 100.00%
2016-17 School YearFederal Intervention Program
Federal Intervention ProgramSchools and districts will not be newly identified for Program Improvement (PI) in the 2016-17 school year under the Every Student Succeeds Act (ESSA) that became law in December 2015, which reauthorized the Elementary and Secondary Education Act (ESEA). Schools and districts receiving Title I, Part A funding for the 2015-16 school year and were “In PI” in the 2015-16 will retain their same PI status and placement year for 2016-17. Schools and districts receiving Title I, Part A funding for the 2015-16 school year and either had a status of “Not in PI” for the 2015-16 school year or did not receive Title I, Part A funding in the 2014-15 school year will have a status of “Not in PI” for the 2016-17 school year. The percentage of schools identified for Program Improvement is calculated by taking the number of schools currently in PI within the district and dividing it by the total number of Title I schools within the district.
This table displays the 2016-17 Program Improvement status for the school and district. For detailed information about PI identification, please visit www.cde.ca.gov/ta/ac/ay/tidetermine.asp.
School SafetySafety is a priority at Ocean View Elementary School. Monthly evacuation drills are practiced. Twice a year earthquake and lockdown drills are also practiced. As our Local Control and Accountability Plan (LCAP) states, we believe in educating the whole child. The social-emotional learner in all students is a priority at Ocean View and as part of our district’s K-8 program, where we embrace a schoolwide behavior program called BEST. The BEST team is a team of dedicated teachers who lead our staff with determining what behav-ioral expectations around the school and in classrooms we will target throughout the school year. Our three core ideas are: Be Safe, Be Responsible and Be Respectful. Classroom and schoolwide incentives are tied to each of the “3 B’s.” In addition, Ocean View teachers integrate the antibullying curriculum Second Step and Welcoming Schools. Through this curriculum, our students learn about empathy, speaking up for one’s self and the value of focused attention. Finally, we offer Ocean View students in grades 3-5 leadership opportuni-ties to be a conflict manager for fellow students on the playground. Learning to lead by helping others is what conflict management is all about.
Part I: Emergency Organization and Management
Responsibilities of Albany Unified School District site personnel, instructional staff, site coordinator and Emer-gency Response Team (ERT) committee, Concept of Emergency Functions, including a summary of planned response, Site ERT notification, communications, evacuation, damage survey, student release and site clo-sure, shelter, crisis incident stress debriefing, after-event critique, and after-action report.
Part II: Emergency Procedures
Part III: Emergency Forms/Checklists
For further information regarding the school’s safety plan, feel free to contact the principal.
The school safety plan was last reviewed, updated and discussed with the school faculty in October 2016.
• Medical/first aid
• Terrorist situation
• Building evacuation
• Fire
• Chemical accident
• Earthquake
• Air pollution
• Explosion or aircraft crash
• Bomb threat
• Suspicious individuals
• Sample emergency information sheet
• Sample student district notice of first-aid care
• Sample site status report
• Sample parent letter
• Hazard-identification checklist
• Recommended emergency supplies
• Guidelines for preparing a buddy/teacher list
Ocean View Elementary SchoolSARC 5
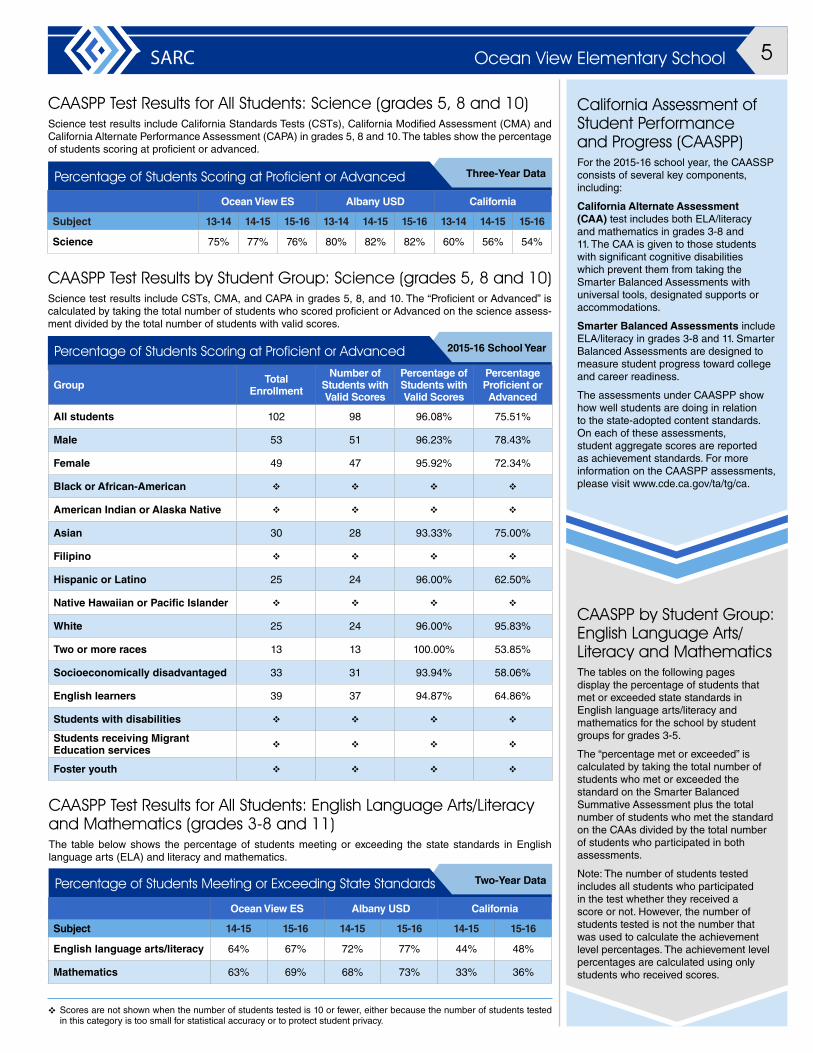
California Assessment of Student Performance and Progress (CAASPP)For the 2015-16 school year, the CAASSP consists of several key components, including:
California Alternate Assessment (CAA) test includes both ELA/literacy and mathematics in grades 3-8 and 11. The CAA is given to those students with significant cognitive disabilities which prevent them from taking the Smarter Balanced Assessments with universal tools, designated supports or accommodations.
Smarter Balanced Assessments include ELA/literacy in grades 3-8 and 11. Smarter Balanced Assessments are designed to measure student progress toward college and career readiness.
The assessments under CAASPP show how well students are doing in relation to the state-adopted content standards. On each of these assessments, student aggregate scores are reported as achievement standards. For more information on the CAASPP assessments, please visit www.cde.ca.gov/ta/tg/ca.
v Scores are not shown when the number of students tested is 10 or fewer, either because the number of students tested in this category is too small for statistical accuracy or to protect student privacy.
CAASPP Test Results for All Students: English Language Arts/Literacy and Mathematics (grades 3-8 and 11)The table below shows the percentage of students meeting or exceeding the state standards in English language arts (ELA) and literacy and mathematics.
Two-Year DataPercentage of Students Meeting or Exceeding State Standards
Ocean View ES Albany USD California
Subject 14-15 15-16 14-15 15-16 14-15 15-16
English language arts/literacy 64% 67% 72% 77% 44% 48%
Mathematics 63% 69% 68% 73% 33% 36%
CAASPP by Student Group: English Language Arts/Literacy and MathematicsThe tables on the following pages display the percentage of students that met or exceeded state standards in English language arts/literacy and mathematics for the school by student groups for grades 3-5.
The “percentage met or exceeded” is calculated by taking the total number of students who met or exceeded the standard on the Smarter Balanced Summative Assessment plus the total number of students who met the standard on the CAAs divided by the total number of students who participated in both assessments.
Note: The number of students tested includes all students who participated in the test whether they received a score or not. However, the number of students tested is not the number that was used to calculate the achievement level percentages. The achievement level percentages are calculated using only students who received scores.
CAASPP Test Results by Student Group: Science (grades 5, 8 and 10)Science test results include CSTs, CMA, and CAPA in grades 5, 8, and 10. The “Proficient or Advanced” is calculated by taking the total number of students who scored proficient or Advanced on the science assess-ment divided by the total number of students with valid scores.
2015-16 School YearPercentage of Students Scoring at Proficient or Advanced
Group Total Enrollment
Number of Students with Valid Scores
Percentage of Students with Valid Scores
Percentage Proficient or Advanced
All students 102 98 96.08% 75.51%
Male 53 51 96.23% 78.43%
Female 49 47 95.92% 72.34%
Black or African-American v v v v
American Indian or Alaska Native v v v v
Asian 30 28 93.33% 75.00%
Filipino v v v v
Hispanic or Latino 25 24 96.00% 62.50%
Native Hawaiian or Pacific Islander v v v v
White 25 24 96.00% 95.83%
Two or more races 13 13 100.00% 53.85%
Socioeconomically disadvantaged 33 31 93.94% 58.06%
English learners 39 37 94.87% 64.86%
Students with disabilities v v v v
Students receiving Migrant Education services v v v v
Foster youth v v v v
CAASPP Test Results for All Students: Science (grades 5, 8 and 10)Science test results include California Standards Tests (CSTs), California Modified Assessment (CMA) and California Alternate Performance Assessment (CAPA) in grades 5, 8 and 10. The tables show the percentage of students scoring at proficient or advanced.
Three-Year DataPercentage of Students Scoring at Proficient or Advanced
Ocean View ES Albany USD California
Subject 13-14 14-15 15-16 13-14 14-15 15-16 13-14 14-15 15-16
Science 75% 77% 76% 80% 82% 82% 60% 56% 54%

Ocean View Elementary SchoolSARC 6
CAASPP Results by Student Group: English Language Arts and Mathematics - Grade 3
Percentage of Students Meeting or Exceeding State Standards 2015-16 School Year
English Language Arts: Grade 3
Group Total Enrollment Number Tested Percentage Tested Percentage Met or Exceeded
All students 116 101 87.10% 75.00%
Male 57 50 87.70% 68.00%
Female 59 51 86.40% 82.00%
Black or African-American v v v v
American Indian or Alaska Native v v v v
Asian 40 29 72.50% 92.90%
Filipino v v v v
Hispanic or Latino 23 21 91.30% 47.60%
Native Hawaiian or Pacific Islander v v v v
White 28 27 96.40% 81.50%
Two or more races 20 19 95.00% 68.40%
Socioeconomically disadvantaged 36 27 75.00% 59.30%
English learners 33 27 81.80% 63.00%
Students with disabilities 11 11 100.00% 18.20%
Students receiving Migrant Education services v v v v
Foster youth v v v v
Mathematics: Grade 3
Group Total Enrollment Number Tested Percentage Tested Percentage Met or Exceeded
All students 116 108 93.10% 74.10%
Male 57 54 94.70% 68.50%
Female 59 54 91.50% 79.60%
Black or African-American v v v v
American Indian or Alaska Native v v v v
Asian 40 36 90.00% 91.70%
Filipino v v v v
Hispanic or Latino 23 21 91.30% 38.10%
Native Hawaiian or Pacific Islander v v v v
White 28 27 96.40% 85.20%
Two or more races 20 19 95.00% 63.20%
Socioeconomically disadvantaged 36 32 88.90% 53.10%
English learners 33 29 87.90% 72.40%
Students with disabilities 11 11 100.00% 27.30%
Students receiving Migrant Education services v v v v
Foster youth v v v v
v Scores are not shown when the number of students tested is 10 or fewer, either because the number of students tested in this category is too small for statistical accuracy or to protect student privacy.

Ocean View Elementary SchoolSARC 7
CAASPP Results by Student Group: English Language Arts and Mathematics - Grade 4
Percentage of Students Meeting or Exceeding State Standards 2015-16 School Year
English Language Arts: Grade 4
Group Total Enrollment Number Tested Percentage Tested Percentage Met or Exceeded
All students 108 98 90.70% 53.10%
Male 61 55 90.20% 41.80%
Female 47 43 91.50% 67.40%
Black or African-American v v v v
American Indian or Alaska Native v v v v
Asian 42 33 78.60% 48.50%
Filipino v v v v
Hispanic or Latino 28 27 96.40% 48.20%
Native Hawaiian or Pacific Islander v v v v
White 21 21 100.00% 66.70%
Two or more races 13 13 100.00% 61.50%
Socioeconomically disadvantaged 41 35 85.40% 45.70%
English learners 41 36 87.80% 41.70%
Students with disabilities v v v v
Students receiving Migrant Education services v v v v
Foster youth v v v v
Mathematics: Grade 4
Group Total Enrollment Number Tested Percentage Tested Percentage Met or Exceeded
All students 109 104 95.40% 65.10%
Male 61 58 95.10% 58.60%
Female 48 46 95.80% 73.30%
Black or African-American v v v v
American Indian or Alaska Native v v v v
Asian 43 39 90.70% 73.70%
Filipino v v v v
Hispanic or Latino 28 27 96.40% 55.60%
Native Hawaiian or Pacific Islander v v v v
White 21 21 100.00% 66.70%
Two or more races 13 13 100.00% 69.20%
Socioeconomically disadvantaged 41 39 95.10% 57.90%
English learners 41 37 90.20% 64.90%
Students with disabilities v v v v
Students receiving Migrant Education services v v v v
Foster youth v v v v
v Scores are not shown when the number of students tested is 10 or fewer, either because the number of students tested in this category is too small for statistical accuracy or to protect student privacy.

Ocean View Elementary SchoolSARC 8
CAASPP Results by Student Group: English Language Arts and Mathematics - Grade 5
Percentage of Students Meeting or Exceeding State Standards 2015-16 School Year
English Language Arts: Grade 5
Group Total Enrollment Number Tested Percentage Tested Percentage Met or Exceeded
All students 103 96 93.20% 74.00%
Male 54 50 92.60% 62.00%
Female 49 46 93.90% 87.00%
Black or African-American v v v v
American Indian or Alaska Native v v v v
Asian 31 27 87.10% 92.60%
Filipino v v v v
Hispanic or Latino 25 24 96.00% 58.30%
Native Hawaiian or Pacific Islander v v v v
White 25 23 92.00% 87.00%
Two or more races 13 13 100.00% 53.90%
Socioeconomically disadvantaged 33 29 87.90% 55.20%
English learners 39 36 92.30% 63.90%
Students with disabilities v v v v
Students receiving Migrant Education services v v v v
Foster youth v v v v
Mathematics: Grade 5
Group Total Enrollment Number Tested Percentage Tested Percentage Met or Exceeded
All students 103 97 94.20% 67.00%
Male 54 50 92.60% 66.00%
Female 49 47 95.90% 68.10%
Black or African-American v v v v
American Indian or Alaska Native v v v v
Asian 31 28 90.30% 82.10%
Filipino v v v v
Hispanic or Latino 25 24 96.00% 54.20%
Native Hawaiian or Pacific Islander v v v v
White 25 23 92.00% 78.30%
Two or more races 13 13 100.00% 46.20%
Socioeconomically disadvantaged 33 30 90.90% 46.70%
English learners 39 36 92.30% 50.00%
Students with disabilities v v v v
Students receiving Migrant Education services v v v v
Foster youth v v v v
v Scores are not shown when the number of students tested is 10 or fewer, either because the number of students tested in this category is too small for statistical accuracy or to protect student privacy.
Ocean View Elementary SchoolSARC 9
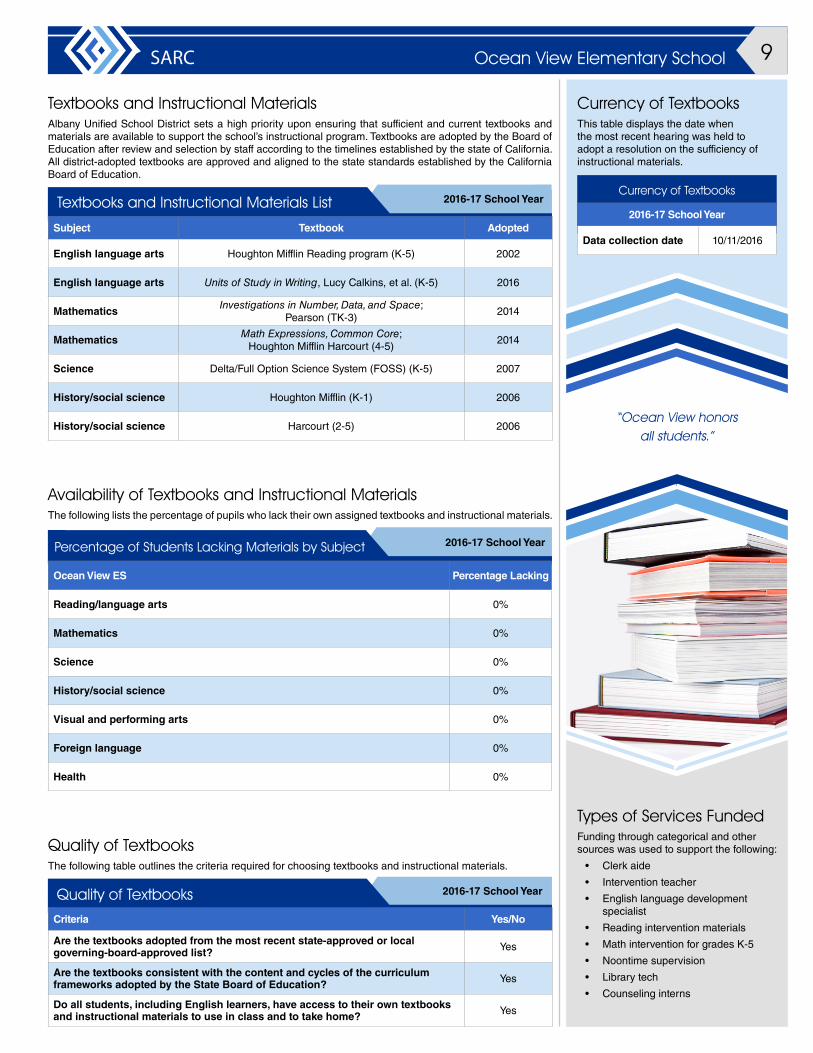
“Ocean View honors all students.”
Textbooks and Instructional MaterialsAlbany Unified School District sets a high priority upon ensuring that sufficient and current textbooks and materials are available to support the school’s instructional program. Textbooks are adopted by the Board of Education after review and selection by staff according to the timelines established by the state of California. All district-adopted textbooks are approved and aligned to the state standards established by the California Board of Education.
2016-17 School YearTextbooks and Instructional Materials List
Subject Textbook Adopted
English language arts Houghton Mifflin Reading program (K-5) 2002
English language arts Units of Study in Writing, Lucy Calkins, et al. (K-5) 2016
Mathematics Investigations in Number, Data, and Space; Pearson (TK-3)
2014
Mathematics Math Expressions, Common Core; Houghton Mifflin Harcourt (4-5)
2014
Science Delta/Full Option Science System (FOSS) (K-5) 2007
History/social science Houghton Mifflin (K-1) 2006
History/social science Harcourt (2-5) 2006
Quality of TextbooksThe following table outlines the criteria required for choosing textbooks and instructional materials.
2016-17 School YearQuality of TextbooksCriteria Yes/No
Are the textbooks adopted from the most recent state-approved or local governing-board-approved list? Yes
Are the textbooks consistent with the content and cycles of the curriculum frameworks adopted by the State Board of Education? Yes
Do all students, including English learners, have access to their own textbooks and instructional materials to use in class and to take home? Yes
Currency of TextbooksThis table displays the date when the most recent hearing was held to adopt a resolution on the sufficiency of instructional materials.
Currency of Textbooks
2016-17 School Year
Data collection date 10/11/2016
Availability of Textbooks and Instructional MaterialsThe following lists the percentage of pupils who lack their own assigned textbooks and instructional materials.
2016-17 School YearPercentage of Students Lacking Materials by Subject
Ocean View ES Percentage Lacking
Reading/language arts 0%
Mathematics 0%
Science 0%
History/social science 0%
Visual and performing arts 0%
Foreign language 0%
Health 0%
Types of Services FundedFunding through categorical and other sources was used to support the following:
• Clerk aide
• Intervention teacher
• English language development specialist
• Reading intervention materials
• Math intervention for grades K-5
• Noontime supervision
• Library tech
• Counseling interns

Ocean View Elementary SchoolSARC 10
• Systems: Gas systems and pipes, sewer, mechanical systems (heating, ventilation and air-conditioning)
• Interior: Interior surfaces (floors, ceilings, walls and window casings)
• Cleanliness: Pest/vermin control, overall cleanliness (school grounds, buildings, rooms and common areas)
• Electrical: Electrical systems (interior and exterior)
• Restrooms/fountains: Restrooms, sinks and drinking fountains (interior and exterior)
• Safety: Fire-safety equipment, emergency systems, hazardous materials (interior and exterior)
• Structural: Structural condition, roofs
• External: Windows/doors/gates/fences, playgrounds/school grounds
School Facility Items Inspected The tables show the results of the school’s most recent inspection using the Facility Inspection Tool (FIT) or equivalent school form. The following is a list of items inspected.
School FacilitiesA Facilities Master Plan was approved in 2014. Plans are in progress to utilize Bond Measures B & E approved by Albany vot-ers in June 2016. In general, our district needs to prepare for continued growth in enrollment and the addition and/or replacement of existing facilities.
The safety of students and staff is a primary concern at Ocean View Elemen-tary School. The school site safety plan is updated annually. The key element of the school site safety plan encompasses student safety and evacuation procedures. Fire, earthquake and lockdown drills are conducted on a regular basis.
To ensure student safety, staff members supervise students at all times during the school day beginning at 8:15 a.m. and during recess and lunch. Any visitors to the campus are required to check in at the school’s office and wear an appropriate identifying badge while visiting the school site.
The school was built in 1975 and modern-ized in 2000. There are 27 classrooms, a multipurpose room/stage, a library multimedia center, special day class and resource specialist program classrooms, two English language development (ELD) classrooms and a counseling office. We are located near Ocean View Park. With the cooperation of the City of Albany, Ocean View Park offers students many opportunities for play and various field games.
District maintenance staff ensures the repairs necessary to keep the school in good repair, and other work orders, are completed in a timely manner. A work-order process is used to ensure efficient service and the highest priority to emer-gency repairs.
We have two custodians: one lead day custodian and one night custodian Mon-day through Friday. The principal works with custodial staff members to ensure the cleaning of the school is maintained to provide a clean and safe school.
School Facility Good Repair Status This inspection determines the school facility’s good repair status using ratings of good condition, fair condition or poor condition. The overall summary of facility conditions uses ratings of exemplary, good, fair or poor.
School Facility Good Repair Status 2016-17 School Year
Items Inspected Repair Status Items Inspected Repair Status
Systems Good Restrooms/fountains Good
Interior Good Safety Good
Cleanliness Good Structural Good
Electrical Good External Good
Overall summary of facility conditions Good
Date of the most recent school site inspection 10/6/2016
Date of the most recent completion of the inspection form 10/6/2016
Deficiencies and RepairsThe table below lists the repairs required for all deficiencies found during the site inspection. Regardless of each item’s repair status, all deficiencies are listed.
2016-17 School YearDeficiencies and Repairs
Items Inspected Deficiencies, Action Taken or Planned, and Date of Action
Restrooms/fountainsExhaust fans in student restrooms are nonfunctional. Not enough water to clear toilet bowl. Exhaust fans repaired 10/21/2016. Flushometer adjusted on toilet fixture 10/27/2016.
Structural Engineering report states that school will be unusable after a major seismic event. Plans are being developed to rebuild the entire school site.
Public Internet AccessInternet access is available at public libraries and other locations that are publicly accessible (e.g., local public libraries). Access to the internet at libraries and public locations is generally provided on first-come, first-served basis. Other use restrictions include the hours of operation, the length of time that a workstation may be used (depending on availability), the types of software programs available at a workstation, and the ability to print documents.

Ocean View Elementary SchoolSARC 11
Teacher Misassignments and Vacant Teacher PositionsThis table displays the number of teacher misassignments (positions filled by teachers who lack legal authorization to teach that grade level, subject area, student group, etc.) and the number of vacant teacher positions (not filled by a single designated teacher assigned to teach the entire course at the beginning of the school year or semester). Please note that total teacher misassignments includes the number of teacher misassignments of English learners.
Three-Year DataTeacher Misassignments and Vacant Teacher Positions
Ocean View ES
Teachers 14-15 15-16 16-17
Teacher misassignments of English learners 0 0 0
Total teacher misassignments 0 0 0
Vacant teacher positions 0 0 0
Core Academic Classes Taught by Highly Qualified TeachersHigh-poverty schools are defined as those schools with student eligibility of approximately 40 percent or more in the free and reduced-priced meals program. Low-poverty schools are those with student eligibility of approximately 39 percent or less in the free and reduced-priced meals program. For more information about ESEA teacher requirements, visit www.cde.ca.gov/nclb/sr/tq.
2015-16 School YearHighly Qualified Teachers
Percentage of Classes in Core Academic Subjects
Taught by Highly Qualified Teachers
Not Taught by Highly Qualified Teachers
Ocean View ES 97.37% 2.63%
All schools in district 92.41% 7.59%
High-poverty schools in district 100.00% 0.00%
Low-poverty schools in district 92.32% 7.68%
Teacher QualificationsThis table shows information about teacher credentials and teacher qualifications. Teachers without a full credential include teachers with district and university internships, pre-internships, emergency or other permits, and waivers. For more information on teacher credentials, visit www.ctc.ca.gov.
Three-Year Data
Albany USD Ocean View ES
Teachers 16-17 14-15 15-16 16-17
With a full credential 216 38 42 39
Without a full credential 4 0 1 0
Teaching outside subject area of competence (with full credential) 3 0 2 0
Teacher Credential Information
Academic Counselors and School Support StaffThis table displays information about aca-demic counselors and support staff at the school and their full-time equivalent (FTE).
Academic Counselors and School Support Staff Data
2015-16 School Year
Academic Counselors
FTE of academic counselors 0.00
Average number of students per academic counselor ²
Support Staff FTE
Social/behavioral counselor «
Career development counselor 0.00
Library media teacher (librarian) 1 .00
Library media services staff (paraprofessional) 0.35
Psychologist 0.50
Social worker 0.30
Nurse 0.20 n
Speech/language/hearing specialist 1.00
Resource specialist (nonteaching) 0.00
Other FTE
Occupational therapist (OT) 0.40
ELD specialists 2.40
Reading specialist 1.60
TSA coach: literacy & writing 1.00
TSA ELD writing, standards & literacy 0.33 æ
n Nurse is full time and shared across the district.
« Interns.
² Not applicable.
æ Shared at elementary level.

2013-14 School Accountability Report Card
Data for this year’s SARC was provided by the California Department of Education and school and district offices. For additional information on California schools and districts and comparisons of the school to the district, the county and the state, please visit DataQuest at http://data1.cde.ca.gov/dataquest. DataQuest is an online resource that provides reports for accountability, test data, enrollment, graduates, dropouts, course enrollments, staffing and data regarding English learners. Per Education Code Section 35256, each school district shall make hard copies of its annually updated report card available, upon request, on or before February 1.
All data accurate as of January 2017.
School Accountability Report Card
PUBLISHED BY:
www.sia-us.com | 800.487.9234
Ocean View Elementary SchoolSARC 12
Financial Data The financial data displayed in this SARC is from the 2014-15 fiscal year. The most current fiscal information available provided by the state is always two years behind the current school year and one year behind most other data included in this report. For detailed information on school expenditures for all districts in California, see the California Department of Education (CDE) Current Expense of Education & Per-pupil Spending web page at www.cde.ca.gov/ds/fd/ec. For information on teacher salaries for all districts in California, see the CDE Certificated Salaries & Benefits web page at www.cde.ca.gov/ds/fd/cs. To look up expenditures and salaries for a specific school district, see the Ed-Data website at www.ed-data.org.
District Financial DataThis table displays district teacher and administrative salary information and compares the figures to the state averages for districts of the same type and size based on the salary schedule. Note: The district salary data does not include benefits.
2014-15 Fiscal YearDistrict Salary Data
Albany USD Similar Sized District
Beginning teacher salary $45,825 $42,063
Midrange teacher salary $66,741 $64,823
Highest teacher salary $89,964 $84,821
Average elementary school principal salary $137,033 $101,849
Average middle school principal salary $142,735 $107,678
Average high school principal salary $152,229 $115,589
Superintendent salary $205,000 $169,152
Teacher salaries: percentage of budget 37% 35%
Administrative salaries: percentage of budget 7% 6%
Financial Data ComparisonThis table displays the school’s per-pupil expenditures from unrestricted sources and the school’s average teacher salary and compares it to the district and state data.
2014-15 Fiscal YearFinancial Data ComparisonExpenditures
Per Pupil From Unrestricted Sources
Annual Average Teacher Salary
Ocean View ES $5,723 $66,308
Albany USD $6,896 $69,492
California $5,677 $67,348
School and district: percentage difference -17.0% -4.6%
School and California: percentage difference +0.8% -1.5%
School Financial DataThe following table displays the school’s average teacher salary and a breakdown of the school’s expenditures per pupil from unrestricted and restricted sources.
School Financial Data
2014-15 Fiscal Year
Total expenditures per pupil $7,263
Expenditures per pupil from restricted sources $1,540
Expenditures per pupil from unrestricted sources $5,723
Annual average teacher salary $66,308
Expenditures Per PupilSupplemental/restricted expenditures come from money whose use is controlled by law or by a donor. Money that is designated for specific purposes by the district or governing board is not considered restricted. Basic/unrestricted expenditures are from money whose use, except for general guidelines, is not controlled by law or by a donor.