published by the world bank’s development prospects...
TRANSCRIPT
Global Economic Prospects
Commodity Market Outlook Published by The World Bank’s Development Prospects Group January 2013
A market in turmoil in 2012. Commodity prices ended 2012 close to where
they began, but major global events created significant upward and downward
price movements through the course of the year. The first half of 2012 brought
declines in most commodity prices especially energy and metals as European
sovereign debt troubles intensified and emerging economies, especially China,
slowed. Price pressures were distinctly upward in the second half of the year,
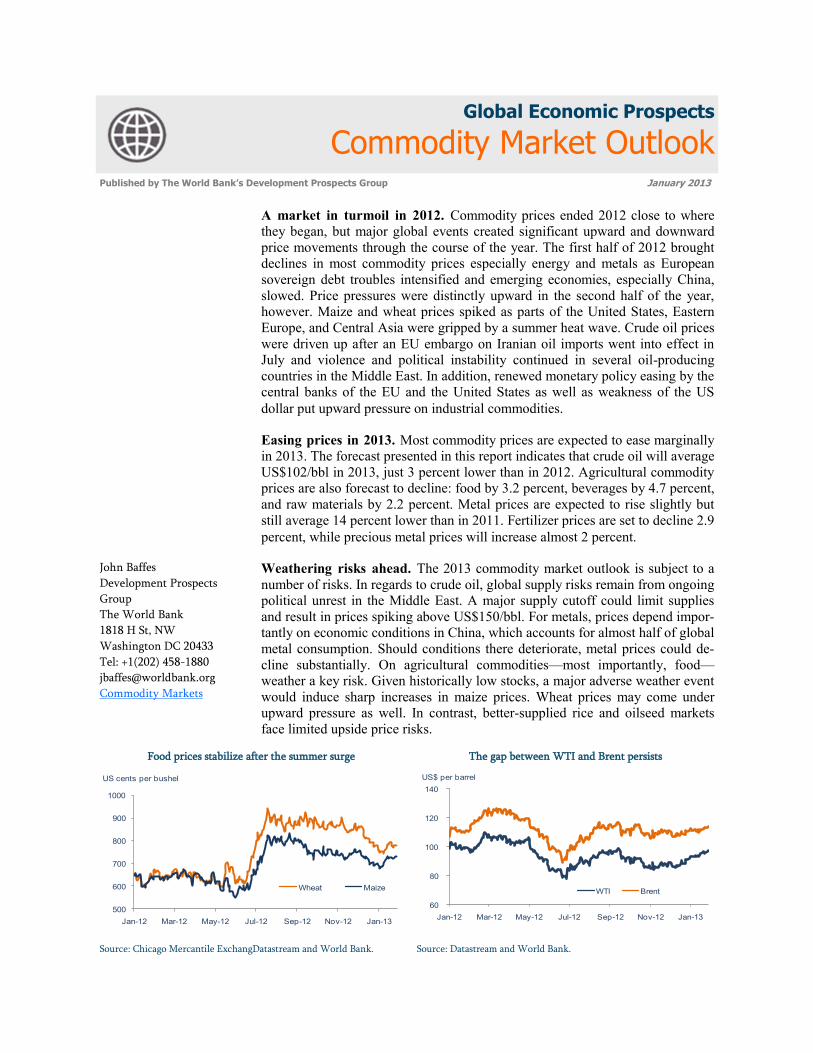
however. Maize and wheat prices spiked as parts of the United States, Eastern
Europe, and Central Asia were gripped by a summer heat wave. Crude oil prices
were driven up after an EU embargo on Iranian oil imports went into effect in
July and violence and political instability continued in several oil-producing
countries in the Middle East. In addition, renewed monetary policy easing by the
central banks of the EU and the United States as well as weakness of the US
dollar put upward pressure on industrial commodities.
Easing prices in 2013. Most commodity prices are expected to ease marginally
in 2013. The forecast presented in this report indicates that crude oil will average
US$102/bbl in 2013, just 3 percent lower than in 2012. Agricultural commodity
prices are also forecast to decline: food by 3.2 percent, beverages by 4.7 percent,
and raw materials by 2.2 percent. Metal prices are expected to rise slightly but
still average 14 percent lower than in 2011. Fertilizer prices are set to decline 2.9
percent, while precious metal prices will increase almost 2 percent.
Weathering risks ahead. The 2013 commodity market outlook is subject to a
number of risks. In regards to crude oil, global supply risks remain from ongoing
political unrest in the Middle East. A major supply cutoff could limit supplies
and result in prices spiking above US$150/bbl. For metals, prices depend impor-
tantly on economic conditions in China, which accounts for almost half of global
metal consumption. Should conditions there deteriorate, metal prices could de-
cline substantially. On agricultural commodities—most importantly, food—
weather a key risk. Given historically low stocks, a major adverse weather event
would induce sharp increases in maize prices. Wheat prices may come under
upward pressure as well. In contrast, better-supplied rice and oilseed markets
face limited upside price risks.
John Baffes
Development Prospects
Group
The World Bank
1818 H St, NW
Washington DC 20433
Tel: +1(202) 458-1880
Commodity Markets
The gap between WTI and Brent persists
Source: Datastream and World Bank.
60
80
100
120
140
Jan-12 Mar-12 May-12 Jul-12 Sep-12 Nov-12 Jan-13
WTI Brent
US$ per barrel
Food prices stabilize after the summer surge
Source: Chicago Mercantile ExchangDatastream and World Bank.
500
600
700
800
900
1000
Jan-12 Mar-12 May-12 Jul-12 Sep-12 Nov-12 Jan-13
Wheat Maize
US cents per bushel
Commodity Market Outlook January 2013
Overview
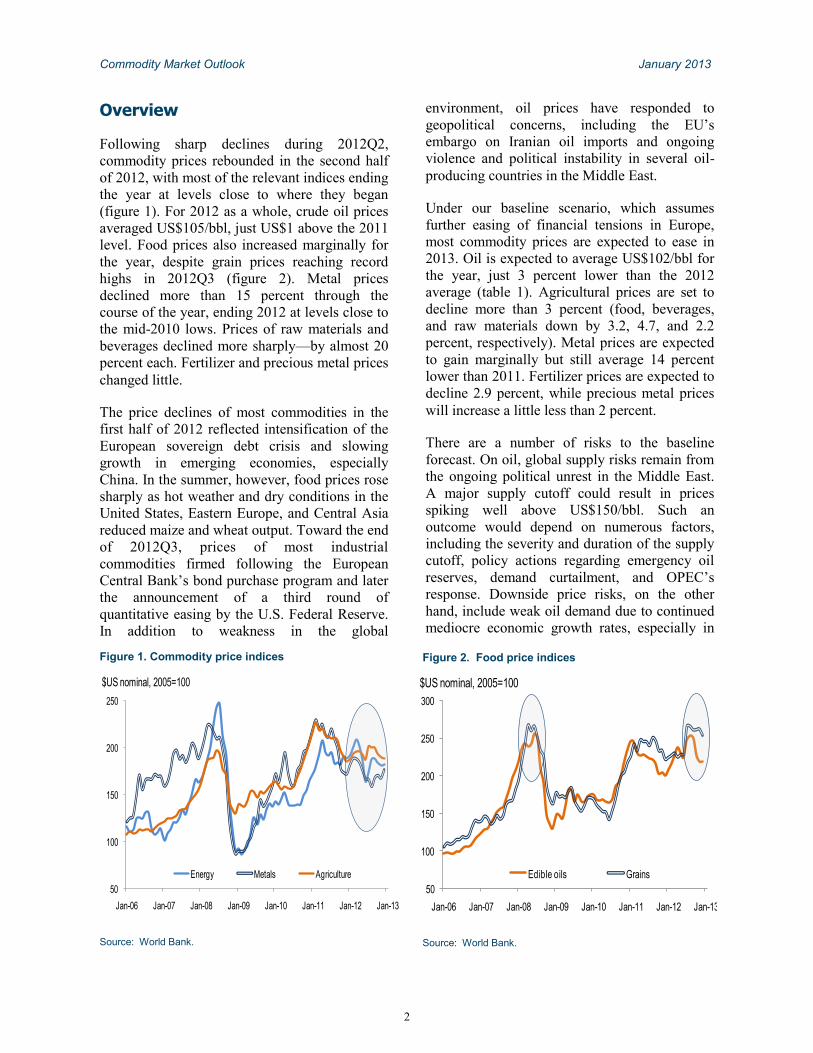
Following sharp declines during 2012Q2,
commodity prices rebounded in the second half
of 2012, with most of the relevant indices ending
the year at levels close to where they began
(figure 1). For 2012 as a whole, crude oil prices
averaged US$105/bbl, just US$1 above the 2011
level. Food prices also increased marginally for
the year, despite grain prices reaching record
highs in 2012Q3 (figure 2). Metal prices
declined more than 15 percent through the
course of the year, ending 2012 at levels close to
the mid-2010 lows. Prices of raw materials and
beverages declined more sharply—by almost 20
percent each. Fertilizer and precious metal prices
changed little.
The price declines of most commodities in the
first half of 2012 reflected intensification of the
European sovereign debt crisis and slowing
growth in emerging economies, especially
China. In the summer, however, food prices rose
sharply as hot weather and dry conditions in the
United States, Eastern Europe, and Central Asia
reduced maize and wheat output. Toward the end
of 2012Q3, prices of most industrial
commodities firmed following the European
Central Bank‘s bond purchase program and later
the announcement of a third round of
quantitative easing by the U.S. Federal Reserve.
In addition to weakness in the global
environment, oil prices have responded to
geopolitical concerns, including the EU‘s
embargo on Iranian oil imports and ongoing
violence and political instability in several oil-
producing countries in the Middle East.
Under our baseline scenario, which assumes
further easing of financial tensions in Europe,
most commodity prices are expected to ease in
2013. Oil is expected to average US$102/bbl for
the year, just 3 percent lower than the 2012
average (table 1). Agricultural prices are set to
decline more than 3 percent (food, beverages,
and raw materials down by 3.2, 4.7, and 2.2
percent, respectively). Metal prices are expected
to gain marginally but still average 14 percent
lower than 2011. Fertilizer prices are expected to
decline 2.9 percent, while precious metal prices
will increase a little less than 2 percent.
There are a number of risks to the baseline
forecast. On oil, global supply risks remain from
the ongoing political unrest in the Middle East.
A major supply cutoff could result in prices
spiking well above US$150/bbl. Such an
outcome would depend on numerous factors,
including the severity and duration of the supply
cutoff, policy actions regarding emergency oil
reserves, demand curtailment, and OPEC‘s
response. Downside price risks, on the other
hand, include weak oil demand due to continued
mediocre economic growth rates, especially in
Figure 1. Commodity price indices
Source: World Bank.
50
100
150
200
250
Jan-06 Jan-07 Jan-08 Jan-09 Jan-10 Jan-11 Jan-12 Jan-13
Energy Metals Agriculture
$US nominal, 2005=100
Figure 2. Food price indices
Source: World Bank.
50
100
150
200
250
300
Jan-06 Jan-07 Jan-08 Jan-09 Jan-10 Jan-11 Jan-12 Jan-13
Edible oils Grains
$US nominal, 2005=100
2

Commodity Market Outlook January 2013
emerging economies. The key element for price
stability will be how well OPEC (and,
importantly, Saudi Arabia) address changing
demand conditions. Historically, OPEC has been
able to respond quickly to defend a price floor
by cutting production sharply, but it has been
unwilling to set a price ceiling so rapidly. On the
other hand, there is some room on spare capacity
and stocks. OPEC‘s spare capacity averaged 3.9
mb/d during 2012Q3, 14 percent higher than
2012Q2 but remarkably similar to the past
decade‘s historical average (it had reached a low
of 2.3 mb/d during the first half of 2008, when
oil prices exceeded US$140/bbl. Moreover,
OECD oil inventories recovered remarkably,
rising 17 percent from 2012Q2 to 2012Q3. On
the demand side, while the oil intensity of GDP
in middle- income countries has been rising, it
has not reached levels that could derail economic
growth.
Price risks on metals depend importantly on
China; metal prices could decline significantly if
China‘s economic conditions deteriorate
substantially, as the country accounts for almost
half of global metal consumption.
In terms of agricultural commodities (most
importantly, food), a key upside risk is weather.
Any adverse weather event is likely to induce
sharp increases in maize prices, in view of
historically low stocks. The wheat market, which
currently is better supplied than maize, may
come under pressure as well. In contrast, there
are limited upside price risks for rice and
oilseeds given that those markets are well
supplied. Trade policy risks appear to be low as
well. Despite the sharp increases in grain prices
during the summer of 2012, countries did not
engage in export restrictions—indeed, several
press reports to the contrary turned out to be
unsubstantiated. Finally, growth in the
production of biofuels has slowed as policy
makers increasingly realize that the
environmental and energy security benefits from
biofuels are not as large as initially believed.
Crude Oil
Despite large fluctuations, oil prices (World
Bank average) ended the year at US$101/bbl,
close to where they began (figure 3). The decline
in the first half of 2012 (23 percent between
March and June 2012) reflected weak demand
due to slowing growth in developing countries
and heightened concerns about the European
sovereign debt crisis. Supply concerns, mostly of
a geopolitical nature, came to bear in the second
half of the year, prompting a firming of prices.
Although the price of Brent crude (the
international marker) topped US$113/bbl in
Table 1. Nominal price indices—actual and forecasts (2005 = 100)
Source: World Bank.
2008 2009 2010 2011 2012 2013 2014 2011/12 2012/13 2013/14
Energy 183 115 145 188 187 183 183 -0.4 -2.6 0.1
Non-Energy 182 142 174 210 190 186 180 -9.5 -2.0 -3.2
Metals 180 120 180 205 174 176 176 -15.3 1.3 -0.1
Agriculture 171 149 170 209 194 188 180 -7.2 -3.2 -4.4
Food 186 156 170 210 212 205 192 0.7 -3.2 -6.4
Grains 223 169 172 239 244 239 225 2.4 -2.1 -6.0
Fats and oils 209 165 184 223 230 220 206 3.3 -4.2 -6.5
Other food 124 131 148 168 158 153 143 -5.9 -3.1 -6.6
Beverages 152 157 182 208 166 158 155 -20.2 -4.7 -2.0
Raw Materials 143 129 166 207 165 162 162 -20.0 -2.2 0.4
Fertilizers 399 204 187 267 259 245 232 -2.9 -5.6 -5.3
Precious metals 158 175 272 372 378 378 353 1.7 0.0 -6.7
Memorandum items
Crude oil ($/bbl) 97 62 79 104 105 102 102 1.0 -2.9 0.2
Gold ($/toz) 872 973 1,225 1,569 1,670 1,600 1,550 6.4 -4.2 -3.1
ACTUAL FORECAST CHANGE (%)
3
Commodity Market Outlook January 2013
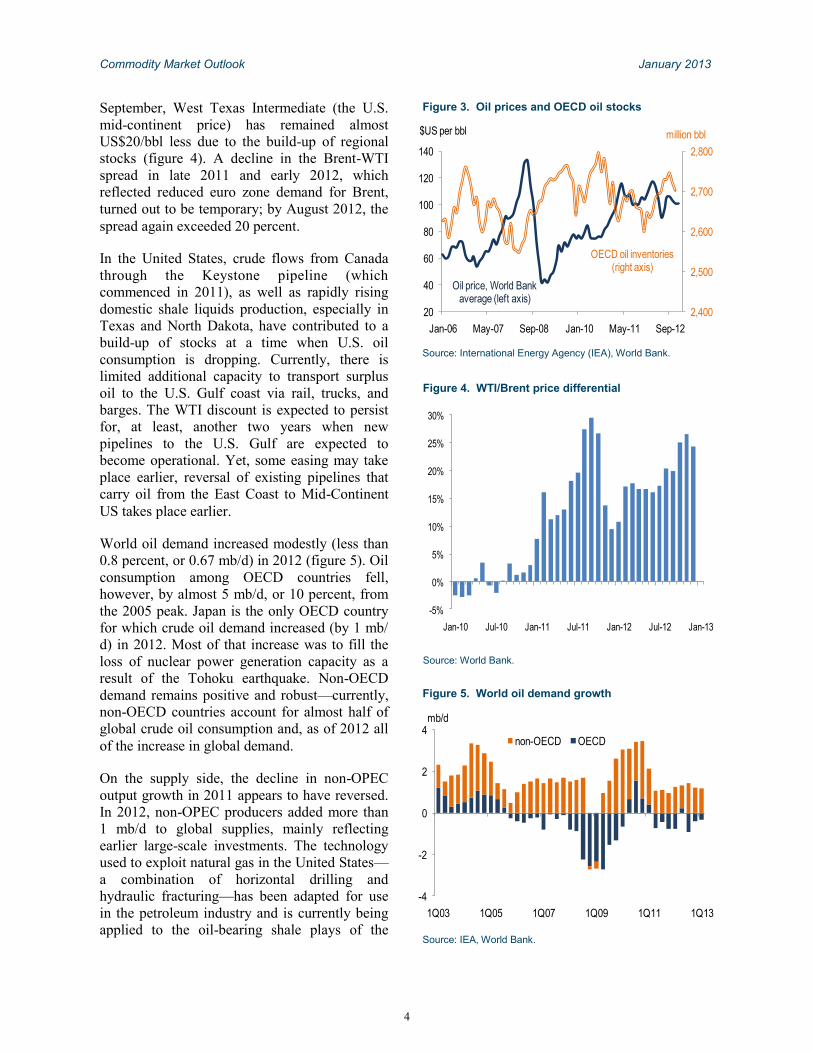
September, West Texas Intermediate (the U.S.
mid-continent price) has remained almost
US$20/bbl less due to the build-up of regional
stocks (figure 4). A decline in the Brent-WTI
spread in late 2011 and early 2012, which
reflected reduced euro zone demand for Brent,
turned out to be temporary; by August 2012, the
spread again exceeded 20 percent.
In the United States, crude flows from Canada
through the Keystone pipeline (which
commenced in 2011), as well as rapidly rising
domestic shale liquids production, especially in
Texas and North Dakota, have contributed to a
build-up of stocks at a time when U.S. oil
consumption is dropping. Currently, there is
limited additional capacity to transport surplus
oil to the U.S. Gulf coast via rail, trucks, and
barges. The WTI discount is expected to persist
for, at least, another two years when new
pipelines to the U.S. Gulf are expected to
become operational. Yet, some easing may take
place earlier, reversal of existing pipelines that
carry oil from the East Coast to Mid-Continent
US takes place earlier.
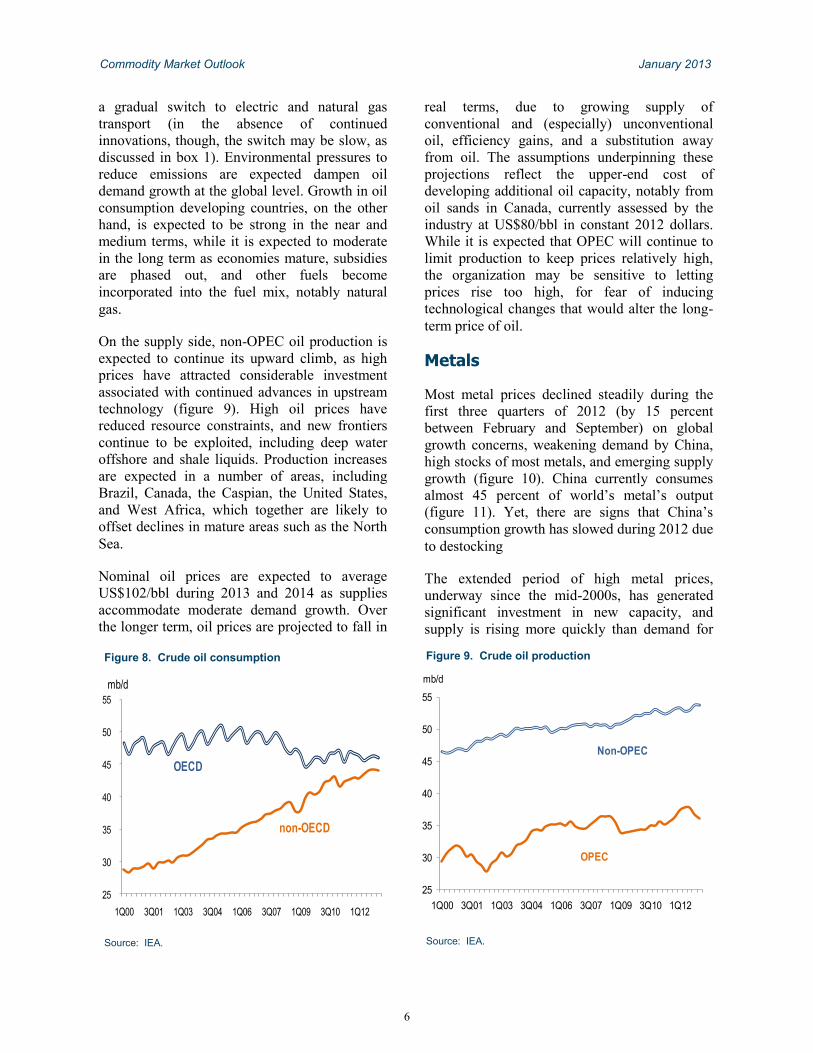
World oil demand increased modestly (less than
0.8 percent, or 0.67 mb/d) in 2012 (figure 5). Oil
consumption among OECD countries fell,
however, by almost 5 mb/d, or 10 percent, from
the 2005 peak. Japan is the only OECD country
for which crude oil demand increased (by 1 mb/
d) in 2012. Most of that increase was to fill the
loss of nuclear power generation capacity as a
result of the Tohoku earthquake. Non-OECD
demand remains positive and robust—currently,
non-OECD countries account for almost half of
global crude oil consumption and, as of 2012 all
of the increase in global demand.
On the supply side, the decline in non-OPEC
output growth in 2011 appears to have reversed.
In 2012, non-OPEC producers added more than
1 mb/d to global supplies, mainly reflecting
earlier large-scale investments. The technology
used to exploit natural gas in the United States—
a combination of horizontal drilling and
hydraulic fracturing—has been adapted for use
in the petroleum industry and is currently being
applied to the oil-bearing shale plays of the
Figure 4. WTI/Brent price differential
Source: World Bank.
-5%
0%
5%
10%
15%
20%
25%
30%
Jan-10 Jul-10 Jan-11 Jul-11 Jan-12 Jul-12 Jan-13
Figure 5. World oil demand growth
Source: IEA, World Bank.
-4
-2
0
2
4
1Q03 1Q05 1Q07 1Q09 1Q11 1Q13
non-OECD OECD
mb/d
Figure 3. Oil prices and OECD oil stocks
Source: International Energy Agency (IEA), World Bank.
2,400
2,500
2,600
2,700
2,800
20
40
60
80
100
120
140
Jan-06 May-07 Sep-08 Jan-10 May-11 Sep-12
$US per bbl million bbl
OECD oil inventories (right axis)
Oil price, World Bank average (left axis)
4
Commodity Market Outlook January 2013
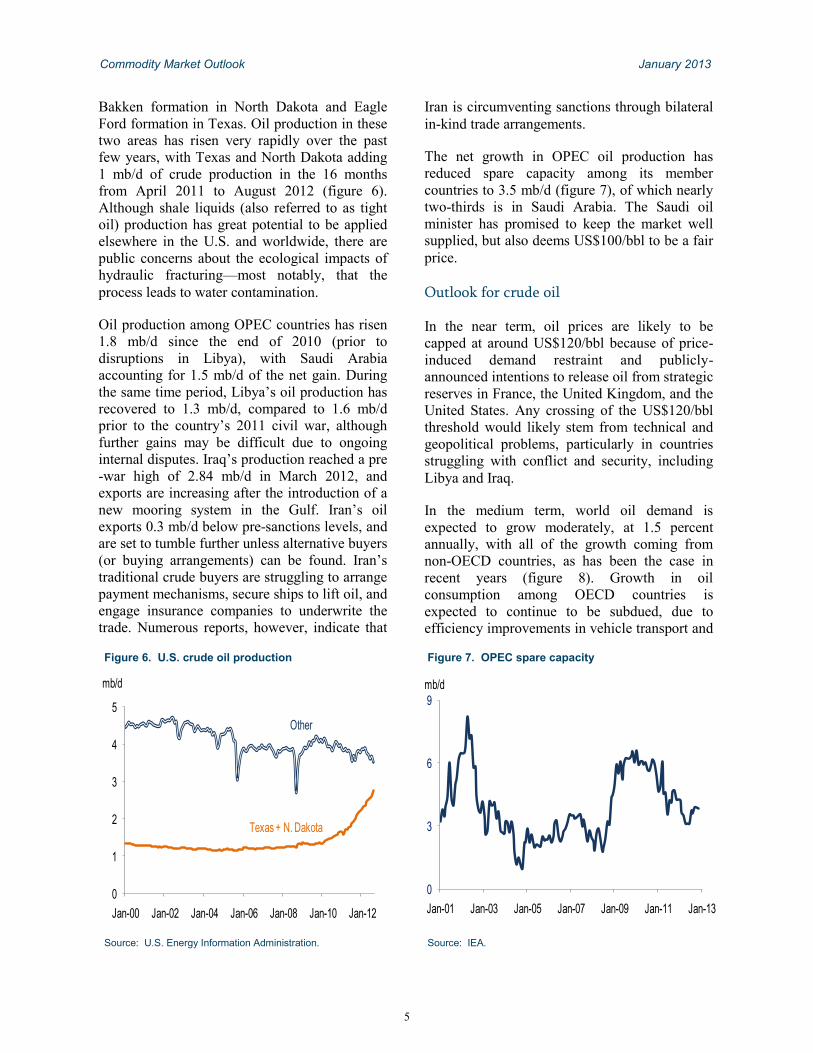
Bakken formation in North Dakota and Eagle
Ford formation in Texas. Oil production in these
two areas has risen very rapidly over the past
few years, with Texas and North Dakota adding
1 mb/d of crude production in the 16 months
from April 2011 to August 2012 (figure 6).
Although shale liquids (also referred to as tight
oil) production has great potential to be applied
elsewhere in the U.S. and worldwide, there are
public concerns about the ecological impacts of
hydraulic fracturing—most notably, that the
process leads to water contamination.
Oil production among OPEC countries has risen
1.8 mb/d since the end of 2010 (prior to
disruptions in Libya), with Saudi Arabia
accounting for 1.5 mb/d of the net gain. During
the same time period, Libya‘s oil production has
recovered to 1.3 mb/d, compared to 1.6 mb/d
prior to the country‘s 2011 civil war, although
further gains may be difficult due to ongoing
internal disputes. Iraq‘s production reached a pre
-war high of 2.84 mb/d in March 2012, and
exports are increasing after the introduction of a
new mooring system in the Gulf. Iran‘s oil
exports 0.3 mb/d below pre-sanctions levels, and
are set to tumble further unless alternative buyers
(or buying arrangements) can be found. Iran‘s
traditional crude buyers are struggling to arrange
payment mechanisms, secure ships to lift oil, and
engage insurance companies to underwrite the
trade. Numerous reports, however, indicate that
Iran is circumventing sanctions through bilateral
in-kind trade arrangements.
The net growth in OPEC oil production has
reduced spare capacity among its member
countries to 3.5 mb/d (figure 7), of which nearly
two-thirds is in Saudi Arabia. The Saudi oil
minister has promised to keep the market well
supplied, but also deems US$100/bbl to be a fair
price.
Outlook for crude oil
In the near term, oil prices are likely to be
capped at around US$120/bbl because of price-
induced demand restraint and publicly-
announced intentions to release oil from strategic
reserves in France, the United Kingdom, and the
United States. Any crossing of the US$120/bbl
threshold would likely stem from technical and
geopolitical problems, particularly in countries
struggling with conflict and security, including
Libya and Iraq.
In the medium term, world oil demand is
expected to grow moderately, at 1.5 percent
annually, with all of the growth coming from
non-OECD countries, as has been the case in
recent years (figure 8). Growth in oil
consumption among OECD countries is
expected to continue to be subdued, due to
efficiency improvements in vehicle transport and
Figure 6. U.S. crude oil production
Source: U.S. Energy Information Administration.
0
1
2
3
4
5
Jan-00 Jan-02 Jan-04 Jan-06 Jan-08 Jan-10 Jan-12
mb/d
Texas + N. Dakota
Other
Figure 7. OPEC spare capacity
Source: IEA.
0
3
6
9
Jan-01 Jan-03 Jan-05 Jan-07 Jan-09 Jan-11 Jan-13
mb/d
5
Commodity Market Outlook January 2013
a gradual switch to electric and natural gas
transport (in the absence of continued
innovations, though, the switch may be slow, as
discussed in box 1). Environmental pressures to
reduce emissions are expected dampen oil
demand growth at the global level. Growth in oil
consumption developing countries, on the other
hand, is expected to be strong in the near and
medium terms, while it is expected to moderate
in the long term as economies mature, subsidies
are phased out, and other fuels become
incorporated into the fuel mix, notably natural
gas.
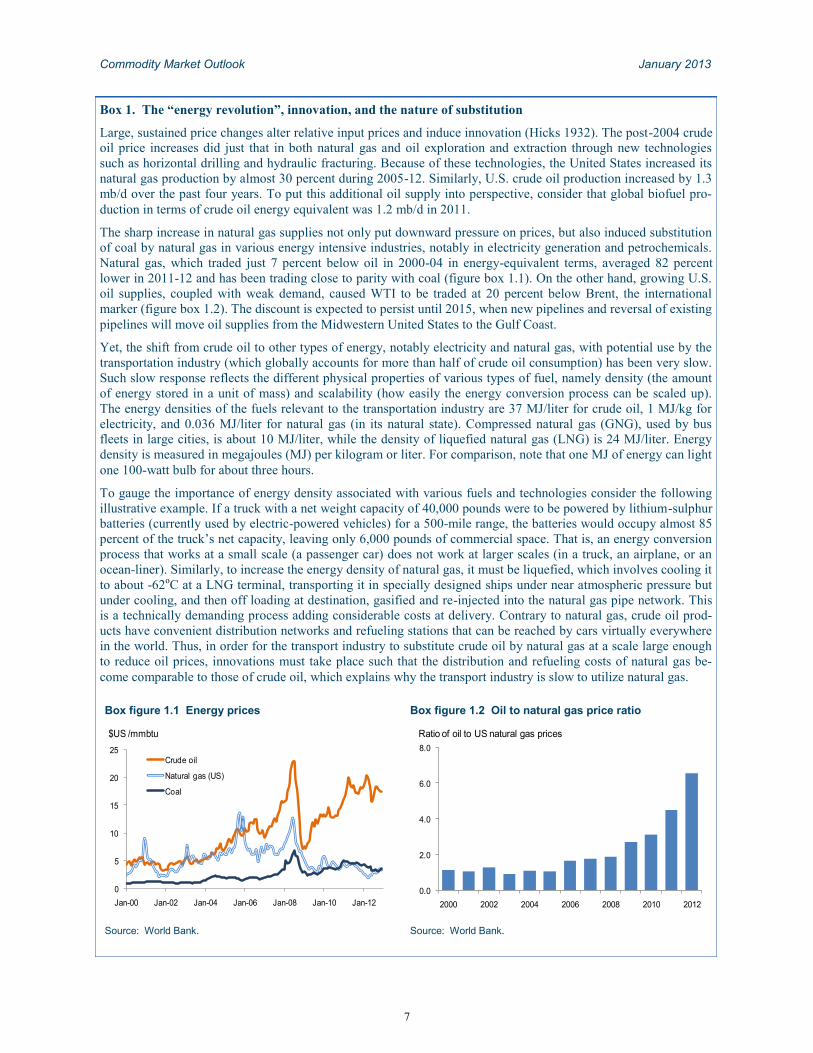
On the supply side, non-OPEC oil production is
expected to continue its upward climb, as high
prices have attracted considerable investment
associated with continued advances in upstream
technology (figure 9). High oil prices have
reduced resource constraints, and new frontiers
continue to be exploited, including deep water
offshore and shale liquids. Production increases
are expected in a number of areas, including
Brazil, Canada, the Caspian, the United States,
and West Africa, which together are likely to
offset declines in mature areas such as the North
Sea.
Nominal oil prices are expected to average
US$102/bbl during 2013 and 2014 as supplies
accommodate moderate demand growth. Over
the longer term, oil prices are projected to fall in
real terms, due to growing supply of
conventional and (especially) unconventional
oil, efficiency gains, and a substitution away
from oil. The assumptions underpinning these
projections reflect the upper-end cost of
developing additional oil capacity, notably from
oil sands in Canada, currently assessed by the
industry at US$80/bbl in constant 2012 dollars.
While it is expected that OPEC will continue to
limit production to keep prices relatively high,
the organization may be sensitive to letting
prices rise too high, for fear of inducing
technological changes that would alter the long-
term price of oil.
Metals
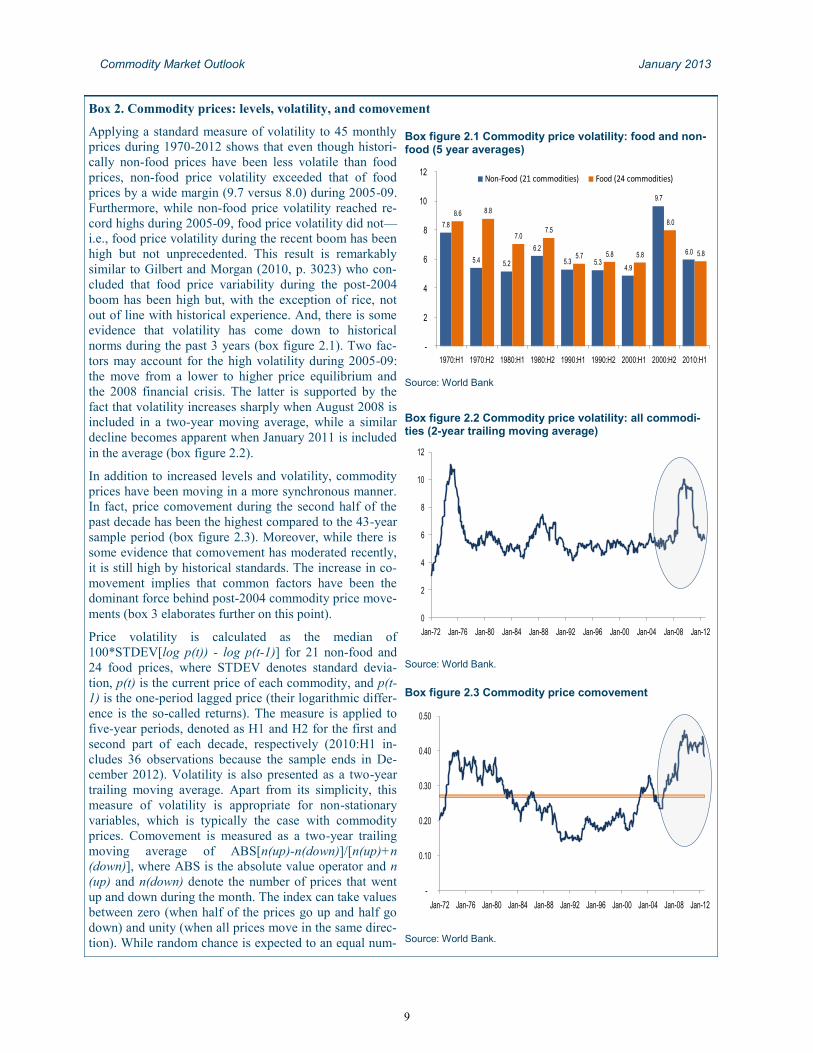
Most metal prices declined steadily during the
first three quarters of 2012 (by 15 percent
between February and September) on global
growth concerns, weakening demand by China,
high stocks of most metals, and emerging supply
growth (figure 10). China currently consumes
almost 45 percent of world‘s metal‘s output
(figure 11). Yet, there are signs that China‘s
consumption growth has slowed during 2012 due
to destocking
The extended period of high metal prices,
underway since the mid-2000s, has generated
significant investment in new capacity, and
supply is rising more quickly than demand for
Figure 9. Crude oil production
Source: IEA.
25
30
35
40
45
50
55
1Q00 3Q01 1Q03 3Q04 1Q06 3Q07 1Q09 3Q10 1Q12
mb/d
Non-OPEC
OPEC
Figure 8. Crude oil consumption
Source: IEA.
25
30
35
40
45
50
55
1Q00 3Q01 1Q03 3Q04 1Q06 3Q07 1Q09 3Q10 1Q12
mb/d
OECD
non-OECD
6
Commodity Market Outlook January 2013
Box 1. The “energy revolution”, innovation, and the nature of substitution
Large, sustained price changes alter relative input prices and induce innovation (Hicks 1932). The post-2004 crude
oil price increases did just that in both natural gas and oil exploration and extraction through new technologies
such as horizontal drilling and hydraulic fracturing. Because of these technologies, the United States increased its
natural gas production by almost 30 percent during 2005-12. Similarly, U.S. crude oil production increased by 1.3
mb/d over the past four years. To put this additional oil supply into perspective, consider that global biofuel pro-
duction in terms of crude oil energy equivalent was 1.2 mb/d in 2011.
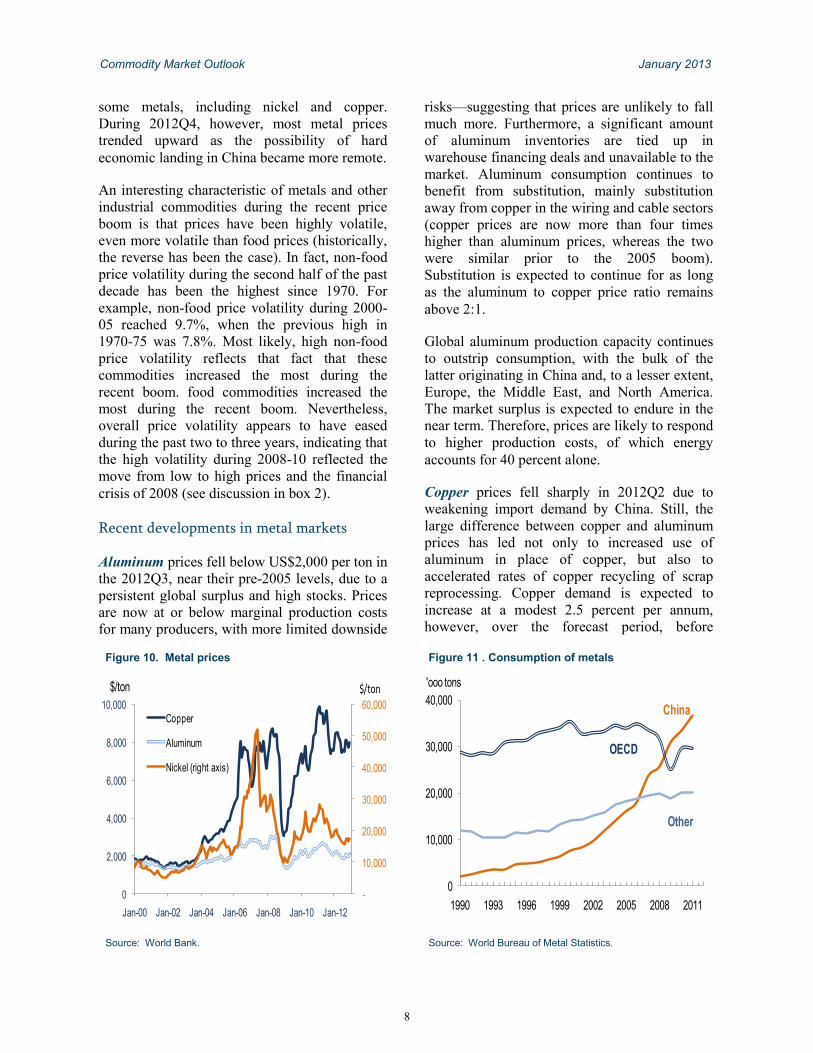
The sharp increase in natural gas supplies not only put downward pressure on prices, but also induced substitution
of coal by natural gas in various energy intensive industries, notably in electricity generation and petrochemicals.
Natural gas, which traded just 7 percent below oil in 2000-04 in energy-equivalent terms, averaged 82 percent
lower in 2011-12 and has been trading close to parity with coal (figure box 1.1). On the other hand, growing U.S.
oil supplies, coupled with weak demand, caused WTI to be traded at 20 percent below Brent, the international
marker (figure box 1.2). The discount is expected to persist until 2015, when new pipelines and reversal of existing
pipelines will move oil supplies from the Midwestern United States to the Gulf Coast.
Yet, the shift from crude oil to other types of energy, notably electricity and natural gas, with potential use by the
transportation industry (which globally accounts for more than half of crude oil consumption) has been very slow.
Such slow response reflects the different physical properties of various types of fuel, namely density (the amount
of energy stored in a unit of mass) and scalability (how easily the energy conversion process can be scaled up).
The energy densities of the fuels relevant to the transportation industry are 37 MJ/liter for crude oil, 1 MJ/kg for
electricity, and 0.036 MJ/liter for natural gas (in its natural state). Compressed natural gas (GNG), used by bus
fleets in large cities, is about 10 MJ/liter, while the density of liquefied natural gas (LNG) is 24 MJ/liter. Energy
density is measured in megajoules (MJ) per kilogram or liter. For comparison, note that one MJ of energy can light
one 100-watt bulb for about three hours.
To gauge the importance of energy density associated with various fuels and technologies consider the following
illustrative example. If a truck with a net weight capacity of 40,000 pounds were to be powered by lithium-sulphur
batteries (currently used by electric-powered vehicles) for a 500-mile range, the batteries would occupy almost 85
percent of the truck‘s net capacity, leaving only 6,000 pounds of commercial space. That is, an energy conversion
process that works at a small scale (a passenger car) does not work at larger scales (in a truck, an airplane, or an
ocean-liner). Similarly, to increase the energy density of natural gas, it must be liquefied, which involves cooling it
to about -62oC at a LNG terminal, transporting it in specially designed ships under near atmospheric pressure but
under cooling, and then off loading at destination, gasified and re-injected into the natural gas pipe network. This
is a technically demanding process adding considerable costs at delivery. Contrary to natural gas, crude oil prod-
ucts have convenient distribution networks and refueling stations that can be reached by cars virtually everywhere
in the world. Thus, in order for the transport industry to substitute crude oil by natural gas at a scale large enough
to reduce oil prices, innovations must take place such that the distribution and refueling costs of natural gas be-
come comparable to those of crude oil, which explains why the transport industry is slow to utilize natural gas.
Box figure 1.1 Energy prices
Source: World Bank.
0
5
10
15
20
25
Jan-00 Jan-02 Jan-04 Jan-06 Jan-08 Jan-10 Jan-12
Crude oil
Natural gas (US)
Coal
$US /mmbtu
Box figure 1.2 Oil to natural gas price ratio
Source: World Bank.
0.0
2.0
4.0
6.0
8.0
2000 2002 2004 2006 2008 2010 2012
Ratio of oil to US natural gas prices
7
Commodity Market Outlook January 2013
some metals, including nickel and copper.
During 2012Q4, however, most metal prices
trended upward as the possibility of hard
economic landing in China became more remote.
An interesting characteristic of metals and other
industrial commodities during the recent price
boom is that prices have been highly volatile,
even more volatile than food prices (historically,
the reverse has been the case). In fact, non-food
price volatility during the second half of the past
decade has been the highest since 1970. For
example, non-food price volatility during 2000-
05 reached 9.7%, when the previous high in
1970-75 was 7.8%. Most likely, high non-food
price volatility reflects that fact that these
commodities increased the most during the
recent boom. food commodities increased the
most during the recent boom. Nevertheless,
overall price volatility appears to have eased
during the past two to three years, indicating that
the high volatility during 2008-10 reflected the
move from low to high prices and the financial
crisis of 2008 (see discussion in box 2).
Recent developments in metal markets
Aluminum prices fell below US$2,000 per ton in
the 2012Q3, near their pre-2005 levels, due to a
persistent global surplus and high stocks. Prices
are now at or below marginal production costs
for many producers, with more limited downside
risks—suggesting that prices are unlikely to fall
much more. Furthermore, a significant amount
of aluminum inventories are tied up in
warehouse financing deals and unavailable to the
market. Aluminum consumption continues to
benefit from substitution, mainly substitution
away from copper in the wiring and cable sectors
(copper prices are now more than four times
higher than aluminum prices, whereas the two
were similar prior to the 2005 boom).
Substitution is expected to continue for as long
as the aluminum to copper price ratio remains
above 2:1.
Global aluminum production capacity continues
to outstrip consumption, with the bulk of the
latter originating in China and, to a lesser extent,
Europe, the Middle East, and North America.
The market surplus is expected to endure in the
near term. Therefore, prices are likely to respond
to higher production costs, of which energy
accounts for 40 percent alone.
Copper prices fell sharply in 2012Q2 due to
weakening import demand by China. Still, the
large difference between copper and aluminum
prices has led not only to increased use of
aluminum in place of copper, but also to
accelerated rates of copper recycling of scrap
reprocessing. Copper demand is expected to
increase at a modest 2.5 percent per annum,
however, over the forecast period, before
Figure 11 . Consumption of metals
Source: World Bureau of Metal Statistics.
0
10,000
20,000
30,000
40,000
1990 1993 1996 1999 2002 2005 2008 2011
'ooo tons
Other
China
OECD
Figure 10. Metal prices
Source: World Bank.
-
10,000
20,000
30,000
40,000
50,000
60,000
0
2,000
4,000
6,000
8,000
10,000
Jan-00 Jan-02 Jan-04 Jan-06 Jan-08 Jan-10 Jan-12
Copper
Aluminum
Nickel (right axis)
$/ton $/ton
8
Commodity Market Outlook January 2013
Box 2. Commodity prices: levels, volatility, and comovement
Applying a standard measure of volatility to 45 monthly
prices during 1970-2012 shows that even though histori-
cally non-food prices have been less volatile than food
prices, non-food price volatility exceeded that of food
prices by a wide margin (9.7 versus 8.0) during 2005-09.
Furthermore, while non-food price volatility reached re-
cord highs during 2005-09, food price volatility did not—
i.e., food price volatility during the recent boom has been
high but not unprecedented. This result is remarkably
similar to Gilbert and Morgan (2010, p. 3023) who con-
cluded that food price variability during the post-2004
boom has been high but, with the exception of rice, not
out of line with historical experience. And, there is some
evidence that volatility has come down to historical
norms during the past 3 years (box figure 2.1). Two fac-
tors may account for the high volatility during 2005-09:
the move from a lower to higher price equilibrium and
the 2008 financial crisis. The latter is supported by the
fact that volatility increases sharply when August 2008 is
included in a two-year moving average, while a similar
decline becomes apparent when January 2011 is included
in the average (box figure 2.2).
In addition to increased levels and volatility, commodity
prices have been moving in a more synchronous manner.
In fact, price comovement during the second half of the
past decade has been the highest compared to the 43-year
sample period (box figure 2.3). Moreover, while there is
some evidence that comovement has moderated recently,
it is still high by historical standards. The increase in co-
movement implies that common factors have been the
dominant force behind post-2004 commodity price move-
ments (box 3 elaborates further on this point).
Price volatility is calculated as the median of
100*STDEV[log p(t)) - log p(t-1)] for 21 non-food and
24 food prices, where STDEV denotes standard devia-
tion, p(t) is the current price of each commodity, and p(t-
1) is the one-period lagged price (their logarithmic differ-
ence is the so-called returns). The measure is applied to
five-year periods, denoted as H1 and H2 for the first and
second part of each decade, respectively (2010:H1 in-
cludes 36 observations because the sample ends in De-
cember 2012). Volatility is also presented as a two-year
trailing moving average. Apart from its simplicity, this
measure of volatility is appropriate for non-stationary
variables, which is typically the case with commodity
prices. Comovement is measured as a two-year trailing
moving average of ABS[n(up)-n(down)]/[n(up)+n
(down)], where ABS is the absolute value operator and n
(up) and n(down) denote the number of prices that went
up and down during the month. The index can take values
between zero (when half of the prices go up and half go
down) and unity (when all prices move in the same direc-
tion). While random chance is expected to an equal num-
Box figure 2.1 Commodity price volatility: food and non-food (5 year averages)
Source: World Bank
7.8
5.4 5.2
6.2
5.3 5.34.9
9.7
6.0
8.6 8.8
7.07.5
5.7 5.8 5.8
8.0
5.8
-
2
4
6
8
10
12
1970:H1 1970:H2 1980:H1 1980:H2 1990:H1 1990:H2 2000:H1 2000:H2 2010:H1
Non-Food (21 commodities) Food (24 commodities)
Box figure 2.2 Commodity price volatility: all commodi-ties (2-year trailing moving average)
Source: World Bank.
0
2
4
6
8
10
12
Jan-72 Jan-76 Jan-80 Jan-84 Jan-88 Jan-92 Jan-96 Jan-00 Jan-04 Jan-08 Jan-12
Box figure 2.3 Commodity price comovement
Source: World Bank.
-
0.10
0.20
0.30
0.40
0.50
Jan-72 Jan-76 Jan-80 Jan-84 Jan-88 Jan-92 Jan-96 Jan-00 Jan-04 Jan-08 Jan-12
9
Commodity Market Outlook January 2013
slowing further over the longer term as copper
intensity in China—which has risen sharply—
plateaus.
Copper mine production, which was flat in 2011,
has not kept pace with consumption for a
number of reasons: technical problems, labor
disputes, declining grades, delays in start-up
projects, and shortages of skilled labor and
inputs. The tightness in copper production has
been pronounced at the world‘s two largest
mines, Escondida in Chile and Grasberg in
Indonesia. However, high copper prices have
induced a wave of new mines that are expected
to come on-stream shortly—in several African
countries, China, Peru, and the United States, for
example.
Nickel prices rose modestly in early 2012 before
receding due to the sluggish market for stainless
steel (the end use of more than two-thirds of
nickel production) and the rapid restart of nickel
pig iron (NPI) production in China. China now
accounts for 40 percent of global stainless steel
production, up from 4 percent a decade ago.
Stainless steel demand is expected to remain
robust in the medium term, growing by more
than 6 percent annually, mainly driven by high-
grade consumer applications, initially in high-
income countries and, increasingly so, in
emerging economies as well. A wave of new
nickel mine capacity is expected to keep nickel
prices close to marginal production costs,
however. Several new projects will soon ramp
up production, including those in Australia,
Brazil, Madagascar, New Caledonia, and Papua
New Guinea. Another major global source of
nickel is NPI in China, which sources low-grade
nickel ore from Indonesia and the Philippines.
China‘s production capacity may soon be
constrained, though, given that Indonesia has
announced that it will develop its own NPI
industry and has introduced export quotas and
may ban nickel ore exports by end-2013.
Outlook for metals
Overall, metal prices are forecast to increase
marginally in 2013. Aluminum prices are
expected to increase almost 3 percent and remain
at that level through 2015 due to rising power
costs and the fact that current prices have pushed
some producers at or below production costs.
Nickel prices are also expected to increase
almost 3 percent in 2013, and to follow a slightly
upward trend thereafter. Although there are no
physical constraints in these metal markets, there
are a number of factors that could push prices
even higher over the forecast period, including
declining ore grades, environmental issues, and
rising energy costs.
On the contrary, copper prices are expected to
decline 2 percent in 2013 and as much as 10
percent in 2014, mostly due to substitution
pressures and slowing demand.
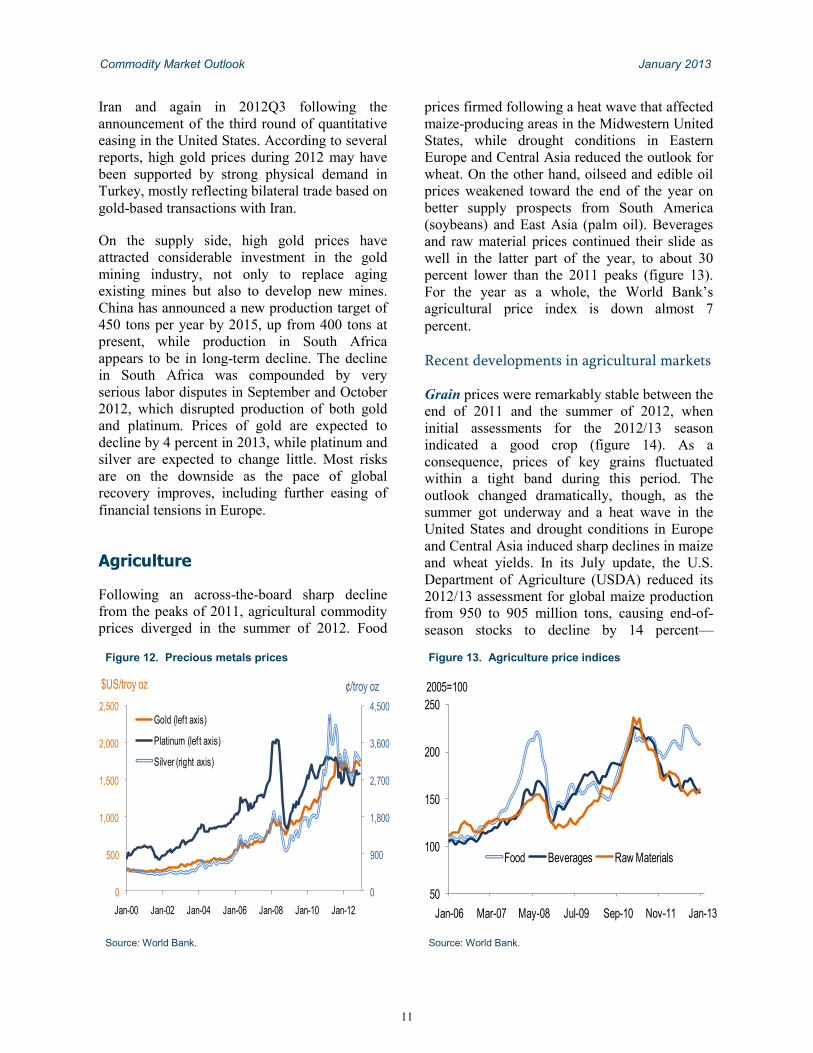
Precious metals
Precious metals prices increased less than 2
percent in 2012, a significant slowdown
compared to the previous two years, during
which increases of 37 and 28 percent,
respectively, occurred (figure 12). Nonetheless,
2012 was the eleventh straight year of higher
nominal prices of precious metals, as measured
by the precious metal index, mostly reflecting
their attractiveness ―safe-haven‖ investment
assets. The price of gold spiked twice in 2012,
once during 2012Q1 on heightened tensions with
ber of increases and declines, because of common factors, the index is likely to take values well above zero.
Indeed during 1970-2012 the index averaged 0.27, implying that of the 44 commodities of the sample, on aver-
age, 16 prices went up (down) and 28 prices went down (up). Two key advantages of the index are that (i) it
measures comovement across a large number of prices (difficult to measure using parametric models), and (ii)
it is not subjected to degrees of freedom limitations. However, these advantages come at the expense of measur-
ing direction of change only, not magnitude, thus underutilizing the informational content of prices. The index
has been used in the financial literature (see, for example, Morck, Yeung, and Yu (2000) on the measurement of
equity price comovement in emerging economies).
10
Commodity Market Outlook January 2013
Iran and again in 2012Q3 following the
announcement of the third round of quantitative
easing in the United States. According to several
reports, high gold prices during 2012 may have
been supported by strong physical demand in
Turkey, mostly reflecting bilateral trade based on
gold-based transactions with Iran.
On the supply side, high gold prices have
attracted considerable investment in the gold
mining industry, not only to replace aging
existing mines but also to develop new mines.
China has announced a new production target of
450 tons per year by 2015, up from 400 tons at
present, while production in South Africa
appears to be in long-term decline. The decline
in South Africa was compounded by very
serious labor disputes in September and October
2012, which disrupted production of both gold
and platinum. Prices of gold are expected to
decline by 4 percent in 2013, while platinum and
silver are expected to change little. Most risks
are on the downside as the pace of global
recovery improves, including further easing of
financial tensions in Europe.
Agriculture
Following an across-the-board sharp decline
from the peaks of 2011, agricultural commodity
prices diverged in the summer of 2012. Food
prices firmed following a heat wave that affected
maize-producing areas in the Midwestern United
States, while drought conditions in Eastern
Europe and Central Asia reduced the outlook for
wheat. On the other hand, oilseed and edible oil
prices weakened toward the end of the year on
better supply prospects from South America
(soybeans) and East Asia (palm oil). Beverages
and raw material prices continued their slide as
well in the latter part of the year, to about 30
percent lower than the 2011 peaks (figure 13).
For the year as a whole, the World Bank‘s
agricultural price index is down almost 7
percent.
Recent developments in agricultural markets
Grain prices were remarkably stable between the
end of 2011 and the summer of 2012, when
initial assessments for the 2012/13 season
indicated a good crop (figure 14). As a
consequence, prices of key grains fluctuated
within a tight band during this period. The
outlook changed dramatically, though, as the
summer got underway and a heat wave in the
United States and drought conditions in Europe
and Central Asia induced sharp declines in maize
and wheat yields. In its July update, the U.S.
Department of Agriculture (USDA) reduced its
2012/13 assessment for global maize production
from 950 to 905 million tons, causing end-of-
season stocks to decline by 14 percent—
Figure 13. Agriculture price indices
Source: World Bank.
50
100
150
200
250
Jan-06 Mar-07 May-08 Jul-09 Sep-10 Nov-11 Jan-13
Food Beverages Raw Materials
2005=100
Figure 12. Precious metals prices
Source: World Bank.
0
900
1,800
2,700
3,600
4,500
0
500
1,000
1,500
2,000
2,500
Jan-00 Jan-02 Jan-04 Jan-06 Jan-08 Jan-10 Jan-12
Gold (lef t axis)
Platinum (lef t axis)
Silver (right axis)
$US/troy oz ¢/troy oz
11

Commodity Market Outlook January 2013
associated with a stock-to-use ratio of less than
15 percent, the lowest since 1972/73. A smaller,
but still important, downward assessment
occurred for wheat yields. Prices of both maize
and wheat then increased almost 40 percent
within just a month. Since then, subsequent
USDA assessments have retained the tight
outlook for both commodities.
Between August and December 2012, maize and
wheat prices averaged US$313 and US$353 per
ton, respectively, associated with a 9 percent
premium of wheat over maize—historically the
premium has averaged 30 percent. The summer
drought therefore not only reduced the maize
stock-to-use ratio to historical lows, but brought
the wheat-to-maize price premium to historical
lows as well (figure 15).
Rice prices have averaged US$520/ton over the
past three years (they have exceeded US$600/ton
on only a few occasions), in large part due to the
fact that, contrary to the situation for wheat and
maize, the rice market remains well-supplied.
The variability of rice prices over the past year
reflects, in part, purchases through the Thai
Paddy Rice Program. Thailand is the world‘s
largest rice exporter, accounting for 25-30
percent of global exports, and hence its policy
actions have a large impact on world markets.
Although flood damage incurred early in 2012
led to reports that rice yields would be affected,
the concern turned out not to be important.
According to the USDA‘s January 2013
assessment, global rice production is expected to
reach 466 million tons, 1 million tons above the
2011/12 record. The stock-to-use ratio is
expected to reach 22 percent, marginally lower
than 2011/12 but well within historical norms.
Trade in rice has improved as well reaching a
new record of 39.1 million tons in 2012, aided in
part by a surge in Chinese imports (2.6 million
tons in 2012, up from 0.5 million tons in 2011).
Edible oil prices dropped almost 12 percent from
August to December 2012, as measured by the
World Bank edible oil price index, reversing a
27 percent increase during the first eight months
of the year (figure 16). The decline reflects an
improved outlook for the South American crop
Figure 14. Grain prices
Source: World Bank.
200
400
600
800
1,000
0
100
200
300
400
500
Jan-06 Jul-07 Jan-09 Jul-10 Jan-12
Wheat (left axis)
Maize (left axis)
Rice (right axis)
$/mt $/mt
Figure 16. Edible oil prices
Source: World Bank.
200
400
600
800
400
650
900
1,150
1,400
Jan-06 May-07 Sep-08 Jan-10 May-11 Sep-12
Palm oil (left axis)
Soybeans (right axis)
US$/ton US$/ton
Figure 15. Wheat-to-maize price ratio
Source: World Bank.
-10%
0%
10%
20%
30%
40%
50%
60%
1960 1965 1970 1975 1980 1985 1990 1995 2000 2005 2010
12
Commodity Market Outlook January 2013
as well as a reassessment of the U.S. soybean
crop, for which yields turned out to be higher
than originally expected. Palm oil supplies from
Indonesia and Malaysia are improving as well.
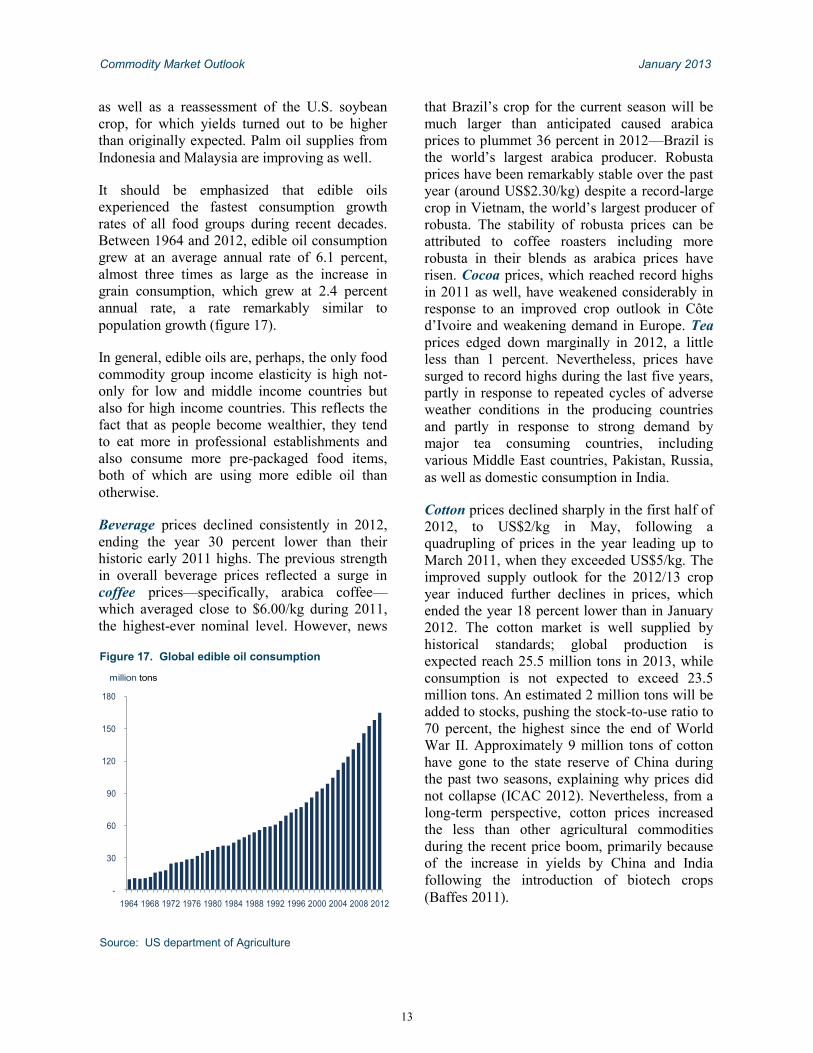
It should be emphasized that edible oils
experienced the fastest consumption growth
rates of all food groups during recent decades.
Between 1964 and 2012, edible oil consumption
grew at an average annual rate of 6.1 percent,
almost three times as large as the increase in
grain consumption, which grew at 2.4 percent
annual rate, a rate remarkably similar to
population growth (figure 17).
In general, edible oils are, perhaps, the only food
commodity group income elasticity is high not-
only for low and middle income countries but
also for high income countries. This reflects the
fact that as people become wealthier, they tend
to eat more in professional establishments and
also consume more pre-packaged food items,
both of which are using more edible oil than
otherwise.
Beverage prices declined consistently in 2012,
ending the year 30 percent lower than their
historic early 2011 highs. The previous strength
in overall beverage prices reflected a surge in
coffee prices—specifically, arabica coffee—
which averaged close to $6.00/kg during 2011,
the highest-ever nominal level. However, news
that Brazil‘s crop for the current season will be
much larger than anticipated caused arabica
prices to plummet 36 percent in 2012—Brazil is
the world‘s largest arabica producer. Robusta
prices have been remarkably stable over the past
year (around US$2.30/kg) despite a record-large
crop in Vietnam, the world‘s largest producer of
robusta. The stability of robusta prices can be
attributed to coffee roasters including more
robusta in their blends as arabica prices have
risen. Cocoa prices, which reached record highs
in 2011 as well, have weakened considerably in
response to an improved crop outlook in Côte
d‘Ivoire and weakening demand in Europe. Tea
prices edged down marginally in 2012, a little
less than 1 percent. Nevertheless, prices have
surged to record highs during the last five years,
partly in response to repeated cycles of adverse
weather conditions in the producing countries
and partly in response to strong demand by
major tea consuming countries, including
various Middle East countries, Pakistan, Russia,
as well as domestic consumption in India.
Cotton prices declined sharply in the first half of
2012, to US$2/kg in May, following a
quadrupling of prices in the year leading up to
March 2011, when they exceeded US$5/kg. The
improved supply outlook for the 2012/13 crop
year induced further declines in prices, which
ended the year 18 percent lower than in January
2012. The cotton market is well supplied by
historical standards; global production is
expected reach 25.5 million tons in 2013, while
consumption is not expected to exceed 23.5
million tons. An estimated 2 million tons will be
added to stocks, pushing the stock-to-use ratio to
70 percent, the highest since the end of World
War II. Approximately 9 million tons of cotton
have gone to the state reserve of China during
the past two seasons, explaining why prices did
not collapse (ICAC 2012). Nevertheless, from a
long-term perspective, cotton prices increased
the less than other agricultural commodities
during the recent price boom, primarily because
of the increase in yields by China and India
following the introduction of biotech crops
(Baffes 2011).
Figure 17. Global edible oil consumption
Source: US department of Agriculture
-
30
60
90
120
150
180
1964 1968 1972 1976 1980 1984 1988 1992 1996 2000 2004 2008 2012
million tons
13
Commodity Market Outlook January 2013
Natural rubber prices declined steadily in 2012,
to average the year almost 30 percent lower than
2011. As was the case with cotton, natural
rubber prices reached record highs in 2011,
exceeding US$6/kg in February 2011, more than
a four-fold increase within two years. The recent
decline reflects both increased supply and fears
of demand deterioration, especially from China.
(most natural rubber goes toward tire production,
and China is the fastest-growing market for
tires). Crude oil prices play a role in the price of
rubber as well, because synthetic rubber, a close
substitute to natural rubber, is a crude oil by-
product. Regarding timber, expectations for a
boom in prices following the Tohoku earthquake
were short lived. The price of logs from
Malaysia, for instance, dropped 8 percent in
2012, effectively reaching pre-Tohoku levels as
global demand for timber products has weakened
considerably.
Recent trends in domestic food prices
The discussion thus far has focused on price
movements in U.S. dollar terms. However, what
matters most to consumers is the price they pay
for food in their home countries. It is not
uncommon for prices paid by consumers in an
individual country to differ considerably from
international prices, at least in the short run.
Reasons for this include exchange rate
movements, trade policies intended to insulate
domestic markets, the long distance of domestic
trading centers from ports (adding considerably
to marketing costs), quality differences, and
differences in the composition of food baskets
across countries.
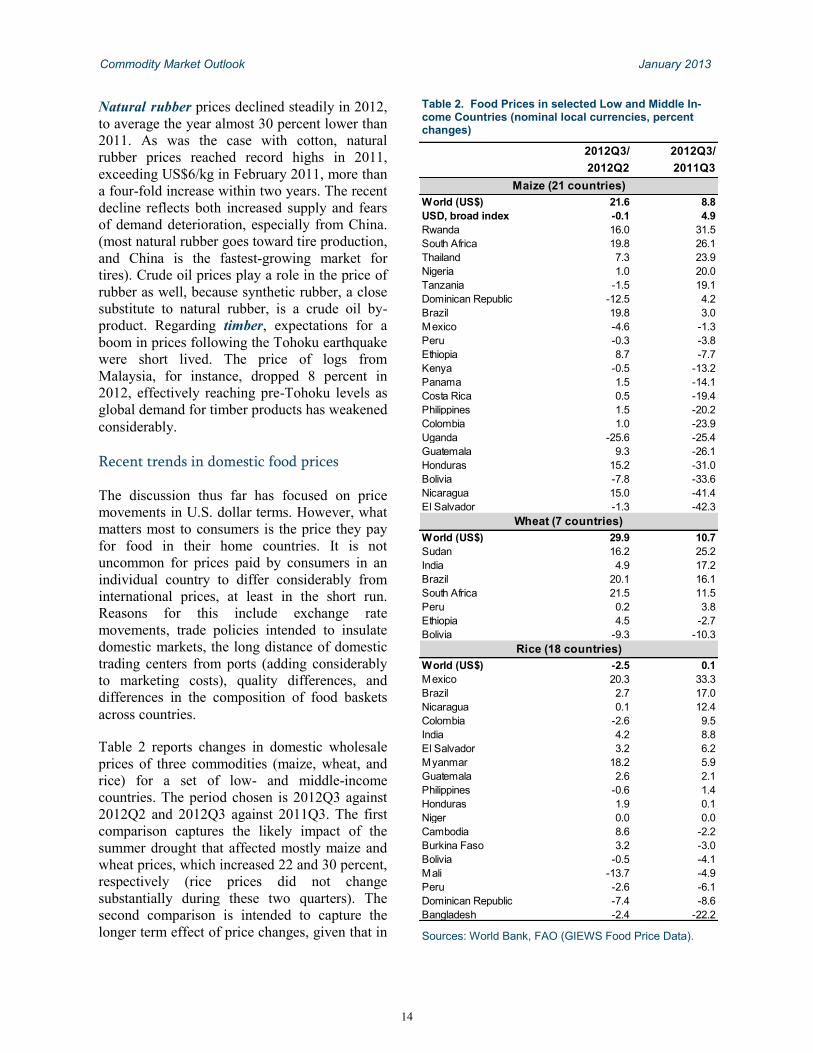
Table 2 reports changes in domestic wholesale
prices of three commodities (maize, wheat, and
rice) for a set of low- and middle-income
countries. The period chosen is 2012Q3 against
2012Q2 and 2012Q3 against 2011Q3. The first
comparison captures the likely impact of the
summer drought that affected mostly maize and
wheat prices, which increased 22 and 30 percent,
respectively (rice prices did not change
substantially during these two quarters). The
second comparison is intended to capture the
longer term effect of price changes, given that in
Table 2. Food Prices in selected Low and Middle In-come Countries (nominal local currencies, percent changes)
Sources: World Bank, FAO (GIEWS Food Price Data).
2012Q3/
2012Q2
2012Q3/
2011Q3
World (US$) 21.6 8.8
USD, broad index -0.1 4.9
Rwanda 16.0 31.5
South Africa 19.8 26.1
Thailand 7.3 23.9
Nigeria 1.0 20.0
Tanzania -1.5 19.1
Dominican Republic -12.5 4.2
Brazil 19.8 3.0
Mexico -4.6 -1.3
Peru -0.3 -3.8
Ethiopia 8.7 -7.7
Kenya -0.5 -13.2
Panama 1.5 -14.1
Costa Rica 0.5 -19.4
Philippines 1.5 -20.2
Colombia 1.0 -23.9
Uganda -25.6 -25.4
Guatemala 9.3 -26.1
Honduras 15.2 -31.0
Bolivia -7.8 -33.6
Nicaragua 15.0 -41.4
El Salvador -1.3 -42.3
World (US$) 29.9 10.7
Sudan 16.2 25.2
India 4.9 17.2
Brazil 20.1 16.1
South Africa 21.5 11.5
Peru 0.2 3.8
Ethiopia 4.5 -2.7
Bolivia -9.3 -10.3
World (US$) -2.5 0.1
Mexico 20.3 33.3
Brazil 2.7 17.0
Nicaragua 0.1 12.4
Colombia -2.6 9.5
India 4.2 8.8
El Salvador 3.2 6.2
Myanmar 18.2 5.9
Guatemala 2.6 2.1
Philippines -0.6 1.4
Honduras 1.9 0.1
Niger 0.0 0.0
Cambodia 8.6 -2.2
Burkina Faso 3.2 -3.0
Bolivia -0.5 -4.1
Mali -13.7 -4.9
Peru -2.6 -6.1
Dominican Republic -7.4 -8.6
Bangladesh -2.4 -22.2
Wheat (7 countries)
Maize (21 countries)
Rice (18 countries)
14

Commodity Market Outlook January 2013
most cases the price transmission is likely to be
slow. Yet, the price increases between 2012Q3
and 2011Q3 were relatively small, at 9 for maize
and 11 percent for wheat (again, the price of rice
was stable).
These results vary widely across commodities
and across countries. For example, between
2011Q3 and 2012Q3, 14 out of the 21 countries
that reporting data experienced price declines in
maize, while only seven experienced price
increases; the world maize price during this
period increased 9 percent. Interestingly, even
between 2012Q2 and 2012Q3, 14 out of the 21
countries experienced single-digit prices changes
(an equal number of increases and declines),
while only five countries reported maize price
increases comparable to world price changes.
This discrepancy may reflect the fact that the
world price of maize is reflects demand and
supply of maize used for feed, while most
domestic prices refer to maize for human
consumption. The results for wheat and rice are
more in line with expectations: three of the seven
countries reporting data for wheat experienced
increases comparable to world prices.
Furthermore, with only three exceptions,
domestic rice prices did not change much, which
was the case with world prices. A key
conclusion from this brief analysis regarding the
shorter term, is that in the case of wheat and rice,
domestic prices do follow world prices (with
some lags); this is not the case for maize.
In the longer term, it appears that about one-third
of the world price movements are transmitted to
domestic prices, not surprisingly given the host
of reasons mentioned above. For example,
between 2006 and 2011, roughly corresponding
the period spanning the recent commodity price
boom, the median domestic maize price increase
for the sample of countries mentioned above was
approximately 30 percent, compared to a
doubling in world maize prices. The
corresponding price changes for were 37 versus
6 percent for wheat and 48 versus 18 percent for
rice (figure 18).
Outlook for agricultural commodities
Agricultural prices are projected to decline 3.2
percent in 2013. Specifically, wheat and maize
prices are expected to average 2.2 and 2.8
percent less, respectively, than their 2012 levels.
Rice prices are expected to decline about 4
percent, to an average of US$540 per ton, while
soybean and palm oil prices are expected to be
3.6 and 2.1 percent lower, respectively. Among
beverage prices, coffee may experience the
largest decline (9.6 percent for robusta and 7.6
percent for arabica), while cocoa and tea will
change only marginally. On raw materials,
timber and natural rubber prices are expected to
decline modestly (0.5 and 2.3 percent,
respectively), while cotton prices are forecast to
drop by 8.5 percent.
A number of assumptions underpin the outlook
for agricultural commodities. First, it assumes
that crop production in the Southern Hemisphere
will not be impacted by adverse weather
conditions, and that next season‘s outlook will
return to normal trends—note that the wildfires
that affected Australia in early January did not
affect its wheat crop. In its January 2013
assessment, the USDA estimated the 2012/13
season‘s global grain supplies (production plus
starting stocks) at 2.47 billion tons, down 2.5
percent from 2011/12. If history is any guide,
when markets experience negative supply shocks
Figure 18. World and domestic price changes
Source: FAO and World Bank.
0.00
0.40
0.80
1.20
Maize Wheat Rice
World prices
Median domestic price
percent change, 2006 to 2011
15
Commodity Market Outlook January 2013
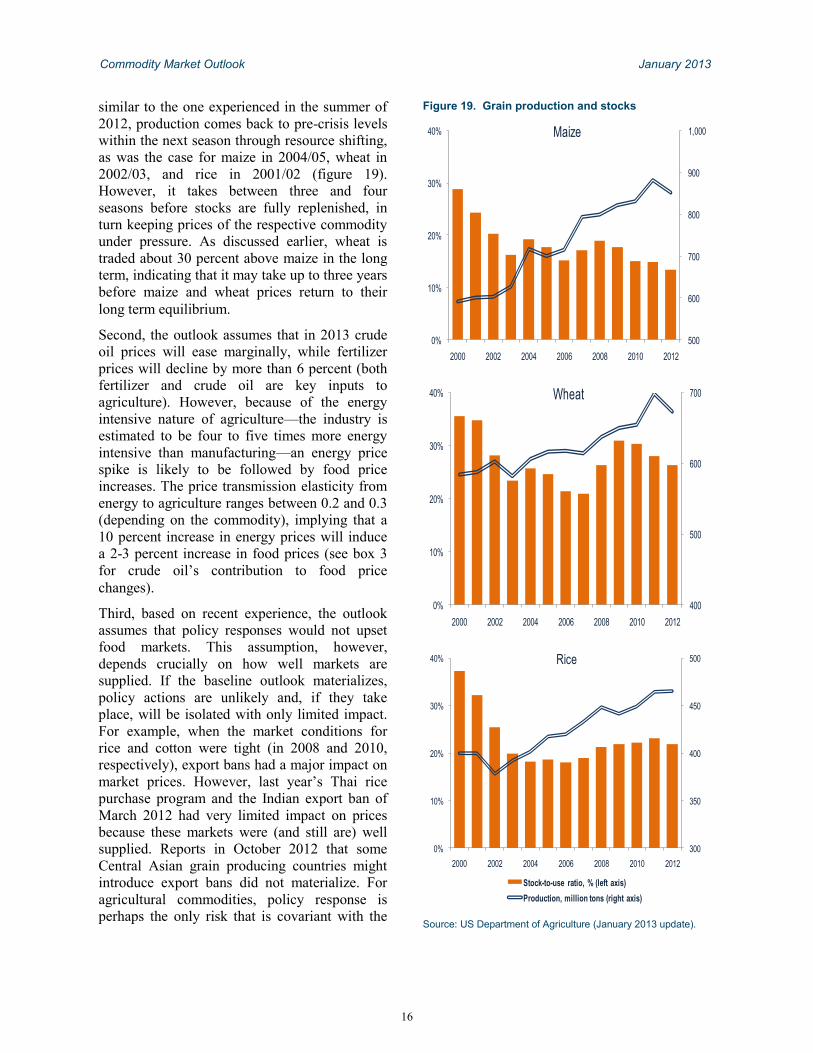
similar to the one experienced in the summer of
2012, production comes back to pre-crisis levels
within the next season through resource shifting,
as was the case for maize in 2004/05, wheat in
2002/03, and rice in 2001/02 (figure 19).
However, it takes between three and four
seasons before stocks are fully replenished, in
turn keeping prices of the respective commodity
under pressure. As discussed earlier, wheat is
traded about 30 percent above maize in the long
term, indicating that it may take up to three years
before maize and wheat prices return to their
long term equilibrium.
Second, the outlook assumes that in 2013 crude
oil prices will ease marginally, while fertilizer
prices will decline by more than 6 percent (both
fertilizer and crude oil are key inputs to
agriculture). However, because of the energy
intensive nature of agriculture—the industry is
estimated to be four to five times more energy
intensive than manufacturing—an energy price
spike is likely to be followed by food price
increases. The price transmission elasticity from
energy to agriculture ranges between 0.2 and 0.3
(depending on the commodity), implying that a
10 percent increase in energy prices will induce
a 2-3 percent increase in food prices (see box 3
for crude oil‘s contribution to food price
changes).
Third, based on recent experience, the outlook
assumes that policy responses would not upset
food markets. This assumption, however,
depends crucially on how well markets are
supplied. If the baseline outlook materializes,
policy actions are unlikely and, if they take
place, will be isolated with only limited impact.
For example, when the market conditions for
rice and cotton were tight (in 2008 and 2010,
respectively), export bans had a major impact on
market prices. However, last year‘s Thai rice
purchase program and the Indian export ban of
March 2012 had very limited impact on prices
because these markets were (and still are) well
supplied. Reports in October 2012 that some
Central Asian grain producing countries might
introduce export bans did not materialize. For
agricultural commodities, policy response is
perhaps the only risk that is covariant with the
Figure 19. Grain production and stocks
Source: US Department of Agriculture (January 2013 update).
500
600
700
800
900
1,000
0%
10%
20%
30%
40%
2000 2002 2004 2006 2008 2010 2012
Maize
400
500
600
700
0%
10%
20%
30%
40%
2000 2002 2004 2006 2008 2010 2012
Wheat
300
350
400
450
500
0%
10%
20%
30%
40%
2000 2002 2004 2006 2008 2010 2012
Rice
Stock-to-use ratio, % (left axis)
Production, million tons (right axis)
16
Commodity Market Outlook January 2013
Box 3. Which drivers matter most in food price movements?
The post-2004 commodity price boom took place during a period when many countries were experiencing strong
economic growth. Growth in low- and middle-income countries averaged 6.2 percent during 2005-12, one of the
highest eight-year averages in recent history. Yet, economic growth was only one among numerous causes of the
commodity price boom. Fiscal expansion in many countries, along with low interest rates, created an environment
favoring high commodity prices. A depreciating U.S. dollar also strengthened demand from (and limited supply to)
non-US$ commodity consumers (and producers). Other factors include low investment in agriculture in the past,
especially in extractive commodities (in turn a response to a prolonged period of low prices); capital markets
activity by financial institutions including commodities in their portfolios; and geopolitical concerns, especially in
energy markets. In the case of agricultural commodities, prices were affected by higher energy costs, increasingly
frequent adverse weather conditions, and the diversion of some food commodities to the production of biofuels.
These conditions led to global stock-to-use ratios of some agricultural commodities down to levels not seen since
the early 1970s. Lastly, policy responses including export bans and prohibitive taxes to offset the impact of high
world prices contributed to creating the conditions for what has been often called a ―perfect storm‖ (box table 3.1).
Which drivers matters most for food commodity prices? A reduced-form econometric model applied to five food
commodities (wheat, maize, rice, soybeans, and palm oil) using 1960-2012 data shows that crude oil price is the
most important variable by far, explaining almost two-thirds of the post-2004 food price increases. Stocks-to-use
(S/U) ratio is also important, accounting for about 15 percent, as is exchange rate, accounting for 10 percent. The
remaining 15 percent reflects, among other drivers, policies (details can be found in Baffes and Dennis 2013).
As an example, consider wheat. Between 1997-2004 and 2005-12 (roughly, the pre-and post boom periods), wheat
prices increased by 81 percent; the S/U ratio declined by 17 percent; oil prices increased 228 percent; and the U.S.
dollar depreciated 12 percent against the SDR. The three significantly different from zero estimated elasticities
were: -0.50 (S/U ratio), 0.28 (crude oil), and –0.86 (exchange rate). These elasticity estimates are consistent with
the literature—see FAO (2008), Bobenrieth, Wright, and Zeng (2012) for the S/U ratio, Gardner (1981) and Gilbert
(1989) for exchange rates, and Borensztein and Reinhart (1994) and Baffes (2007) for oil prices. When these
elasticities are applied to changes in the respective drivers, they give an 83 percent increase of the price of wheat
during these two periods [-0.50*(-17%) + 0.28*228% -0.86*(-11.8%) = 8.7% + 64.3% + 10.2% = 83.2%]. These
changes imply an 11 percent contribution by the S/U ratio, 77 percent contribution by oil, and 12 percent by
exchange rate movements. Using related methodology, von Witzke and Noleppa (2011) arrived at a remarkably
similar conclusions. World Bank (2012) used similar methodology.
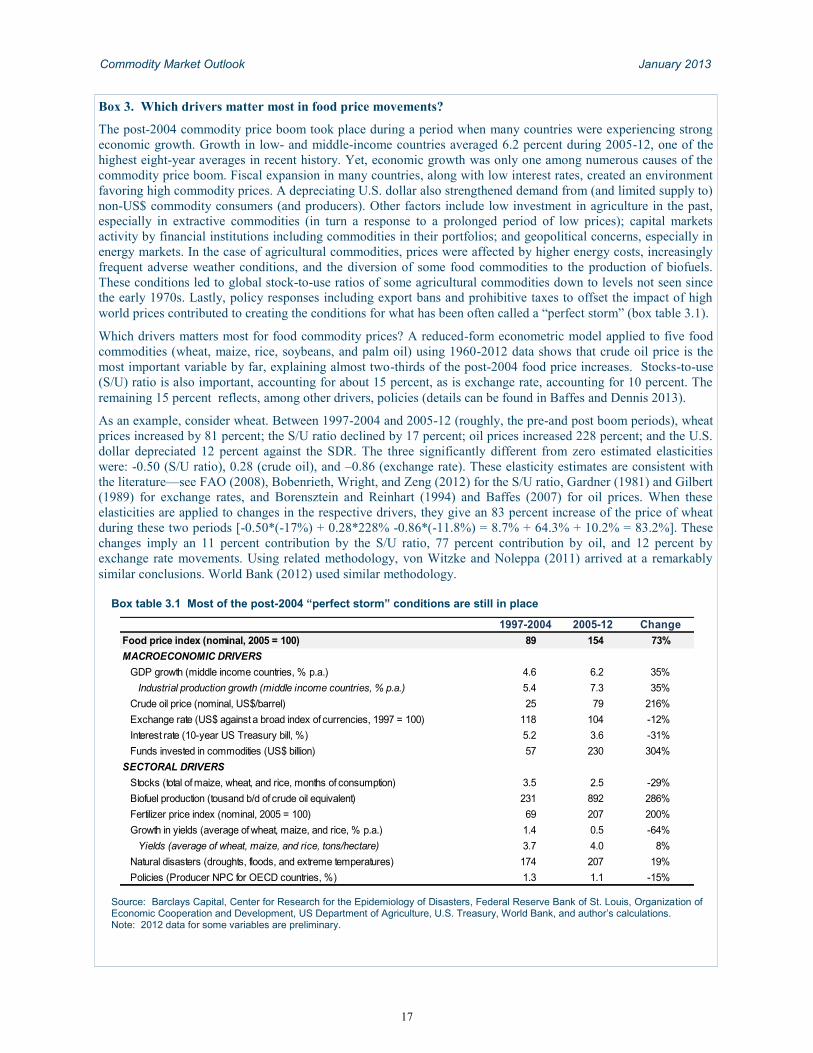
Box table 3.1 Most of the post-2004 “perfect storm” conditions are still in place
Source: Barclays Capital, Center for Research for the Epidemiology of Disasters, Federal Reserve Bank of St. Louis, Organization of Economic Cooperation and Development, US Department of Agriculture, U.S. Treasury, World Bank, and author’s calculations. Note: 2012 data for some variables are preliminary.
1997-2004 2005-12 Change
Food price index (nominal, 2005 = 100) 89 154 73%
MACROECONOMIC DRIVERS
GDP growth (middle income countries, % p.a.) 4.6 6.2 35%
Industrial production growth (middle income countries, % p.a.) 5.4 7.3 35%
Crude oil price (nominal, US$/barrel) 25 79 216%
Exchange rate (US$ against a broad index of currencies, 1997 = 100) 118 104 -12%
Interest rate (10-year US Treasury bill, %) 5.2 3.6 -31%
Funds invested in commodities (US$ billion) 57 230 304%
SECTORAL DRIVERS
Stocks (total of maize, wheat, and rice, months of consumption) 3.5 2.5 -29%
Biofuel production (tousand b/d of crude oil equivalent) 231 892 286%
Fertilizer price index (nominal, 2005 = 100) 69 207 200%
Growth in yields (average of wheat, maize, and rice, % p.a.) 1.4 0.5 -64%
Yields (average of wheat, maize, and rice, tons/hectare) 3.7 4.0 8%
Natural disasters (droughts, floods, and extreme temperatures) 174 207 19%
Policies (Producer NPC for OECD countries, %) 1.3 1.1 -15%
17
Commodity Market Outlook January 2013
risk of adequate supplies, which in turn depends
on weather.
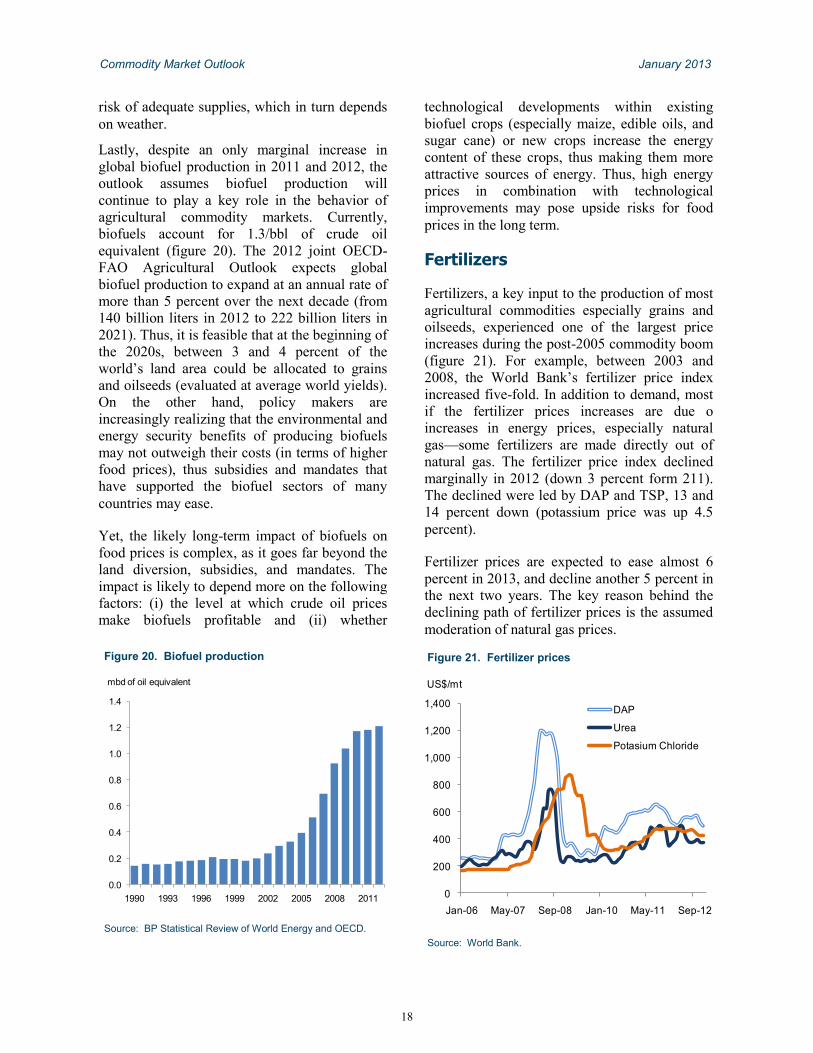
Lastly, despite an only marginal increase in
global biofuel production in 2011 and 2012, the
outlook assumes biofuel production will
continue to play a key role in the behavior of
agricultural commodity markets. Currently,
biofuels account for 1.3/bbl of crude oil
equivalent (figure 20). The 2012 joint OECD-
FAO Agricultural Outlook expects global
biofuel production to expand at an annual rate of
more than 5 percent over the next decade (from
140 billion liters in 2012 to 222 billion liters in
2021). Thus, it is feasible that at the beginning of
the 2020s, between 3 and 4 percent of the
world‘s land area could be allocated to grains
and oilseeds (evaluated at average world yields).
On the other hand, policy makers are
increasingly realizing that the environmental and
energy security benefits of producing biofuels
may not outweigh their costs (in terms of higher
food prices), thus subsidies and mandates that
have supported the biofuel sectors of many
countries may ease.
Yet, the likely long-term impact of biofuels on
food prices is complex, as it goes far beyond the
land diversion, subsidies, and mandates. The
impact is likely to depend more on the following
factors: (i) the level at which crude oil prices
make biofuels profitable and (ii) whether
technological developments within existing
biofuel crops (especially maize, edible oils, and
sugar cane) or new crops increase the energy
content of these crops, thus making them more
attractive sources of energy. Thus, high energy
prices in combination with technological
improvements may pose upside risks for food
prices in the long term.
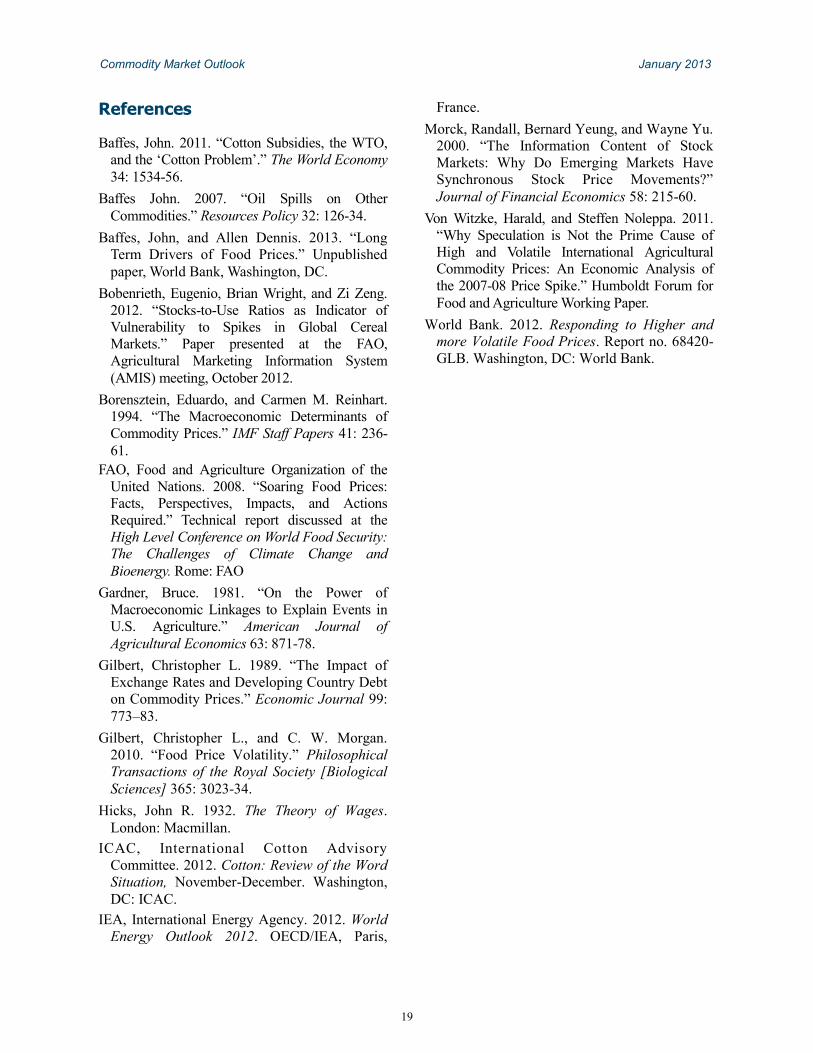
Fertilizers
Fertilizers, a key input to the production of most
agricultural commodities especially grains and
oilseeds, experienced one of the largest price
increases during the post-2005 commodity boom
(figure 21). For example, between 2003 and
2008, the World Bank‘s fertilizer price index
increased five-fold. In addition to demand, most
if the fertilizer prices increases are due o
increases in energy prices, especially natural
gas—some fertilizers are made directly out of
natural gas. The fertilizer price index declined
marginally in 2012 (down 3 percent form 211).
The declined were led by DAP and TSP, 13 and
14 percent down (potassium price was up 4.5
percent).
Fertilizer prices are expected to ease almost 6
percent in 2013, and decline another 5 percent in
the next two years. The key reason behind the
declining path of fertilizer prices is the assumed
moderation of natural gas prices.
Figure 20. Biofuel production
Source: BP Statistical Review of World Energy and OECD.
0.0
0.2
0.4
0.6
0.8
1.0
1.2
1.4
1990 1993 1996 1999 2002 2005 2008 2011
mbd of oil equivalent
Figure 21. Fertilizer prices
Source: World Bank.
0
200
400
600
800
1,000
1,200
1,400
Jan-06 May-07 Sep-08 Jan-10 May-11 Sep-12
DAP
Urea
Potasium Chloride
US$/mt
18
Commodity Market Outlook January 2013
References
Baffes, John. 2011. ―Cotton Subsidies, the WTO,
and the ‗Cotton Problem‘.‖ The World Economy
34: 1534-56.
Baffes John. 2007. ―Oil Spills on Other
Commodities.‖ Resources Policy 32: 126-34.
Baffes, John, and Allen Dennis. 2013. ―Long
Term Drivers of Food Prices.‖ Unpublished
paper, World Bank, Washington, DC.
Bobenrieth, Eugenio, Brian Wright, and Zi Zeng.
2012. ―Stocks-to-Use Ratios as Indicator of
Vulnerability to Spikes in Global Cereal
Markets.‖ Paper presented at the FAO,
Agricultural Marketing Information System
(AMIS) meeting, October 2012.
Borensztein, Eduardo, and Carmen M. Reinhart.
1994. ―The Macroeconomic Determinants of
Commodity Prices.‖ IMF Staff Papers 41: 236-
61.
FAO, Food and Agriculture Organization of the
United Nations. 2008. ―Soaring Food Prices:
Facts, Perspectives, Impacts, and Actions
Required.‖ Technical report discussed at the
High Level Conference on World Food Security:
The Challenges of Climate Change and
Bioenergy. Rome: FAO
Gardner, Bruce. 1981. ―On the Power of
Macroeconomic Linkages to Explain Events in
U.S. Agriculture.‖ American Journal of
Agricultural Economics 63: 871-78.
Gilbert, Christopher L. 1989. ―The Impact of
Exchange Rates and Developing Country Debt
on Commodity Prices.‖ Economic Journal 99:
773–83.
Gilbert, Christopher L., and C. W. Morgan.
2010. ―Food Price Volatility.‖ Philosophical
Transactions of the Royal Society [Biological
Sciences] 365: 3023-34.
Hicks, John R. 1932. The Theory of Wages.
London: Macmillan.
ICAC, International Cotton Advisory
Committee. 2012. Cotton: Review of the Word
Situation, November-December. Washington,
DC: ICAC.
IEA, International Energy Agency. 2012. World
Energy Outlook 2012. OECD/IEA, Paris,
France.
Morck, Randall, Bernard Yeung, and Wayne Yu.
2000. ―The Information Content of Stock
Markets: Why Do Emerging Markets Have
Synchronous Stock Price Movements?‖
Journal of Financial Economics 58: 215-60.
Von Witzke, Harald, and Steffen Noleppa. 2011.
―Why Speculation is Not the Prime Cause of
High and Volatile International Agricultural
Commodity Prices: An Economic Analysis of
the 2007-08 Price Spike.‖ Humboldt Forum for
Food and Agriculture Working Paper.
World Bank. 2012. Responding to Higher and
more Volatile Food Prices. Report no. 68420-
GLB. Washington, DC: World Bank.
19
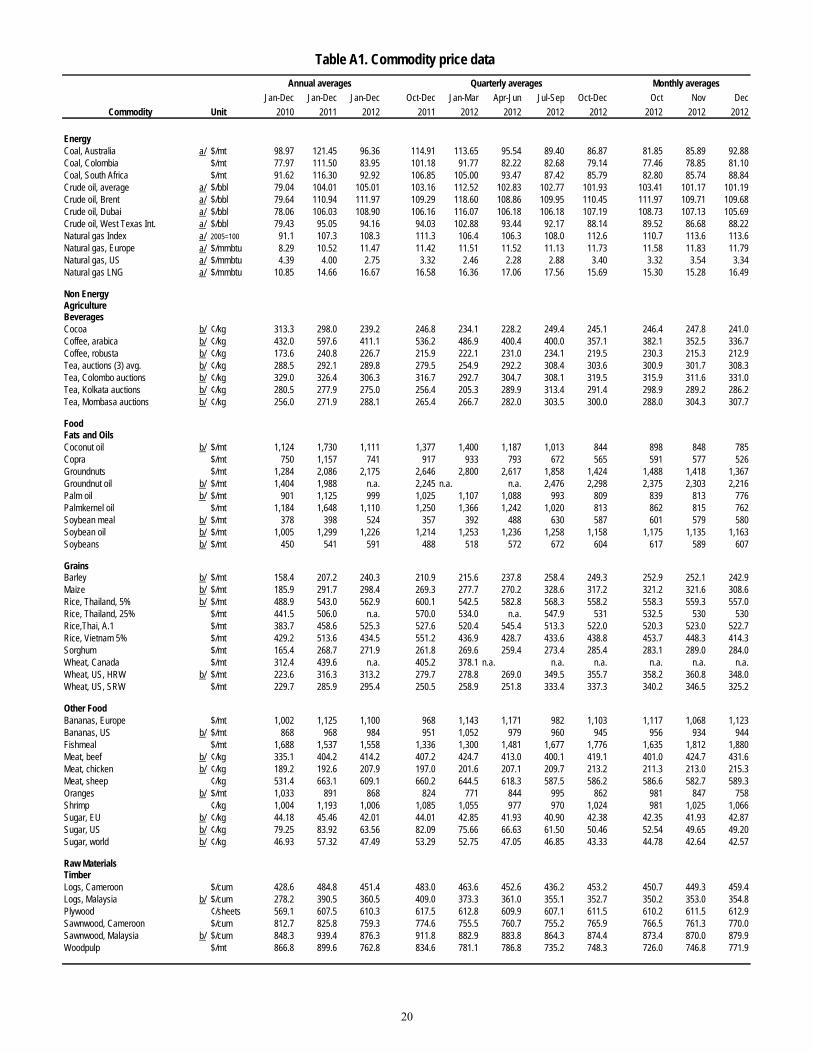
Table A1. Commodity price data
Annual averages Quarterly averages Monthly averages
Jan-Dec Jan-Dec Jan-Dec Oct-Dec Jan-Mar Apr-Jun Jul-Sep Oct-Dec Oct Nov Dec
Commodity Unit 2010 2011 2012 2011 2012 2012 2012 2012 2012 2012 2012
EnergyCoal, Australia a/ $/mt 98.97 121.45 96.36 114.91 113.65 95.54 89.40 86.87 81.85 85.89 92.88Coal, Colombia $/mt 77.97 111.50 83.95 101.18 91.77 82.22 82.68 79.14 77.46 78.85 81.10Coal, South Africa $/mt 91.62 116.30 92.92 106.85 105.00 93.47 87.42 85.79 82.80 85.74 88.84Crude oil, average a/ $/bbl 79.04 104.01 105.01 103.16 112.52 102.83 102.77 101.93 103.41 101.17 101.19Crude oil, Brent a/ $/bbl 79.64 110.94 111.97 109.29 118.60 108.86 109.95 110.45 111.97 109.71 109.68Crude oil, Dubai a/ $/bbl 78.06 106.03 108.90 106.16 116.07 106.18 106.18 107.19 108.73 107.13 105.69Crude oil, West Texas Int. a/ $/bbl 79.43 95.05 94.16 94.03 102.88 93.44 92.17 88.14 89.52 86.68 88.22Natural gas Index a/ 2005=100 91.1 107.3 108.3 111.3 106.4 106.3 108.0 112.6 110.7 113.6 113.6Natural gas, Europe a/ $/mmbtu 8.29 10.52 11.47 11.42 11.51 11.52 11.13 11.73 11.58 11.83 11.79Natural gas, US a/ $/mmbtu 4.39 4.00 2.75 3.32 2.46 2.28 2.88 3.40 3.32 3.54 3.34Natural gas LNG a/ $/mmbtu 10.85 14.66 16.67 16.58 16.36 17.06 17.56 15.69 15.30 15.28 16.49
Non EnergyAgricultureBeveragesCocoa b/ ¢/kg 313.3 298.0 239.2 246.8 234.1 228.2 249.4 245.1 246.4 247.8 241.0Coffee, arabica b/ ¢/kg 432.0 597.6 411.1 536.2 486.9 400.4 400.0 357.1 382.1 352.5 336.7Coffee, robusta b/ ¢/kg 173.6 240.8 226.7 215.9 222.1 231.0 234.1 219.5 230.3 215.3 212.9Tea, auctions (3) avg. b/ ¢/kg 288.5 292.1 289.8 279.5 254.9 292.2 308.4 303.6 300.9 301.7 308.3Tea, Colombo auctions b/ ¢/kg 329.0 326.4 306.3 316.7 292.7 304.7 308.1 319.5 315.9 311.6 331.0Tea, Kolkata auctions b/ ¢/kg 280.5 277.9 275.0 256.4 205.3 289.9 313.4 291.4 298.9 289.2 286.2Tea, Mombasa auctions b/ ¢/kg 256.0 271.9 288.1 265.4 266.7 282.0 303.5 300.0 288.0 304.3 307.7
FoodFats and OilsCoconut oil b/ $/mt 1,124 1,730 1,111 1,377 1,400 1,187 1,013 844 898 848 785Copra $/mt 750 1,157 741 917 933 793 672 565 591 577 526Groundnuts $/mt 1,284 2,086 2,175 2,646 2,800 2,617 1,858 1,424 1,488 1,418 1,367Groundnut oil b/ $/mt 1,404 1,988 n.a. 2,245 n.a. n.a. 2,476 2,298 2,375 2,303 2,216Palm oil b/ $/mt 901 1,125 999 1,025 1,107 1,088 993 809 839 813 776Palmkernel oil $/mt 1,184 1,648 1,110 1,250 1,366 1,242 1,020 813 862 815 762Soybean meal b/ $/mt 378 398 524 357 392 488 630 587 601 579 580Soybean oil b/ $/mt 1,005 1,299 1,226 1,214 1,253 1,236 1,258 1,158 1,175 1,135 1,163Soybeans b/ $/mt 450 541 591 488 518 572 672 604 617 589 607
GrainsBarley b/ $/mt 158.4 207.2 240.3 210.9 215.6 237.8 258.4 249.3 252.9 252.1 242.9Maize b/ $/mt 185.9 291.7 298.4 269.3 277.7 270.2 328.6 317.2 321.2 321.6 308.6Rice, Thailand, 5% b/ $/mt 488.9 543.0 562.9 600.1 542.5 582.8 568.3 558.2 558.3 559.3 557.0Rice, Thailand, 25% $/mt 441.5 506.0 n.a. 570.0 534.0 n.a. 547.9 531 532.5 530 530Rice,Thai, A.1 $/mt 383.7 458.6 525.3 527.6 520.4 545.4 513.3 522.0 520.3 523.0 522.7Rice, Vietnam 5% $/mt 429.2 513.6 434.5 551.2 436.9 428.7 433.6 438.8 453.7 448.3 414.3Sorghum $/mt 165.4 268.7 271.9 261.8 269.6 259.4 273.4 285.4 283.1 289.0 284.0Wheat, Canada $/mt 312.4 439.6 n.a. 405.2 378.1 n.a. n.a. n.a. n.a. n.a. n.a.Wheat, US, HRW b/ $/mt 223.6 316.3 313.2 279.7 278.8 269.0 349.5 355.7 358.2 360.8 348.0Wheat, US, SRW $/mt 229.7 285.9 295.4 250.5 258.9 251.8 333.4 337.3 340.2 346.5 325.2
Other FoodBananas, Europe $/mt 1,002 1,125 1,100 968 1,143 1,171 982 1,103 1,117 1,068 1,123Bananas, US b/ $/mt 868 968 984 951 1,052 979 960 945 956 934 944Fishmeal $/mt 1,688 1,537 1,558 1,336 1,300 1,481 1,677 1,776 1,635 1,812 1,880Meat, beef b/ ¢/kg 335.1 404.2 414.2 407.2 424.7 413.0 400.1 419.1 401.0 424.7 431.6Meat, chicken b/ ¢/kg 189.2 192.6 207.9 197.0 201.6 207.1 209.7 213.2 211.3 213.0 215.3Meat, sheep ¢/kg 531.4 663.1 609.1 660.2 644.5 618.3 587.5 586.2 586.6 582.7 589.3Oranges b/ $/mt 1,033 891 868 824 771 844 995 862 981 847 758Shrimp ¢/kg 1,004 1,193 1,006 1,085 1,055 977 970 1,024 981 1,025 1,066Sugar, EU b/ ¢/kg 44.18 45.46 42.01 44.01 42.85 41.93 40.90 42.38 42.35 41.93 42.87Sugar, US b/ ¢/kg 79.25 83.92 63.56 82.09 75.66 66.63 61.50 50.46 52.54 49.65 49.20Sugar, world b/ ¢/kg 46.93 57.32 47.49 53.29 52.75 47.05 46.85 43.33 44.78 42.64 42.57
Raw MaterialsTimberLogs, Cameroon $/cum 428.6 484.8 451.4 483.0 463.6 452.6 436.2 453.2 450.7 449.3 459.4Logs, Malaysia b/ $/cum 278.2 390.5 360.5 409.0 373.3 361.0 355.1 352.7 350.2 353.0 354.8Plywood ¢/sheets 569.1 607.5 610.3 617.5 612.8 609.9 607.1 611.5 610.2 611.5 612.9Sawnwood, Cameroon $/cum 812.7 825.8 759.3 774.6 755.5 760.7 755.2 765.9 766.5 761.3 770.0Sawnwood, Malaysia b/ $/cum 848.3 939.4 876.3 911.8 882.9 883.8 864.3 874.4 873.4 870.0 879.9Woodpulp $/mt 866.8 899.6 762.8 834.6 781.1 786.8 735.2 748.3 726.0 746.8 771.9
20
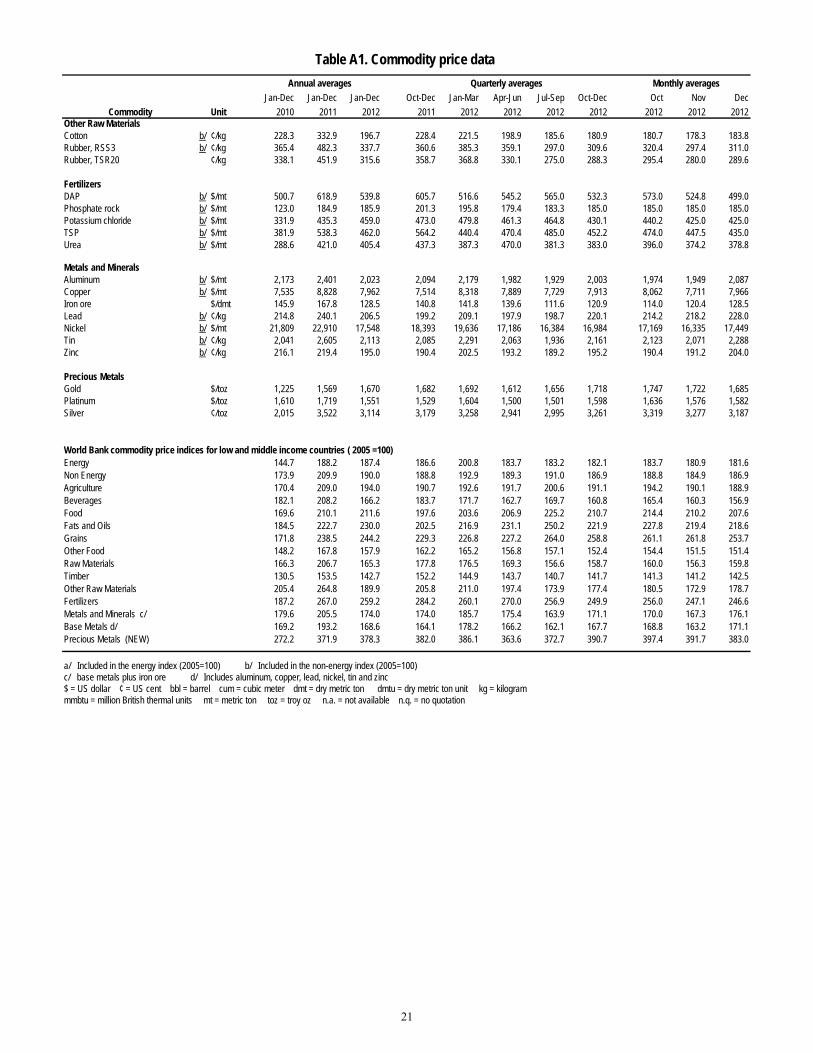
Table A1. Commodity price data
Annual averages Quarterly averages Monthly averages
Jan-Dec Jan-Dec Jan-Dec Oct-Dec Jan-Mar Apr-Jun Jul-Sep Oct-Dec Oct Nov Dec
Commodity Unit 2010 2011 2012 2011 2012 2012 2012 2012 2012 2012 2012Other Raw MaterialsCotton b/ ¢/kg 228.3 332.9 196.7 228.4 221.5 198.9 185.6 180.9 180.7 178.3 183.8Rubber, RSS3 b/ ¢/kg 365.4 482.3 337.7 360.6 385.3 359.1 297.0 309.6 320.4 297.4 311.0Rubber, TSR20 ¢/kg 338.1 451.9 315.6 358.7 368.8 330.1 275.0 288.3 295.4 280.0 289.6
FertilizersDAP b/ $/mt 500.7 618.9 539.8 605.7 516.6 545.2 565.0 532.3 573.0 524.8 499.0Phosphate rock b/ $/mt 123.0 184.9 185.9 201.3 195.8 179.4 183.3 185.0 185.0 185.0 185.0Potassium chloride b/ $/mt 331.9 435.3 459.0 473.0 479.8 461.3 464.8 430.1 440.2 425.0 425.0TSP b/ $/mt 381.9 538.3 462.0 564.2 440.4 470.4 485.0 452.2 474.0 447.5 435.0Urea b/ $/mt 288.6 421.0 405.4 437.3 387.3 470.0 381.3 383.0 396.0 374.2 378.8
Metals and MineralsAluminum b/ $/mt 2,173 2,401 2,023 2,094 2,179 1,982 1,929 2,003 1,974 1,949 2,087Copper b/ $/mt 7,535 8,828 7,962 7,514 8,318 7,889 7,729 7,913 8,062 7,711 7,966Iron ore $/dmt 145.9 167.8 128.5 140.8 141.8 139.6 111.6 120.9 114.0 120.4 128.5Lead b/ ¢/kg 214.8 240.1 206.5 199.2 209.1 197.9 198.7 220.1 214.2 218.2 228.0Nickel b/ $/mt 21,809 22,910 17,548 18,393 19,636 17,186 16,384 16,984 17,169 16,335 17,449Tin b/ ¢/kg 2,041 2,605 2,113 2,085 2,291 2,063 1,936 2,161 2,123 2,071 2,288Zinc b/ ¢/kg 216.1 219.4 195.0 190.4 202.5 193.2 189.2 195.2 190.4 191.2 204.0
Precious MetalsGold $/toz 1,225 1,569 1,670 1,682 1,692 1,612 1,656 1,718 1,747 1,722 1,685Platinum $/toz 1,610 1,719 1,551 1,529 1,604 1,500 1,501 1,598 1,636 1,576 1,582Silver ¢/toz 2,015 3,522 3,114 3,179 3,258 2,941 2,995 3,261 3,319 3,277 3,187
World Bank commodity price indices for low and middle income countries ( 2005 =100)Energy 144.7 188.2 187.4 186.6 200.8 183.7 183.2 182.1 183.7 180.9 181.6Non Energy 173.9 209.9 190.0 188.8 192.9 189.3 191.0 186.9 188.8 184.9 186.9Agriculture 170.4 209.0 194.0 190.7 192.6 191.7 200.6 191.1 194.2 190.1 188.9Beverages 182.1 208.2 166.2 183.7 171.7 162.7 169.7 160.8 165.4 160.3 156.9Food 169.6 210.1 211.6 197.6 203.6 206.9 225.2 210.7 214.4 210.2 207.6Fats and Oils 184.5 222.7 230.0 202.5 216.9 231.1 250.2 221.9 227.8 219.4 218.6Grains 171.8 238.5 244.2 229.3 226.8 227.2 264.0 258.8 261.1 261.8 253.7Other Food 148.2 167.8 157.9 162.2 165.2 156.8 157.1 152.4 154.4 151.5 151.4Raw Materials 166.3 206.7 165.3 177.8 176.5 169.3 156.6 158.7 160.0 156.3 159.8Timber 130.5 153.5 142.7 152.2 144.9 143.7 140.7 141.7 141.3 141.2 142.5Other Raw Materials 205.4 264.8 189.9 205.8 211.0 197.4 173.9 177.4 180.5 172.9 178.7Fertilizers 187.2 267.0 259.2 284.2 260.1 270.0 256.9 249.9 256.0 247.1 246.6Metals and Minerals c/ 179.6 205.5 174.0 174.0 185.7 175.4 163.9 171.1 170.0 167.3 176.1Base Metals d/ 169.2 193.2 168.6 164.1 178.2 166.2 162.1 167.7 168.8 163.2 171.1Precious Metals (NEW) 272.2 371.9 378.3 382.0 386.1 363.6 372.7 390.7 397.4 391.7 383.0
a/ Included in the energy index (2005=100) b/ Included in the non-energy index (2005=100) c/ base metals plus iron ore d/ Includes aluminum, copper, lead, nickel, tin and zinc $ = US dollar ¢ = US cent bbl = barrel cum = cubic meter dmt = dry metric ton dmtu = dry metric ton unit kg = kilogram mmbtu = million British thermal units mt = metric ton toz = troy oz n.a. = not available n.q. = no quotation
21
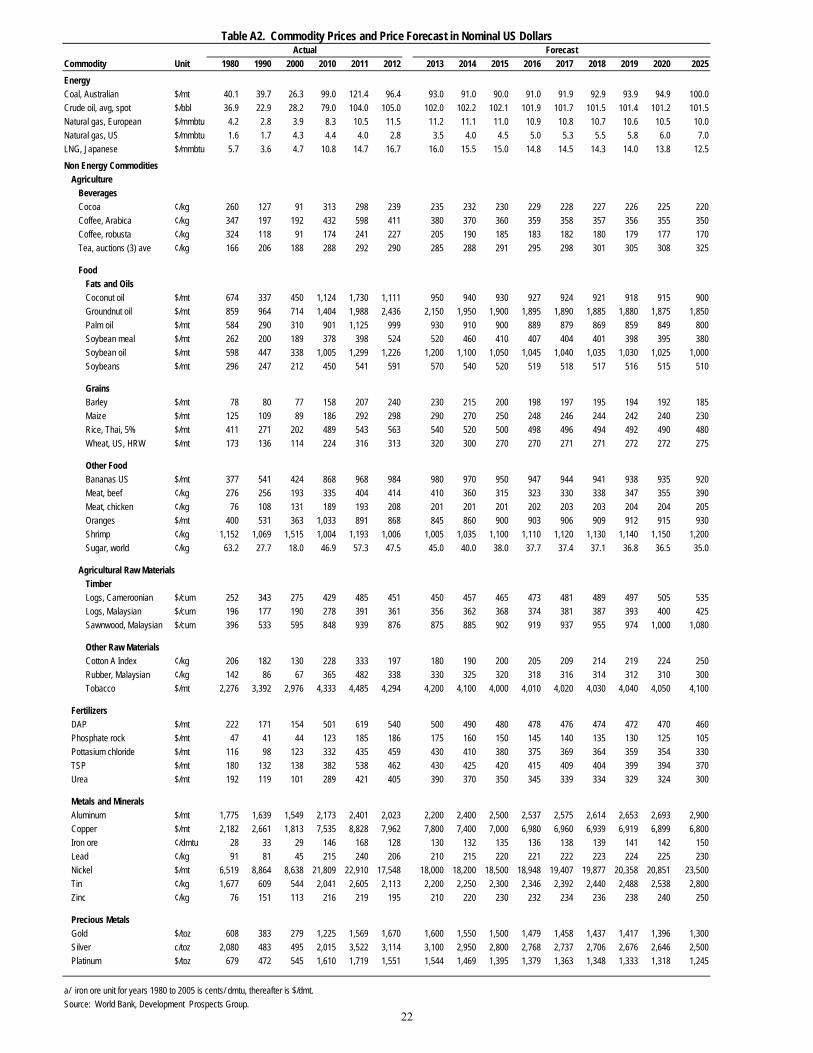
Table A2. Commodity Prices and Price Forecast in Nominal US DollarsActual Forecast
Commodity Unit 1980 1990 2000 2010 2011 2012 2013 2014 2015 2016 2017 2018 2019 2020 2025
Energy
Coal, Australian $/mt 40.1 39.7 26.3 99.0 121.4 96.4 93.0 91.0 90.0 91.0 91.9 92.9 93.9 94.9 100.0
Crude oil, avg, spot $/bbl 36.9 22.9 28.2 79.0 104.0 105.0 102.0 102.2 102.1 101.9 101.7 101.5 101.4 101.2 101.5
Natural gas, European $/mmbtu 4.2 2.8 3.9 8.3 10.5 11.5 11.2 11.1 11.0 10.9 10.8 10.7 10.6 10.5 10.0
Natural gas, US $/mmbtu 1.6 1.7 4.3 4.4 4.0 2.8 3.5 4.0 4.5 5.0 5.3 5.5 5.8 6.0 7.0
LNG, Japanese $/mmbtu 5.7 3.6 4.7 10.8 14.7 16.7 16.0 15.5 15.0 14.8 14.5 14.3 14.0 13.8 12.5
Non Energy Commodities
Agriculture
Beverages
Cocoa ¢/kg 260 127 91 313 298 239 235 232 230 229 228 227 226 225 220
Coffee, Arabica ¢/kg 347 197 192 432 598 411 380 370 360 359 358 357 356 355 350
Coffee, robusta ¢/kg 324 118 91 174 241 227 205 190 185 183 182 180 179 177 170
Tea, auctions (3) ave ¢/kg 166 206 188 288 292 290 285 288 291 295 298 301 305 308 325
Food
Fats and Oils
Coconut oil $/mt 674 337 450 1,124 1,730 1,111 950 940 930 927 924 921 918 915 900
Groundnut oil $/mt 859 964 714 1,404 1,988 2,436 2,150 1,950 1,900 1,895 1,890 1,885 1,880 1,875 1,850
Palm oil $/mt 584 290 310 901 1,125 999 930 910 900 889 879 869 859 849 800
Soybean meal $/mt 262 200 189 378 398 524 520 460 410 407 404 401 398 395 380
Soybean oil $/mt 598 447 338 1,005 1,299 1,226 1,200 1,100 1,050 1,045 1,040 1,035 1,030 1,025 1,000
Soybeans $/mt 296 247 212 450 541 591 570 540 520 519 518 517 516 515 510
Grains
Barley $/mt 78 80 77 158 207 240 230 215 200 198 197 195 194 192 185
Maize $/mt 125 109 89 186 292 298 290 270 250 248 246 244 242 240 230
Rice, Thai, 5% $/mt 411 271 202 489 543 563 540 520 500 498 496 494 492 490 480
Wheat, US, HRW $/mt 173 136 114 224 316 313 320 300 270 270 271 271 272 272 275
Other Food
Bananas US $/mt 377 541 424 868 968 984 980 970 950 947 944 941 938 935 920
Meat, beef ¢/kg 276 256 193 335 404 414 410 360 315 323 330 338 347 355 390
Meat, chicken ¢/kg 76 108 131 189 193 208 201 201 201 202 203 203 204 204 205
Oranges $/mt 400 531 363 1,033 891 868 845 860 900 903 906 909 912 915 930
Shrimp ¢/kg 1,152 1,069 1,515 1,004 1,193 1,006 1,005 1,035 1,100 1,110 1,120 1,130 1,140 1,150 1,200
Sugar, world ¢/kg 63.2 27.7 18.0 46.9 57.3 47.5 45.0 40.0 38.0 37.7 37.4 37.1 36.8 36.5 35.0
Agricultural Raw Materials
Timber
Logs, Cameroonian $/cum 252 343 275 429 485 451 450 457 465 473 481 489 497 505 535
Logs, Malaysian $/cum 196 177 190 278 391 361 356 362 368 374 381 387 393 400 425
Sawnwood, Malaysian $/cum 396 533 595 848 939 876 875 885 902 919 937 955 974 1,000 1,080
Other Raw Materials
Cotton A Index ¢/kg 206 182 130 228 333 197 180 190 200 205 209 214 219 224 250
Rubber, Malaysian ¢/kg 142 86 67 365 482 338 330 325 320 318 316 314 312 310 300
Tobacco $/mt 2,276 3,392 2,976 4,333 4,485 4,294 4,200 4,100 4,000 4,010 4,020 4,030 4,040 4,050 4,100
Fertilizers
DAP $/mt 222 171 154 501 619 540 500 490 480 478 476 474 472 470 460
Phosphate rock $/mt 47 41 44 123 185 186 175 160 150 145 140 135 130 125 105
Pottasium chloride $/mt 116 98 123 332 435 459 430 410 380 375 369 364 359 354 330
TSP $/mt 180 132 138 382 538 462 430 425 420 415 409 404 399 394 370
Urea $/mt 192 119 101 289 421 405 390 370 350 345 339 334 329 324 300
Metals and Minerals
Aluminum $/mt 1,775 1,639 1,549 2,173 2,401 2,023 2,200 2,400 2,500 2,537 2,575 2,614 2,653 2,693 2,900
Copper $/mt 2,182 2,661 1,813 7,535 8,828 7,962 7,800 7,400 7,000 6,980 6,960 6,939 6,919 6,899 6,800
Iron ore ¢/dmtu 28 33 29 146 168 128 130 132 135 136 138 139 141 142 150
Lead ¢/kg 91 81 45 215 240 206 210 215 220 221 222 223 224 225 230
Nickel $/mt 6,519 8,864 8,638 21,809 22,910 17,548 18,000 18,200 18,500 18,948 19,407 19,877 20,358 20,851 23,500
Tin ¢/kg 1,677 609 544 2,041 2,605 2,113 2,200 2,250 2,300 2,346 2,392 2,440 2,488 2,538 2,800
Zinc ¢/kg 76 151 113 216 219 195 210 220 230 232 234 236 238 240 250
Precious Metals
Gold $/toz 608 383 279 1,225 1,569 1,670 1,600 1,550 1,500 1,479 1,458 1,437 1,417 1,396 1,300
Silver c/toz 2,080 483 495 2,015 3,522 3,114 3,100 2,950 2,800 2,768 2,737 2,706 2,676 2,646 2,500
Platinum $/toz 679 472 545 1,610 1,719 1,551 1,544 1,469 1,395 1,379 1,363 1,348 1,333 1,318 1,245
a/ iron ore unit for years 1980 to 2005 is cents/ dmtu, thereafter is $/dmt.
Source: World Bank, Development Prospects Group.22

Actual Forecast
Commodity Unit 1980 1990 2000 2010 2011 2012 2013 2014 2015 2016 2017 2018 2019 2020 2025
Energy
Coal, Australian $/mt 52.7 41.0 29.4 87.6 98.7 79.9 75.7 72.5 70.4 69.8 69.3 68.9 68.4 67.9 65.4
Crude oil, avg, spot $/bbl 48.4 23.7 31.6 70.0 84.6 87.1 83.0 81.4 79.8 78.3 76.8 75.3 73.8 72.4 66.3
Natural gas, European $/mmbtu 5.5 2.9 4.3 7.3 8.5 9.5 9.1 8.8 8.6 8.4 8.1 7.9 7.7 7.5 6.5
Natural gas, US $/mmbtu 2.1 1.8 4.8 3.9 3.3 2.3 2.8 3.2 3.5 3.8 4.0 4.1 4.2 4.3 4.6
LNG, Japanese $/mmbtu 7.5 3.8 5.3 9.6 11.9 13.8 13.0 12.3 11.7 11.3 10.9 10.6 10.2 9.8 8.2
Non Energy Commodities
Agriculture
Beverages
Cocoa ¢/kg 342 131 101 277 242 198 191 185 180 176 172 168 165 161 144
Coffee, Arabica ¢/kg 455 204 215 383 486 341 309 295 281 276 270 265 259 254 229
Coffee, robusta ¢/kg 426 122 102 154 196 188 167 151 145 141 137 134 130 127 111
Tea, auctions (3) ave ¢/kg 218 213 210 255 237 240 232 230 228 226 225 223 222 220 212
Food
Fats and Oils
Coconut oil $/mt 884 348 504 995 1,406 921 773 749 727 712 697 683 668 654 588
Groundnut oil $/mt 1,127 997 799 1,243 1,616 2,019 1,750 1,554 1,485 1,455 1,426 1,397 1,369 1,341 1,209
Palm oil $/mt 766 300 347 798 915 828 757 725 704 683 663 644 625 607 523
Soybean meal $/mt 344 207 212 335 324 434 423 367 321 312 305 297 290 282 248
Soybean oil $/mt 784 463 378 890 1,056 1,017 977 876 821 802 784 767 750 733 654
Soybeans $/mt 389 255 237 398 440 490 464 430 407 398 391 383 376 368 333
Grains
Barley $/mt 103 83 86 140 168 199 187 171 156 152 149 145 141 138 121
Maize $/mt 164 113 99 165 237 247 236 215 195 190 185 181 176 172 150
Rice, Thai, 5% $/mt 539 280 227 433 441 467 440 414 391 382 374 366 358 350 314
Wheat, US, HRW $/mt 227 140 128 198 257 260 260 239 211 208 204 201 198 195 180
Other Food
Bananas US $/mt 495 559 475 769 787 816 798 773 743 727 712 697 683 669 601
Meat, beef ¢/kg 362 265 216 297 329 343 334 287 246 248 249 251 252 254 255
Meat, chicken ¢/kg 99 112 147 168 157 172 164 160 158 155 153 151 148 146 134
Oranges $/mt 525 549 407 915 724 720 688 685 704 693 683 674 664 655 608
Shrimp ¢/kg 1,511 1,106 1,696 889 970 834 818 825 860 852 845 837 830 823 784
Sugar, world ¢/kg 82.9 28.6 20.2 41.6 46.6 39.4 36.6 31.9 29.7 28.9 28.2 27.5 26.8 26.1 22.9
Agricultural Raw Materials
Timber
Logs, Cameroonian $/cum 330 355 308 379 394 374 366 364 364 363 363 362 362 361 350
Logs, Malaysian $/cum 257 183 213 246 317 299 290 288 288 287 287 287 286 286 278
Sawnwood, Malaysian $/cum 520 551 666 751 764 727 712 705 705 706 707 708 709 715 706
Other Raw Materials
Cotton A Index ¢/kg 271 188 146 202 271 163 147 151 156 157 158 159 159 160 163
Rubber, Malaysian ¢/kg 187 89 75 324 392 280 269 259 250 244 238 233 227 222 196
Tobacco $/mt 2,986 3,508 3,332 3,837 3,646 3,560 3,419 3,267 3,127 3,079 3,033 2,987 2,942 2,897 2,679
Fertilizers
DAP $/mt 292 177 173 443 503 447 407 390 375 367 359 351 344 336 301
Phosphate rock $/mt 61 42 49 109 150 154 142 127 117 111 105 100 95 90 69
Pottasium chloride $/mt 152 101 137 294 354 380 350 327 297 288 279 270 262 253 216
TSP $/mt 237 136 154 338 438 383 350 339 328 318 309 300 291 282 242
Urea $/mt 252 123 113 256 342 336 317 295 274 265 256 248 240 232 196
Metals and Minerals
Aluminum $/mt 2,329 1,695 1,734 1,924 1,952 1,677 1,791 1,912 1,954 1,948 1,943 1,937 1,932 1,926 1,895
Copper $/mt 2,863 2,752 2,030 6,672 7,177 6,601 6,349 5,896 5,472 5,359 5,250 5,144 5,039 4,936 4,444
Iron ore ¢/dmtu 37 34 32 129 136 107 106 105 106 105 104 103 103 102 98
Lead ¢/kg 119 84 51 190 195 171 171 171 172 170 167 165 163 161 150
Nickel $/mt 8,553 9,167 9,669 19,312 18,625 14,548 14,651 14,501 14,463 14,549 14,640 14,733 14,825 14,916 15,357
Tin ¢/kg 2,201 629 608 1,807 2,118 1,751 1,791 1,793 1,798 1,801 1,805 1,808 1,812 1,815 1,830
Zinc ¢/kg 100 157 126 191 178 162 171 175 180 178 176 175 173 172 163
Metals and Minerals
Gold $/toz 798 397 312 1,084 1,276 1,384 1,302 1,235 1,173 1,135 1,100 1,065 1,032 999 850
Silver c/toz 2,730 500 554 1,785 2,864 2,581 2,523 2,350 2,189 2,126 2,065 2,006 1,949 1,893 1,634
Platinum $/toz 891 488 610 1,425 1,398 1,286 1,257 1,171 1,090 1,059 1,029 999 971 943 814
a/ iron ore unit for years 1980 to 2005 is cents/ dmtu, thereafter is $/dmt.
Source: World Bank, Development Prospects Group.
Table A3. Commodity Prices and Price Forecast in Real 2005 US Dollars
23

Actual Projection
1980 1990 2000 2010 2011 2012 2013 2014 2015 2016 2017 2018 2019 2020 2025
Price indices in nominal US dollars
Energy 66.0 43.4 53.2 144.7 188.2 187.4 182.6 182.8 182.8 182.8 182.7 182.5 182.4 182.3 183.4
Non-energy commodities 102.2 84.0 72.2 173.9 209.9 190.0 186.2 180.4 175.4 175.6 175.7 175.9 176.2 176.5 177.7
Agriculture 119.6 90.5 78.7 170.4 209.0 194.0 187.8 179.6 173.2 173.1 173.0 173.0 173.0 173.1 172.7
Beverages 157.7 90.5 76.8 182.1 208.2 166.2 158.4 155.3 153.3 153.1 152.9 152.8 152.6 152.4 151.7
Food 124.6 90.6 76.6 169.6 210.1 211.6 204.8 191.7 181.3 180.5 179.8 179.1 178.4 177.7 174.0
Fats and oils 120.4 82.3 76.6 184.5 222.7 230.0 220.5 206.0 196.0 194.6 193.3 191.9 190.6 189.3 182.8
Grains 126.8 99.4 79.9 171.8 238.5 244.2 239.0 224.7 208.8 207.7 206.7 205.6 204.6 203.6 198.6
Other food 128.0 93.6 73.8 148.2 167.8 157.9 153.1 143.0 137.0 137.4 137.8 138.1 138.6 139.0 140.2
Raw materials 88.0 90.2 84.7 166.3 206.7 165.3 161.7 162.4 163.5 165.1 166.7 168.4 170.1 172.4 180.1
Timber 68.1 82.3 90.9 130.5 153.5 142.7 142.1 143.9 146.6 149.3 152.1 154.9 157.8 161.6 173.8
Other Raw Materials 109.9 98.9 77.9 205.4 264.8 189.9 183.1 182.6 182.0 182.4 182.8 183.2 183.6 184.1 186.9
Fertilizers 89.1 65.4 67.0 187.2 267.0 259.2 244.8 231.9 219.8 215.4 211.2 207.0 203.0 199.0 180.6
Metals and minerals a/ 68.1 72.8 59.5 179.6 205.5 174.0 176.3 176.1 174.9 176.1 177.3 178.5 179.8 181.0 187.7
Base Metals b/ 73.9 78.1 63.0 169.2 193.2 168.6 170.8 169.9 167.3 168.2 169.2 170.2 171.2 172.2 177.7
Precious Metals 162.7 81.3 63.6 272.2 371.9 378.3 378.3 352.8 339.9 335.3 330.8 326.3 321.9 317.5 296.6
Price indices in real 2005 US dollars c/
Energy 86.6 44.9 59.5 128.1 153.0 155.4 148.7 145.6 142.9 140.4 137.8 135.3 132.8 130.4 119.9
Non-energy commodities 134.1 86.9 80.8 154.0 170.7 157.5 151.6 143.7 137.1 134.8 132.6 130.4 128.3 126.3 116.1
Agriculture 156.9 93.6 88.1 150.9 169.9 160.8 152.9 143.1 135.4 132.9 130.5 128.2 125.9 123.8 112.8
Beverages 207.0 93.6 86.0 161.3 169.3 137.8 128.9 123.7 119.8 117.6 115.4 113.2 111.1 109.0 99.1
Food 163.4 93.7 85.8 150.2 170.8 175.4 166.7 152.7 141.7 138.6 135.6 132.7 129.9 127.1 113.7
Fats and oils 158.0 85.1 85.7 163.4 181.1 190.7 179.4 164.1 153.2 149.5 145.8 142.3 138.8 135.4 119.5
Grains 166.4 102.8 89.5 152.1 193.9 202.4 194.5 179.0 163.2 159.5 155.9 152.4 149.0 145.7 129.8
Other food 167.9 96.8 82.6 131.2 136.4 130.9 124.6 113.9 107.1 105.5 103.9 102.4 100.9 99.4 91.6
Raw materials 115.5 93.3 94.8 147.2 168.0 137.0 131.6 129.4 127.8 126.8 125.8 124.8 123.9 123.3 117.7
Timber 89.3 85.1 101.8 115.5 124.8 118.3 115.7 114.7 114.6 114.7 114.7 114.8 114.9 115.6 113.6
Other Raw Materials 144.2 102.2 87.2 181.9 215.3 157.4 149.1 145.5 142.3 140.0 137.9 135.8 133.7 131.7 122.1
Fertilizers 116.9 67.7 75.1 165.7 217.0 214.9 199.3 184.8 171.8 165.4 159.3 153.4 147.8 142.4 118.0
Metals and minerals a/ 89.4 75.3 66.6 159.1 167.0 144.3 143.5 140.3 136.7 135.2 133.7 132.3 130.9 129.5 122.7
Base Metals b/ 97.0 80.8 70.6 149.8 157.1 139.7 139.0 135.3 130.8 129.2 127.6 126.1 124.7 123.2 116.1
Precious Metals 213.4 84.1 71.2 241.1 302.4 313.6 307.9 281.1 265.8 257.5 249.5 241.9 234.4 227.2 193.9
Inflation indices, 2005=100 d/
MUV index e/ 76.2 96.7 89.3 112.9 123.0 120.6 122.9 125.5 127.9 130.2 132.6 134.9 137.3 139.8 153.0
% change per annum 2.4 -0.8 2.4 8.9 -1.9 1.9 2.2 1.9 1.8 1.8 1.8 1.8 1.8 1.8
US GDP deflator 47.8 72.3 88.7 111.0 113.4 115.5 117.0 119.5 122.1 124.7 127.4 130.2 133.0 135.9 151.3
% change per annum 4.2 2.1 2.3 2.1 1.9 1.3 2.2 2.2 2.2 2.2 2.2 2.2 2.2 2.2
a/ Base metals plus iron ore.
b/ Includes aluminum, copper, lead, nickel, tin and zinc.
c/ Real price indices are computed from unrounded data and deflated by the MUV index.
d/ Inflation indices for 2011-2025 are projections. Growth rates for years 1990, 2000 and 2010 refer to compound annual rate of change between adjacent end-point years;
all others are annual growth rates from the previous year.
e/ Unit value index of manufacture exports (MUV) in US dollar terms for fifteen countries (Brazil, Canada, China, Germany, France, India, Italy, Japan, Mexico, Republic of Korea,
South Africa, Spain, Thailand, United Kingdom, and United States).
Please see the MUV Index and its compilation methodology online.
Source: World Bank, Development Prospects Group. Historical US GDP deflator: US Department of Commerce.
Table A4. Weighted Indices of Commodity Prices and Inflation, 2005=100
24
Description of price series
Coal (Australia), thermal, f.o.b. piers, Newcastle/
Port Kembla, 6,700 kcal/kg, 90 days forward de-
livery beginning year 2011; for period 2002-
2010, 6,300 kcal/kg (11,340 btu/lb); prior to year
2002, 6,667 kcal/kg (12,000 btu/lb).
Coal (Colombia), thermal, f.o.b. Bolivar, 6,450
kcal/kg, (11,200 btu/lb) ; during years 2002-July
2005 11,600 btu/lb, less than .8% sulfur, 9% ash ,
90 days forward delivery
Coal (South Africa), thermal, f.o.b. Richards Bay,
90 days forward delivery; 6,000 kcal/kg, during
2002-2005, 6,200 kcal/kg (11,200 btu/lb); during
1990-2001 6390 kcal/kg (11,500 btu/lb)
Crude oil, average price of Brent, Dubai and
West Texas Intermediate, equally weighed.
Crude oil, U.K. Brent 38` API.
Crude oil, Dubai Fateh 32` API.
Crude oil, West Texas Intermediate (WTI) 40`
API.
Natural Gas Index (Laspeyres), weights based on
5-year consumption volumes for Europe, US and
Japan (LNG), updated every 5 years, except the
11-year period 1960-70.
Natural Gas (Europe), average import border
price, including UK. As of April 2010 includes a
spot price component. Between June 2000 -
March 2010 excludes UK.
Natural Gas (U.S.), spot price at Henry Hub,
Louisiana.
Natural gas LNG (Japan), import price, cif, recent
two months' averages are estimates.
Cocoa (ICCO), International Cocoa Organization
daily price, average of the first three positions on
the terminal markets of New York and London,
nearest three future trading months.
Coffee (ICO), International Coffee Organization
indicator price, other mild Arabicas, average New
York and Bremen/Hamburg markets, ex-dock.
Coffee (ICO), International Coffee Organiza-
tion indicator price, Robustas, average New
York and Le Havre/Marseilles markets, ex-
dock.
Tea , average three auctions, arithmetic average
of quotations at Kolkata, Colombo and Mom-
basa/Nairobi.
Tea (Colombo auctions), Sri Lankan origin, all
tea, arithmetic average of weekly quotes.
Tea (Kolkata auctions), leaf, include excise duty,
arithmetic average of weekly quotes.
Tea (Mombasa/Nairobi auctions), African origin,
all tea, arithmetic average of weekly quotes.
Coconut oil (Philippines/Indonesia), bulk, c.i.f.
Rotterdam.
Copra (Philippines/Indonesia), bulk, c.i.f. N.W.
Europe.
Groundnuts (US), Runners 40/50, shelled basis,
c.i.f. Rotterdam
Groundnut oil (any origin), c.i.f. Rotterdam.
Palm oil (Malaysia), 5% bulk, c.i.f. N. W.
Europe.
Palmkernel Oil (Malaysia), c.I.f. Rotterdam.
Soybean meal (any origin), Argentine 45/46%
extraction, c.i.f. Rotterdam beginning 1990; pre-
viously US 44%.
Soybean oil (Any origin), crude, f.o.b. ex-mill
Netherlands.
Soybeans (US), c.i.f. Rotterdam.
Barley (US) feed, No. 2, spot, 20 days To-
Arrive, delivered Minneapolis from May 2012
onwards; during 1980 - 2012 April Canadian,
feed, Western No. 1, Winnipeg Commodity Ex-
change, spot, wholesale farmers' price
Maize (US), no. 2, yellow, f.o.b. US Gulf ports.
Rice (Thailand), 5% broken, white rice (WR),
milled, indicative price based on weekly sur-
25

veys of export transactions, government stan-
dard, f.o.b. Bangkok.
Rice (Thailand), 25% broken, WR, milled in-
dicative survey price, government standard,
f.o.b. Bangkok.
Rice (Thailand), 100% broken, A.1 Super from
2006 onwards, government standard, f.o.b.
Bangkok; prior to 2006, A1 Special, a slightly
lower grade than A1 Super.
Rice (Vietnam), 5% broken, WR, milled, weekly
indicative survey price, Minimum Export Price,
f.o.b. Hanoi.
Sorghum (US), no. 2 milo yellow, f.o.b. Gulf
ports.
Wheat (Canada), no. 1, Western Red Spring
(CWRS), in store, St. Lawrence, export price.
Wheat (US), no. 1, hard red winter, ordinary pro-
tein, export price delivered at the US Gulf port
for prompt or 30 days shipment.
Wheat (US), no. 2, soft red winter, export price
delivered at the US Gulf port for prompt or 30
days shipment.
Bananas (Central & South America), major
brands, free on truck (f.o.t.) Southern Europe,
including duties; prior to October 2006, f.o.t.
Hamburg.
Bananas (Central & South America), major
brands, US import price, f.o.t. US Gulf ports.
Fishmeal (any origin), 64-65%, c&f Bremen,
estimates based on wholesale price, beginning
2004; previously c&f Hamburg.
Meat, beef (Australia/New Zealand), chucks and
cow forequarters, frozen boneless, 85% chemi-
cal lean, c.i.f. U.S. port (East Coast), ex-dock,
beginning November 2002; previously cow
forequarters.
Meat, chicken (US), broiler/fryer, whole birds, 2
-1/2 to 3 pounds, USDA grade "A", ice-packed,
Georgia Dock preliminary weighted average,
wholesale.
Meat, sheep (New Zealand), frozen whole car-
casses Prime Medium (PM) wholesale, Smith-
field, London beginning January 2006; previ-
ously Prime Light (PL).
Oranges (Mediterranean exporters) navel, EEC
indicative import price, c.i.f. Paris.
Shrimp , (Mexico), west coast, frozen, white,
No. 1, shell-on, headless, 26 to 30 count per
pound, wholesale price at New York.
Sugar (EU), European Union negotiated import
price for raw unpackaged sugar from African,
Caribbean and Pacific (ACP) under Lome Con-
ventions, c.I.f. European ports.
Sugar (US), nearby futures contract, c.i.f.
Sugar (world), International Sugar Agreement
(ISA) daily price, raw, f.o.b. and stowed at
greater Caribbean ports.
26