published by aaas a. d. anbar et al., science 297, 1137 -1142 (2002) fig. 1. during the archean,...
TRANSCRIPT

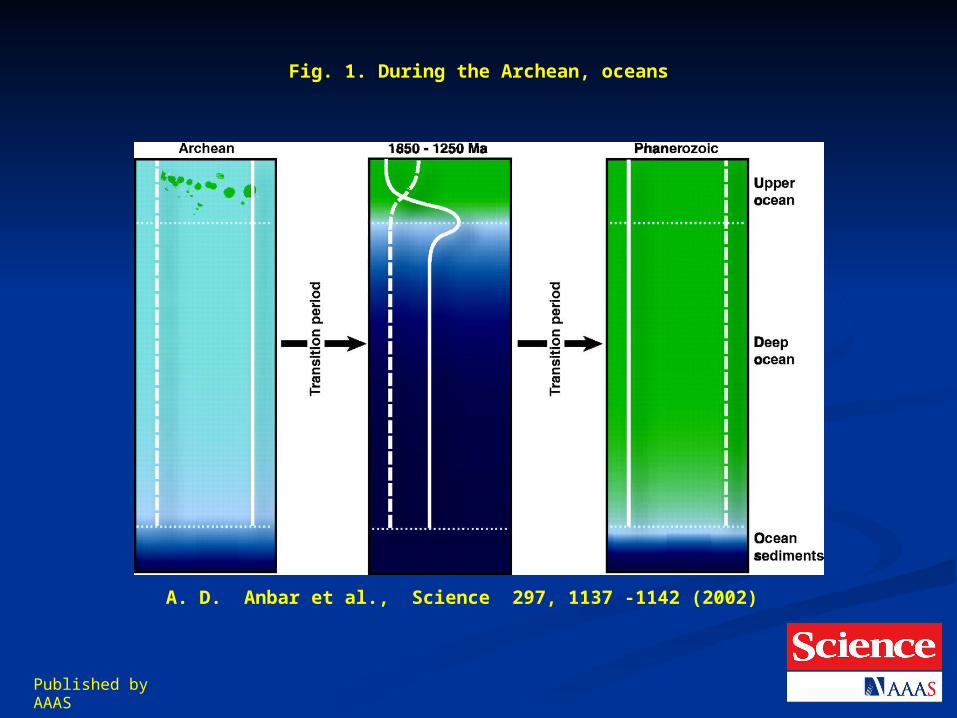
Published by AAAS
A. D. Anbar et al., Science 297, 1137 -1142 (2002)
Fig. 1. During the Archean, oceans

Basic Basic Premises/HypothesisPremises/Hypothesis
1.1. In the first ca. 2.5 Ga of Earth’s In the first ca. 2.5 Ga of Earth’s history, nature invested heavily in history, nature invested heavily in R&D from which a “core” set of R&D from which a “core” set of metabolic machines that evolved. metabolic machines that evolved.
2.2. There are approximately 1500 There are approximately 1500 core metabolic genes that make core metabolic genes that make the world go aroundthe world go around
3.3. This period of “metabolic This period of “metabolic innovation” is characterized by innovation” is characterized by machinery that has been retained machinery that has been retained virtually without change to the virtually without change to the present time (“frozen metabolic present time (“frozen metabolic accidents”). accidents”).
4.4. All of the key metabolic processes All of the key metabolic processes were developed in prokaryoteswere developed in prokaryotes

5. These metabolic sequences are 5. These metabolic sequences are coupled on local and planetary coupled on local and planetary scales to facilitate an electron scales to facilitate an electron market between C, N, O, and S. market between C, N, O, and S.
6. 6. Most of the metabolic sequences Most of the metabolic sequences were rapidly appropriated by a were rapidly appropriated by a large number of groups of large number of groups of microbes – and some (not all) microbes – and some (not all) subsequently were subsumed into subsequently were subsumed into eukaryotic lineages via primary eukaryotic lineages via primary and secondary symbioses.and secondary symbioses.
7. The eukaryotes derived secondary 7. The eukaryotes derived secondary metabolic adapations during the metabolic adapations during the 22ndnd half of Earth’s history – the era half of Earth’s history – the era of “metabolic adaptation”, but of “metabolic adaptation”, but did not invent any new did not invent any new fundamental process.fundamental process.
8. However, the dispersal of the 8. However, the dispersal of the core metabolic processes to core metabolic processes to large numbers of widely large numbers of widely differing taxa helped to ensure differing taxa helped to ensure their continuity (resiliance).their continuity (resiliance).
9. All these metabolic 9. All these metabolic sequences are observable in sequences are observable in the modern world – but many the modern world – but many are extremely “inefficient”.are extremely “inefficient”.
10. Despite these 10. Despite these inefficiencies, alternatives have inefficiencies, alternatives have not been selected. Why not?not been selected. Why not?

H2 or C-mediated
Photosynthesis
O2
Mn4+
NO3-
N2
Fe3+
SO42-
CO2
H2O
Mn2+ NH4+ Fe2+ HS- CH4 H2 [CH2O]
+CO2
Respiration
O2-mediated
Mn -mediated
Fe-mediated
S-mediated
N-mediated
N2-fixation
Falkowski, Fenchel and Delong, Science, 2008

Three examples of Three examples of frozen metabolic frozen metabolic
accidentsaccidentsCarbon fixation (C)- RubiscoCarbon fixation (C)- RubiscoNitrogen fixation (N) - Nitrogen fixation (N) -
NitrogenaseNitrogenaseOxygen evolution (O)- The Oxygen evolution (O)- The
reaction center of reaction center of Photosystem IIPhotosystem II

Example 1: Example 1: Carbon Fixation Carbon Fixation
and the and the evolution of evolution of
RuBisCORuBisCO

UniversalAncestor
Bacteria
Archaea
Eukarya
Pyrodictium
Thermoproteus Thermococcus
Methanococcus
MethanobacteriumHalobacterium
Thermoplasma
Methanopyrus
Aquifex
Thermotoga
Flavobacteria
Cyanobacteria
Proteobacteria
Gram -Positive Bacteria EntamoebaeSlime Molds
Animals
Fungi
Plants
Ciliates
MicrosporidiaDiplomonads
Archaeoglobus
Green Non -Sulfur Bacteria
Pathways of autotrophic CO2
fixation
Reductive citr ic acid cycle
Reductive acetyl CoA pathway
Reductive hydroxypropionate pathway
Calvin -Benson cycle
SulfolobusEuglena
THREE DOMAINS OF LIFE

RUBisCORUBisCO


Rubisco arose from a methionine Rubisco arose from a methionine “salavge” pathway long before it was “salavge” pathway long before it was appropriated for use in the Calvin-appropriated for use in the Calvin-Benson cycle.Benson cycle.
The enzyme is catalytically challenged, The enzyme is catalytically challenged, and can barely figure out what its and can barely figure out what its substrate looks like (blind and slow). substrate looks like (blind and slow).
In an oxygen rich world Rubisco is In an oxygen rich world Rubisco is notoriously inefficient (dumb).notoriously inefficient (dumb).
However, there is very little selection However, there is very little selection pressure on Rubisco active sites. Why pressure on Rubisco active sites. Why not?not?

Remove the selection Remove the selection pressurepressure
Cells can make a lot of Rubisco – Cells can make a lot of Rubisco – but don’t reinvent the technology but don’t reinvent the technology (hire lots of dumb, blind, slow (hire lots of dumb, blind, slow workers), orworkers), or
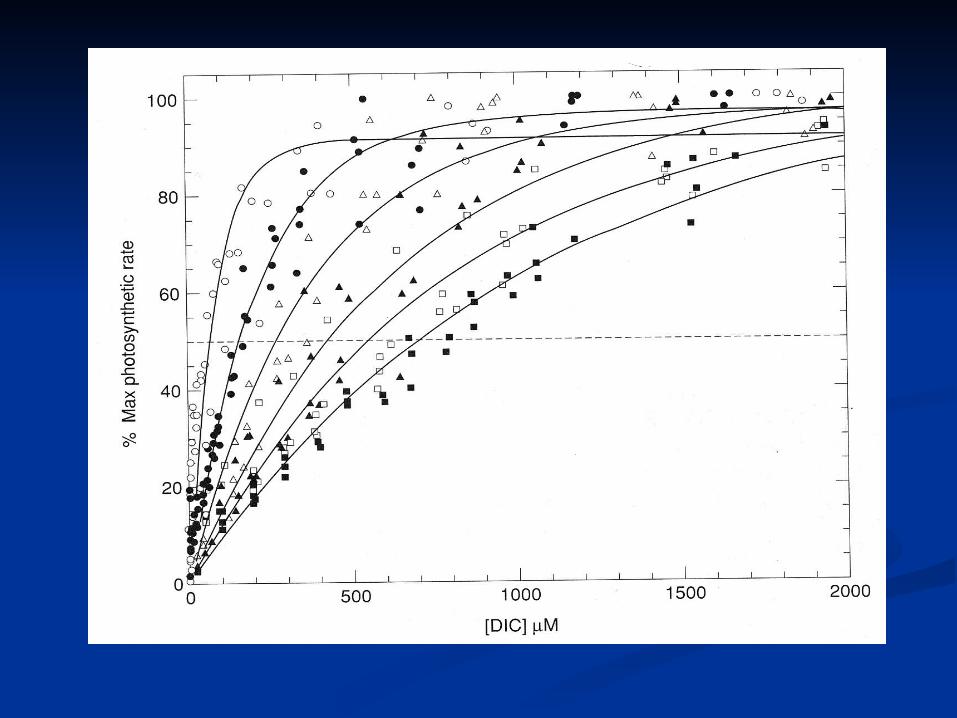
They developed a secondary set of They developed a secondary set of adaptations that removed or reduce adaptations that removed or reduce the selection pressure – e.g., the the selection pressure – e.g., the Carbon Concentrating MechanismCarbon Concentrating Mechanism
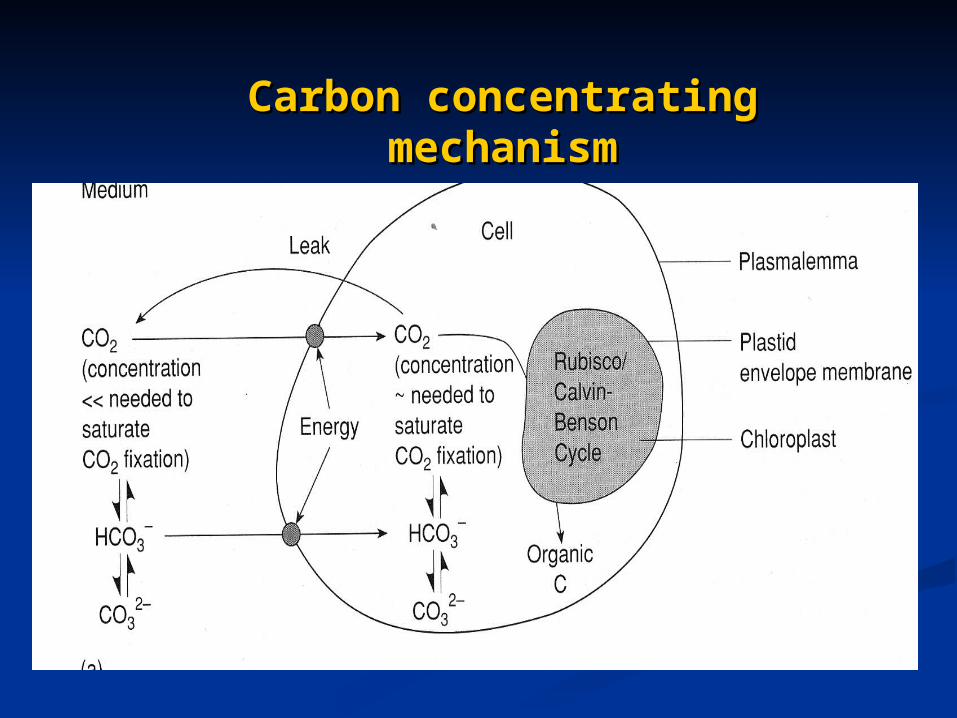
Carbon concentrating Carbon concentrating mechanismmechanism

Example 2: NitrogenaseExample 2: Nitrogenase
A detour into the rise of oxygen the A detour into the rise of oxygen the coupling between C,N and O cycles on coupling between C,N and O cycles on EarthEarth
2N2 + 4H+ + 3CH2O 4NH4+ + 3CO2
A 6 electron transfer reaction

NitrogenaseNitrogenase

The Biological Nitrogen Cycle

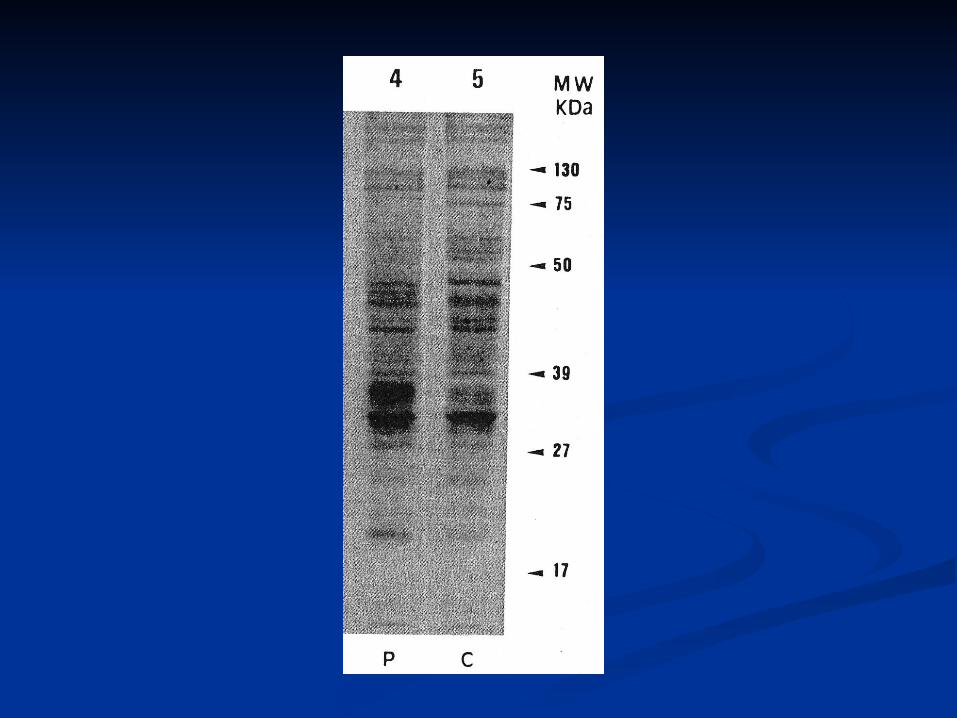
1G20 -- Nitrogenase MoFe protein only
Fe7MoS9
Fe8S7Fe7MoS9
Fe8S7

DigressionDigression
Evolution of core structural motifsEvolution of core structural motifs The paradox of structure/sequence The paradox of structure/sequence
divergencedivergence
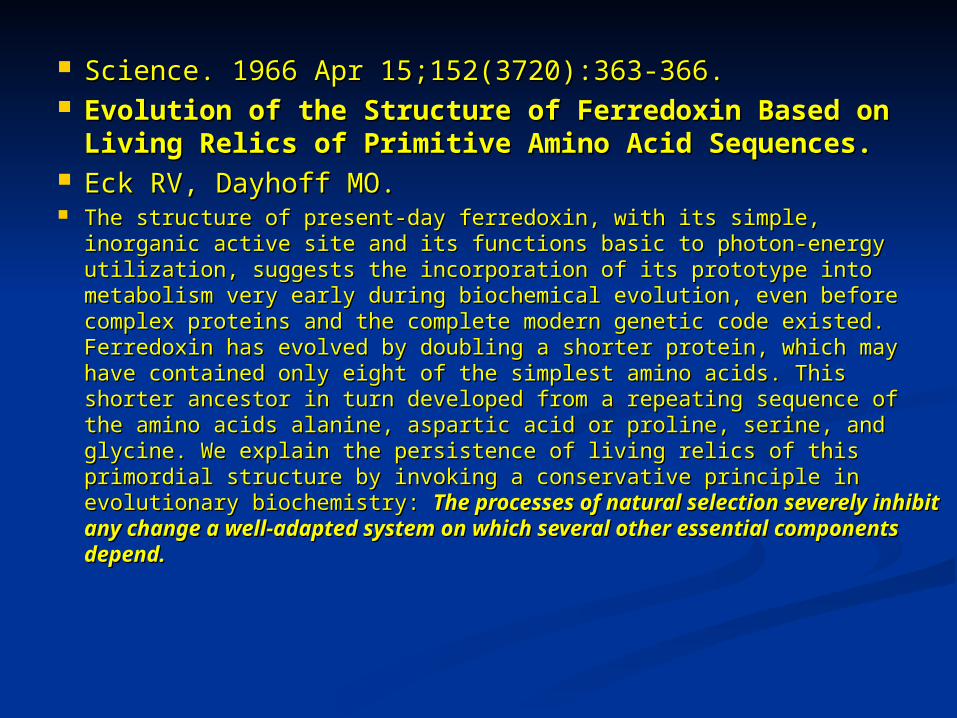
Science. 1966 Apr 15;152(3720):363‐366.Science. 1966 Apr 15;152(3720):363‐366. Evolution of the Structure of Ferredoxin Based on Evolution of the Structure of Ferredoxin Based on
Living Relics of Primitive Amino Acid Sequences.Living Relics of Primitive Amino Acid Sequences. Eck RV, Dayhoff MO.Eck RV, Dayhoff MO. The structure of present‐day ferredoxin, with its simple, inorganic active The structure of present‐day ferredoxin, with its simple, inorganic active
site and its functions basic to photon‐energy utilization, suggests the site and its functions basic to photon‐energy utilization, suggests the incorporation of its prototype into metabolism very early during incorporation of its prototype into metabolism very early during biochemical evolution, even before complex proteins and the complete biochemical evolution, even before complex proteins and the complete modern genetic code existed. Ferredoxin has evolved by doubling a modern genetic code existed. Ferredoxin has evolved by doubling a shorter protein, which may have contained only eight of the simplest shorter protein, which may have contained only eight of the simplest amino acids. This shorter ancestor in turn developed from a repeating amino acids. This shorter ancestor in turn developed from a repeating sequence of the amino acids alanine, aspartic acid or proline, serine, sequence of the amino acids alanine, aspartic acid or proline, serine, and glycine. We explain the persistence of living relics of this primordial and glycine. We explain the persistence of living relics of this primordial structure by invoking a conservative principle in evolutionary structure by invoking a conservative principle in evolutionary biochemistry: biochemistry: The processes of natural selection severely inhibit The processes of natural selection severely inhibit any change a well‐adapted system on which several other any change a well‐adapted system on which several other essential components depend.essential components depend.

1FXR – Ferredoxin I from Desulfovibrio 1FXR – Ferredoxin I from Desulfovibrio AfricanusAfricanus
Ferredoxin protein with Fe4S4 clusterFerredoxin protein with Fe4S4 cluster
Image Courtesy: Dr. Vikas Nanda Image Courtesy: Dr. Vikas Nanda (UMDNJ)(UMDNJ)
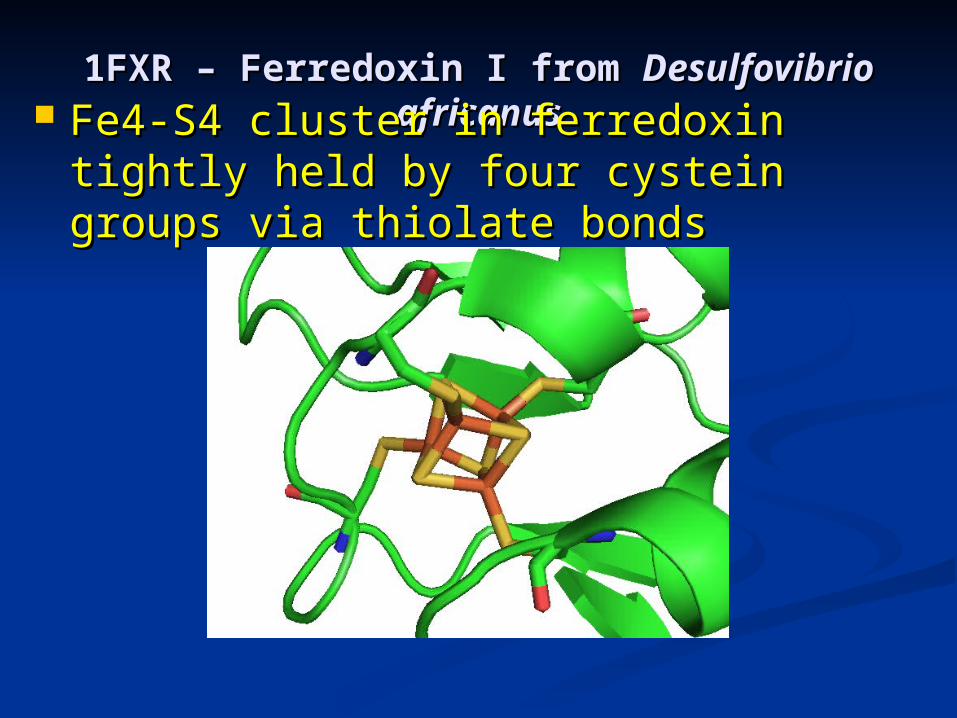
1FXR – Ferredoxin I from 1FXR – Ferredoxin I from Desulfovibrio Desulfovibrio africanusafricanus Fe4-S4 cluster in ferredoxin tightly Fe4-S4 cluster in ferredoxin tightly
held by four cystein groups via thiolate held by four cystein groups via thiolate bondsbonds

Beta carbon distribution (385 Beta carbon distribution (385 structures)structures)
385 Structures from Protein Data Bank385 Structures from Protein Data Bank

22 High Potential Iron Proteins (amide)22 High Potential Iron Proteins (amide)
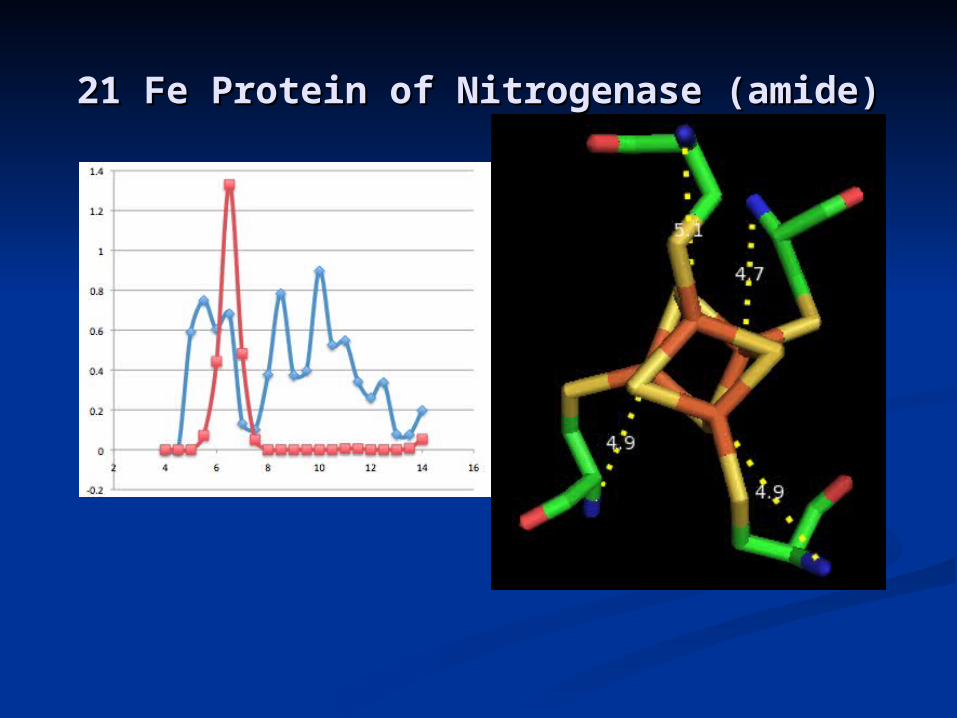
21 Fe Protein of Nitrogenase (amide)21 Fe Protein of Nitrogenase (amide)

HiPIP and Fe NitrogenaseHiPIP and Fe Nitrogenase NN
Number of Cysteine peaks….Signature of different environment for different redox potential?
HPiP
Fe Nitrogenase

High potential protein vs Fe protein of High potential protein vs Fe protein of Nitrogenase (cont’d)Nitrogenase (cont’d)
-number of CYS peaks-Hydrophilic group contrast
HPiP
Fe Nitrogenase
Signature of different environment for different redox potential?

The basic FeS bindingThe basic FeS binding ~ 30% of all FeS clusters are bound to a ~ 30% of all FeS clusters are bound to a
C XX C XX(X) C motif with a final C in a C XX C XX(X) C motif with a final C in a variable position further along the protein.variable position further along the protein.
The most common X residues are neutral The most common X residues are neutral aa’s (especially A, L and I).aa’s (especially A, L and I).
These motifs are virtually all chiral!These motifs are virtually all chiral!

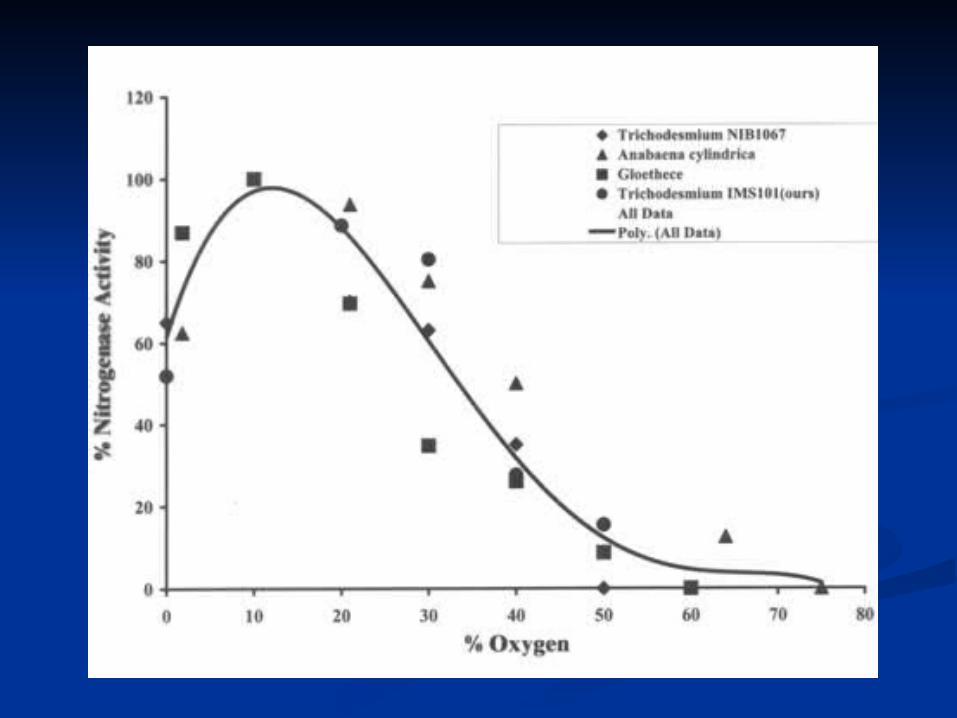
Chronically Crippled Chronically Crippled NitrogenaseNitrogenase

Example 3: The oxygen Example 3: The oxygen evolving complex and evolving complex and
the evolution of the evolution of Photosystem IIPhotosystem II

Example 3: The oxygen Example 3: The oxygen evolving complex and evolving complex and
the evolution of the evolution of Photosystem IIPhotosystem II


PSII type Reaction PSII type Reaction CenterCenter

The Mn cluster The Mn cluster in PS IIin PS II

All oxygenic photosythetic organisms All oxygenic photosythetic organisms share common centers.share common centers.
The protein, D1, in photosystem II was The protein, D1, in photosystem II was inherited from purple sulfur bacteria. inherited from purple sulfur bacteria.
In all oxygenic organisms this protein In all oxygenic organisms this protein is damaged and replaced (not simply is damaged and replaced (not simply repaired) every 30 min during the day.repaired) every 30 min during the day.
Despite this inefficiency, there is Despite this inefficiency, there is almost no change in the primary almost no change in the primary sequence of this protein for the past 3 sequence of this protein for the past 3 Ga (86% identity at the aa level) Ga (86% identity at the aa level)
Lesson learned: If it works, keep Lesson learned: If it works, keep using the old technology. Just pay the using the old technology. Just pay the costs and fix the machinery.costs and fix the machinery.

Hypothesis: Hypothesis: The core metabolic machines are The core metabolic machines are usually multimeric protein complexes usually multimeric protein complexes that bind prostetic groups. The that bind prostetic groups. The tempo of evolution of the core tempo of evolution of the core complexes is constrained by protein-complexes is constrained by protein-protein interactions. protein interactions. The “Rubic cube paradox” – Don’t The “Rubic cube paradox” – Don’t mess with it unless you know how to mess with it unless you know how to get the thing back to the original get the thing back to the original configuration.configuration.
Why doesn’t this core Why doesn’t this core metabolic machinery metabolic machinery
improve with age?improve with age?

Photosynthetic gene clusters in Photosynthetic gene clusters in cyanobacteriacyanobacteria
C K J
ndh
B D
pet
E G I A
ndh
L N
chl
D F
ndh
B A C
cox
A B
psa pet
A C
psb
C D BD
crtpsb
A B
psapsb
CD
psb
N L
chl
BAC
cox
N L
chlpsb
CD
EGIA
ndh
F D
ndh pet
A C CKJ
ndh
B D
pet
B A C
cox
BD
crt
EGIA
ndh
B D
petpsa
A BD F
ndh psbpet
AC B D
crt
B A C
coxpsb
C D BD
pet
N B L
chl pet
AC
psbpsa
B A B D
crt
DF
ndh
E G I A
ndh
C K J
ndh
B D
crt
DF
ndh
E G I A
ndh
CKJ
ndhpsa
B A
psb
B D
pet pet
A C L B N
chl
AC
cox
B
psb
CD
BD
pet psa
B A CKJ
ndh psb
B D
crt psb
CD N B L
chl pet
ACDF
ndh
E G I A
ndh
C
cox
AB
1 kbSynechocystis sp. PCC6803
Anabaena sp. PCC7120
Thermosynechococcus elongatus BP-1
Synechococcus sp. WH8102
Prochlorococcus marinus MED4
Prochlorococcus marinus MIT9313
EFLJ
EFLJ
JLFE
EFLJ
EFLJ
EFLJ

PS II PS Ib6f
D1 D2
CP47 CP43 BA
QB
PQH2
P700
PC
Fd
PC
H2O O2+2H+
PQ
2H+ 2H+
2H+
ISP f
b6IV
V P'
4H+
P680
21
βα
ε
ab
b'
CF1
CF0e−
A0
A1
Fx
FA|FB
YZ
e−
Phe
QA
e−
bHci
e−
e−
e−
f
O
γ
δ
ndh
NAD++H+NADH
Cyt co
orCytc553
Cytc553
or
A
B C
NADPHNADP + H+
C6H12O6
L S
Rubisco
e−
FNR
APPC
PE
A
O2+2H+2
1 H2O
2H+
H+
B
PQH2
e−
bL
Photosystem II Cytoxhrome b6f complex
NADH dehydrogenase
Photosystem ICytoxhrome oxidase
Phycobilisome
ATP synthase
C D
Protein-protein interactions in linked photosystems revealed by the co-evolutionary analysis. Red lines represent predicted interactions with coefficient values better than 0.8. Also shown is a network of protein-protein interactions in the ATPase complex. The pattern of protein-protein interactions strongly suggests co-evolution of photosynthetic genes driven by electron transport and redox state of the primary photochemistry. Black arrows, electron transfer; blue arrows, proton transfer.

So how can such So how can such apparently inefficient apparently inefficient
machinery be both machinery be both robust and resilient?robust and resilient?
Spread the risk (The “Microsoft” Spread the risk (The “Microsoft” approach)approach)
Select secondary adaptive Select secondary adaptive featuresfeatures


Rhodophyta
Glauco-cystophytaCyanophora
ChlorophytaEuglenophyta
Euglena
CryptophytaGuillardia
BacillariophytaOdontella
atpIcemAminDodpB
accAaccBargB bas1carA clpCcpcGcpeAcpeBdnaBdfrdsbDfabHfdxftrBftsH
acpPapcAapcBapcDapcEapcF atpDatpGcpcAcpcB dnaKgroELhisHpetFpetMpreA psaEpsaF
cysAcysTftsWinfAminDndhA-IndhKPorphyra
Cyanidium
clpPftsW psbMrbcLg
chlNcpcAcpcBcpcGdfrglnBgltBhisHinfCnblA
cemAcpeBftrBilvBilvHinfBminDpbsApsaKrnetsf
thiGbas1
accAaccBaccDapcAapcBapcDapcEapcFargBcarA
glnBgltBilvBilvHinfBinfCmoeBnblAntcAodpApbsApetJpgmApsaDpsaKpsaLrbcLr
accDccsAcemAchlBchlLchlNclpP
chlBchlLcpeAdsbDfabHfdxmoeB
ndhJ odpBrpl33rps15rps16
Ancestralphotosynthetic
prokaryote
> 90% of genes lost
ntcAodpAodpBpetJpreArpl28trpAtrpGtrxA
Streptophyta
Secondary endosymbiosis
psbVpsbWpsbXrbcRrpl1rpl3rpl6 rpl11 rpl18rpl28rpl34rpl35rps5rps6rps10rps13rps17rps20secYtrpG
rnerpl23rpl32
Mesostigma
NephroselmisChlorella psbM
petApetDpetLpsaIrnerpl19rpoA
Secondary endosymbiosis
Primary endosymbiosis
bas1 cpeBinfBminDpbsApsbXrps20
hisHminD
accD
rpl22
psaM
rbcSr rpl4rpl9rpl13rpl24rpl27rpl29rpl31rps1secAsyfBsyhthiGtrpAtrxAtsfupp
chlIftsWminDodpBrne rpl5rpl12rpl19rps9tufA
rpl21
ftsW ndhA-IndhK
pgmArpl9rps1syfBsyhupp
cystAcystT infAndhA-Krps15 bioY
crtEgroEShemAmntAmntBnadArbcSg
Marchantia
Pinus
Nicotiana
Zea
Oryza
cysA, cysTrpl21, ndhA-K
accD
rps16
cysA, cysT, rpl21chlB,L,N, psaM
0
0.1
0.2
0.3
0.4
0.5
0.6
0.7
0.8
0.9
1
1.1
1.2
mut
atio
n ra
te (s
ubst
itut
ion/
site
/OT
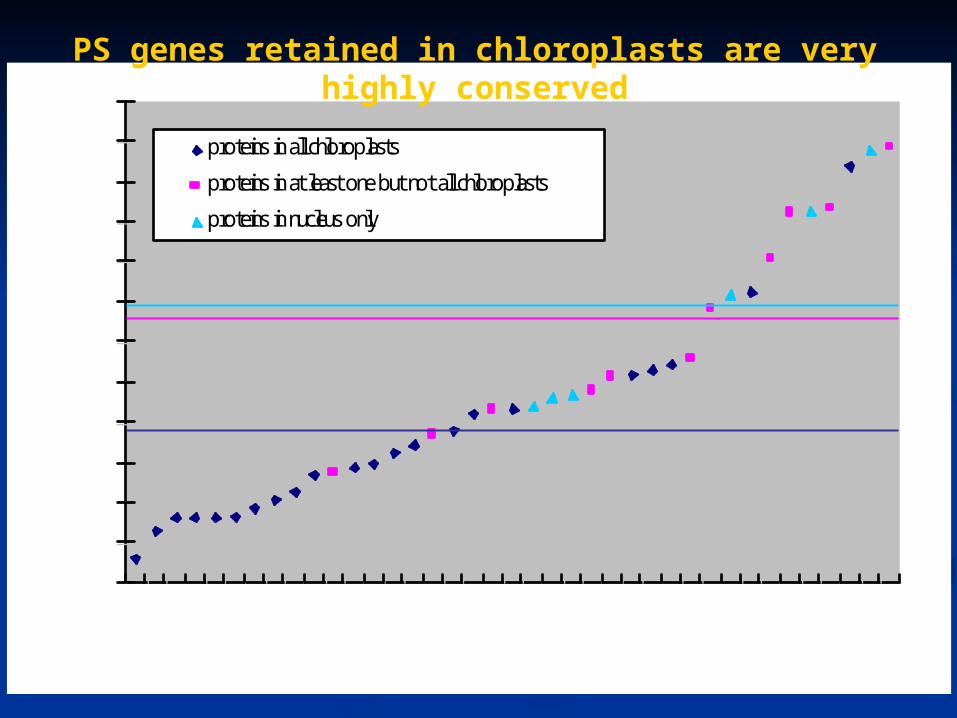
U) proteins in all chloroplasts
proteins in at least one but not all chloroplasts
proteins in nucleus only
PS genes retained in chloroplasts are very highly conserved

How does this How does this inform us about N inform us about N limitation in the limitation in the ocean or other ocean or other
aquatic aquatic ecosystems?ecosystems?Reflection of elemental N/P Reflection of elemental N/P
ratios from organic matter in ratios from organic matter in the soluble inorganic pool of the soluble inorganic pool of fixed N and P. fixed N and P.
Is the Redfield “paradigm” Is the Redfield “paradigm” for the ocean a coincidence for the ocean a coincidence or a true biological feedback?or a true biological feedback?

Variations in N:P
Analyzed deep water DIN, DIP, and O2 measurements from 104 observational data sets for 33 water bodies
Water bodies ranged from ocean basins to freshwater lakes, from 109 km2 to 0.075 km2
Seawater N:P averages 15-16
Freshwater N:P range from 0.005 (Lake Lugano (Barbieri and Simona,
2001)) to 8700 (Lake Superior (Sterner et al., 2007)).
Restricted basin N:P range from ~20 (Med and Red Seas) to 1 (Caspian (Sapozhnikov et al., 2007))

Distribution of N:P Data
Canonical Redfield ratio is anomalous

N:P vs. O2
N:P linearly correlated to O2 when O2 is < 100M
Loss of N linked to denitrification under low O2
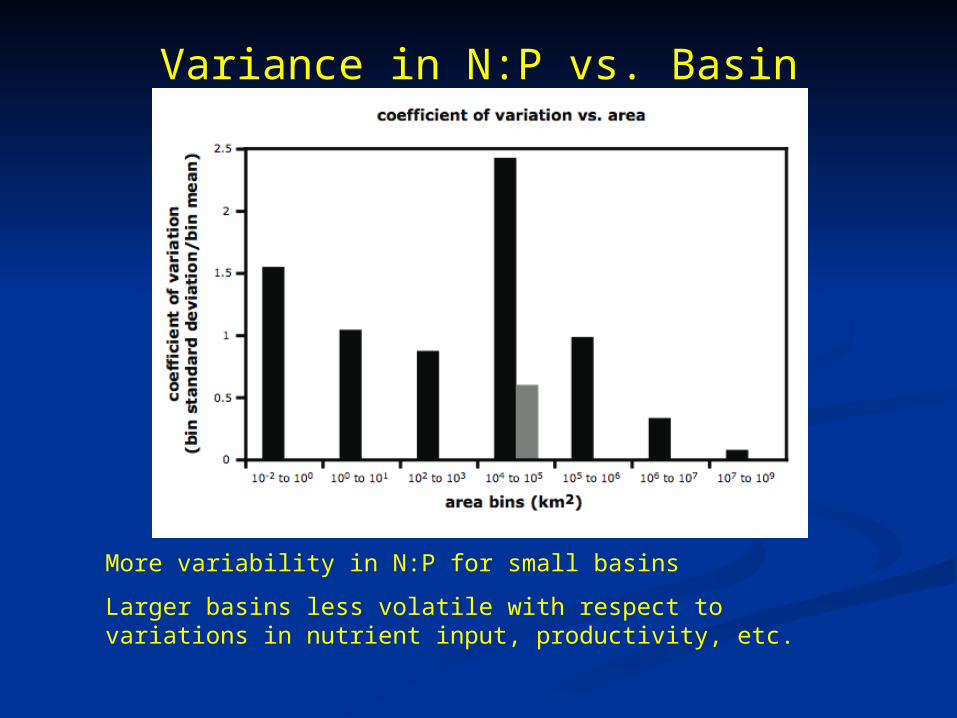
Variance in N:P vs. Basin Area
More variability in N:P for small basins
Larger basins less volatile with respect to variations in nutrient input, productivity, etc.

What did this exercise reveal?Deep water N:P ratios are linearly correlated to O2 when O2 is less
than 100M
This correlation breaks down at O2>100M
N:P ratios are generally higher, but no simple link
This may be due to anthropogenic influences (e.g. N loading)
There is less variability in N:P ratios amongst larger basins (not a surprise)
Small basins more affected by changes in input, productivity and seasonal cycles
N:P in the soluble pools is not simply controlled by organic matter remineralization, but also by REDOX state of the water body

What about on a What about on a molecular level?molecular level?
Assume protein N:rRNA P = 16:1Assume protein N:rRNA P = 16:1
In 1 ribosome, there are 5732 P, so then there are 83792 In 1 ribosome, there are 5732 P, so then there are 83792 protein N per ribosomeprotein N per ribosome
Assume 1.4 N/aa, so then 59851 aa/ribosome Assume 1.4 N/aa, so then 59851 aa/ribosome
If that protein turns over every day, then translation rate per If that protein turns over every day, then translation rate per
ribosome = 0.69 aa/sribosome = 0.69 aa/s
This is >10% of the average ribosomal translation capacityThis is >10% of the average ribosomal translation capacity
Tentative conclusion - about 90% of the time, ribosomes in Tentative conclusion - about 90% of the time, ribosomes in the ocean are “idling” - because they are waiting for a charged the ocean are “idling” - because they are waiting for a charged tRNA - N limitation on a cellular/global leveltRNA - N limitation on a cellular/global level

Resiliency on a Global Resiliency on a Global ScaleScale
There is ~ 10 Gg of nitrogenase in the There is ~ 10 Gg of nitrogenase in the oceans.oceans.
There is ~ 10,000 x more RubiscoThere is ~ 10,000 x more Rubisco
What limits N fixation over geological What limits N fixation over geological time? Is Fe really the “ultimate” time? Is Fe really the “ultimate” limiting nutrient? – the untestested limiting nutrient? – the untestested hypothesis.hypothesis.

ConclusionsConclusions On a planetary scale, the key metabolic On a planetary scale, the key metabolic
pathways that sustain life are all based on pathways that sustain life are all based on old, inefficient technologies that have been old, inefficient technologies that have been widely dispersed.widely dispersed.
Evolutionary history suggests that selection Evolutionary history suggests that selection for body plans and secondary adaptive for body plans and secondary adaptive strategies has permitted the continuation of strategies has permitted the continuation of the core machinery without need for de novo the core machinery without need for de novo invention of metabolism. invention of metabolism.
Some pathways (e.g., NSome pathways (e.g., N22fixation) appear to fixation) appear to be less functionally redundant (more be less functionally redundant (more vulnerable but also more effective in vulnerable but also more effective in regulating biogeochemical processes) than regulating biogeochemical processes) than others (e.g., photosynthesis).others (e.g., photosynthesis).

Conclusions ContinuedConclusions Continued Small changes in efficiency in one pathway can Small changes in efficiency in one pathway can
alter planetary chemistry. These changes are alter planetary chemistry. These changes are primarily regulated at the POST-primarily regulated at the POST-TRANSLATIONAL LEVEL and appear to be TRANSLATIONAL LEVEL and appear to be driven by the presence of MOLECULAR OXYGEN.driven by the presence of MOLECULAR OXYGEN.
The feedback on RuBisCO primarily affects The feedback on RuBisCO primarily affects terrestrial ecosystems while the feedback on terrestrial ecosystems while the feedback on nitrogenase primarily affects aquatic nitrogenase primarily affects aquatic ecosystems.ecosystems.
Despite the inefficiencies, the old technologies Despite the inefficiencies, the old technologies work under many different environmental work under many different environmental conditions and appear to have co-evolved into a conditions and appear to have co-evolved into a network of very strong feedbacks on Earths network of very strong feedbacks on Earths metabolic cycles (robust and resilient) .metabolic cycles (robust and resilient) .