publication of results cemig reports 1q16 ebitda of … relea… · publication of results cemig...
TRANSCRIPT
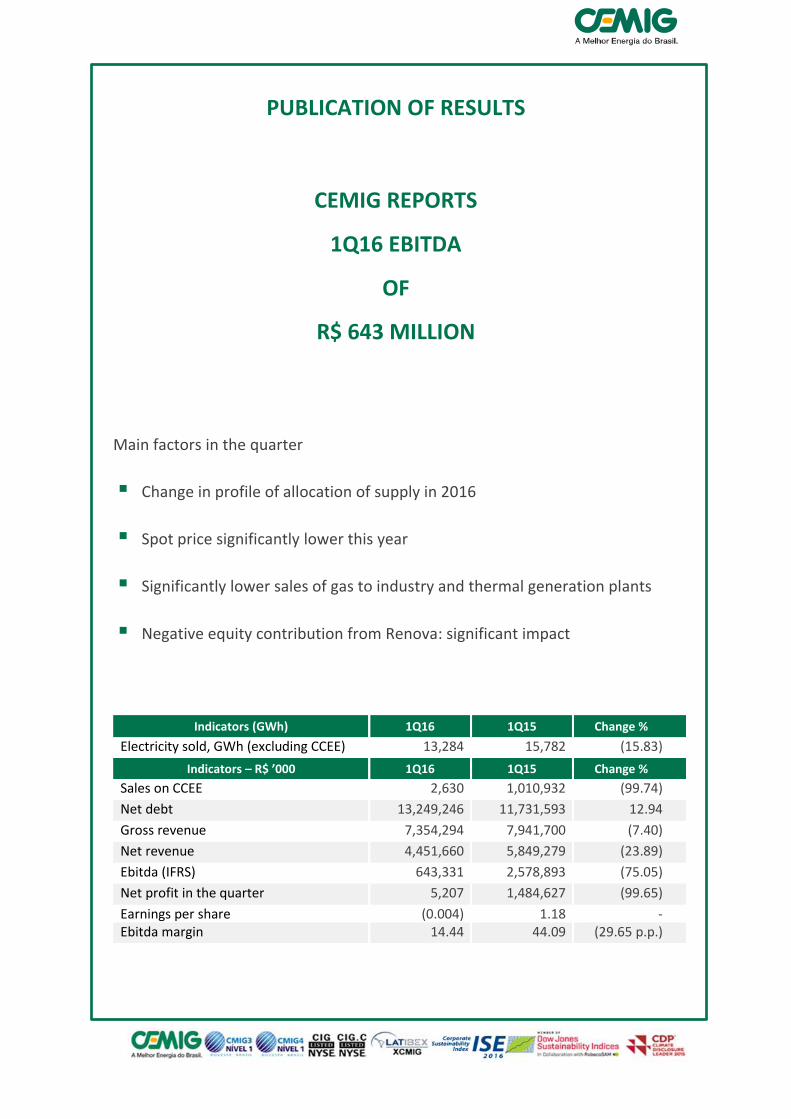
PUBLICATION OF RESULTS
CEMIG REPORTS
1Q16 EBITDA
OF
R$ 643 MILLION
Main factors in the quarter
Change in profile of allocation of supply in 2016
Spot price significantly lower this year
Significantly lower sales of gas to industry and thermal generation plants
Negative equity contribution from Renova: significant impact
Indicators (GWh) 1Q16 1Q15 Change %
Electricity sold, GWh (excluding CCEE) 13,284 15,782 (15.83)
Indicators – R$ ’000 1Q16 1Q15 Change %
Sales on CCEE 2,630 1,010,932 (99.74)
Net debt 13,249,246 11,731,593 12.94
Gross revenue 7,354,294 7,941,700 (7.40)
Net revenue 4,451,660 5,849,279 (23.89)
Ebitda (IFRS) 643,331 2,578,893 (75.05)
Net profit in the quarter 5,207 1,484,627 (99.65)
Earnings per share (0.004) 1.18 - Ebitda margin 14.44 44.09 (29.65 p.p.)

Brazil’s Best Energy
1
CEM
IG
Conference call
Publication of 1Q16 results
Video webcast and conference call
May 17, 2016 (Tuesday) : 11 AM, Brasília time
This transmission on Cemig’s results will have simultaneous translation into English and can be seen in real time by Video Webcast, at http://ri.cemig.com.br or heard by conference call on:
+ 55 (11) 2188-0155 (1st option) or
+ 55 (11) 2188-0188 (2nd option)
Password: CEMIG
Cemig Investor Relations http://ri.cemig.com.br/ [email protected] Tel.: (+55-31) 3506-5024 Fax: (+55-31) 3506-5025
Cemig’s Executive Investor Relations Team
Chief Finance and Investor Relations Officer Fabiano Maia Pereira
General Manager, Investor Relations Antônio Carlos Vélez Braga
Manager, Investor Market Robson Laranjo
Playback of Video Webcast: Site:
http://ri.cemig.com.br Click on the banner and download.
Available for 90 days
Conference call – Playback: Telephone: (+55-11) 2188-0400
Password: CEMIG Português
Available from May 17 to June 1, 2016

2 Cemig Holding S.A. Cemig Holding S.A.
CEM
IG
Contents
CONFERENCE CALL ................................................................................................................. 1
CEMIG INVESTOR RELATIONS ............................................................................................ 1
CEMIG’S EXECUTIVE INVESTOR RELATIONS TEAM .................................................... 1
SUMMARY .................................................................................................................................. 2
CEMIG STOCK PRICE PERFORMANCE .............................................................................. 3
CEMIG’S LONG-TERM RATINGS .......................................................................................... 3
ADOPTION OF IFRS ................................................................................................................ 4
CEMIG’S CONSOLIDATED ELECTRICITY MARKET........................................................ 5
THE ELECTRICITY MARKET OF CEMIG D ........................................................................ 8
THE ELECTRICITY MARKET OF CEMIG GT ..................................................................... 9
PHYSICAL TOTALS OF TRANSPORT AND DISTRIBUTION – MWH....................... 11
QUALITY INDICATORS – SAIDI AND SAIFI ................................................................... 12
CONSOLIDATED OPERATIONAL REVENUE ................................................................. 13
SECTOR / REGULATORY CHARGES – DEDUCTIONS FROM REVENUE ................ 14
OPERATIONAL COSTS AND EXPENSES ......................................................................... 16
EQUITY GAIN (LOSS) IN SUBSIDIARIES ........................................................................ 21
FINANCIAL REVENUE (EXPENSES) ................................................................................. 22
EBITDA .................................................................................................................................... 23
DEBT......................................................................................................................................... 24
FINANCIAL STATEMENTS SEPARATED BY COMPANY AND BY OPERATIONAL
SEGMENT ...................................................................................................................... 26
GENERATING PLANTS ........................................................................................................ 28
DEFAULT ................................................................................................................................. 30
Brazil’s Best Energy
3
CEM
IG
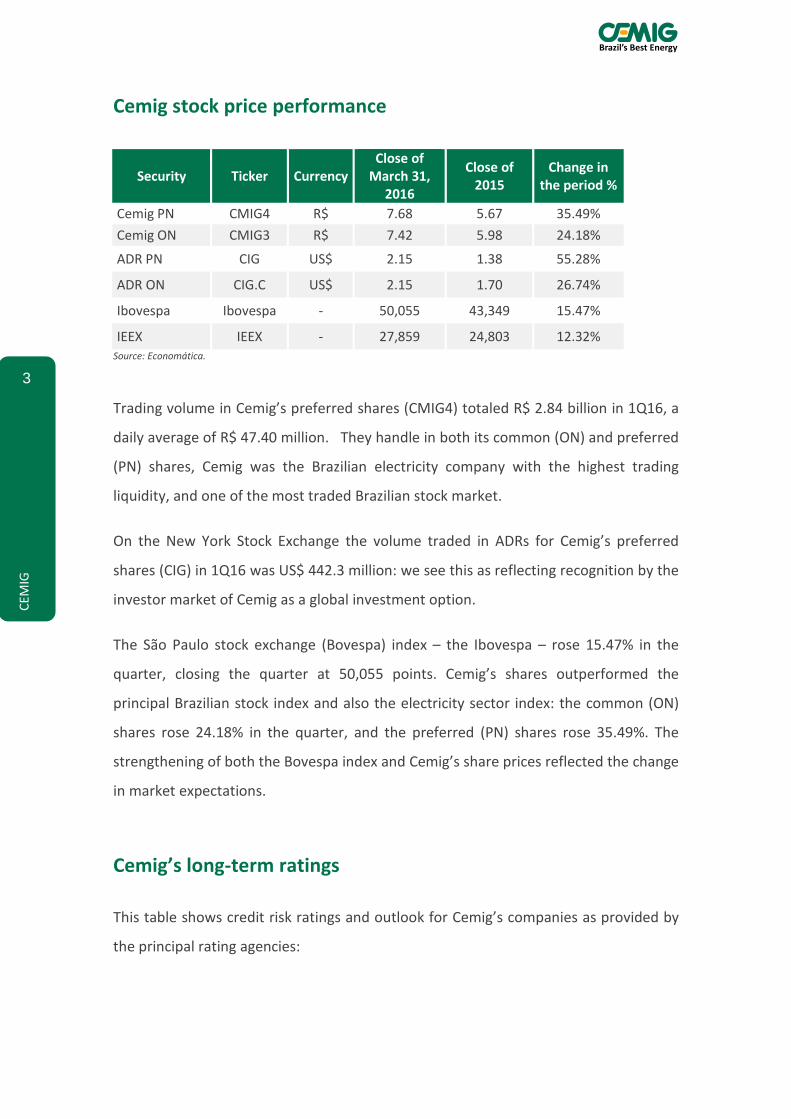
Cemig stock price performance
Security Ticker Currency Close of
March 31, 2016
Close of 2015
Change in the period %
Cemig PN CMIG4 R$ 7.68 5.67 35.49%
Cemig ON CMIG3 R$ 7.42 5.98 24.18%
ADR PN CIG US$ 2.15 1.38 55.28%
ADR ON CIG.C US$ 2.15 1.70 26.74%
Ibovespa Ibovespa - 50,055 43,349 15.47%
IEEX IEEX - 27,859 24,803 12.32% Source: Economática.
Trading volume in Cemig’s preferred shares (CMIG4) totaled R$ 2.84 billion in 1Q16, a
daily average of R$ 47.40 million. They handle in both its common (ON) and preferred
(PN) shares, Cemig was the Brazilian electricity company with the highest trading
liquidity, and one of the most traded Brazilian stock market.
On the New York Stock Exchange the volume traded in ADRs for Cemig’s preferred
shares (CIG) in 1Q16 was US$ 442.3 million: we see this as reflecting recognition by the
investor market of Cemig as a global investment option.
The São Paulo stock exchange (Bovespa) index – the Ibovespa – rose 15.47% in the
quarter, closing the quarter at 50,055 points. Cemig’s shares outperformed the
principal Brazilian stock index and also the electricity sector index: the common (ON)
shares rose 24.18% in the quarter, and the preferred (PN) shares rose 35.49%. The
strengthening of both the Bovespa index and Cemig’s share prices reflected the change
in market expectations.
Cemig’s long-term ratings
This table shows credit risk ratings and outlook for Cemig’s companies as provided by
the principal rating agencies:
4 Cemig Holding S.A. Cemig Holding S.A.
CEM
IG
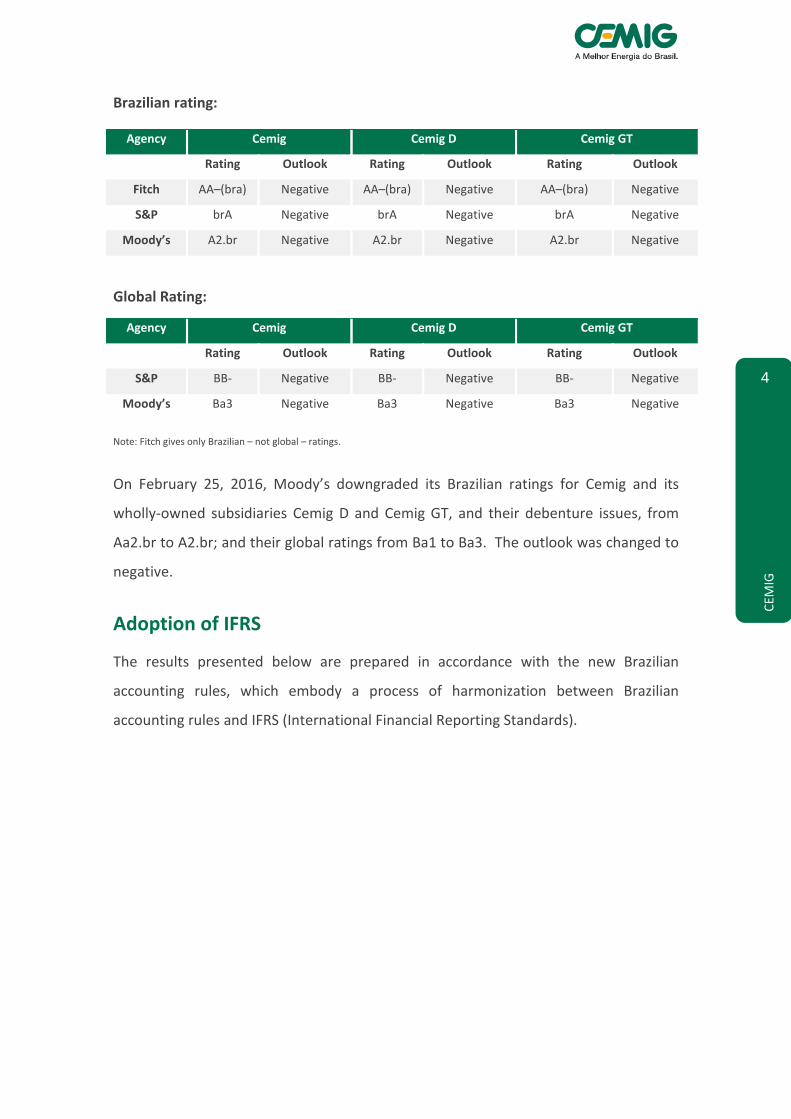
Brazilian rating:
Agency Cemig Cemig D Cemig GT
Rating Outlook Rating Outlook Rating Outlook
Fitch AA–(bra) Negative AA–(bra) Negative AA–(bra) Negative
S&P brA Negative brA Negative brA Negative
Moody’s A2.br Negative A2.br Negative A2.br Negative
Global Rating:
Agency Cemig Cemig D Cemig GT
Rating Outlook Rating Outlook Rating Outlook
S&P BB- Negative BB- Negative BB- Negative
Moody’s Ba3 Negative Ba3 Negative Ba3 Negative
Note: Fitch gives only Brazilian – not global – ratings.
On February 25, 2016, Moody’s downgraded its Brazilian ratings for Cemig and its
wholly-owned subsidiaries Cemig D and Cemig GT, and their debenture issues, from
Aa2.br to A2.br; and their global ratings from Ba1 to Ba3. The outlook was changed to
negative.
Adoption of IFRS
The results presented below are prepared in accordance with the new Brazilian
accounting rules, which embody a process of harmonization between Brazilian
accounting rules and IFRS (International Financial Reporting Standards).

Brazil’s Best Energy
5
CEM
IG
PROFIT AND LOSS ACCOUNTS
Consolidated – R$ ’000 1Q16 1Q15 Change %
REVENUE 4,451,660 5,849,279 (23.89) OPERATING COSTS Personnel (413,407) (336,438) 22.88 Employees’ and managers’ profit shares - (80,973) - Post-retirement liabilities (75,186) (57,609) 30.51 Materials (10,980) (13,882) (20.90) Raw materials and inputs for production of electricity (18) (77,518) (99.98) Outsourced services (208,004) (198,829) 4.61 Electricity purchased for resale (1,931,361) (2,421,404) (20.24) Depreciation and amortization (199,033) (247,121) (19.46) Operating provisions (251,770) (43,164) 483.29 Charges for use of the National Grid (258,706) (241,389) 7.17 Gas bought for resale (237,863) (262,008) (9.22) Infrastructure construction costs (235,021) (233,573) (0.62)
Other operational expenses, net (128,086) (128,221) (0.11)
TOTAL COST (3,949,435) (4,342,129) (9.04) Equity method gain (loss) (57,927) 90,092 - Gain (loss) on reorganization – Aliança - 734,530 - Operational profit before Financial income (expenses) and taxes 444,298 2,331,772 (80.95) Financial revenues 226,580 290,302 (21.95) Financial expenses (639,138) (563,752) 13.37
Profit before income tax and Social Contribution tax 31,740 2,058,322 - Current and deferred income tax and Social Contribution tax (26,533) (573,695) (95.38)
NET PROFIT FOR THE PERIOD 5,207 1,484,627 (99.65)
Interest of the controlling stockholders 5,119 1,484,482 Interest of non-controlling stockholder 88 145
NET PROFIT FOR THE PERIOD 5,207 1,484,627
Fair value gain (loss) on stockholding transaction - (573,182)
ADJUSTED NET PROFIT FOR THE PERIOD 5,207 911,445 (99.43)
Cemig’s consolidated electricity market
The Cemig Group sells electricity through its distribution company, Cemig Distribuição
S.A. (‘Cemig D’), its generation and transmission company Cemig Geração e
Transmissão S.A. (‘Cemig GT’), and other wholly-owned subsidiaries: Horizontes
Energia, Termelétrica Ipatinga (up to January 2015), Sá Carvalho, Termelétrica de
Barreiro, Cemig PCH, Rosal Energia and Cemig Capim Branco Energia (up to March
2015).

6 Cemig Holding S.A. Cemig Holding S.A.
CEM
IG
The total for sales in Cemig’s consolidated electricity market comprises sales to:
(I) Captive consumers in Cemig’s concession area in the State of Minas Gerais;
(II) Free Consumers in both the State of Minas Gerais and other States of Brazil, in the
Free Market (Ambiente de Contratação Livre, or ACL);
(III) other agents of the electricity sector – traders, generators and independent
power producers, also in the ACL;
(IV) Distributors, in the Regulated Market (Ambiente de Contratação Regulada, or
ACR); and
(V) the wholesale trading chamber (Câmara de Comercialização de Energia Elétrica,
or CCEE)
( – eliminating transactions between companies of the Cemig Group ).
In 1Q16 the Cemig group sold a total volume of 13,284 GWh. This volume was 15.8%
less than its total sales volume in 1Q15.
Sales of electricity to final consumers plus Cemig’s own consumption totaled 10,587
GWh, or 9.9% less than in 1Q15.
Overall, electricity consumption has been affected since 1Q15 by adverse Brazilian
political and economic circumstances; and, in the captive market, by the successive
increases in electricity rates charged to consumers, associated with application of the
‘Tariff Flag’ system, resulting in significant increases in consumers’ electricity bills.
Sales to distributors, traders, other generating companies and independent power
producers totaled 2,697 GWh – or 33.2% less than in 1Q16.
In March 2016 the Cemig group invoiced 8,120,322 clients – a growth of 1.9% in the
consumer base in the year since March 2015. Of these, 8,120,262 are final consumers,
including Cemig’s own consumption; and 60 are other agents in the Brazilian electricity
sector.

Brazil’s Best Energy
7
CEM
IG
This chart shows the breakdown of the Cemig Group’s sales to final consumers in the
quarter, by consumer category:
Total consumption of electricity (GWh)
Consolidated
MWh Change,
%
Average price 1Q16
R$
Average price 1Q15
R$ 1Q16 1Q15
Residential 2,490,519 2,563,143 (2.83) 812.54 603.46 Industrial 4,837,976 5,816,894 (16.83) 278.43 220.93 Commercial, Services and Others 1,687,814 1,696,604 (0.52) 689.19 499.13 Rural 723,827 794,723 (8.92) 445.62 319.80 Public authorities 215,405 217,588 (1.00) 624.15 486.26 Public lighting 329,062 331,051 (0.60) 418.96 302.52
Public service 292,885 316,384 (7.43) 467.58 343.97
Subtotal 10,577,488 11,736,387 (9.87) 497.82 361.92
Own consumption 9,452 9,819 (3.74) - - Wholesale supply to agents in Free and Regulated Markets (*) 2,696,632 4,035,551
(33.18) 204.61 209.96
Total 13,283,572 15,781,757 (15.83) 445.27 325.63 (*) Includes Regulated Market Electricity Sale Contracts (CCEARs) and ‘bilateral contracts’ with other agents.
23%
46%
16%
7%
8%
1Q16
Residential
Industrial
Commercial , Services and Others
Rural
Other
22%
50%
14%
7%7%
1Q15
15,781
13,284
73 979
8 70 28 1,338
1Q15 Residential Industrial Commercial Rural Others Wholesale 1Q16
–15.8%
Total volume sold – GWh

8 Cemig Holding S.A. Cemig Holding S.A.
CEM
IG
The electricity market of Cemig D
Electricity billed to captive clients and electricity transported for Free Clients and
distributors with access to Cemig D’s networks in 1Q16 totaled 10,460 GWh, or 3.3%
less than in 1Q16.
There are two components of this reduction: Consumption by the captive market 5.5%
lower year-on-year, and use of the network by Free Clients 0.5% lower.
In March 2016 Cemig billed 8,120,073 consumers, or 1.9% more consumers than in
March 2015. Of this total, 445 are Free Consumers using the distribution network of
Cemig D.
Consolidated Number of clients Change,
% 1Q16 1Q15 Residential 6,566,165 6,429,953 2.1 Industrial 74,922 75,736 -1.1 Commercial, Services and Others 713,951 713,759 - Rural 684,988 671,531 2.0 Public authorities 62,994 62,506 0.8 Public lighting 4,438 3,794 17.0
Public service 11,414 10,459 9.1
Total 8,118,872 7,967,738 1.9
Comments on the various consumer categories:
Residential
Residential consumption was 2,491 GWh of the electricity transacted by Cemig, or
2.83% less than in 1Q15.
The lower level of residential consumption is due to:
Increases in rates, and application of the ‘Tariff Flag’ rates as from January
2015.
Reduction in families’ disposable income over the year 2005 and in the first
quarter of 2016.
Deterioration in family confidence.
Fewer calendar days in first quarter 2016 (90.2 days) that in first quarter
2015 (91.8 days).

Brazil’s Best Energy
9
CEM
IG
Lower temperatures in 1Q16 than 1Q15, resulting in less use by consumers of
air conditioners and ventilators in their homes.
Average monthly consumption per consumer in 1Q16 was 126.4 KWh/month, or 4.6%
lower than the average for 2015 (132.4 KWh/month).
Industrial
Electricity used by captive clients was 7.9% of the volume of electricity distributed by
Cemig, totaling 831 GWh in 1Q16, 12.6% less than 1Q15.
This is in line with the continuing retraction of economic activity both in Minas Gerais
and in the whole of Brazil, and the performance of the international market:
lower physical production, reflecting undesired inventory levels and less
demand, leading to idle manufacturing capacity and lower use of labor;
lack of entrepreneur confidence, and low levels of public and private
investment;
uncertainties in the Brazilian political and economic situation; and
high cost of corporate credit due to high interest rates, and banks being more
selective in granting loans.
The decline in consumption is seen in most areas of economic activity: food products
(-3.9%), nonmetallic minerals (–17.0%), mining (–8.6%), chemicals (–11.6%),
metallurgy/pig-iron (–30.1%) and metal products (–13.8%).
The electricity market of Cemig GT
Cemig GT’s sales volume in 1Q16 was affected by termination of concession of plants.
As from the termination, Cemig GT received payment for this output was under the
Physical Guarantee Quota regime, and via settlement on the spot market.
Cemig GT’s market comprises sales of power as follows:
10 Cemig Holding S.A. Cemig Holding S.A.
CEM
IG
(I) in the Free Market (Ambiente de Contratação Livre – ACL) to Free Clients,
either located in Minas Gerais or in other States;
(II) to other agents in the electricity sector – traders, generators and
independent power producers (in the Free Market);
(III) to electricity distributors (in the Regulated Market – ACR); and
(IV) sales in the CCEE (Wholesale Electricity Trading Chamber).
The total supply billed by Cemig GT in 1Q16 was 6,703 GWh, or 24.6% less than in
1Q15.
The number of clients billed by Cemig GT was 28.6% higher than at the end of March
2015, totaling 684. Of these: 623 were industrial and commercial clients, 47 were
distribution companies, and 14 were companies in the category of traders, generators
and independent power producers.
Free clients consumed 3,975 GWh in 1Q16, or 59.3% of the total electricity provided by
Cemig GT, and 16.9% less than in 1Q15 – on the following main factors:
reduction of consumption by industrial clients due to the continuous retraction
in economic activity at state and national level in Brazil, and the performance of
the international economy;
lower availability of power for sale due to the conditions for renewal of
concessions, as per Law 1303/2050 – this supply was redirected to the Physical
Guarantee Quota regime; and
shutdown of a mining operation in Minas Gerais state.
In 1Q16 Cemig GT added 113 new clients in the Commercial category, mainly outside
the state of Minas Gerais.

Brazil’s Best Energy
11
CEM
IG
Sales and trading transactions in electricity with other agents of the electricity sector in
the Free Market lead to selling opportunities, which lead to short-term sales contracts.
In 1Q16 total sales of electricity were 2,049 GWh, or 18.7% less than in 1Q15.
Sales in the Regulated Market, including sales to Cemig D, were 57.3% lower than in
1Q15, for several reasons:
Cessation of contracts entered into as a result of the corporate reorganization
of the Cemig group, with the transfer of assets from Cemig GT to Aliança
Energia; and
Termination of contracts made at the 18th Adjustment Auction, held in the first
half of 2015, and the second ‘Existing Supply’ Auction, held in 2005 at
governing the period 2005–2015.
Since September 15, 2015 the São Simão Plant has been serving the Regulated Market
under the ‘quota’ regime, in accordance with Ministerial Order 432/2015. The
company now recognizes only the revenue from provision of the services of operation
and maintenance of the plant.
Physical totals of transport and distribution – MWh
Description MWh Change
% 1Q16 1Q15 Total energy carried Electricity transported for distributors 84,955 87,127 (2.49) Electricity transported for free clients 4,141,925 3,837,319 7.94 Own load Consumption by captive market 6,407,724 6,722,478 (4.68) Losses in distribution network NA 1,397,458 -

12 Cemig Holding S.A. Cemig Holding S.A.
CEM
IG
QUALITY INDICATORS – SAIDI AND SAIFI
Cemig is continuously taking action to improve operational management, organization
of the logistics of its emergency services, and its permanent regime of preventive
inspection and maintenance of substations, lines and distribution networks. It also
invests in training of its staff for improved qualifications, state-of-the-art technologies,
and standardization of work processes, aiming to uphold the quality of electricity
supply, and as a result maintain the satisfaction of clients and consumers.
The charts below show Cemig’s indicators for duration and frequency of outages –
SAIDI (System Average Interruption Duration Index, in hours), and SAIFI (System
Average Interruption Frequency Index, in number of outages), since January 2015.
Accumulated
DEC due to
accidents
2016: 3.8Target: 3.3
2015: 3.1
-Jan Feb Mar Apr May Jun Jul Aug Sep Oct Nov Dec
2015 2016 Target
-
2015 2016 Target
SAIDI (System Average Interruption Duration Index) – hours/consumer/month
Jan Feb Mar Apr May Jun Jul Aug Sep Oct Nov Dec
2016: 1.8Target: 2.4
2015: 1.8
2.00
4.00
6.00
8.00
10.00
12.00
14.00
2.00
4.00
6.00
8.00
10.00
SAIFI (System Average Interruption Frequency Index) – outages/consumer/month
Accumulated
DEC due to
accidents

Brazil’s Best Energy
13
CEM
IG
Consolidated operational revenue
Revenue from supply of electricity:
Total revenue from supply of electricity to final consumers in 1Q16 was R$ 5.915
billion, or 15.10% more than the total revenue of R$ 5.139 billion in 2015.
Final consumers Total revenue from electricity sold to final consumers, excluding Cemig’s own
consumption, in 1Q16 was R$ 5.307 billion, or 23.65% more than the figure for 1Q16,
of R$ 4.292 billion.
The main factors affecting revenue in 1Q16 were:
The Extraordinary Tariff Adjustment (RTE) for Cemig D (Distribution), which
resulted in an average impact on consumers’ tariffs of 28.76%, applicable from
March 2, 2015.
An annual tariff adjustment, with average effect on consumer tariffs of 7.07%,
effective from April 8, 2015.
Volume of electricity sold 15.83% lower.
R$
Change %
Average price 1Q16
R$
Average price 1Q15
R$
Change % 1Q16 1Q15
Residential 2,023,634 1,546,762 30.83 812.54 603.46 34.65 Industrial 1,347,060 1,285,151 4.82 278.43 220.93 26.03 Commercial, Services and Others 1,163,232 846,832 37.36 689.19 499.13 38.08 Rural 322,553 254,149 26.91 445.62 319.80 39.35 Public authorities 134,446 105,804 27.07 624.15 486.26 28.36 Public lighting 137,865 100,151 37.66 418.96 302.52 38.49
Public service 136,947 108,826 25.84 467.58 343.97 35.94
Subtotal 5,265,737 4,247,675 23.97 497.82 361.92 37.55 Supply not yet invoiced, net 41,021 44,055 (6.89) - - - Wholesale supply to other concession
holders (*) 551,762 847,299 (34.88) 204.61 209.96 (2,55)
Wholesale supply not yet invoiced, net 56,293 212 26.453.3 - - -
Total 5,914,813 5,139,029 15,09 445.27 325.63 36.74
(*) Includes Regulated Market Electricity Sale Contracts (CCEARs) and ‘bilateral contracts’ with other agents.

14 Cemig Holding S.A. Cemig Holding S.A.
CEM
IG
Revenue from Use of Distribution Systems (the TUSD charge)
The revenue of Cemig D (Distribution) from the TUSD in 1Q16 was R$ 409 million, or
94.76% higher than in 1Q15 (R$ 210 million). This reflects the impact of the tariff
adjustments in 2015 – an increase of 96.21% for Free Consumers. The 2015 increases
were mainly due to passing through of the CDE (Energy Development Account)
amounts to the tariffs paid by consumers.
Revenue from transactions in the Wholesale Trading Chamber (CCEE)
Revenue from transactions in electricity on the CCEE in 1Q16 was R$ 3 million,
compared to R$ 1.01 billion – a reduction of 99.7% year-on-year. This is mainly due to
the spot price (Preço de Liquidação de Diferenças, or PLD) being 91.07% lower year-on-
year in the wholesale market (at R$ 34.69/MWh in 2016 compared to R$ 388.48/MWh
in 2015); and the lower quantity of electricity available for settlement in the wholesale
market in 2016.
CVA and Other financial components in tariff adjustment
Due to the alteration in the concession contracts of the distributors, Cemig started to
recognize balances of non-controllable costs to be passed through to Cemig D’s next
tariff adjustment. These comprised a reversal of R$ 132 million in operational revenue
in 1Q16. This compares with operational revenue of R$ 550 million in 2015. This
variation is principally due to the reduction of the costs of electricity acquired in
auctions.
Sector / Regulatory charges – deductions from revenue
The sector charges that are effectively deductions from reported revenue totaled
R$ 2.903 billion in 1Q16, compared to R$ 2.092 billion in 2015 – an increase of 38.77%.
This principally results from the increase in the charges under the Energy Development
Account (CDE), and the Tariff Flag charges.
Brazil’s Best Energy
15
CEM
IG
The Energy Development Account – CDE
Payments to the Energy Development Account (CDE) are decided by an Aneel
Resolution. The expenses included in the CDE are: concession indemnities, tariff
subsidies, subsidy for balanced tariff reduction, low-income consumer subsidy, coal
consumption subsidy, and the Fuels Consumption Account (CCC).
Charges for the CDE in 1Q16 were R$ 600 million, compared to R$ 298 million in 1Q15.
This is the result of the new budget for the CDE since March 2015, in which Aneel
increased the annual amount to be paid by Cemig D (which is passed through to the
consumer in the Sector Charges component of tariffs).
Consumer charges – the ‘Tariff Flag’ system
With the creation of the Tariff Flag mechanism, Cemig had an account under
Consumer Charges related to the Tariff Flag payments, totaling R$ 273 million in 1Q16,
compared to R$ 87 million in 1Q15.
The ‘Flag Account’ (‘Conta Bandeira’) was created on February 5, 2015, to manage the
funds collected from captive customers of utilities of the national grid holding
electricity distribution concessions and permissions – these were paid, on behalf of the
CDE, directly to the Flag Account. The resulting funds are passed through by the
Wholesale Trading Chamber (CCEE) to distribution agents, based on the differences
between:
(i) realized costs of thermal generation and exposure to short term market prices, and
(ii) the amounts covered by the tariff.
The other deductions from revenue are taxes, calculated as a percentage of amounts
invoiced. Thus their variations are, substantially, proportional to the changes in
revenue.

16 Cemig Holding S.A. Cemig Holding S.A.
CEM
IG
Operational costs and expenses
Operational costs and expenses, excluding Financial revenue (expenses), totaled
R$ 3.949 billion in 1Q16, or 9.05% more than in 1Q15 (R$ 4.342 billion).
The following paragraphs comment on the main variations:
Electricity purchased for resale
The expense on electricity bought for resale in 1Q16 was R$ 1.931 billion, or 20.24%
more than in 1Q15 (R$ 2.421 billion). The main factors in the higher figure are:
Cemig D:
Expense on electricity acquired in auctions 42.57% lower, at R$ 665 million in
1Q16, compared to R$ 1.159 billion in 1H15, mainly on on lower expenditure
on fuel for generation by the thermal plants.
Expense on electricity from Itaipu Binacional 14.36% lower, at R$ 316mn in
1Q16, compared to R$ 370mn in 1Q15. This is mainly due to (i) the lower tariff,
which was US$38.07/kw/month in 1Q15, but US$25.78/kw/month as from
January 2016; and (ii) the volume of electricity bought being 5.25% lower.
The cost of purchases of supply in the short-term market was lower by 64.74%
– at R$ 86 million in 1Q16, vs. R$ 245 million in 1Q15) – reflecting the lower
cost of electricity in the wholesale market in 2015.
10%
2%
5%
49%
5%
7%
6%
6%
6%4%
Outsourced services
Personnel
Charges for use of national grid
Infrastructure construction costs
Operational provisions
Other operational expenses, net
Gas purchased for resale
Depreciation and amortization
Post-retirement obligations
Electricity bought for resale
Brazil’s Best Energy
17
CEM
IG
Cemig GT:
The expense on electricity bought for resale in 1Q16 was R$ 660 million, or 8.55%
more than in 1Q15 (R$ 608 million). This reflects a higher average price per MWh
(R$ 134.74 in 2016, vs. R$ 179.94 in 2015), with an offsetting effect from volume of
electricity purchased in 1Q16 25.12% lower (4,510,660 MWh), compared to 1Q15
(3,669,685 MWh).
Operating provisions
Operational Provisions 486.05% higher year-on-year in the quarter – an expense of R$
252mn in 1Q16, compared to R$ 43mn in 1Q15. The main factors in this result are:
Higher provisions for doubtful receivables: R$ 76 million in 1Q16, compared to
R$ 27 million in 1Q15 – mainly reflecting a higher level of default, influenced by
the significant increase in consumer electricity rates put in place in 2015, and
also the Brazilian macroeconomic context.
Higher provisions for contingencies: in particular for employment-law litigation
– totaling R$ 50 million in 1Q16, compared to R$ 16 million in 1Q15. There was
also an increase in regulatory provisions – at R$ 21 million in 1Q16, compared
to R$ 3 million in 2015, reflecting an infringement claim issued by Aneel, in the
administrative sphere, related to assessment of electricity distribution services.
This change mainly reflected provisions for the put options on equity interests
in Parati (R$ 79 million), and SAAG R$ 9 million), respectively.
a) Put options for Units in FIP Melbourne
Option Contracts for sale of Units (‘the Put Options’) were signed between Cemig GT
and the pension plan entities that participate in the investment structure of SAAG,
which those entities may exercise in the 84th month from June 2014. The exercise
price of the Put Options will correspond to the amount invested by each pension plan
company in the Investment Structure, updated pro rata temporis by the IPCA inflation
index (Índice National de Preços ao Consumidor Amplo, published by the Brazilian
18 Cemig Holding S.A. Cemig Holding S.A.
CEM
IG
Geography and Statistics Institute – IBGE), plus 7% per year, less such dividends and
Interest on Equity as have been paid by SAAG to the pension plan entities.
To decide the method to be used for measuring the fair value of that option, since
Madeira Energia is an unlisted company, the Company adopted the discounted cash
flow method to measure the fair value of the options. The fair value of this option has
been calculated on the basis of the estimated exercise price on the day of exercise of
the option, less the fair value of the shares that are the subject of the put option, also
estimated for the date of exercise, brought to present value at the interim reporting
date, at the effective rate of 8% p.a. (discounting inflation effects). Based on the
studies made, a liability of R$ 157 million is recorded in Cemig GT, for the difference
between the the exercise price and the estimated fair value of the assets.
b) FIP Redentor
Cemig granted to Fundo de Participações Redentor, which is a stockholder of Parati, an
option to sell the totality of the shares which that fund holds in Parati, exercisable in
May 2016. The exercise price of the option is calculated from the sum of the value of
the amounts injected by the Fund into Parati, plus the running expenses of the fund,
less Interest on Equity, and dividends, distributed by Parati. The exercise price is
subject to monetary updating by the CDI (Interbank CD) Rate plus financial
remuneration at 0.9% per year.
To decide the method to be used in measuring the fair value of this option, the
Company observed the daily trading volume of the shares of Light, and also the fact
that such option, if exercised by the Fund, will require the sale to the Company, in a
single transaction, of shares in Light in a quantity higher than the daily exchange
trading averages. Thus, the Company has adopted the discounted cash flow method
for measurement of the fair values of the options. The fair value of that option was
calculated as the amount of the exercise price estimated on the date of exercise, less
the fair value of the shares subject of the put option, also estimated on the date of the
Brazil’s Best Energy
19
CEM
IG
exercise of the option, brought to present value on the reporting date, at an effective
rate of 7.5% p.a. (discounting inflation effects).
Based on the studies made, a liability of R$ 1.324 billion is recorded in Cemig itself (the
holding company), for the difference between the the exercise price and the estimated
fair value of the assets.
On May 27, 2016, there will be an Extraordinary General Meeting of Stockholders to
decide on changes in the agreement with FIP Redentor, including postponement of the
date of exercise of the put option. For more details see the Convocation Notice:
http://cemig.infoinvest.com.br/enu/13511/conv_proposta_AGE27-05-16_ing.pdf
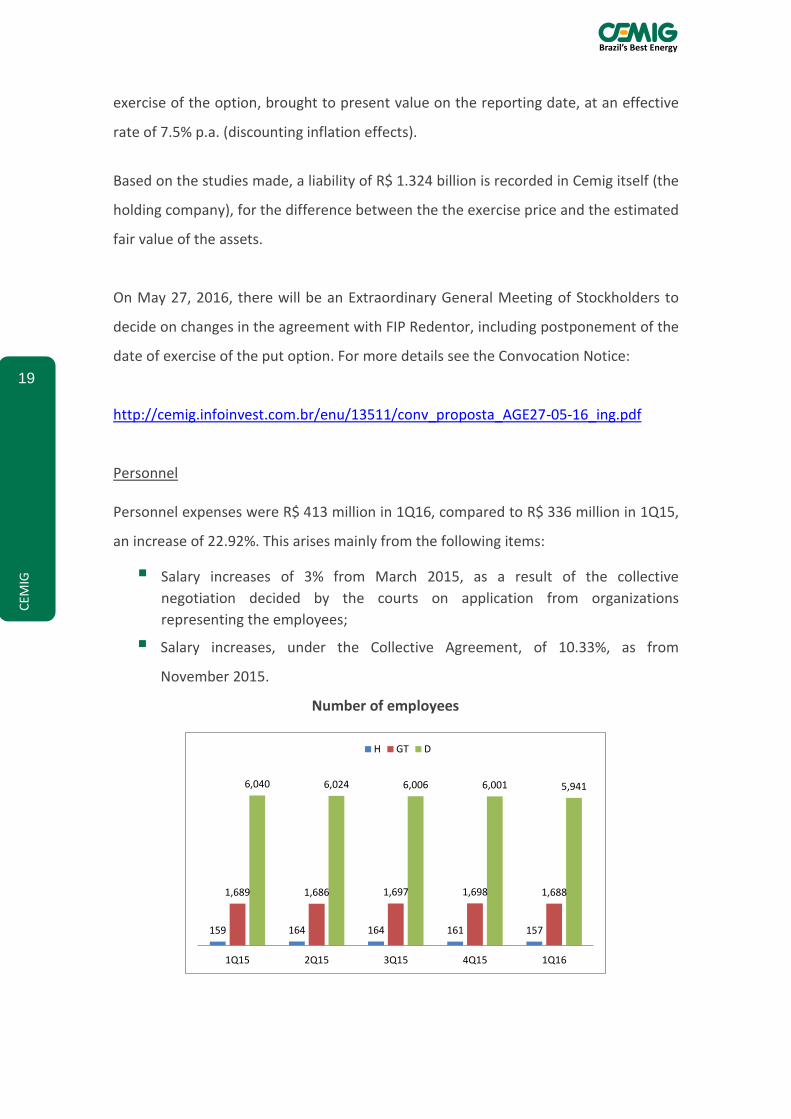
Personnel Personnel expenses were R$ 413 million in 1Q16, compared to R$ 336 million in 1Q15,
an increase of 22.92%. This arises mainly from the following items:
Salary increases of 3% from March 2015, as a result of the collective
negotiation decided by the courts on application from organizations
representing the employees;
Salary increases, under the Collective Agreement, of 10.33%, as from
November 2015.
Number of employees
159 164 164 161 157
1,689 1,686 1,697 1,698 1,688
6,040 6,024 6,006 6,001 5,941
1Q15 2Q15 3Q15 4Q15 1Q16
H GT D

20 Cemig Holding S.A. Cemig Holding S.A.
CEM
IG
Gas bought for resale
The expense Cemig reports for Gas bought for resale was R$ 238 million in 1Q16, vs.
R$ 262 million in 1Q15. This is basically due to a lower quantity of gas purchased
(287,594m³ in 1Q16, compared to 380,666m³ in 1Q15) reflecting Brazil’s economic
downturn, which affected the industrial market, and also led to gas-fired
thermoelectric generation plants being de-activated.
Market (’000 m3/day) 2012 2013 2014 2015
1Q16
Residential - 0.17 0.72 1.04 1.57
Commercial 24.73 20.38 23.15 22.42 20.63
Industrial 2,740.00 2,734.95 2,849.24 2,422.78 2,116.84 Other 114.09 106.33 99.64 119.87 118.13
Total market excluding thermal plants 2,878.82 2,861.83 2,972.75 2,566.11 2,257.17
Thermal plants 746.09 1.214.50 1.223.99 1.309.13 918.21
Total 3,624.91 4,076.33 4,196.74 3,875.24 3,175.38
In the industrial market, the lower daily average of sales reflects reductions in
economic activity in many of the industries served by Gasmig. Examples are:
Metallurgy (–32%);
Manufacture of machines and equipment (–26%); and
Textiles and textile products (–16%).
The thermoelectric generation plants, which had been operating uninterruptedly since
2012, and now less in demand due to the lower demand for electricity, and also the
higher levels of rainfall in the current rainy period.
Supply of gas for the residential market, which began in 2013, was connected to 4,645
homes in March 2016 (3,820 homes at December 31, 2015).
Fair value gain (loss) on stockholding transaction
In 2015 the Company posted a gain of R$ 735 million arising from the constitution of
Aliança Geração de Energia. On February 27, 2015, the transaction of association
between Vale S.A. and Cemig GT by subscription of shares in Aliança Geração de
Energia S.A. was completed. The two companies subscribed their shares in Aliança by
Brazil’s Best Energy
21
CEM
IG
transfer to it of their interests in the following generation assets: Porto Estrela,
Igarapava, Funil, Capim Branco I, Capim Branco II, Aimorés and Candonga. Aliança has
installed hydroelectric generation capacity of 1,158 MW in operation (assured offtake
level 652 MW), as well as other generation projects.
Since its creation, Aliança Geração de Energia has made a positive contribution to
Cemig GT. In 1Q16 this interest provided Cemig GT with a gain of R$ 24 million.
Equity gain (loss) in subsidiaries In 1Q16 Cemig posted a net equity method gain of R$ 58 million, which compares with
a net gain of R$ 90 million in 1Q15. This is mainly due to a loss of R$ 152 million in
1Q16 in the jointly-controlled entity Renova Energia.
Investment in Renova – Loss due to impairment of assets available for sale
Option contract
A contract was signed on September 18, 2015 giving Renova the option to sell to
SunEdison up to 7,000,000 shares in TerraForm Global, which Renova had received
under the agreement in the first phase of the related asset exchange transaction.
The exercise price of this option was set at R$ 50.48 or US$15.00, at the exchange rate
of the day, at SunEdison’s choice. The contract also gave SunEdison an option to buy
the same 7 million shares on the same terms.
Renova priced the option using the Black-Scholes mathematical model, the future
expectation for the exchange rate, and the credit risk. Based on this valuation, a loss
of R$ 217 million has been recognized in 1Q16. Cemig´s impact is R$ 59 million,
according to its 27.35% interest in Renova´s stake.
22 Cemig Holding S.A. Cemig Holding S.A.
CEM
IG
Investment in TerraForm – pricing of the shares
The company also posted a loss in 1Q16, of R$ 272 million, resulting from the fall in the
stock price of TerraForm, in which Renova holds an equity interest of 11.42%, valued
on the basis of the market price of the shares.
The figures above refer to the full impact on the financial statements of Renova. The
effect for Cemig was proportional to its interest in the investee, valued by the equity
method.
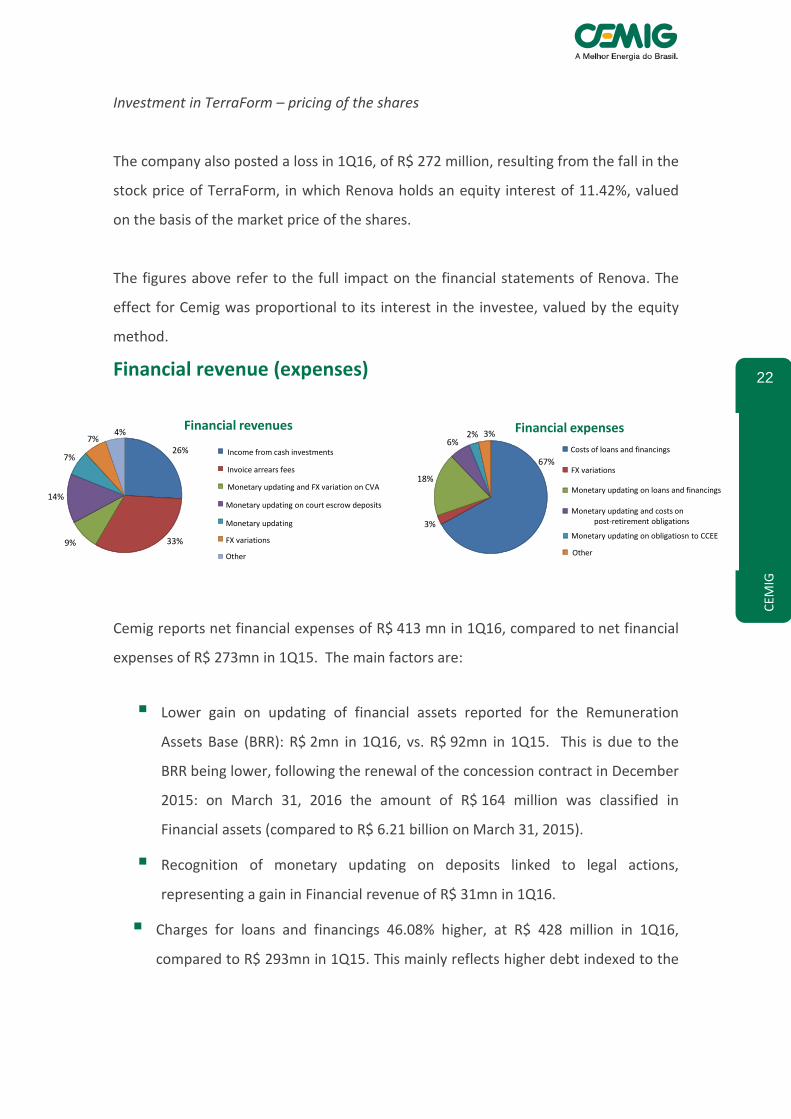
Financial revenue (expenses)
Cemig reports net financial expenses of R$ 413 mn in 1Q16, compared to net financial
expenses of R$ 273mn in 1Q15. The main factors are:
Lower gain on updating of financial assets reported for the Remuneration
Assets Base (BRR): R$ 2mn in 1Q16, vs. R$ 92mn in 1Q15. This is due to the
BRR being lower, following the renewal of the concession contract in December
2015: on March 31, 2016 the amount of R$ 164 million was classified in
Financial assets (compared to R$ 6.21 billion on March 31, 2015).
Recognition of monetary updating on deposits linked to legal actions,
representing a gain in Financial revenue of R$ 31mn in 1Q16.
Charges for loans and financings 46.08% higher, at R$ 428 million in 1Q16,
compared to R$ 293mn in 1Q15. This mainly reflects higher debt indexed to the
26%
33%9%
14%
7%
7%4%
Financial revenues
67%
3%
18%
6%2% 3% Financial expenses
Monetary updating on obligatiosn to CCEE
Income from cash investments
Invoice arrears fees
Monetary updating and FX variation on CVA
FX variations
Other
Monetary updating on court escrow deposits
Monetary updating
Costs of loans and financings
Monetary updating and costs on post-retirement obligations
FX variations
Monetary updating on loans and financings
Other

Brazil’s Best Energy
23
CEM
IG
CDI Rate; and also the higher variation provided by the CDI rate, itself, at 3,25%
in 1Q16 compared to 2.81% in 1Q15.
EBITDA
Cemig’s consolidated Ebitda in 1Q16 was 24.95% of its value in 1Q15 – a reduction of
75.05%. This mainly reflects: (i) recognition in 1Q15 of a gain of R$ 735 million from
calculation of fair value in a stockholding transaction; and (ii) much lower revenue
from wholesale transactions on the CCEE – at R$ 3 million in 1Q16, compared to R$
1.01 billion in 1Q15, due to the lower volume of supply de-contracted.
Ebitda – R$ ’000 1Q16 1Q15 Change, % Profit (loss) for the quarter 5,207 1,484,627 (99.65) + Income tax and Social Contribution tax 26,533 573,695 (95.38) + Net financial revenue (expenses) 412,558 273,450 50.87
+ Depreciation and amortization 199,033 247,121 (19.46)
= EBITDA 643,331 2,578,893 (75.05)
2,579
643
0%
10%
20%
30%
40%
50%
60%
-
500
1,000
1,500
2,000
2,500
3,000
1Q15 1Q16
Ebitda – R$ million Ebitda margin – %
Cemig Consolidated
2,161
315
0%
20%
40%
60%
80%
100%
120%
0
500
1,000
1,500
2,000
2,500
1Q15 1Q16
Ebitda – R$ million Ebitda margin – %
Cemig GT
193
236
0%
5%
10%
15%
0
50
100
150
200
250
300
1Q15 1Q16
Ebitda – R$ million Ebitda margin – %
Cemig D
24 Cemig Holding S.A. Cemig Holding S.A.
CEM
IG
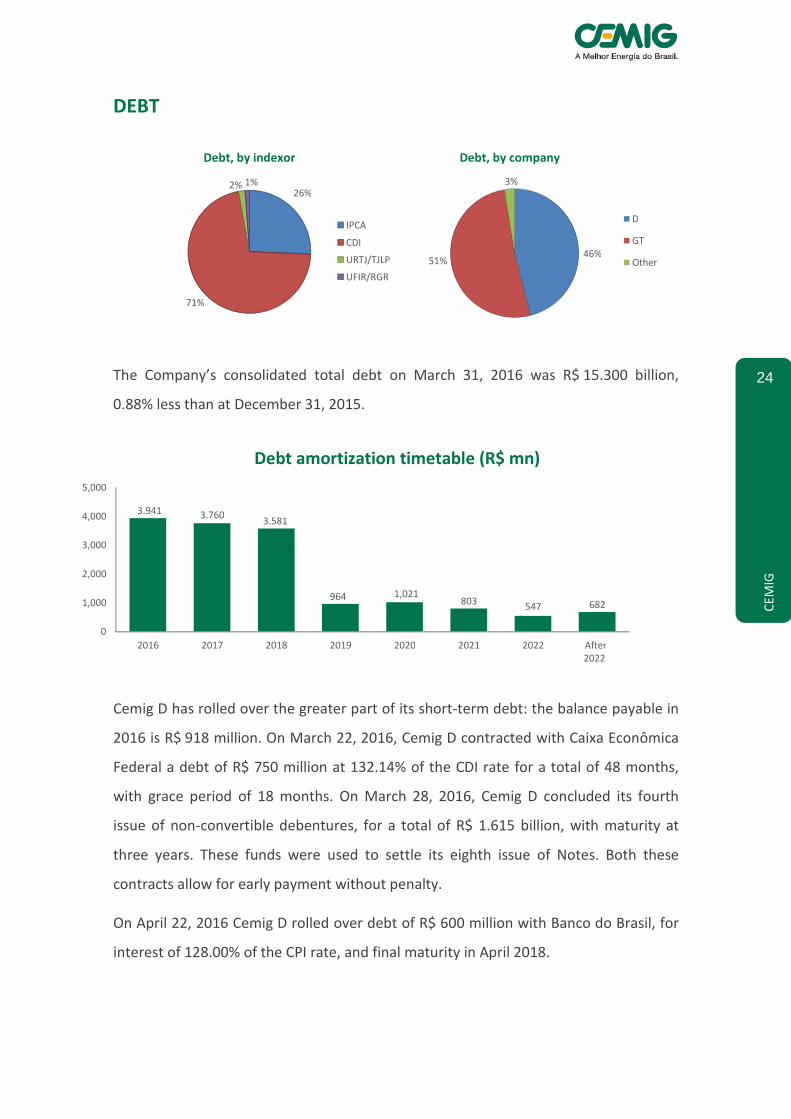
DEBT
The Company’s consolidated total debt on March 31, 2016 was R$ 15.300 billion,
0.88% less than at December 31, 2015.
Cemig D has rolled over the greater part of its short-term debt: the balance payable in
2016 is R$ 918 million. On March 22, 2016, Cemig D contracted with Caixa Econômica
Federal a debt of R$ 750 million at 132.14% of the CDI rate for a total of 48 months,
with grace period of 18 months. On March 28, 2016, Cemig D concluded its fourth
issue of non-convertible debentures, for a total of R$ 1.615 billion, with maturity at
three years. These funds were used to settle its eighth issue of Notes. Both these
contracts allow for early payment without penalty.
On April 22, 2016 Cemig D rolled over debt of R$ 600 million with Banco do Brasil, for
interest of 128.00% of the CPI rate, and final maturity in April 2018.
26%
71%
2% 1%
Debt, by indexor
IPCA
CDI
URTJ/TJLP
UFIR/RGR
46% 51%
3%
Debt, by company
D
GT
Other
3.941 3.760 3.581
964 1,021 803 547 682
0
1,000
2,000
3,000
4,000
5,000
2016 2017 2018 2019 2020 2021 2022 After 2022
Debt amortization timetable (R$ mn)
Brazil’s Best Energy
25
CEM
IG
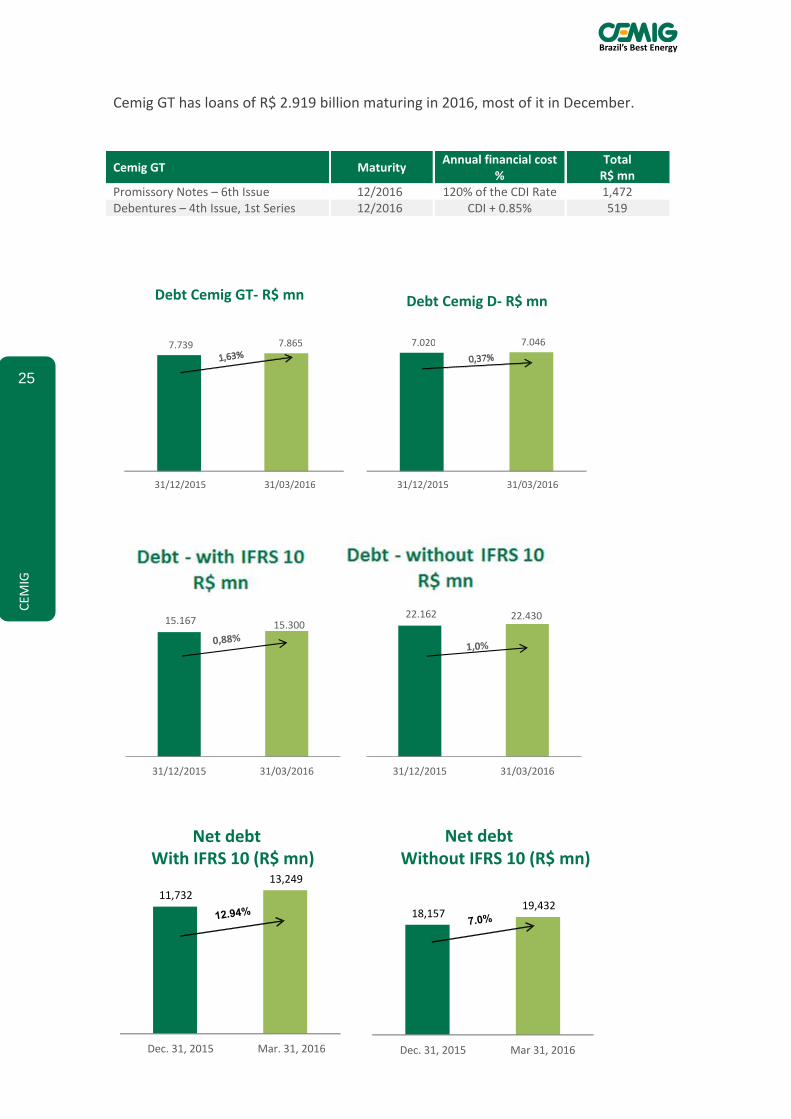
Cemig GT has loans of R$ 2.919 billion maturing in 2016, most of it in December.
Cemig GT Maturity Annual financial cost
% Total
R$ mn Promissory Notes – 6th Issue 12/2016 120% of the CDI Rate 1,472 Debentures – 4th Issue, 1st Series 12/2016 CDI + 0.85% 519
15.167 15.300
31/12/2015 31/03/2016
Evolução da Dívida-Com IFRS 10 (milhões)
22.162 22.430
31/12/2015 31/03/2016
Evolução da Dívida-Sem IFRS 10 (milhões)
11,732
13,249
Dec. 31, 2015 Mar. 31, 2016
Net debt
With IFRS 10 (R$ mn)
18,157 19,432
Dec. 31, 2015 Mar 31, 2016
Net debt
Without IFRS 10 (R$ mn)
7.739 7.865
31/12/2015 31/03/2016
Debt Cemig GT- R$ mn
7.020 7.046
31/12/2015 31/03/2016
Debt Cemig D- R$ mn

26 Cemig Holding S.A. Cemig Holding S.A.
CEM
IG
FINANCIAL STATEMENTS SEPARATED BY COMPANY AND BY OPERATIONAL SEGMENT FINANCIAL STATEMENTS SEPARATED BY COMPANY AT MARCH 31, 2016
Item Holding company
Cemig GT Cemig D Gasmig Cemig
Telecom Sá Carvalho Rosal
Other subsidiaries
Eliminations / transfers
Total, subsidiaries
Taesa Light Madeira Aliança
Generation
Other jointly-controlled
entities
Eliminations / transfers
Subsidiaries and jointly-controlled
entities
ASSETS 16,358,669 15,991,748 16,272,718 2,045,269 314,112 158,008 136,541 291,495 (10,146,584) 41,421,976 4,742,200 4,955,128 2,506,664 1,191,731 4,866,417 (8,020,814) 51,663,302
Cash and cash equivalents 43,333 441,232 595,146 57,610 1,712 5,596 4,413 43,934 - 1,192,976 262,513 243,930 14,250 187,050 180,065 - 2,080,784
Accounts receivable - 630,663 2,815,168 83,935 16,528 6,384 5,656 3,636 (17,116) 3,544,854 101,294 853,458 32,327 39,868 66,170 (15,399) 4,622,572
Securities – cash investments 87,852 247,924 344,435 52,657 17,655 13,039 10,237 83,536 - 857,335 2,213 - - - 58,212 - 917,760
Taxes 997,888 185,453 1,223,301 56,910 16,855 136 459 1,181 - 2,482,183 289,362 389,849 68,339 3,438 16,524 - 3,249,695
Other assets 1,376,835 780,902 1,690,813 470,918 5,619 4,956 1,642 33,318 (833,004) 3,531,999 42,993 639,513 160,843 63,453 509,483 42,341 4,990,625 Investments, PP&E, Intangible, and Financial assets of concession 13,852,761 13,705,574 9,603,855 1,323,239 255,743 127,897 114,134 125,890 (9,296,464) 29,812,629 4,043,825 2,828,378 2,230,905 897,922 4,035,963 (8,047,756) 35,801,866
LIABILITIES AND STOCKHOLDERS’ EQUITY 16,358,669 15,991,748 16,272,718 2,045,269 314,112 158,008 136,541 291,495 (10,146,584) 41,421,976 4,742,200 4,955,128 2,506,664 1,191,731 4,866,417 (8,020,814) 51,663,302
Suppliers and supplies 5,465 319,312 994,149 237,137 8,729 8,920 3,884 3,507 (21,690) 1,559,413 15,507 453,517 137,214 18,097 174,049 (44,938) 2,312,859
Loans, financings and debentures - 7,864,924 7,046,209 350,376 38,048 - - - - 15,299,557 1,777,201 2,366,183 1,473,947 114,824 1,398,614 - 22,430,326
Interest on Equity, and dividends 1,295,775 562,736 185,105 45,667 - 2,464 - 25,466 (821,207) 1,296,006 1 14,287 - - 22,793 (37,081) 1,296,006
Post-retirement liabilities 310,474 732,975 2,262,831 - - - - 1 - 3,306,281 - 14,491 - - - - 3,320,772
Taxes 20,918 710,994 1,696,343 301,325 10,175 38,087 2,654 10,457 - 2,790,953 833,985 393,608 41,725 18,887 94,674 - 4,173,832
Other liabilities 1,752,327 1,182,120 1,009,374 167,682 76,776 722 681 9,548 (7,240) 4,191,990 107,619 521,502 104,153 139,413 57,787 29,267 5,151,731
TOTAL EQUITY 12,973,710 4,618,687 3,078,707 943,082 180,384 107,815 129,322 242,516 (9,296,447) 12,977,776 2,007,887 1,191,540 749,625 900,510 3,118,500 (7,968,062) 12,977,776
Attributed to controlling stockholders 12,973,710 4,618,687 3,078,707 939,016 180,384 107,815 129,322 242,515 (9,265,402) 12,973,710 2,007,887 1,191,540 749,625 900,510 3,118,500 (7,968,062) 12,973,710
Interest of non-controlling stockholder - - - 4,066 - - - - - 4,066 - - - - - - 4,066
NET PROFIT (LOSS)
Net operational revenue 365 1,401,062 2,689,600 312,235 24,124 16,458 14,763 38,853 (45,800) 4,451,660 231,420 828,034 64,162 89,894 97,548 (70,326) 5,692,392
Operational costs and expenses (110,785) (983,292) (2,575,718) (275,477) (22,006) (9,457) (6,866) (7,192) 41,358 (3,949,435) (22,827) (753,981) (44,528) (41,755) (90,038) (86,506) (4,989,070)
Electricity purchased for resale - (660,318) (1,276,015) - - (1,296) (260) 122 6,406 (1,931,361) - (510,714) (3,973) (9,685) (27,450) 47,152 (2,436,031)
Charges for use of the National Grid - (73,976) (213,345) - - - (829) (84) 29,528 (258,706) - - (13,015) (4,231) (3,265) 16,164 (263,053)
Gas bought for resale - - - (237,863) - - - - - (237,863) - - - - - - (237,863)
Construction cost - (6,688) (218,594) (9,739) - - - - - (235,021) (352) (104,405) - - (267) - (340,045)
Personnel (10,082) (97,462) (288,395) (9,737) (4,728) (270) (374) (2,359) - (413,407) (12,645) (28,578) (1,813) (3,418) (16,396) - (476,257)
Post-retirement liabilities (8,642) (16,581) (49,963) - - - - - - (75,186) - - - - - - (75,186)
Materials (20) (2,228) (8,215) (297) (19) (72) (72) (75) - (10,998) (1,360) (4,900) (379) (112) (964) - (18,713)
Outsourced services (1,820) (35,505) (166,977) (2,719) (5,446) (942) (1,169) (2,082) 8,656 (208,004) (4,487) (42,348) (2,466) (6,860) (10,037) 2,350 (271,852)
Depreciation and amortization (130) (46,959) (121,845) (13,124) (8,123) (1,404) (1,093) (2,541) (3,814) (199,033) (535) (39,723) (15,688) (15,443) (17,477) (160,795) (448,694)
Operating provisions (85,534) (21,839) (144,560) - 163 - - - - (251,770) 64 (25,801) (6,173) - 623 - (283,057)
Other expenses, net (4,557) (21,736) (87,809) (1,998) (3,853) (5,473) (3,069) (173) 582 (128,086) (3,512) 2,488 (1,021) (2,006) (14,805) 8,623 (138,319) Operational profit before Equity gains (losses) and Financial revenue (expenses) (110,420) 417,770 113,882 36,758 2,118 7,001 7,897 31,661 (4,442) 502,225 208,593 74,053 19,634 48,139 7,510 (156,832) 703,322
Equity method gain (loss) 63,434 (150,174) - - (7,398) - - - 36,211 (57,927) 258 (27,811) - (904) (127,400) 169,495 (44,289)
Gain on the stockholding reorganization - - - - - - - - - - - - - - 28,868 - 28,868
Financial revenue 30,249 42,637 143,918 4,249 1,042 455 306 3,724 - 226,580 68,471 (1,599) 4,938 3,582 12,669 - 314,641
Financial expenses (9,577) (332,506) (283,675) (11,738) (1,522) (62) (9) (49) - (639,138) (134,363) (30,612) (42,173) (8,200) (46,270) - (900,756) Profit before income tax and Social Contribution tax (26,314) (22,273) (25,875) 29,269 (5,760) 7,394 8,194 35,336 31,769 31,740 142,959 14,031 (17,601) 42,617 (124,623) 12,663 101,786
Income tax and Social Contribution tax 31,433 (39,024) (1,266) (8,738) (539) (2,505) (693) (5,201) - (26,533) (32,962) (13,568) 3,116 (12,622) (14,010) - (96,579)
Profit (loss) for the period 5,119 (61,297) (27,141) 20,531 (6,299) 4,889 7,501 30,135 31,769 5,207 109,997 463 (14,485) 29,995 (138,633) 12,663 5,207
Interest of the controlling stockholders 5,119 (61,297) (27,141) 20,443 (6,299) 4,889 7,501 30,135 31,769 5,119 109,997 463 (14,485) 29,995 (138,633) 12,663 5,119
Interest of non-controlling stockholder - - - 88 - - - - - 88 - - - - - - 88
5,119 (61,297) (27,141) 20,531 (6,299) 4,889 7,501 30,135 31,769 5,207 109,997 463 (14,485) 29,995 (138,633) 12,663 5,207
Brazil’s Best Energy
27
CEM
IG
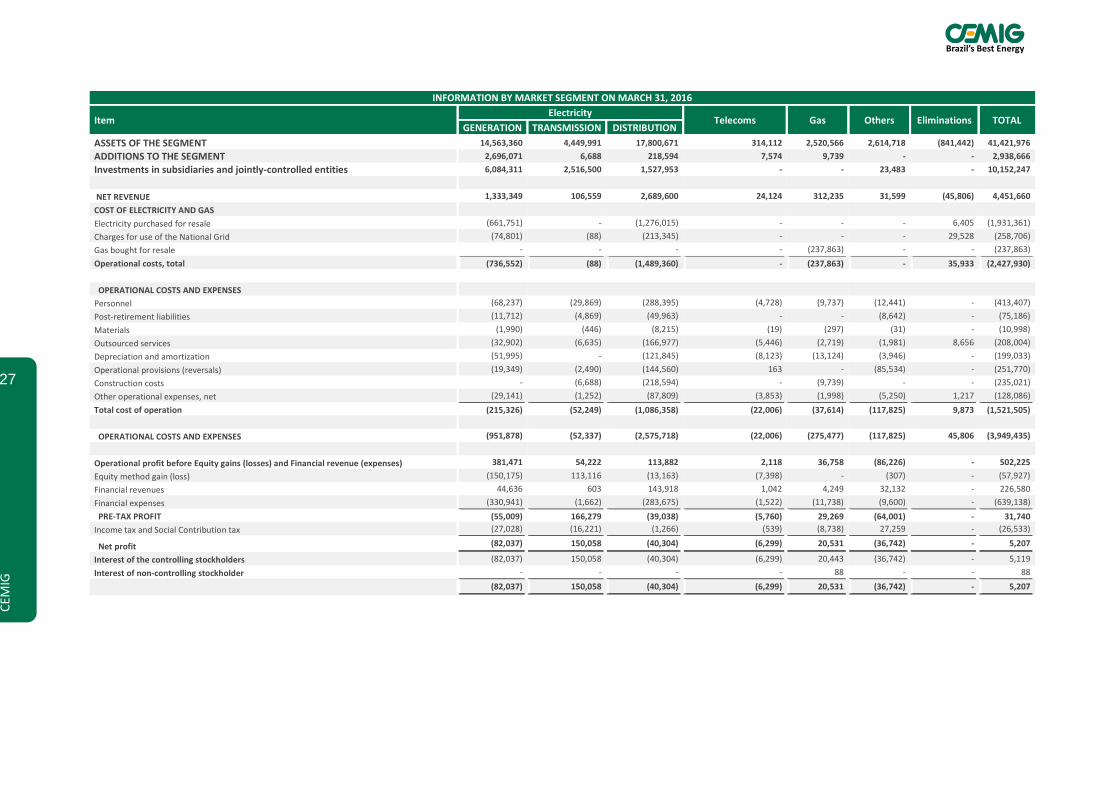
INFORMATION BY MARKET SEGMENT ON MARCH 31, 2016
Item Electricity
Telecoms Gas Others Eliminations TOTAL GENERATION TRANSMISSION DISTRIBUTION
ASSETS OF THE SEGMENT 14,563,360 4,449,991 17,800,671 314,112 2,520,566 2,614,718 (841,442) 41,421,976
ADDITIONS TO THE SEGMENT 2,696,071 6,688 218,594 7,574 9,739 - - 2,938,666
Investments in subsidiaries and jointly-controlled entities 6,084,311 2,516,500 1,527,953 - - 23,483 - 10,152,247
NET REVENUE 1,333,349 106,559 2,689,600 24,124 312,235 31,599 (45,806) 4,451,660
COST OF ELECTRICITY AND GAS
Electricity purchased for resale (661,751) - (1,276,015) - - - 6,405 (1,931,361)
Charges for use of the National Grid (74,801) (88) (213,345) - - - 29,528 (258,706)
Gas bought for resale - - - - (237,863) - - (237,863)
Operational costs, total (736,552) (88) (1,489,360) - (237,863) - 35,933 (2,427,930)
OPERATIONAL COSTS AND EXPENSES
Personnel (68,237) (29,869) (288,395) (4,728) (9,737) (12,441) - (413,407)
Post-retirement liabilities (11,712) (4,869) (49,963) - - (8,642) - (75,186)
Materials (1,990) (446) (8,215) (19) (297) (31) - (10,998)
Outsourced services (32,902) (6,635) (166,977) (5,446) (2,719) (1,981) 8,656 (208,004)
Depreciation and amortization (51,995) - (121,845) (8,123) (13,124) (3,946) - (199,033)
Operational provisions (reversals) (19,349) (2,490) (144,560) 163 - (85,534) - (251,770)
Construction costs - (6,688) (218,594) - (9,739) - - (235,021)
Other operational expenses, net (29,141) (1,252) (87,809) (3,853) (1,998) (5,250) 1,217 (128,086)
Total cost of operation (215,326) (52,249) (1,086,358) (22,006) (37,614) (117,825) 9,873 (1,521,505)
OPERATIONAL COSTS AND EXPENSES (951,878) (52,337) (2,575,718) (22,006) (275,477) (117,825) 45,806 (3,949,435)
Operational profit before Equity gains (losses) and Financial revenue (expenses) 381,471 54,222 113,882 2,118 36,758 (86,226) - 502,225
Equity method gain (loss) (150,175) 113,116 (13,163) (7,398) - (307) - (57,927)
Financial revenues 44,636 603 143,918 1,042 4,249 32,132 - 226,580
Financial expenses (330,941) (1,662) (283,675) (1,522) (11,738) (9,600) - (639,138)
PRE-TAX PROFIT (55,009) 166,279 (39,038) (5,760) 29,269 (64,001) - 31,740
Income tax and Social Contribution tax (27,028) (16,221) (1,266) (539) (8,738) 27,259 - (26,533)
Net profit (82,037) 150,058 (40,304) (6,299) 20,531 (36,742) - 5,207
Interest of the controlling stockholders (82,037) 150,058 (40,304) (6,299) 20,443 (36,742) - 5,119
Interest of non-controlling stockholder - - - - 88 - - 88
(82,037) 150,058 (40,304) (6,299) 20,531 (36,742) - 5,207
28 Cemig Holding S.A. Cemig Holding S.A.
CEM
IG
Mining and Energy Ministry Ministerial Order 120
The Mining and Energy Ministry, through its Ministerial Order 120, of April 20, 2016,
has set the criteria for indemnity of transmission assets. It states that the amounts that
are approved shall be received in a period of eight years as from the 2017 tariff
adjustment, and will be updated by the variation in the IPCA inflation index, and
remunerated on the basis of the specific cost of capital of the transmission segment as
defined by Aneel in the processes of periodic Tariff Review, estimated at 10.44% p.a.
The Companies in the sector are in the process of obtaining more detailed
explanations from the regulator on the criteria related to monetary updating and
receipt of the indemnity.
The Valuation Opinion delivered to Aneel on July 31, 2014 represented an indemnity to
the Company of R$ 1.169 billion, at the base date of December 31, 2012.
On February 23, 2015, Aneel sent the Company the Report of Inspection with the
preliminary review of the Opinion sent by the Company, corresponding to a price of
R$ 1.157 billion, of which R$ 285 million was received in the first quarter of 2013 – the
remaining balance being R$ 872 million. Updating of this amount by the IGP–M
inflation index to March 31, 2016 results in the amount of R$ 1.085 billion (R$ 1.054
billion at December 31, 2015).
Cemig GT is still in process of assessing the effects of the Ministerial Order, and has an
estimate of an impact of approximately R$ 500 million in financial revenue – which will
be posted in the second quarter of 2016.

Brazil’s Best Energy
29
CEM
IG
Generating plants

30 Cemig Holding S.A. Cemig Holding S.A.
CEM
IG
Generation: Annual Permitted Revenue (RAP)
Receita Anual Permitida - RAP RAP % CemigCemig
ConsolidadoCemig GT
Cemig GT 234.340.198 100,0% 234.340.198 234.340.198
Cemig Itajuba 36.345.194 100,0% 36.345.194 36.345.194
Centroeste 15.420.427 51,0% 7.864.418
Transirapé 26.287.112 24,5% 6.440.342
Transleste 36.163.304 25,0% 9.040.826
Transudeste 22.414.358 24,0% 5.379.446
Taesa 43,36%
ETEO 155.851.060 43,4% 67.576.823
ETAU 38.433.513 22,8% 8.762.945
NOVATRANS 460.994.392 43,4% 199.886.586
TSN 449.086.299 43,4% 194.723.252
GTESA 8.238.429 43,4% 3.572.172
PATESA 18.930.852 43,4% 8.208.394
Munirah 32.335.023 43,4% 14.020.425
Brasnorte 22.865.011 16,8% 3.833.291
São Gotardo 4.594.930 43,4% 1.992.356
Abengoa
NTE 135.672.013 43,4% 58.827.214
STE 72.452.041 43,4% 31.415.113
ATEI 132.046.398 43,4% 57.255.152
ATEII 204.000.305 43,4% 88.454.275
ATEIII 102.659.854 43,4% 44.513.183
TBE
EATE 381.289.719 21,7% 82.634.235
STC 36.934.709 17,3% 6.403.873
Lumitrans 23.591.101 17,3% 4.090.187
ENTE 199.517.005 21,7% 43.245.595
ERTE 44.785.760 21,7% 9.706.942
ETEP 86.906.931 21,7% 18.835.509
ECTE 84.200.833 8,3% 6.970.657
EBTE 40.614.511 32,3% 13.118.164
ESDE 11.542.416 21,7% 2.501.610
ETSE 19.741.437 8,3% 1.634.316
Light 7.924.732 32,6% 2.581.878
Transchile** 21.396.000 49,0% 10.484.040
RAP TOTAL CEMIG 1.284.658.610 270.685.392
Resolução Homologatoria ANEEL - nº 1.313*
* Receitas anuais permititidas com vigência entre 1º de julho de 2015 e 30 de junho de 2016.
** A receita de transmissão da Transchile é dada em Dólar Norte Americano e é corrigida, anualmente, de acordo com o Decreto Nº
163 (http://www.cne.cl/images/stories/normativas/otros%20niveles/electricidad/DOC65_-_decreto163obrasurgentes.pdf).
Brazil’s Best Energy
31
CEM
IG
DEFAULT
In 2015, to achieve economic and financial equilibrium for the companies of the sector,
and synchronization between tariffs and the real variable costs of electricity, Aneel
implemented the system of ‘Tariff Flags’, and also enacted an Extraordinary Tariff
Increase, in March. These measures had an impact on electricity rates, involving as it
did a pass-through of costs to final consumers.
In this context of an exceptional increase in electricity rates, Cemig has seen an
increase in amounts invoiced that are not paid by final consumers, and this has
resulted in growth in the stock of debt to levels higher than the average of recent
months.
The average level of default during the month of January 2016 was 25% higher than in
January 2015. This increased percentage of default has had a negative effect on the
Company’s cash flow.
Due to the present economic context, default has remained at a level that is high for
the Company. The rate of default in January was 3.91%.
The Company uses various tools of communication and collection to prevent increase
in default. These include telephone contact, sending of e-mails, use of text messages,
and collection letters. We are also making efforts with the credit protection services –
Serasa (Serviço de Proteção ao Crédito) and CDL (Câmara de Dirigentes Lojistas) – to
register these arrears on their records for defaulting clients; and we are also applying
disconnection of supply. Aneel Resolution 414 allows supply to be cut off after 15 days
from receipt of a notice to the defaulting consumer.

32 Cemig Holding S.A. Cemig Holding S.A.
CEM
IG
Appendices
Cemig D Tables (R$ million)
GW
Quarter Captive Consumers TUSD ENERGY1 T.E.D2 TUSD PICK3
4Q13 6.615 4.975 11.591 29
1Q14 6.744 4.464 11.208 29
2Q14 6.646 4.485 11.132 29
3Q14 6.686 4.298 10.984 27
4Q14 6.935 4.201 11.136 29
1Q15 6.780 4.034 10.814 30
2Q15 6.371 3.896 10.268 28
3Q15 6.471 3.803 10.274 29
4Q15 6.850 3.937 10.787 28
1Q16 6.408 4.053 10.460 29
1. Refers to the quantity of electricity for calculation of the regulatory charges charged to free consumer clients ("Portion A")
2. Total electricity distributed
3. Sum of the demand on w hich the TUSD is invoiced, according to demand contracted ("Portion B").
CEMIG D Market
(GWh)
Operating Revenues 1Q16 1Q15 Change%
Sales to end consumers 4.331 3.389 28
TUSD 417 226 84
CVA and Other financial components in tariff adjustment (132) 550 (124)
Construction revenue 219 203 8
Others 297 248 20
Subtotal 5.131 4.616 11
Deductions (2.442) (1.551) 57
Net Revenues 2.690 3.065 (12)
Operating Expenses 1Q16 1Q15 Change%
Personnel/Administrators/Councillors 288 228 26
Employee Participation - 62 -
Forluz – Post-Retirement Employee Benefits 50 42 20
Materials 8 10 (16)
Contracted Services 167 157 6
Purchased Energy 1.276 1.838 (31)
Depreciation and Amortization 122 112 9
Operating Provisions 145 40 260
Charges for Use of Basic Transmission Network 213 195 9
Cost from Operation 219 203 8
Other Expenses 88 98 (10)
Total 2.576 2.984 (14)

Brazil’s Best Energy
33
CEM
IG
Cemig GT Tables (R$ million)
Statement of Results 1Q16 1Q15 Change%
Net Revenue 2.690 3.065 (12)
Operating Expenses 2.576 2.984 (14)
EBIT 114 81 40
EBITDA 236 193 22
Financial Result (140) (65) 117
Provision for Income Taxes, Social Cont & Deferred Income (1) (11) (89)
Net Income (27) 5 -
Operating Revenues 1Q16 1Q15 Change%
Sales to end consumers 945 913 3
Supply 592 808 (27)
Gain on monetary updating of Concession Grant Fee 81 - -
Transactions in the CCEE 4 1.000 (100)
Revenues from Trans. Network 94 80 18
Construction revenue 7 31 (78)
Transmission indemnity revenue 31 - -
Others 6 5 28
Subtotal 1.760 2.837 (38)
Deductions (359) (434) (17)
Net Revenues 1.401 2.403 (42)
Operating Expenses 1Q16 1Q15 Change%
Personnel/Administrators/Councillors 97 83 17
Employee Participation - 15 -
Forluz – Post-Retirement Employee Benefits 17 13 31
Materials 2 3 (34)
Raw Materials and Supplies Energy Production - 78 (100)
Contracted Services 36 32 11
Depreciation and Amortization 47 76 (38)
Operating Reserves 22 (5) -
Charges for Use of Basic Transmission Network 74 72 2
Purchased Energy 660 608 9
Construction Cost 7 31 (78)
Other Expenses 22 9 131
Total 983 1.015 (3)
34 Cemig Holding S.A. Cemig Holding S.A.
CEM
IG
Cemig Tables (R$ million)
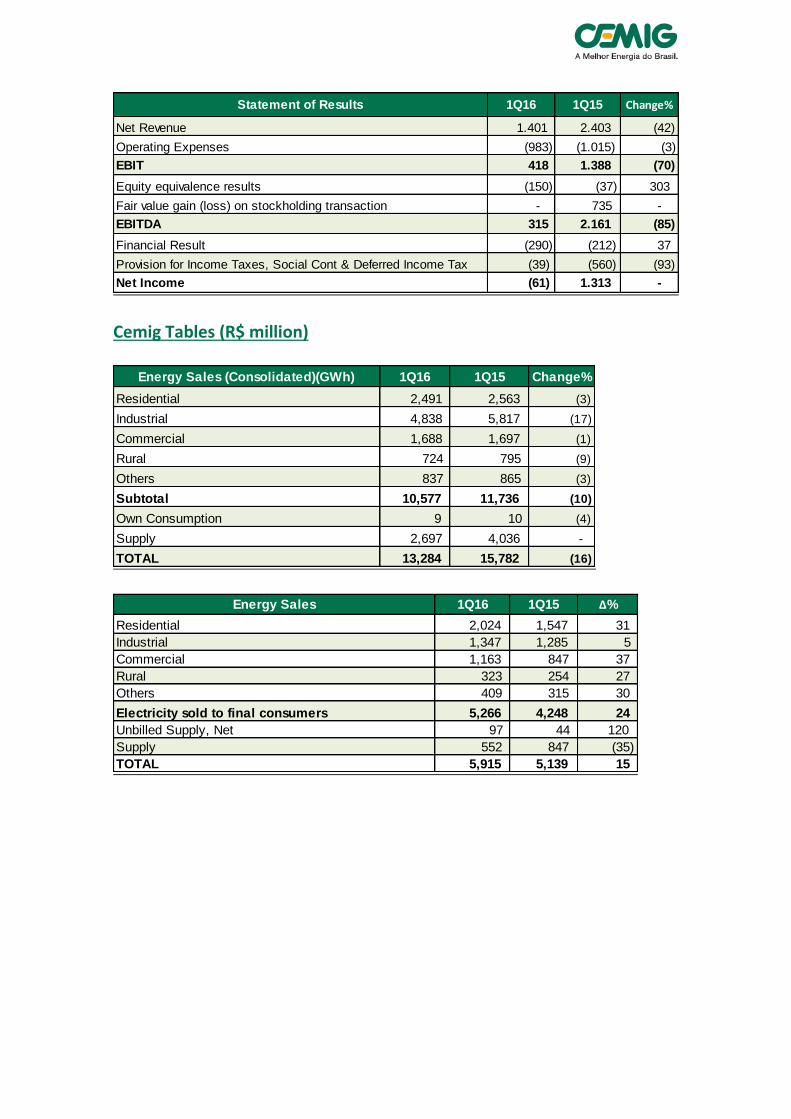
Statement of Results 1Q16 1Q15 Change%
Net Revenue 1.401 2.403 (42)
Operating Expenses (983) (1.015) (3)
EBIT 418 1.388 (70)
Equity equivalence results (150) (37) 303
Fair value gain (loss) on stockholding transaction - 735 -
EBITDA 315 2.161 (85)
Financial Result (290) (212) 37
Provision for Income Taxes, Social Cont & Deferred Income Tax (39) (560) (93)
Net Income (61) 1.313 -
Energy Sales (Consolidated)(GWh) 1Q16 1Q15 Change%
Residential 2,491 2,563 (3)
Industrial 4,838 5,817 (17)
Commercial 1,688 1,697 (1)
Rural 724 795 (9)
Others 837 865 (3)
Subtotal 10,577 11,736 (10)
Own Consumption 9 10 (4)
Supply 2,697 4,036 -
TOTAL 13,284 15,782 (16)
Energy Sales 1Q16 1Q15 Δ%
Residential 2,024 1,547 31
Industrial 1,347 1,285 5
Commercial 1,163 847 37
Rural 323 254 27
Others 409 315 30
Electricity sold to final consumers 5,266 4,248 24
Unbilled Supply, Net 97 44 120
Supply 552 847 (35)
TOTAL 5,915 5,139 15

Brazil’s Best Energy
35
CEM
IG
Operating Revenues 1Q16 1Q15 Δ%
Sales to end consumers 5,307 4,292 24
TUSD 409 210 95
Supply 608 848 (28)
Transactions in the CCEE 3 1,011 (100)
CVA and Other financial components in tariff adjustment (132) 550 -
Gain on monetary updating of Concession Grant Fee 81 - -
Revenues from Trans. Network 73 63 16
Construction revenue 235 234 1
Gas supply 379 426 (11)
Transmission Indemnity Revenue 31 - -
Others 361 309 17
Subtotal 7,354 7,942 (7)
Deductions (2,903) (2,092) 39
Net Revenues 4,452 5,849 (24)
Operating Expenses 1Q16 1Q15 Δ%
Personnel/Administrators/Councillors 413 336 23
Employee Participation - 81 -
Forluz – Post-Retirement Employee Benefits 75 58 31
Materials 11 14 (21)
Raw materials and inputs for production of electricity - 78 -
Contracted Services 208 199 5
Purchased Energy 1,931 2,421 (20)
Depreciation and Amortization 199 247 (19)
Operating Provisions 252 43 483
Charges for Use of Basic Transmission Network 259 241 7
Gas bought for resale 238 262 (9)
Cost from Operation 235 234 1
Other Expenses 128 128 -
TOTAL 3,949 4,342 (9)
36 Cemig Holding S.A. Cemig Holding S.A.
CEM
IG
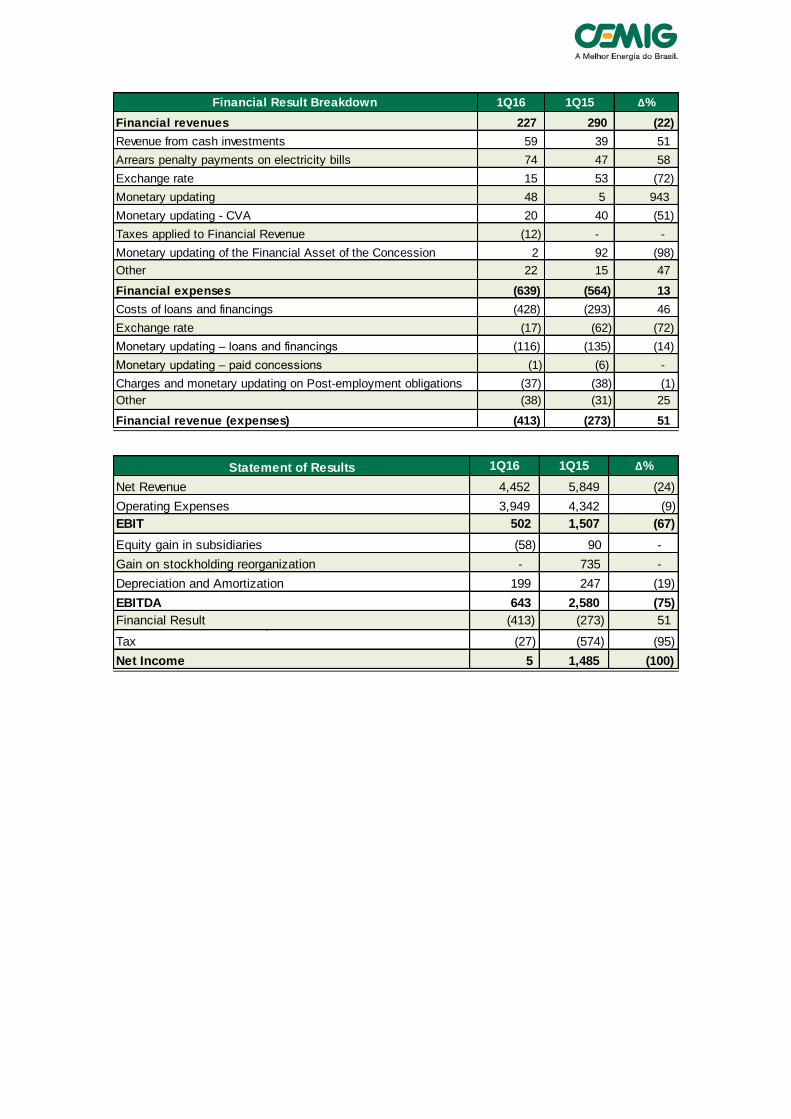
Financial Result Breakdown 1Q16 1Q15 Δ%
Financial revenues 227 290 (22)
Revenue from cash investments 59 39 51
Arrears penalty payments on electricity bills 74 47 58
Exchange rate 15 53 (72)
Monetary updating 48 5 943
Monetary updating - CVA 20 40 (51)
Taxes applied to Financial Revenue (12) - -
Monetary updating of the Financial Asset of the Concession 2 92 (98)
Other 22 15 47
Financial expenses (639) (564) 13
Costs of loans and financings (428) (293) 46
Exchange rate (17) (62) (72)
Monetary updating – loans and financings (116) (135) (14)
Monetary updating – paid concessions (1) (6) -
Charges and monetary updating on Post-employment obligations (37) (38) (1)
Other (38) (31) 25
Financial revenue (expenses) (413) (273) 51
Statement of Results 1Q16 1Q15 Δ%
Net Revenue 4,452 5,849 (24)
Operating Expenses 3,949 4,342 (9)
EBIT 502 1,507 (67)
Equity gain in subsidiaries (58) 90 -
Gain on stockholding reorganization - 735 -
Depreciation and Amortization 199 247 (19)
EBITDA 643 2,580 (75)
Financial Result (413) (273) 51 Provision for Income Taxes, Social Cont & Deferred Income
Tax (27) (574) (95)
Net Income 5 1,485 (100)
Brazil’s Best Energy
37
CEM
IG
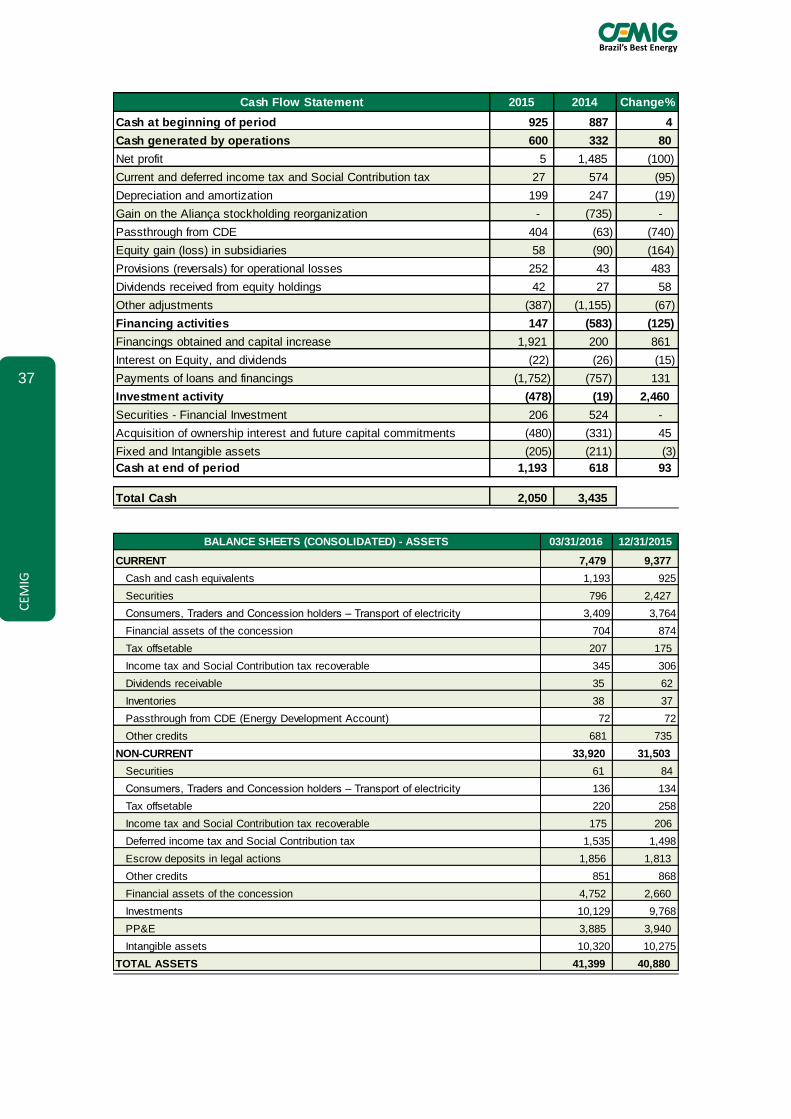
Cash Flow Statement 2015 2014 Change%
Cash at beginning of period 925 887 4
Cash generated by operations 600 332 80
Net profit 5 1,485 (100)
Current and deferred income tax and Social Contribution tax 27 574 (95)
Depreciation and amortization 199 247 (19)
Gain on the Aliança stockholding reorganization - (735) -
Passthrough from CDE 404 (63) (740)
Equity gain (loss) in subsidiaries 58 (90) (164)
Provisions (reversals) for operational losses 252 43 483
Dividends received from equity holdings 42 27 58
Other adjustments (387) (1,155) (67)
Financing activities 147 (583) (125)
Financings obtained and capital increase 1,921 200 861
Interest on Equity, and dividends (22) (26) (15)
Payments of loans and financings (1,752) (757) 131
Investment activity (478) (19) 2,460
Securities - Financial Investment 206 524 -
Acquisition of ownership interest and future capital commitments (480) (331) 45
Fixed and Intangible assets (205) (211) (3)
Cash at end of period 1,193 618 93
Total Cash 2,050 3,435
BALANCE SHEETS (CONSOLIDATED) - ASSETS 03/31/2016 12/31/2015
CURRENT 7,479 9,377
Cash and cash equivalents 1,193 925
Securities 796 2,427
Consumers, Traders and Concession holders – Transport of electricity 3,409 3,764
Financial assets of the concession 704 874
Tax offsetable 207 175
Income tax and Social Contribution tax recoverable 345 306
Dividends receivable 35 62
Inventories 38 37
Passthrough from CDE (Energy Development Account) 72 72
Other credits 681 735
NON-CURRENT 33,920 31,503
Securities 61 84
Consumers, Traders and Concession holders – Transport of electricity 136 134
Tax offsetable 220 258
Income tax and Social Contribution tax recoverable 175 206
Deferred income tax and Social Contribution tax 1,535 1,498
Escrow deposits in legal actions 1,856 1,813
Other credits 851 868
Financial assets of the concession 4,752 2,660
Investments 10,129 9,768
PP&E 3,885 3,940
Intangible assets 10,320 10,275
TOTAL ASSETS 41,399 40,880
38 Cemig Holding S.A. Cemig Holding S.A.
CEM
IG
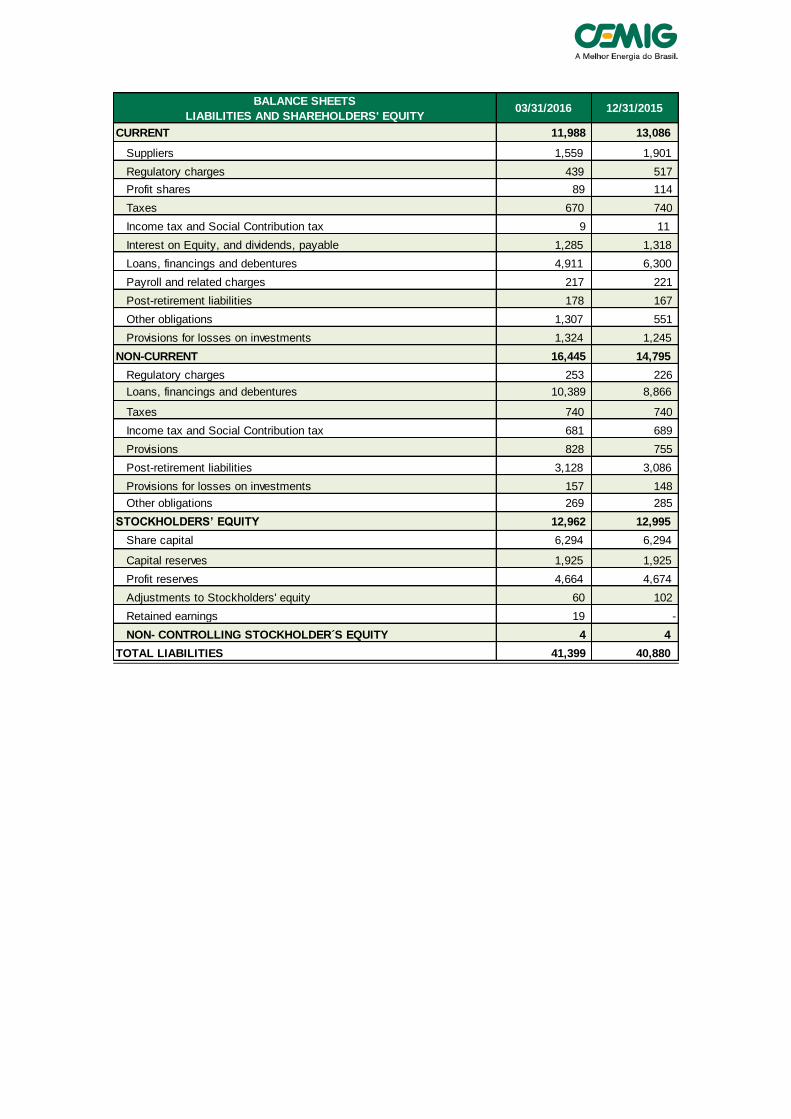
BALANCE SHEETS
LIABILITIES AND SHAREHOLDERS' EQUITY03/31/2016 12/31/2015
CURRENT 11,988 13,086
Suppliers 1,559 1,901
Regulatory charges 439 517
Profit shares 89 114
Taxes 670 740
Income tax and Social Contribution tax 9 11
Interest on Equity, and dividends, payable 1,285 1,318
Loans, financings and debentures 4,911 6,300
Payroll and related charges 217 221
Post-retirement liabilities 178 167
Other obligations 1,307 551
Provisions for losses on investments 1,324 1,245
NON-CURRENT 16,445 14,795
Regulatory charges 253 226
Loans, financings and debentures 10,389 8,866
Taxes 740 740
Income tax and Social Contribution tax 681 689
Provisions 828 755
Post-retirement liabilities 3,128 3,086
Provisions for losses on investments 157 148
Other obligations 269 285
STOCKHOLDERS’ EQUITY 12,962 12,995
Share capital 6,294 6,294
Capital reserves 1,925 1,925
Profit reserves 4,664 4,674
Adjustments to Stockholders' equity 60 102
Retained earnings 19 -
NON- CONTROLLING STOCKHOLDER´S EQUITY 4 4
TOTAL LIABILITIES 41,399 40,880