public works - anchorage, alaska gg… · o the project management & engineering division...
TRANSCRIPT

Watershed Management
Communications
FacilityMaintenance
FleetMaintenance
ProjectManagement
StreetMaintenance
Other Service Areas (SA)
Public Art
Project Management
Survey
Public Works
Geotechnical Services
Administration
Finance
Data
Safety
Signals
Public Works
Design
Municipal Manager
EngineeringMaintenance and
OperationsAdministration Traffic
2015 Approved General Government Operating Budget
PW - 1

Public Works The Public Works Department was created in 2010, to deliver better service to customers, by combining the following departments: Maintenance & Operations Project Management & Engineering (except Private Development) Traffic (except Transportation Planning) Community Planning & Development (1% for Arts) Development Services (Director and Admin)
Description Public Works mission is to ensure the integrity and reliability of the Municipality of Anchorage's infrastructure through our Project Management & Engineering, Traffic, Maintenance & Operations, and Administration Divisions. Department Services/Divisions Project Management & Engineering Division
o The Project Management & Engineering Division delivers completed Public Works projects to meet the needs of our community. Our engineers perform all aspects of engineering and design for planning and construction of roads, sidewalks, storm drains, trails, and parks. Street designs include new construction and reconstruction, curbing and gutters, traffic signals, signage, and street lighting. Other key responsibilities of the Division include storm water run-off management, flood hazard reviews, right-of-way acquisition for municipal projects, and administration of Road Improvement District projects.
Traffic Division
o The Traffic Division promotes and ensures safe and efficient transportation. Responsibilities encompass the day-to-day operation of Anchorage's traffic signals and street signs. The Traffic Division provides services that move people and goods on city roads and pedestrian systems. We focus on addressing neighborhood traffic concerns and operations that maximize public safety.
The Maintenance and Operations Division
o The Maintenance and Operations Division performs a major portion of the maintenance needs on municipally-owned properties throughout Anchorage. Activities include street maintenance including snow removal, facility maintenance, fleet maintenance, communications, managing facility capital improvement projects, and a variety of other maintenance needs.
o Street Maintenance is one of the biggest and most costly responsibilities of Municipal government. It's also one of the most necessary. The Street Maintenance Division must keep approximately 1,300 lane miles of streets at an adequate level of service and safety. An important function of Street Maintenance is to provide snow and ice removal to ensure a safe and accessible transportation system during winter months.
o Facility Maintenance provides the maintenance of over 164 municipal buildings and over 211 parks. Maintenance responsibility includes all facets of building maintenance including HVAC, carpentry, electrical, plumbing, mechanical, welding, painting, graffiti removal, and roof repairs.
2015 Approved General Government Operating Budget
PW - 2

o Fleet Maintenance provides essential maintenance and repairs for 578 Municipal vehicles and equipment, to include the Anchorage Police Department fleet of an additional 455 vehicles.
o Communications & Electronics provides expertise to ensure that public safety communications and electronic systems are fully functional for all Municipal agencies. Some of the supported systems are the Police and Fire 911 Centers, 12 microwave radio sites, mobile computer systems used by Police, Fire and Transit, 250 automatic defibrillators and nearly 3,000 mobile and portable two-way radios.
o Capital Projects provides project management services on major general government building renovations and new construction capital projects. This section is responsible for new construction such as the Mt. View Library, fire stations, and Eagle River Town Center. They are also responsible for all maintenance projects, which include things such as roof replacement, lighting, fire control systems, painting, heating, and any other miscellaneous projects related to facilities.
Administration Division o The Public Works Administration Division is responsible for performing essential
support tasks for administration of projects, personnel, finance, and budget issues. The Division is also the home of the Curator of Art for Public Spaces, and management of the 1% for Art Program. Division staff manages the Capital Improvements Program, the Adopt-a-Road Program, and Limited Road Service Areas (LRSA).
Department Goals that Contribute to Achieving the Mayor’s Vision: Vision: A Safe Place to Call Home
Public Works Department - Maintenance and Operations Division Complete declared plow-outs within 72 hours of a snowfall four inches or more within
Anchorage Roads and Drainage Service Area (ARDSA) Repair reported potholes within 24 hours within ARDSA
Vision: A Flourishing, Broad-Based and Sustainable Economy
Public Works Department - Traffic Division
Continuous improvement in the safe and efficient movement of people and goods Traffic operation improvements that maximize transportation safety and system efficiency
Public Works Department – Maintenance & Operations Division Annually inspect and clean “as required” all storm drain structures per Alaska Pollution
Discharge Elimination System (APDES) Phase II permit within ARDSA
Vision: Exemplary Municipal Operations Public Works Department - Engineering Division Design capital improvement projects that are cost-effective and maintenance-friendly
2015 Approved General Government Operating Budget
PW - 3

Direct Cost by DivisionPW Administration 1,982,301 2,221,876 2,074,978 <6.61%>
PW Engineering 6,358,606 6,360,424 6,539,425 2.81%
PW Maintenance & Operations 83,097,162 84,339,630 84,403,829 0.08%
PW Other Service Areas 10,257,056 11,300,414 10,463,586 <7.41%>
PW Traffic Engineer 4,677,424 4,655,218 4,871,360 4.64%
Direct Cost Total 106,372,549 108,877,563 108,353,179 <0.48%>
Intragovernmental ChargesCharges by/to Other Departments (18,387,450) (19,700,431) (19,526,943) <0.88%>
Function Cost Total 87,985,098 89,177,132 88,826,236 <0.39%>
Program Generated Revenue (3,536,613) (3,356,900) (3,356,901) -
Net Cost Total 84,448,485 85,820,232 85,469,335 <0.41%>
Direct Cost by Category
Salaries and Benefits 30,402,208 30,719,872 31,346,340 2.04%
Supplies 3,740,178 3,846,835 3,846,835 -
Travel 3,234 10,170 10,170 -
Contractual/OtherServices 31,100,886 31,824,123 30,147,185 <5.27%>
Debt Service 40,905,074 42,403,943 42,930,029 1.24%
Depreciation/Amortization 7,474 - - -
Equipment, Furnishings 213,495 72,620 72,620 -
Direct Cost Total 106,372,549 108,877,563 108,353,179 <0.48%>
Position Summary as Budgeted
Full-Time 238 238 237
Part-Time 40 23 24
Position Total 278 261 261
Public WorksDepartment Summary
2014Revised
2015Approved
2013Actuals
15 v 14% Chg
2015 Approved General Government Operating Budget
PW - 4
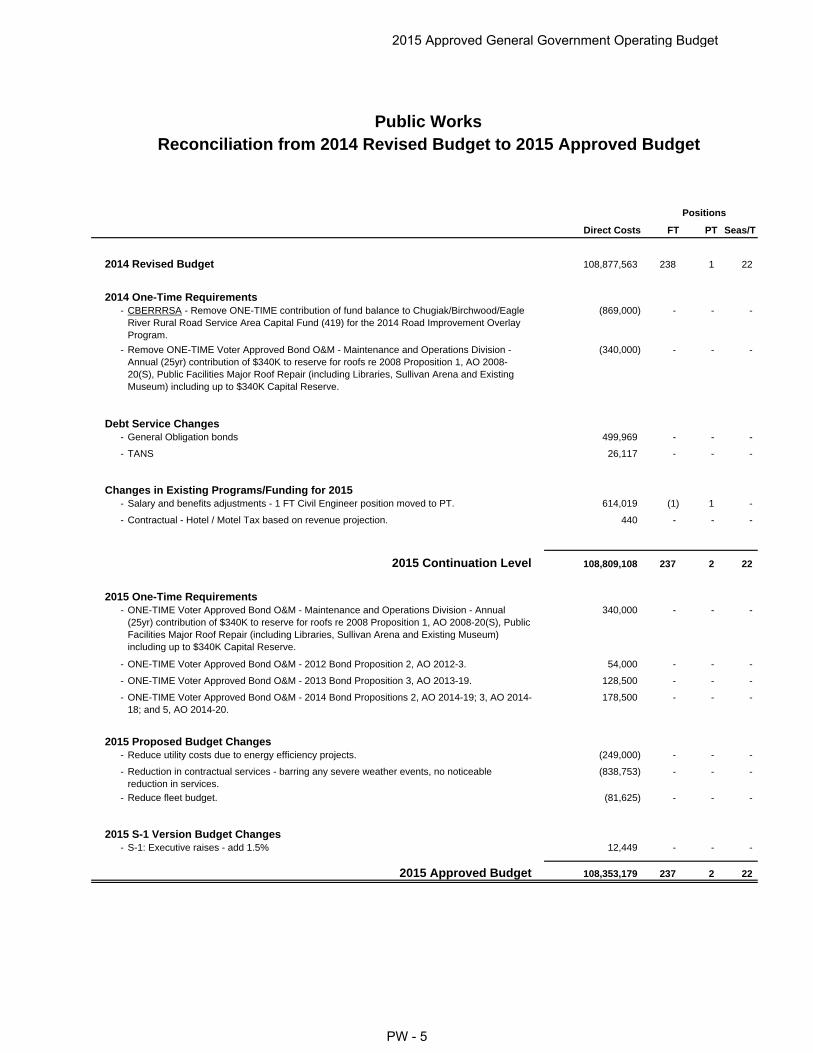
Direct Costs FT PT Seas/T
108,877,563 238 1 22
- CBERRRSA - Remove ONE-TIME contribution of fund balance to Chugiak/Birchwood/Eagle River Rural Road Service Area Capital Fund (419) for the 2014 Road Improvement Overlay Program.
(869,000) - - -
- Remove ONE-TIME Voter Approved Bond O&M - Maintenance and Operations Division - Annual (25yr) contribution of $340K to reserve for roofs re 2008 Proposition 1, AO 2008-20(S), Public Facilities Major Roof Repair (including Libraries, Sullivan Arena and Existing Museum) including up to $340K Capital Reserve.
(340,000) - - -
- General Obligation bonds 499,969 - - -
- TANS 26,117 - - -
- Salary and benefits adjustments - 1 FT Civil Engineer position moved to PT. 614,019 (1) 1 -
- Contractual - Hotel / Motel Tax based on revenue projection. 440 - - -
108,809,108 237 2 22
- ONE-TIME Voter Approved Bond O&M - Maintenance and Operations Division - Annual (25yr) contribution of $340K to reserve for roofs re 2008 Proposition 1, AO 2008-20(S), Public Facilities Major Roof Repair (including Libraries, Sullivan Arena and Existing Museum) including up to $340K Capital Reserve.
340,000 - - -
- ONE-TIME Voter Approved Bond O&M - 2012 Bond Proposition 2, AO 2012-3. 54,000 - - -
- ONE-TIME Voter Approved Bond O&M - 2013 Bond Proposition 3, AO 2013-19. 128,500 - - -
- ONE-TIME Voter Approved Bond O&M - 2014 Bond Propositions 2, AO 2014-19; 3, AO 2014-18; and 5, AO 2014-20.
178,500 - - -
- Reduce utility costs due to energy efficiency projects. (249,000) - - -
- Reduction in contractual services - barring any severe weather events, no noticeable reduction in services.
(838,753) - - -
- Reduce fleet budget. (81,625) - - -
- S-1: Executive raises - add 1.5% 12,449 - - -
2015 Approved Budget 108,353,179 237 2 22
2015 Proposed Budget Changes
2015 Continuation Level
2015 One-Time Requirements
2015 S-1 Version Budget Changes
Public Works
Debt Service Changes
Changes in Existing Programs/Funding for 2015
2014 Revised Budget
Reconciliation from 2014 Revised Budget to 2015 Approved Budget
Positions
2014 One-Time Requirements
2015 Approved General Government Operating Budget
PW - 5
2013Actuals
2014Revised
2015Approved
15 v 14% Chg
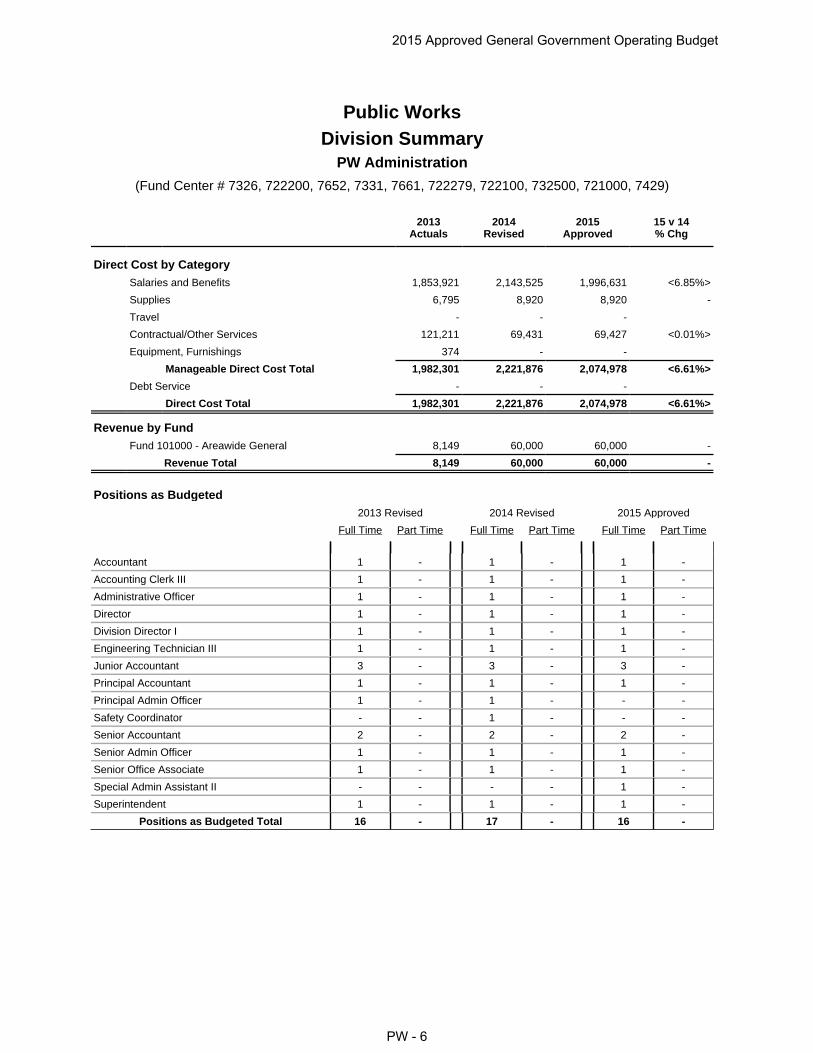
Direct Cost by CategorySalaries and Benefits 1,853,921 2,143,525 1,996,631 <6.85%>
Supplies 6,795 8,920 8,920 -
Travel - - -
Contractual/Other Services 121,211 69,431 69,427 <0.01%>
Equipment, Furnishings 374 - -
Manageable Direct Cost Total 1,982,301 2,221,876 2,074,978 <6.61%>
Debt Service - - -
Direct Cost Total 1,982,301 2,221,876 2,074,978 <6.61%>
Revenue by FundFund 101000 - Areawide General 8,149 60,000 60,000 -
Revenue Total 8,149 60,000 60,000 -
Positions as Budgeted2013 Revised 2014 Revised 2015 Approved
Full Time Part Time Full Time Part Time Full Time Part Time
Accountant 1 - 1 - 1 -
Accounting Clerk III 1 - 1 - 1 -
Administrative Officer 1 - 1 - 1 -
Director 1 - 1 - 1 -
Division Director I 1 - 1 - 1 -
Engineering Technician III 1 - 1 - 1 -
Junior Accountant 3 - 3 - 3 -
Principal Accountant 1 - 1 - 1 -
Principal Admin Officer 1 - 1 - - -
Safety Coordinator - - 1 - - -
Senior Accountant 2 - 2 - 2 -
Senior Admin Officer 1 - 1 - 1 -
Senior Office Associate 1 - 1 - 1 -
Special Admin Assistant II - - - - 1 -
Superintendent 1 - 1 - 1 -
Positions as Budgeted Total 16 - 17 - 16 -
Public WorksDivision Summary
(Fund Center # 7326, 722200, 7652, 7331, 7661, 722279, 722100, 732500, 721000, 7429)
PW Administration
2015 Approved General Government Operating Budget
PW - 6
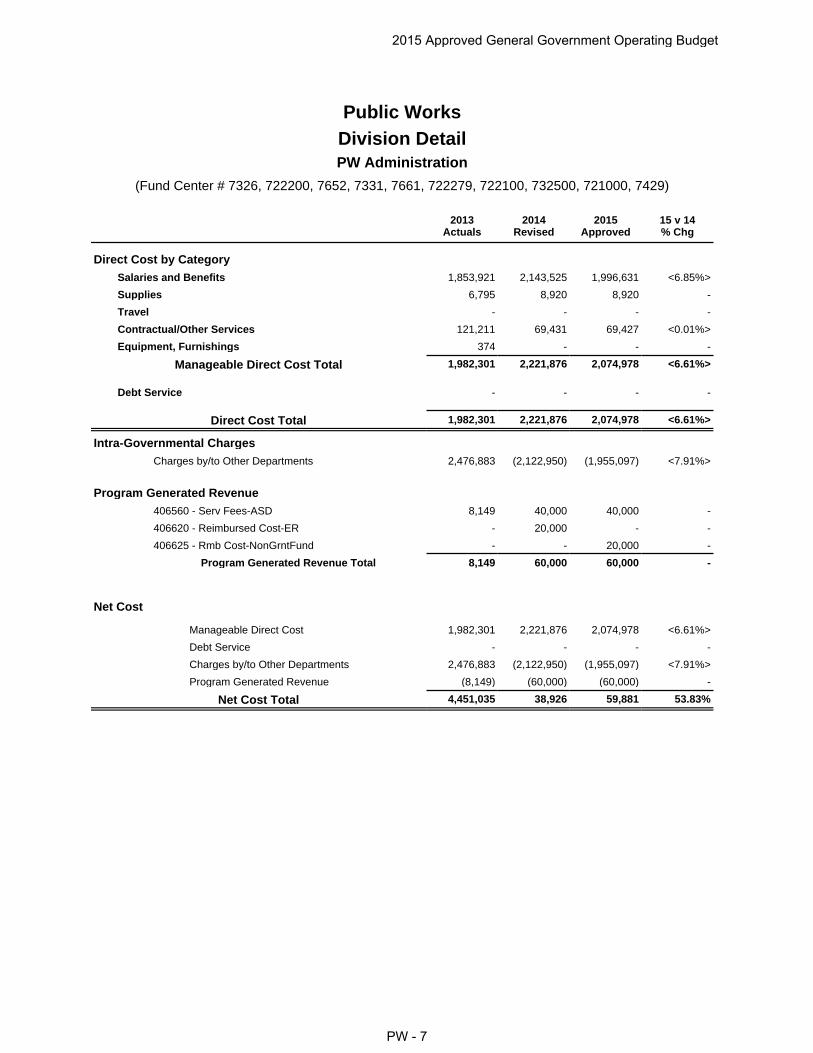
Net Cost
Manageable Direct Cost 1,982,301 2,221,876 2,074,978 <6.61%>
Debt Service - - - -
Charges by/to Other Departments 2,476,883 (2,122,950) (1,955,097) <7.91%>
Program Generated Revenue (8,149) (60,000) (60,000) -
Net Cost Total 4,451,035 38,926 59,881 53.83%
Direct Cost by CategorySalaries and Benefits 1,853,921 2,143,525 1,996,631 <6.85%>
Supplies 6,795 8,920 8,920 -
Travel - - - -
Contractual/Other Services 121,211 69,431 69,427 <0.01%>
Equipment, Furnishings 374 - - -
Manageable Direct Cost Total 1,982,301 2,221,876 2,074,978 <6.61%>
Debt Service - - - -
Direct Cost Total 1,982,301 2,221,876 2,074,978 <6.61%>
Intra-Governmental ChargesCharges by/to Other Departments 2,476,883 (2,122,950) (1,955,097) <7.91%>
Program Generated Revenue406560 - Serv Fees-ASD 8,149 40,000 40,000 -
406620 - Reimbursed Cost-ER - 20,000 - -
406625 - Rmb Cost-NonGrntFund - - 20,000 -
Program Generated Revenue Total 8,149 60,000 60,000 -
Public WorksDivision Detail
(Fund Center # 7326, 722200, 7652, 7331, 7661, 722279, 722100, 732500, 721000, 7429)
PW Administration
2014Revised
2015Approved
2013Actuals
15 v 14% Chg
2015 Approved General Government Operating Budget
PW - 7

2013Actuals
2014Revised
2015Approved
15 v 14% Chg
Direct Cost by CategorySalaries and Benefits 5,711,789 5,878,592 6,055,825 3.01%
Supplies 28,216 65,279 65,279 -
Travel - - -
Contractual/Other Services 561,971 408,713 410,481 0.43%
Equipment, Furnishings 56,631 7,840 7,840 -
Manageable Direct Cost Total 6,358,606 6,360,424 6,539,425 2.81%
Debt Service - - -
Direct Cost Total 6,358,606 6,360,424 6,539,425 2.81%
Revenue by FundFund 101000 - Areawide General 521,944 405,820 405,820 -
Revenue Total 521,944 405,820 405,820 -
Positions as Budgeted2013 Revised 2014 Revised 2015 Approved
Full Time Part Time Full Time Part Time Full Time Part Time
Administrative Officer 1 - - - 1 -
Civil Engineer II 11 - 9 - 9 1
Civil Engineer IV 5 - 5 - 5 -
Civil Engineering II - - 1 - - -
Deputy Director II 1 - 1 - 1 -
Engineering Technician III 6 2 6 3 6 3
Engineering Technician IV 4 - 4 - 4 -
Environmental Specialist - 1 - 1 - 1
GIS Technician I 1 - - - - -
GIS Technician III 2 - 3 - 3 -
Landscape Architect 1 - 1 - 1 -
Landscape Architect II - - - - 1 -
Landscape Architect III 1 - 1 - 1 -
Manager - - - - 1 -
Municipal Surveyor 1 - 1 - - -
Public Works Superintendent 1 - 1 - 1 -
Realty Officer I - - - - 1 -
Realty Officer II 1 - 1 - - -
Realty Officer III - - - - 1 -
Senior Landscape Architect 1 - - - - -
Senior Landscape Architect II - - 1 - - -
Senior Office Associate 2 - 2 - 1 -
Positions as Budgeted Total 39 3 37 4 37 5
Public WorksDivision Summary
(Fund Center # 736000, 732200, 732300, 732000, 731000, 7330, 734000, 732400, 732100)
PW Engineering
2015 Approved General Government Operating Budget
PW - 8
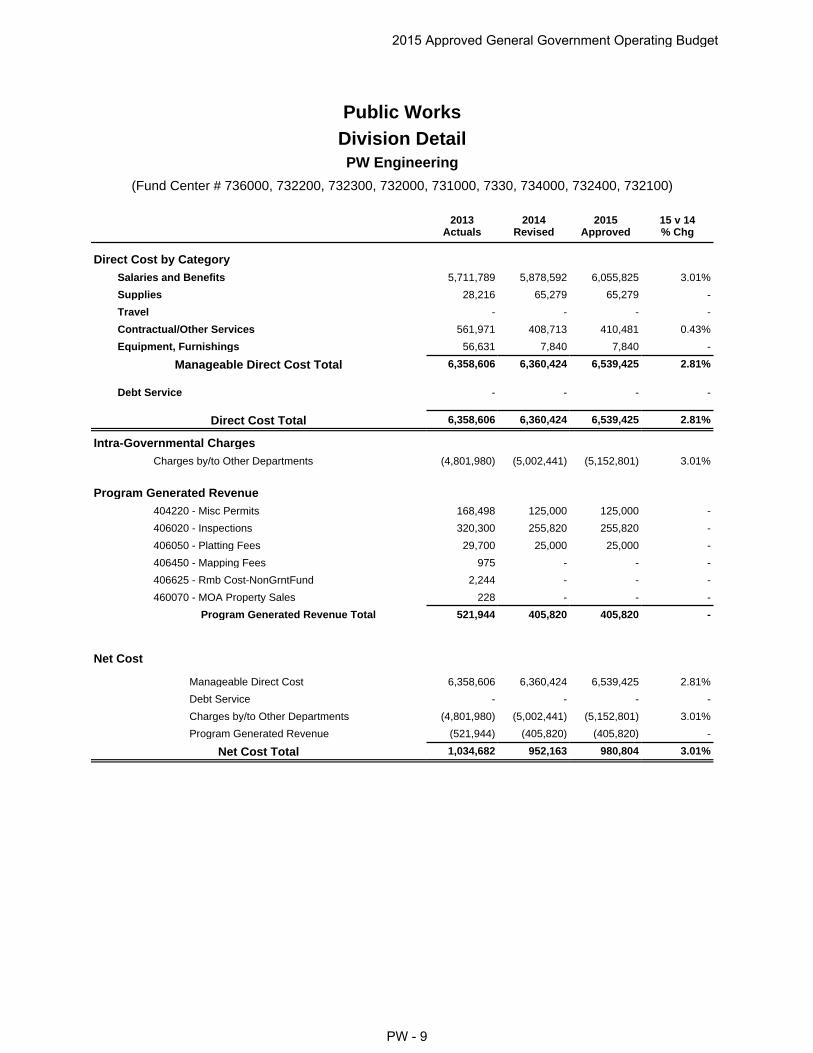
Net Cost
Manageable Direct Cost 6,358,606 6,360,424 6,539,425 2.81%
Debt Service - - - -
Charges by/to Other Departments (4,801,980) (5,002,441) (5,152,801) 3.01%
Program Generated Revenue (521,944) (405,820) (405,820) -
Net Cost Total 1,034,682 952,163 980,804 3.01%
Direct Cost by CategorySalaries and Benefits 5,711,789 5,878,592 6,055,825 3.01%
Supplies 28,216 65,279 65,279 -
Travel - - - -
Contractual/Other Services 561,971 408,713 410,481 0.43%
Equipment, Furnishings 56,631 7,840 7,840 -
Manageable Direct Cost Total 6,358,606 6,360,424 6,539,425 2.81%
Debt Service - - - -
Direct Cost Total 6,358,606 6,360,424 6,539,425 2.81%
Intra-Governmental ChargesCharges by/to Other Departments (4,801,980) (5,002,441) (5,152,801) 3.01%
Program Generated Revenue404220 - Misc Permits 168,498 125,000 125,000 -
406020 - Inspections 320,300 255,820 255,820 -
406050 - Platting Fees 29,700 25,000 25,000 -
406450 - Mapping Fees 975 - - -
406625 - Rmb Cost-NonGrntFund 2,244 - - -
460070 - MOA Property Sales 228 - - -
Program Generated Revenue Total 521,944 405,820 405,820 -
Public WorksDivision Detail
(Fund Center # 736000, 732200, 732300, 732000, 731000, 7330, 734000, 732400, 732100)
PW Engineering
2014Revised
2015Approved
2013Actuals
15 v 14% Chg
2015 Approved General Government Operating Budget
PW - 9
2013Actuals
2014Revised
2015Approved
15 v 14% Chg
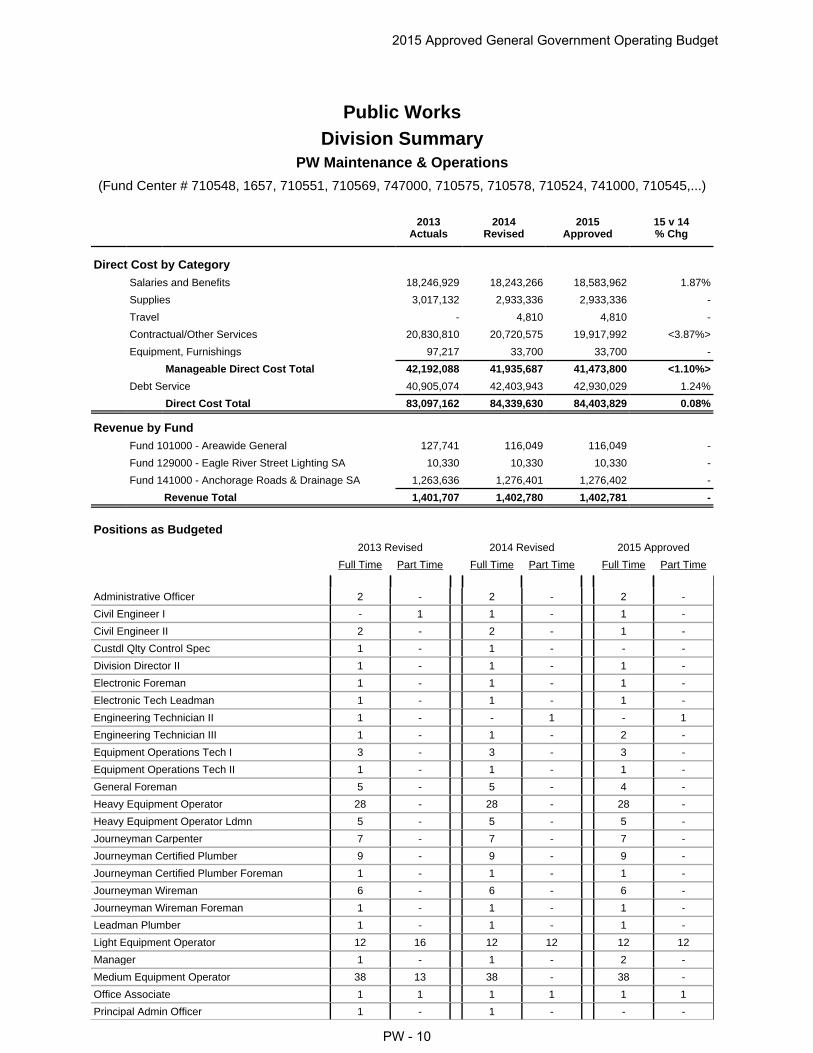
Direct Cost by CategorySalaries and Benefits 18,246,929 18,243,266 18,583,962 1.87%
Supplies 3,017,132 2,933,336 2,933,336 -
Travel - 4,810 4,810 -
Contractual/Other Services 20,830,810 20,720,575 19,917,992 <3.87%>
Equipment, Furnishings 97,217 33,700 33,700 -
Manageable Direct Cost Total 42,192,088 41,935,687 41,473,800 <1.10%>
Debt Service 40,905,074 42,403,943 42,930,029 1.24%
Direct Cost Total 83,097,162 84,339,630 84,403,829 0.08%
Revenue by FundFund 101000 - Areawide General 127,741 116,049 116,049 -
Fund 129000 - Eagle River Street Lighting SA 10,330 10,330 10,330 -
Fund 141000 - Anchorage Roads & Drainage SA 1,263,636 1,276,401 1,276,402 -
Revenue Total 1,401,707 1,402,780 1,402,781 -
Positions as Budgeted2013 Revised 2014 Revised 2015 Approved
Full Time Part Time Full Time Part Time Full Time Part Time
Administrative Officer 2 - 2 - 2 -
Civil Engineer I - 1 1 - 1 -
Civil Engineer II 2 - 2 - 1 -
Custdl Qlty Control Spec 1 - 1 - - -
Division Director II 1 - 1 - 1 -
Electronic Foreman 1 - 1 - 1 -
Electronic Tech Leadman 1 - 1 - 1 -
Engineering Technician II 1 - - 1 - 1
Engineering Technician III 1 - 1 - 2 -
Equipment Operations Tech I 3 - 3 - 3 -
Equipment Operations Tech II 1 - 1 - 1 -
General Foreman 5 - 5 - 4 -
Heavy Equipment Operator 28 - 28 - 28 -
Heavy Equipment Operator Ldmn 5 - 5 - 5 -
Journeyman Carpenter 7 - 7 - 7 -
Journeyman Certified Plumber 9 - 9 - 9 -
Journeyman Certified Plumber Foreman 1 - 1 - 1 -
Journeyman Wireman 6 - 6 - 6 -
Journeyman Wireman Foreman 1 - 1 - 1 -
Leadman Plumber 1 - 1 - 1 -
Light Equipment Operator 12 16 12 12 12 12
Manager 1 - 1 - 2 -
Medium Equipment Operator 38 13 38 - 38 -
Office Associate 1 1 1 1 1 1
Principal Admin Officer 1 - 1 - - -
Public WorksDivision Summary
(Fund Center # 710548, 1657, 710551, 710569, 747000, 710575, 710578, 710524, 741000, 710545,...)
PW Maintenance & Operations
2015 Approved General Government Operating Budget
PW - 10

Positions as Budgeted2013 Revised 2014 Revised 2015 Approved
Full Time Part Time Full Time Part Time Full Time Part Time
Public Works Superintendent 2 - 2 - 1 -
Quality Control Spec - - - - 1 -
Radio Installer I - - 1 - 1 -
Radio Installer II 2 - 2 - 2 -
Radio Installer III 1 - - - - -
Senior Admin Officer 2 - 2 - 2 -
Senior Electronic Tech 5 - 5 - 5 -
Senior Office Associate 1 - 1 - 1 -
Special Admin Assistant I 1 - 1 - 1 -
Special Admin Assistant II 1 - 1 - 1 -
Street Maintenance Supvr 6 - 6 - 6 -
Superintendent 1 - 1 - 3 -
Warehouseman/Journeyman 1 - 1 - 1 -
Positions as Budgeted Total 153 31 153 14 153 14
Public WorksDivision Summary
(Fund Center # 710548, 1657, 710551, 710569, 747000, 710575, 710578, 710524, 741000, 710545,...)
PW Maintenance & Operations
2015 Approved General Government Operating Budget
PW - 11

Net Cost
Manageable Direct Cost 42,192,088 41,935,687 41,473,800 <1.10%>
Debt Service 40,905,074 42,403,943 42,930,029 1.24%
Charges by/to Other Departments (17,003,442) (13,904,922) (13,788,048) <0.84%>
Program Generated Revenue (1,401,707) (1,402,780) (1,402,781) -
Net Cost Total 64,692,013 69,031,928 69,213,000 0.26%
Direct Cost by CategorySalaries and Benefits 18,246,929 18,243,266 18,583,962 1.87%
Supplies 3,017,132 2,933,336 2,933,336 -
Travel - 4,810 4,810 -
Contractual/Other Services 20,830,810 20,720,575 19,917,992 <3.87%>
Equipment, Furnishings 97,217 33,700 33,700 -
Manageable Direct Cost Total 42,192,088 41,935,687 41,473,800 <1.10%>
Debt Service 40,905,074 42,403,943 42,930,029 1.24%
Direct Cost Total 83,097,162 84,339,630 84,403,829 0.08%
Intra-Governmental ChargesCharges by/to Other Departments (17,003,442) (13,904,922) (13,788,048) <0.84%>
Program Generated Revenue403010 - Assessment Collects 68,845 160,000 160,000 -
403020 - P & I On Assessments 40,352 60,000 60,000 -
405030 - SOA Traff Signal Rmb 449,190 449,190 449,190 -
405120 - BuildAmericaBndSbsdy 587,374 569,871 569,872 -
406020 - Inspections - 6,170 6,170 -
406080 - Lease & Rntl Rev-HLB 110,751 113,949 113,949 -
406620 - Reimbursed Cost-ER - 2,100 - -
406625 - Rmb Cost-NonGrntFund 10,743 - 2,100 -
408090 - Recycle Rebate 2,926 - - -
408380 - Prior Yr Exp Recov 57,654 - - -
408390 - Insurance Recoveries 64,014 41,500 41,500 -
408580 - Miscellaneous Revenues 9,859 - - -
Program Generated Revenue Total 1,401,707 1,402,780 1,402,781 -
Public WorksDivision Detail
(Fund Center # 710548, 1657, 710551, 710569, 747000, 710575, 710578, 710524, 741000, 710545,...)
PW Maintenance & Operations
2014Revised
2015Approved
2013Actuals
15 v 14% Chg
2015 Approved General Government Operating Budget
PW - 12

2013Actuals
2014Revised
2015Approved
15 v 14% Chg
Direct Cost by CategorySalaries and Benefits 634,347 644,667 678,703 5.28%
Supplies 273,310 227,340 227,340 -
Travel 23 - -
Contractual/Other Services 9,340,497 10,422,407 9,551,543 <8.36%>
Equipment, Furnishings 8,879 6,000 6,000 -
Manageable Direct Cost Total 10,257,056 11,300,414 10,463,586 <7.41%>
Debt Service - - -
Direct Cost Total 10,257,056 11,300,414 10,463,586 <7.41%>
Revenue by FundFund 106000 - Girdwood Valley SA 2,954 3,000 3,000 -
Fund 119000 - Chugiak/Birchwd/ER RR SA 151,696 26,600 26,600 -
Revenue Total 154,650 29,600 29,600 -
Positions as Budgeted2013 Revised 2014 Revised 2015 Approved
Full Time Part Time Full Time Part Time Full Time Part Time
Junior Accountant 1 - 1 - 1 -
Junior Admin Officer - 1 - 1 - -
Office Associate - 1 1 - 1 -
Principal Admin Officer 1 - 1 - - -
Public Works Superintendent - - - - 1 -
Senior Admin Officer 1 - 1 - 1 -
Senior Office Associate - - - - - 1
Special Admin Assistant II 1 - 1 - 1 -
Positions as Budgeted Total 4 2 5 1 5 1
Public WorksDivision Summary
(Fund Center # 743300, 745000, 745100, 747300, 743200, 744100, 744900, 744800, 745300,...)
PW Other Service Areas
2015 Approved General Government Operating Budget
PW - 13

Net Cost
Manageable Direct Cost 10,257,056 11,300,414 10,463,586 <7.41%>
Debt Service - - - -
Charges by/to Other Departments 411,002 419,099 420,798 0.41%
Program Generated Revenue (154,650) (29,600) (29,600) -
Net Cost Total 10,513,408 11,689,913 10,854,784 <7.14%>
Direct Cost by CategorySalaries and Benefits 634,347 644,667 678,703 5.28%
Supplies 273,310 227,340 227,340 -
Travel 23 - - -
Contractual/Other Services 9,340,497 10,422,407 9,551,543 <8.36%>
Equipment, Furnishings 8,879 6,000 6,000 -
Manageable Direct Cost Total 10,257,056 11,300,414 10,463,586 <7.41%>
Debt Service - - - -
Direct Cost Total 10,257,056 11,300,414 10,463,586 <7.41%>
Intra-Governmental ChargesCharges by/to Other Departments 411,002 419,099 420,798 0.41%
Program Generated Revenue406080 - Lease & Rntl Rev-HLB - 3,000 3,000 -
406290 - RecCntr Rntls&Activs 2,954 - - -
406620 - Reimbursed Cost-ER - 25,000 - -
406625 - Rmb Cost-NonGrntFund 32,844 - 25,000 -
408380 - Prior Yr Exp Recov 118,852 - - -
408580 - Miscellaneous Revenues - 1,600 1,600 -
Program Generated Revenue Total 154,650 29,600 29,600 -
Public WorksDivision Detail
(Fund Center # 743300, 745000, 745100, 747300, 743200, 744100, 744900, 744800, 745300,...)
PW Other Service Areas
2014Revised
2015Approved
2013Actuals
15 v 14% Chg
2015 Approved General Government Operating Budget
PW - 14
2013Actuals
2014Revised
2015Approved
15 v 14% Chg
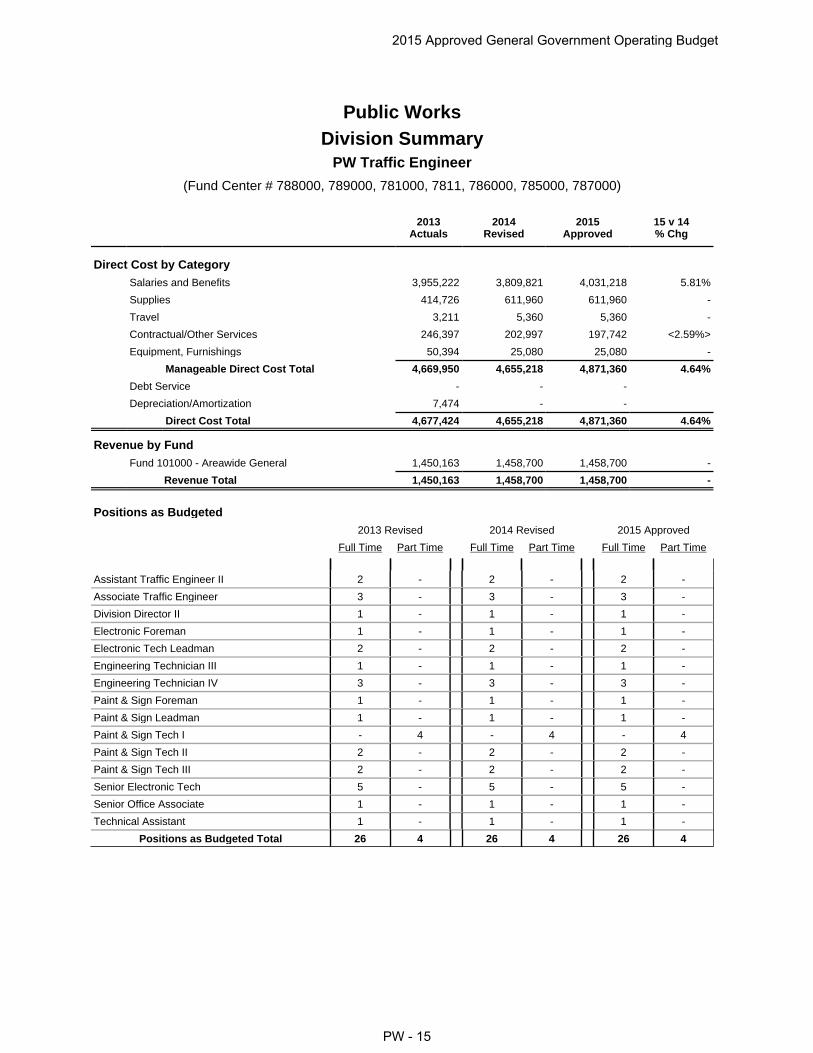
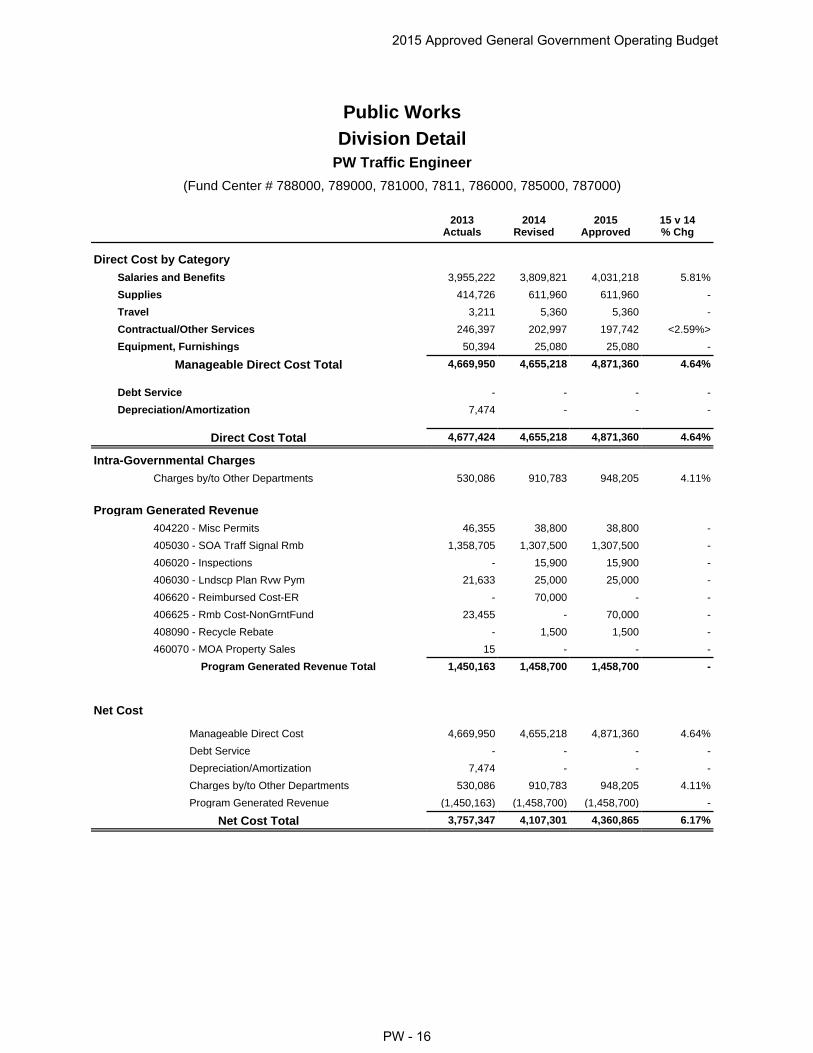
Direct Cost by CategorySalaries and Benefits 3,955,222 3,809,821 4,031,218 5.81%
Supplies 414,726 611,960 611,960 -
Travel 3,211 5,360 5,360 -
Contractual/Other Services 246,397 202,997 197,742 <2.59%>
Equipment, Furnishings 50,394 25,080 25,080 -
Manageable Direct Cost Total 4,669,950 4,655,218 4,871,360 4.64%
Debt Service - - -
Depreciation/Amortization 7,474 - -
Direct Cost Total 4,677,424 4,655,218 4,871,360 4.64%
Revenue by FundFund 101000 - Areawide General 1,450,163 1,458,700 1,458,700 -
Revenue Total 1,450,163 1,458,700 1,458,700 -
Positions as Budgeted2013 Revised 2014 Revised 2015 Approved
Full Time Part Time Full Time Part Time Full Time Part Time
Assistant Traffic Engineer II 2 - 2 - 2 -
Associate Traffic Engineer 3 - 3 - 3 -
Division Director II 1 - 1 - 1 -
Electronic Foreman 1 - 1 - 1 -
Electronic Tech Leadman 2 - 2 - 2 -
Engineering Technician III 1 - 1 - 1 -
Engineering Technician IV 3 - 3 - 3 -
Paint & Sign Foreman 1 - 1 - 1 -
Paint & Sign Leadman 1 - 1 - 1 -
Paint & Sign Tech I - 4 - 4 - 4
Paint & Sign Tech II 2 - 2 - 2 -
Paint & Sign Tech III 2 - 2 - 2 -
Senior Electronic Tech 5 - 5 - 5 -
Senior Office Associate 1 - 1 - 1 -
Technical Assistant 1 - 1 - 1 -
Positions as Budgeted Total 26 4 26 4 26 4
Public WorksDivision Summary
(Fund Center # 788000, 789000, 781000, 7811, 786000, 785000, 787000)
PW Traffic Engineer
2015 Approved General Government Operating Budget
PW - 15
Net Cost
Manageable Direct Cost 4,669,950 4,655,218 4,871,360 4.64%
Debt Service - - - -
Depreciation/Amortization 7,474 - - -
Charges by/to Other Departments 530,086 910,783 948,205 4.11%
Program Generated Revenue (1,450,163) (1,458,700) (1,458,700) -
Net Cost Total 3,757,347 4,107,301 4,360,865 6.17%
Direct Cost by CategorySalaries and Benefits 3,955,222 3,809,821 4,031,218 5.81%
Supplies 414,726 611,960 611,960 -
Travel 3,211 5,360 5,360 -
Contractual/Other Services 246,397 202,997 197,742 <2.59%>
Equipment, Furnishings 50,394 25,080 25,080 -
Manageable Direct Cost Total 4,669,950 4,655,218 4,871,360 4.64%
Debt Service - - - -
Depreciation/Amortization 7,474 - - -
Direct Cost Total 4,677,424 4,655,218 4,871,360 4.64%
Intra-Governmental ChargesCharges by/to Other Departments 530,086 910,783 948,205 4.11%
Program Generated Revenue404220 - Misc Permits 46,355 38,800 38,800 -
405030 - SOA Traff Signal Rmb 1,358,705 1,307,500 1,307,500 -
406020 - Inspections - 15,900 15,900 -
406030 - Lndscp Plan Rvw Pym 21,633 25,000 25,000 -
406620 - Reimbursed Cost-ER - 70,000 - -
406625 - Rmb Cost-NonGrntFund 23,455 - 70,000 -
408090 - Recycle Rebate - 1,500 1,500 -
460070 - MOA Property Sales 15 - - -
Program Generated Revenue Total 1,450,163 1,458,700 1,458,700 -
Public WorksDivision Detail
(Fund Center # 788000, 789000, 781000, 7811, 786000, 785000, 787000)
PW Traffic Engineer
2014Revised
2015Approved
2013Actuals
15 v 14% Chg
2015 Approved General Government Operating Budget
PW - 16
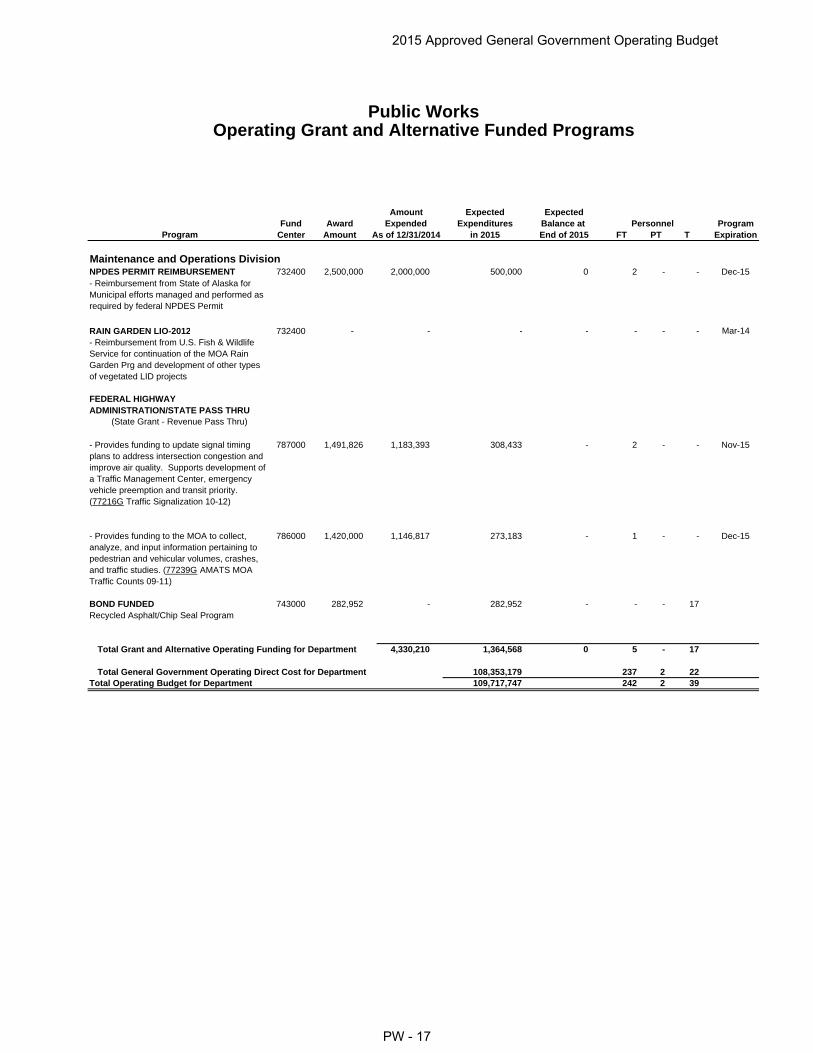
Amount Expected ExpectedFund Award Expended Expenditures Balance at Program
Program Center Amount As of 12/31/2014 in 2015 End of 2015 FT PT T Expiration
Maintenance and Operations DivisionNPDES PERMIT REIMBURSEMENT 732400 2,500,000 2,000,000 500,000 0 2 - - Dec-15- Reimbursement from State of Alaska for Municipal efforts managed and performed as required by federal NPDES Permit
RAIN GARDEN LIO-2012 732400 - - - - - - - Mar-14- Reimbursement from U.S. Fish & Wildlife Service for continuation of the MOA Rain Garden Prg and development of other types of vegetated LID projects
FEDERAL HIGHWAY ADMINISTRATION/STATE PASS THRU
(State Grant - Revenue Pass Thru) - Provides funding to update signal timing plans to address intersection congestion and improve air quality. Supports development of a Traffic Management Center, emergency vehicle preemption and transit priority. (77216G Traffic Signalization 10-12)
787000 1,491,826 1,183,393 308,433 - 2 - - Nov-15
- Provides funding to the MOA to collect, analyze, and input information pertaining to pedestrian and vehicular volumes, crashes, and traffic studies. (77239G AMATS MOA Traffic Counts 09-11)
786000 1,420,000 1,146,817 273,183 - 1 - - Dec-15
BOND FUNDED 743000 282,952 - 282,952 - - - 17 Recycled Asphalt/Chip Seal Program
Total Grant and Alternative Operating Funding for Department 4,330,210 1,364,568 0 5 - 17
Total General Government Operating Direct Cost for Department 108,353,179 237 2 22 Total Operating Budget for Department 109,717,747 242 2 39
Public WorksOperating Grant and Alternative Funded Programs
Personnel
2015 Approved General Government Operating Budget
PW - 17

Anchorage: Performance. Value. Results
2015 Approved General Government Operating Budget
PW - 18

Design Section Engineering Division
Public Works Department “Anchorage: Performance. Value. Results.”
Mission
Design and prepare construction documents that produce safe, functional and cost-effective capital infrastructure projects, i.e., roads, drainage, parks and trail projects; and oversee development/maintenance of design criteria for municipal roads, trails, parks and drainage improvements within the Municipality.
Direct Services
Design cost-effective infrastructure solutions. Investigate and resolve property owner and public inquiries. Maintain/update Municipality of Anchorage Standard Specifications (MASS). Maintain/update Design Criteria Manual (DCM).
Accomplishment Goals
Design capital improvement projects that are cost-effective, maintenance-friendly, and clearly communicate design intent to construction contractor within the schedule specified in the Capital Improvement Program.
Investigate and respond to public inquiries within ten working days. Performance Measures
Progress in achieving goals shall be measured by: Measure #1: 75% of public inquires will be investigated and responded to within 72 hours.
2014
Engineering Division - Design Section75% of public inquiries investigated and initial response within 72 hours
2 1 0 2 0 02 1 0 1 0 0
0
2
4
6
8
10
12
Jan Feb Mar Apr May Jun Jul Aug Sept Oct Nov Dec
Month in 2014
No
of
Pu
blic
Inq
uir
ies
No. of PublicInquiriesReceived
No. of PublicInquiriesResponded 100%
100%50%
2015 Approved General Government Operating Budget
PW - 19

Project Management Section Engineering Division
Public Works Department “Anchorage: Performance. Value. Results.”
Mission
Provide project management services aimed at delivering public capital improvement projects in a timely, cost-effective manner for residents, businesses and visitors within the Municipality who rely on public facilities for safe transportation and recreation.
Core Services
Manage the specific planning and specific configuration of capital projects (i.e., roadways, drainage systems, parks, and trails).
Manage the design of capital projects, to provide the greatest public benefit for the least private detriment.
Manage the construction of those capital projects, to ensure the greatest cost-effectiveness with the least disruption to residents, businesses and the traveling public.
Inform the public and listen to comments regarding the details of the above planning, design, and construction activities.
Accomplishment Goals
The management of the planning, design, and construction of capital projects shall be accomplished in a cost-effective, timely, context-sensitive, and safe manner.
Performance Measures
Progress in achieving goals shall be measured by:
2015 Approved General Government Operating Budget
PW - 20

Measure #2: 75% of construction contract change orders less than 10% of the original contract prices, including elective change orders
2014
Public Works Project Management & Engineering Capital ProjectsValues of Contracts and Change Orders
$923,124
$3,491,606
$-
$2,500,000
$5,000,000
$7,500,000
$10,000,000
2014 2013Year
Dol
lar
Val
ue
Total OriginalContracts Amount
Total ChangeOrders Amount
3 of 40 contracts (32%) w ith change
orders exceeded 10% of orignal contract
amount.
1 of 40 contracts (2%) w ith change orders exceed 10% of orignal contract amount.
107,589,583 $109,169,255
3.2% of orignal contract amount. .96% of
orignal contract
2014 Roads & Drainage Capital ProjectsConstruction Contracts with Change Orders
$-
$1,000,000
$2,000,000
$3,000,000
$4,000,000
$5,000,000
$6,000,000
$7,000,000
$8,000,000
1 3 5 7 9 11 13 15 17 19 21 23
No. of Contracts
Am
ou
nt
Original Contract AmountChange Order Total
Original Contract AmountChange Order Total
Of 40 open construction contracts, 10 have change orders (25.0%)
2015 Approved General Government Operating Budget
PW - 21
Survey and ROW Section Engineering Division
Public Works Department “Anchorage: Performance. Value. Results.”
Mission
Provide professional land surveying and acquisition services to the Municipality in support of its Capital Improvement Program and its subdivision platting function.
Direct Services
Review of subdivision plats for final approval by the Planning Division. Provide survey data and mapping products to primarily support capital projects and
other Municipal agencies’ needs. Accomplishment Goals
Provide land survey review for the Planning Division to meet their needs. Provide surveys at a reasonable cost.
Performance Measures
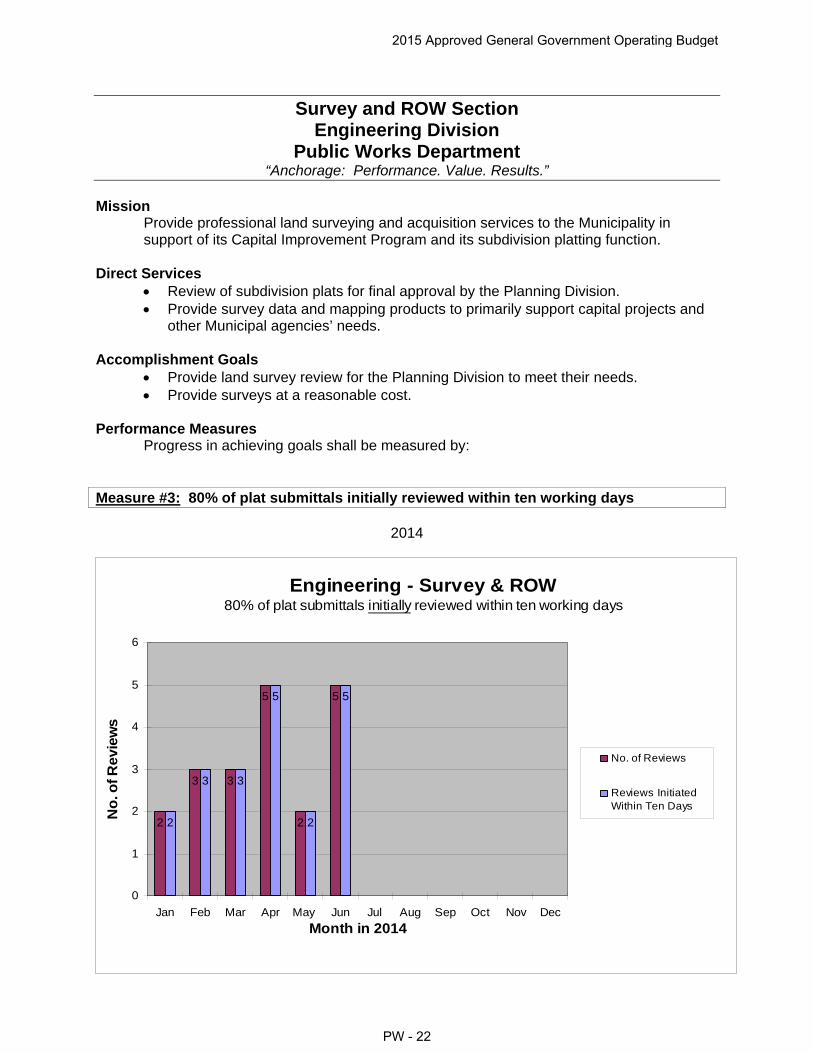
Progress in achieving goals shall be measured by: Measure #3: 80% of plat submittals initially reviewed within ten working days
2014
Engineering - Survey & ROW80% of plat submittals initially reviewed within ten working days
2
3 3
2
5
2
3 3
55 5
2
0
1
2
3
4
5
6
Jan Feb Mar Apr May Jun Jul Aug Sep Oct Nov Dec
Month in 2014
No
. of R
evie
ws
No. of Reviews
Reviews InitiatedWithin Ten Days
2015 Approved General Government Operating Budget
PW - 22
Watershed Management Section Engineering Division
Public Works Department “Anchorage: Performance. Value. Results.”
Mission
Oversee the discharge of the municipal storm water system based on the federally mandated Alaska Pollution Discharge Elimination System (APDES) Permit which allows discharge from the municipal storm sewer system into waters of the U.S. Compliance with the APDES Permit is necessary to avoid penalties enforced by the Environmental Protection Agency in accordance with the Clean Water Act.
Direct Services
Long-term negotiation and coordination of permit allowing the municipality to dispose of stormwater into waters of the U.S.
Oversight of FEMA National Flood Insurance Program (NFIP) for Anchorage. Accomplishment Goals
Ensure watershed management employees perform and are timely with permit plan reviews.
Flood plain data is maintained as per regulatory (NFIP) requirements and accessible to public in timely manner.
APDES inspections for commercial projects are performed within approved APDES permit requirements.
Performance Measures
Progress in achieving goals shall be measured by:
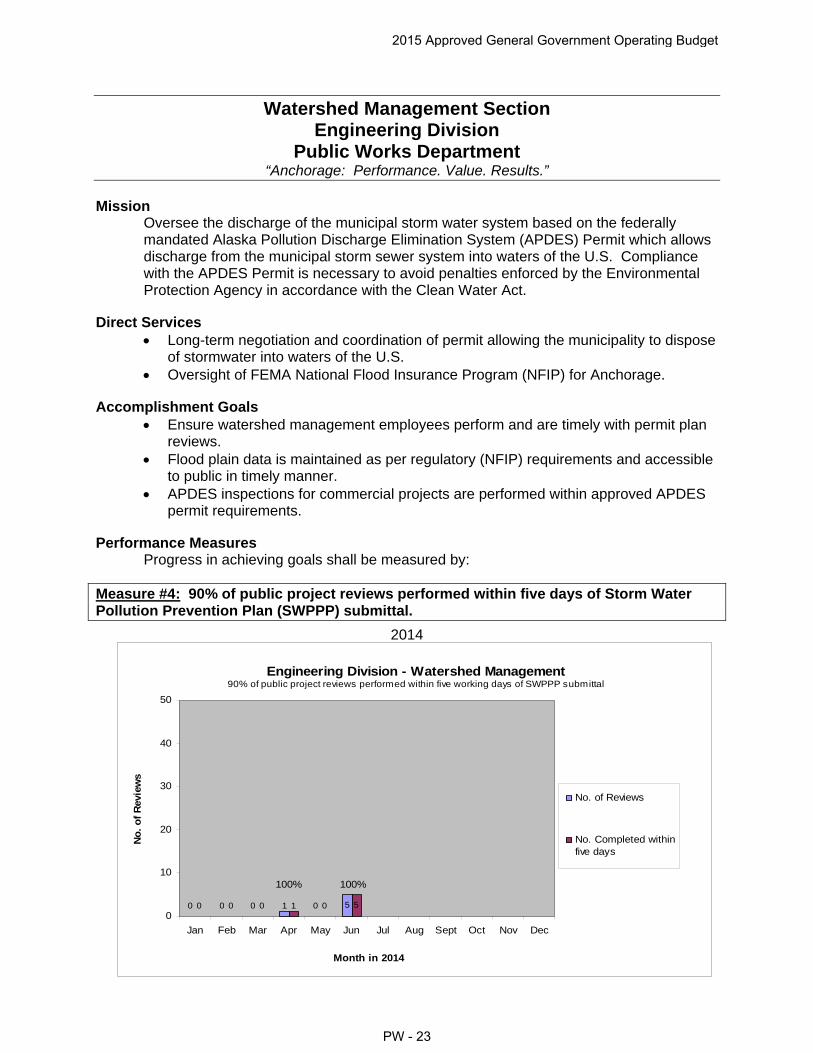
Measure #4: 90% of public project reviews performed within five days of Storm Water Pollution Prevention Plan (SWPPP) submittal.
2014
Engineering Division - Watershed Management90% of public project reviews performed within five working days of SWPPP submittal
0 0 0 1 0 50 0 0 1 0 50
10
20
30
40
50
Jan Feb Mar Apr May Jun Jul Aug Sept Oct Nov Dec
Month in 2014
No
. o
f R
evie
ws
No. of Reviews
No. Completed withinfive days
100% 100%
2015 Approved General Government Operating Budget
PW - 23

Measure #5: 95% of floodplain data requests addressed within four working days
2014
Engineering Division - Watershed Management95% of floodplain data requests addressed within four working days
2217
1221
1712
27 24 2126 24 21
-5
5
15
25
35
45
55
65
75
Jan Feb Mar Apr May Jun Jul Aug Sept Oct Nov Dec
Month in 2014
No
. of R
equ
ests
No. of Requests
No. Completed w ithinfour days
95%
100% 100%
96% 100% 100%
Measure #6: 90% of commercial APDES inspections performed within ten days
2014
Engineering Division - Watershed Management90% of commercial inspections performed within ten working days
6
4
89
12
16
6
4
89
12
16
0
2
4
6
8
10
12
14
16
18
Jan Feb Mar Apr May Jun Jul Aug Sept Oct Nov Dec
Month in 2014
No
. o
f In
spec
tio
ns
No. of Inspections
No. Completed withinten days
100%
100%
100%100%
100%
100%
2015 Approved General Government Operating Budget
PW - 24

Street Maintenance Section Maintenance and Operations Division
Public Works Department “Anchorage: Performance. Value. Results.”
Purpose
Protect, maintain, and improve Municipal roads and drainage systems through organized efforts and effective use of resources.
Core Services
Snow and ice removal Pothole repair Storm drain structure maintenance
Accomplishment Goals
Complete declared plow-outs within 72 hours of a snowfall four inches or more within Anchorage Roads and Drainage Service Area (ARDSA)
Repair reported potholes within 24 hours within ARDSA Annually inspect and clean “as required” all storm drain structures per Alaska
Pollution Discharge Elimination System (APDES) Phase II permit within ARDSA Performance Measures
Progress in achieving goals shall be measured by: Complete declared plow-outs within 72 hours within ARDSA Repair reported potholes within 24 hours within ARDSA Year-to-date percentage of storm drain structures inspected and cleaned as required
within ARDSA. Explanatory Information
Tracking information for these measures began January 1, 2010
2015 Approved General Government Operating Budget
PW - 25

Measure #7: Complete declared plow-outs within 72 hours within ARDSA
Street Maintenance Division2014 Plow Out Information
January 1, 2014 - December 31, 2014
Measure #8: Repair reported potholes within 24 hours within ARDSA
Street Maintenance2014 Pothole Repair Performance Measure
Measure: Percentage of Reported Potholes Repaired Within 24 HoursNo Recorded Data = No Activity for that month
0%
20%
40%
60%
80%
100%
120%
Jan Feb Mar Apr May Jun Jul Aug Sep Oct Nov Dec
Month
Perc
en
tag
e R
ep
air
ed
2014 PercentageReported PotholesRepaired Within 24Hours
Goal = 80%
86
11175
213
217
89
62.5
0102030405060708090
100
Feb20th
Mar16th Dates of Declared Plow Outs
Ho
urs
Completed Plow Outs To Date
Complete Declared Plow-Outs in 72 hours or less Performance Measure:
2015 Approved General Government Operating Budget
PW - 26
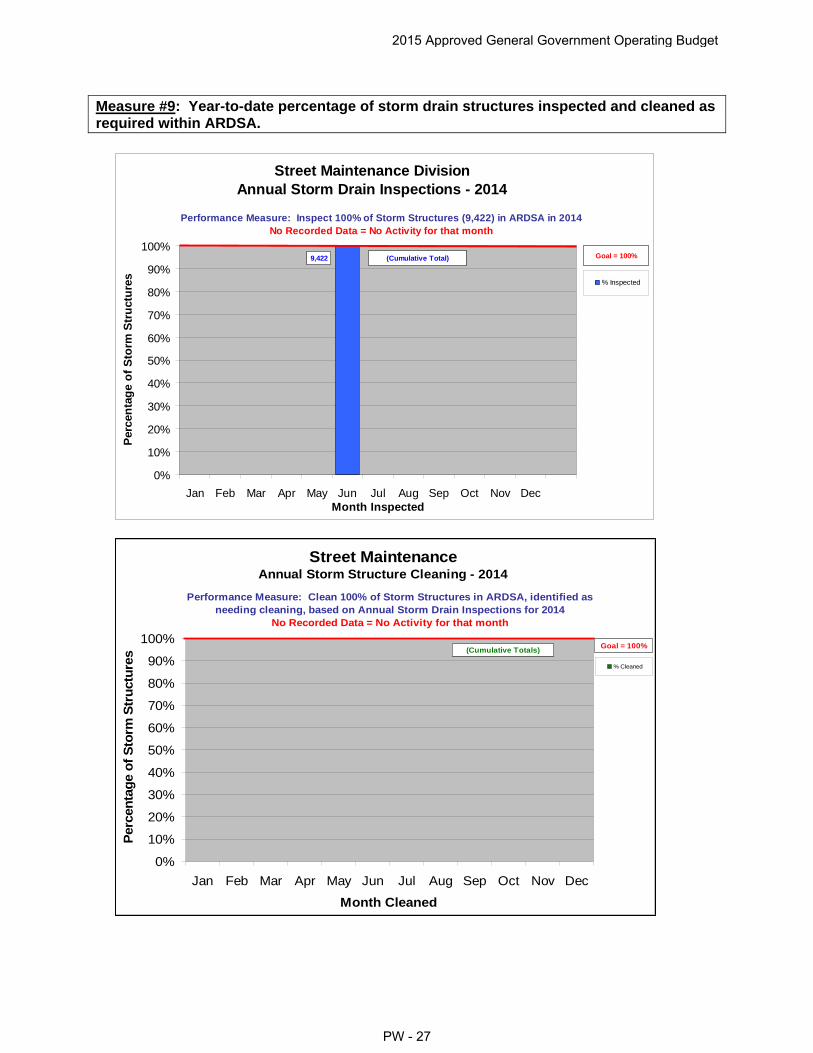
Measure #9: Year-to-date percentage of storm drain structures inspected and cleaned as required within ARDSA.
Street Maintenance Division Annual Storm Drain Inspections - 2014
0%
10%
20%
30%
40%
50%
60%
70%
80%
90%
100%
Jan Feb Mar Apr May Jun Jul Aug Sep Oct Nov DecMonth Inspected
Per
cen
tag
e o
f S
torm
Str
uct
ure
s
% Inspected
Performance Measure: Inspect 100% of Storm Structures (9,422) in ARDSA in 2014
No Recorded Data = No Activity for that month
Goal = 100%
9,422 (Cumulative Total)
Street Maintenance Annual Storm Structure Cleaning - 2014
0%
10%
20%
30%
40%
50%
60%
70%
80%
90%
100%
Jan Feb Mar Apr May Jun Jul Aug Sep Oct Nov Dec
Month Cleaned
Per
cen
tag
e o
f S
torm
Str
uct
ure
s
% Cleaned
Performance Measure: Clean 100% of Storm Structures in ARDSA, identified as needing cleaning, based on Annual Storm Drain Inspections for 2014
No Recorded Data = No Activity for that month
Goal = 100%
(Cumulative Totals)
2015 Approved General Government Operating Budget
PW - 27

Communications Section Maintenance and Operations Division
Public Works Department “Anchorage: Performance. Value. Results.”
Purpose
Operate and maintain emergency and general voice and data wireless systems for all Municipal general government agencies with a priority on first responders and 911 Dispatch Centers.
Direct Services
Install, maintain, and repair wireless communication systems to maximize responder safety and efficient use of personnel and resources
Provide technical expertise in the procurement and inventory management of electronic equipment to ensure compatibility and asset accountability
Provide design and project management for communications system upgrades and acquisitions
Maintain oversight of Federal Communications Commission (FCC)-related licensing to ensure compliance of federal rules and regulations
Install, maintain, and repair biomedical equipment as used by Police and Fire responders to ensure functionality and reliability of life saving devices
Install & maintain WiFi hot spot equipment within most municipal buildings Accomplishment Goals
Minimize downtime of Fire, Police and General Government personnel 100% of Fire & Medic apparatus have working, certified electronic defibrillators Support the efficient, safe operations of emergency services by providing expeditious
maintenance of public safety radio equipment 98% of police-assigned automatic electronic defibrillators are certified and operable
on any given day Performance Measures
Progress in achieving goals shall be measured by: Percent of unscheduled repairs to Public Safety core service equipment/systems
completed and returned to service within two hours, seven days a week, 24 hours a day
Explanatory Information
Tracking information for these measures began January 1, 2011.
2015 Approved General Government Operating Budget
PW - 28

Measure #10: Percent of unscheduled repairs to Public Safety core service equipment/systems completed and returned to service within two hours, seven days a week, 24 hours a day
2014
% of unscheduled repairs to Public Safety core service equipment/systems completed and returned to service within 2hrs, 7 days a week, 24hrs/day
0%
10%
20%
30%
40%
50%
60%
70%
80%
90%
100%
Jan Feb Mar Apr May Jun Jul Aug Sept Oct Nov Dec
Month
% o
f u
nsc
hed
ule
d r
epai
rs t
o P
ub
lic
Saf
ety
core
ser
vice
eq
uip
men
t/sy
stem
s co
mp
lete
d a
nd
ret
urn
ed t
o s
ervi
ce w
ith
in
2hrs
, 7
day
s a
wee
k, 2
4hrs
a d
ay
25 38 39 37 56 28
Goal = 99%
2015 Approved General Government Operating Budget
PW - 29

Fleet Maintenance Section Maintenance and Operations Division
Public Works Department “Anchorage: Performance. Value. Results.”
Purpose
Preserve, maintain, and manage Municipal general government vehicles and equipment. Core Services
Year-round maintenance of Municipal general government vehicles and equipment Accomplishment Goals
Improve overall vehicle in-commission rate for all customers Reduce fleet vehicle maintenance costs while providing safe, operable vehicles
Performance Measures
Progress in achieving goals shall be measured by: Percent of police cruisers, general government, and heavy equipment vehicles in
commission Explanatory Information
Tracking information for these measures began January 1, 2010.
2015 Approved General Government Operating Budget
PW - 30
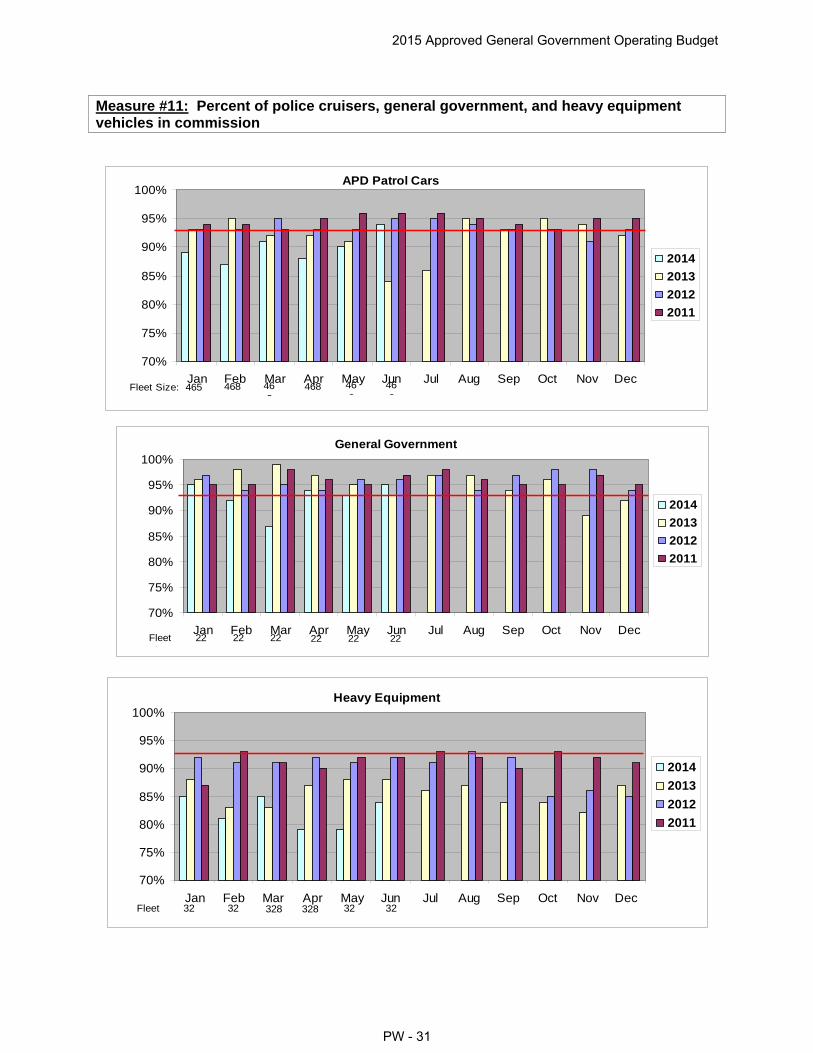
Measure #11: Percent of police cruisers, general government, and heavy equipment vehicles in commission
70%
75%
80%
85%
90%
95%
100%
Jan Feb Mar Apr May Jun Jul Aug Sep Oct Nov Dec
APD Patrol Cars
2014
2013
2012
2011
Fleet Size: 465 468 469
468 468
468
70%
75%
80%
85%
90%
95%
100%
Jan Feb Mar Apr May Jun Jul Aug Sep Oct Nov Dec
General Government
2014
2013
2012
2011
Fleet Si
220
220
220
22 22 22
70%
75%
80%
85%
90%
95%
100%
Jan Feb Mar Apr May Jun Jul Aug Sep Oct Nov Dec
Heavy Equipment
2014
2013
2012
2011
Fleet 32 32 328 328 32 32
2015 Approved General Government Operating Budget
PW - 31
Facility Maintenance Section Maintenance and Operations Division
Public Works Department “Anchorage: Performance. Value. Results.”
Purpose
Preserve, maintain, and improve Municipal facilities Core Services
Maintenance of Municipal general government facilities Accomplishment Goals
Improve response times to prioritized work order requests Performance Measures
Progress in achieving goals shall be measured by: Percent of Priority 1 (emergency) work orders completed within 24 hours Percent of Priority 2 (urgent) work orders completed within seven days Percent of Priority 3 (priority) work orders completed within one month
Explanatory Information
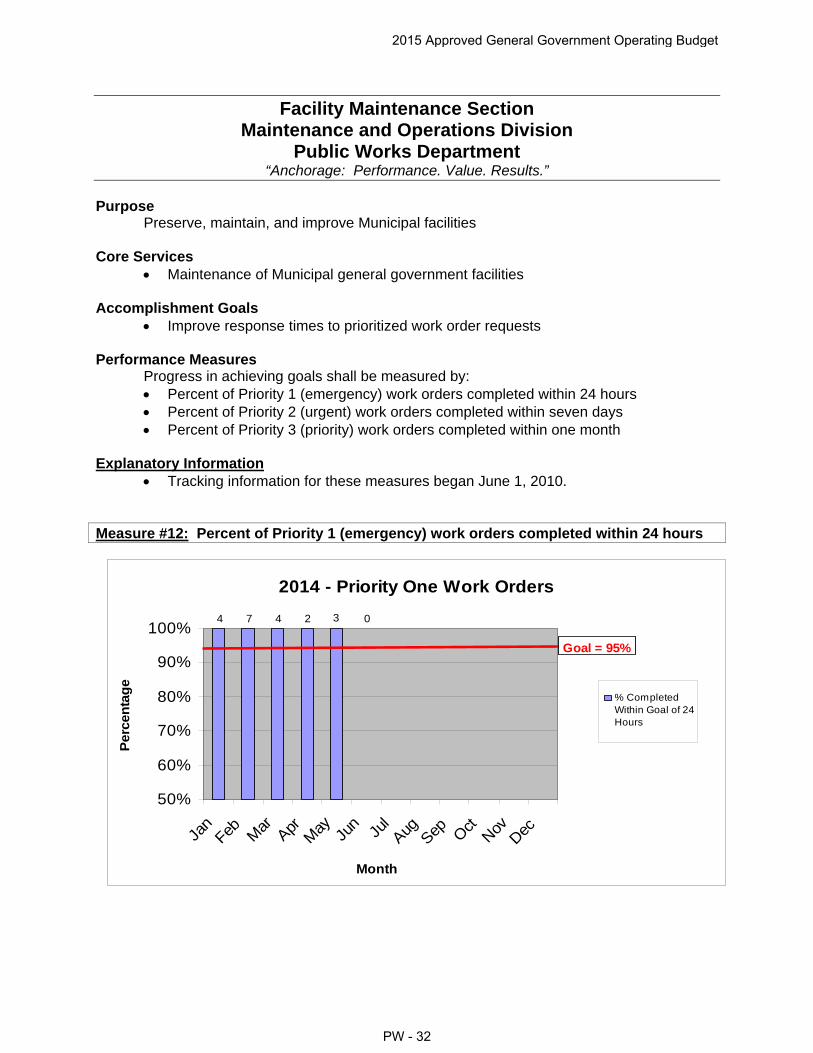
Tracking information for these measures began June 1, 2010. Measure #12: Percent of Priority 1 (emergency) work orders completed within 24 hours
2014 - Priority One Work Orders
50%
60%
70%
80%
90%
100%
Jan
Feb Mar Apr
May Ju
n Jul
Aug Sep Oct
NovDec
Month
Perc
en
tag
e
% CompletedWithin Goal of 24Hours
4 2
0374
Goal = 95%
2015 Approved General Government Operating Budget
PW - 32
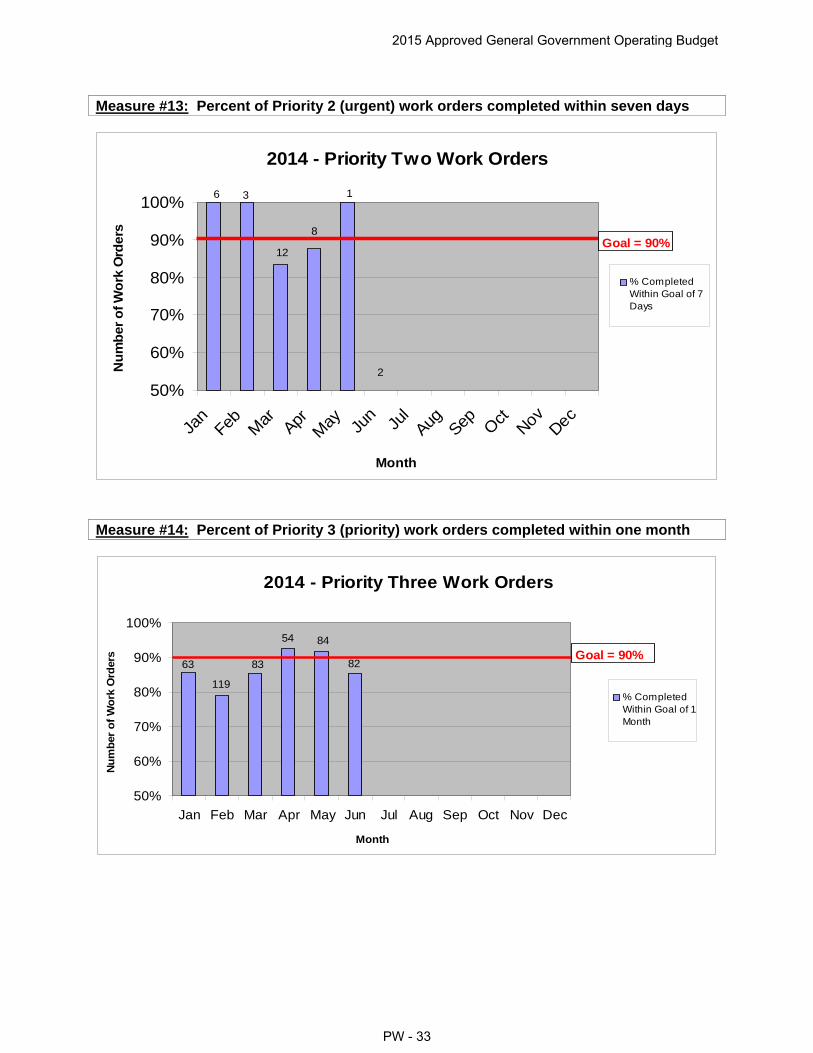
Measure #13: Percent of Priority 2 (urgent) work orders completed within seven days
2014 - Priority Two Work Orders
50%
60%
70%
80%
90%
100%
Jan
Feb Mar Apr
May Ju
nJu
lAug Sep O
ctNov
Dec
Month
Nu
mb
er
of W
ork
Ord
ers
% CompletedWithin Goal of 7Days
3
12
8
1
2
6
Goal = 90%
Measure #14: Percent of Priority 3 (priority) work orders completed within one month
2014 - Priority Three Work Orders
50%
60%
70%
80%
90%
100%
Jan Feb Mar Apr May Jun Jul Aug Sep Oct Nov Dec
Month
Nu
mb
er o
f W
ork
Ord
ers
% CompletedWithin Goal of 1Month
63
84
119
83
54
Goal = 90%82
2015 Approved General Government Operating Budget
PW - 33
Capital Projects Section Maintenance and Operations Division
Public Works Department “Anchorage: Performance. Value. Results.”
Purpose
Manage, design, and construct Municipal facility renovations and new construction projects that meet the needs of requesting departments within the available funding.
Core Services
Project management of Municipal facility renovation and upgrade projects Project management of new construction of Municipal facilities
Accomplishment Goals
Reduce capital projects construction contracts with change orders Performance Measures
Progress in achieving goals shall be measured by: Dollar values of construction contracts with change orders and Dollar values of
change order costs compared to original contract cost Explanatory Information
Tracking information for these measures began January 1, 2010.
2015 Approved General Government Operating Budget
PW - 34
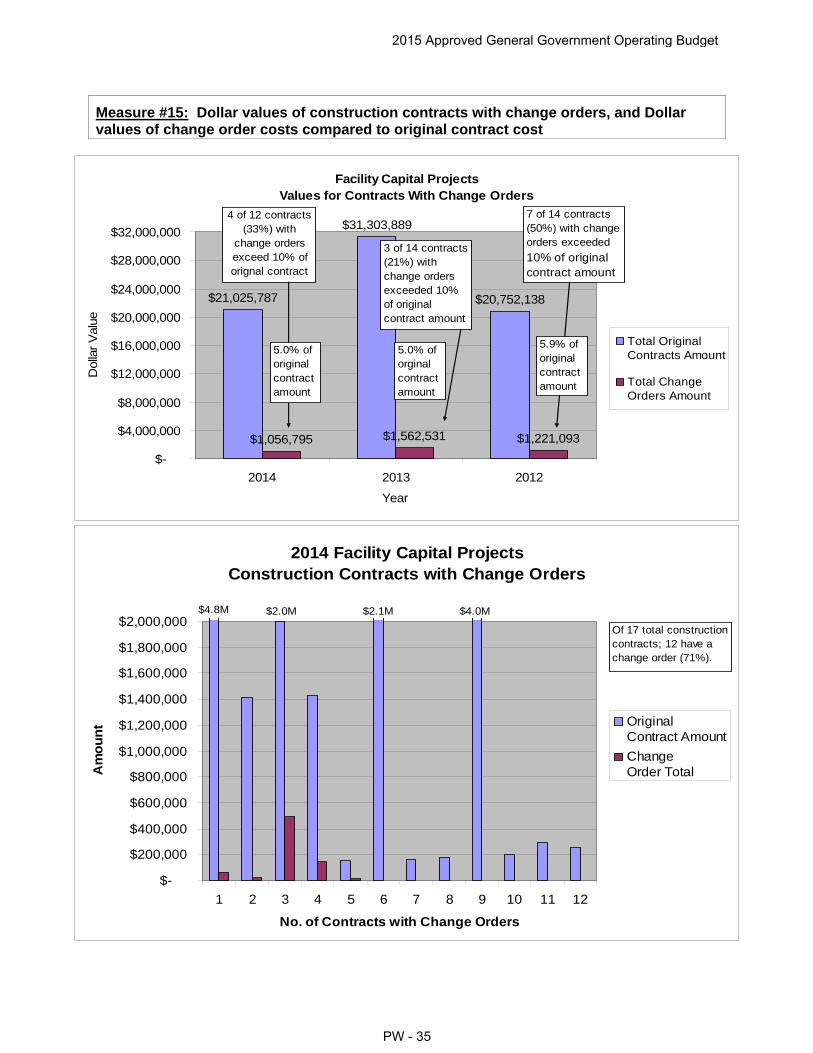
Measure #15: Dollar values of construction contracts with change orders, and Dollar values of change order costs compared to original contract cost
2014 Facility Capital Projects
Construction Contracts with Change Orders
$-
$200,000
$400,000
$600,000
$800,000
$1,000,000
$1,200,000
$1,400,000
$1,600,000
$1,800,000
$2,000,000
1 2 3 4 5 6 7 8 9 10 11 12
No. of Contracts with Change Orders
Am
ou
nt Original
Contract Amount
Change Order Total
Of 17 total construction contracts; 12 have a change order (71%).
$2.0M $2.1M$4.8M $4.0M
Facility Capital ProjectsValues for Contracts With Change Orders
$20,752,138
$1,056,795 $1,221,093
$31,303,889
$21,025,787
$1,562,531
$-
$4,000,000
$8,000,000
$12,000,000
$16,000,000
$20,000,000
$24,000,000
$28,000,000
$32,000,000
2014 2013 2012
Year
Dol
lar
Val
ue
Total OriginalContracts Amount
Total ChangeOrders Amount
4 of 12 contracts (33%) with
change orders exceed 10% of orignal contract
t
7 of 14 contracts (50%) with change orders exceeded
10% of original contract amount
5.9% of original contract amount
5.0% of original contract amount
5.0% of orginal contract amount
3 of 14 contracts (21%) with change orders exceeded 10% of original contract amount
2015 Approved General Government Operating Budget
PW - 35
Traffic Division Public Works Department
“Anchorage: Performance. Value. Results.” Mission
Promote safe and efficient area-wide transportation that meets the needs of the community and the Anchorage Municipal Traffic Code requirements.
Direct Services
Design, operate and maintain the Anchorage Traffic Signal System.
Design and maintain the Anchorage traffic control devices (signage/markings).
Provide the necessary transportation data to support the core services.
Provide traffic safety improvements in accordance with identified traffic safety issues.
Provide traffic impact review of development plans and building permits. Accomplishment Goals
Continuous improvement in the safe and efficient movement of people and goods
Timely investigation and response to community traffic inquiries.
Traffic operation improvements that maximize transportation safety and system efficiency.
Performance Measures
Progress in achieving goals shall be measured by:
Percent of failed detector warnings repaired within one business.
Percent of damaged stop Signs repaired/replaced within 2 hours of notification
Percent of community inquiries investigated and responded to within five working days
Explanatory Information
Tracking information for these measures began January 1, 2011.
2015 Approved General Government Operating Budget
PW - 36

Measure #16: Percent of failed detector warnings repaired within one business day
2014 Percent of Failed Detector Warnings Repaired Within One Business Day
0%
10%
20%
30%
40%
50%
60%
70%
80%
90%
100%
Jan Feb Mar Apr May Jun Jul Aug Sep Oct Nov Dec
Month
Per
cen
t o
f F
aile
d D
etec
tor
War
nin
gs
Rep
aire
d
Wit
hin
On
e B
usi
nes
s D
ay
Goal = 90%
43 57 47 43 58 55
2015 Approved General Government Operating Budget
PW - 37
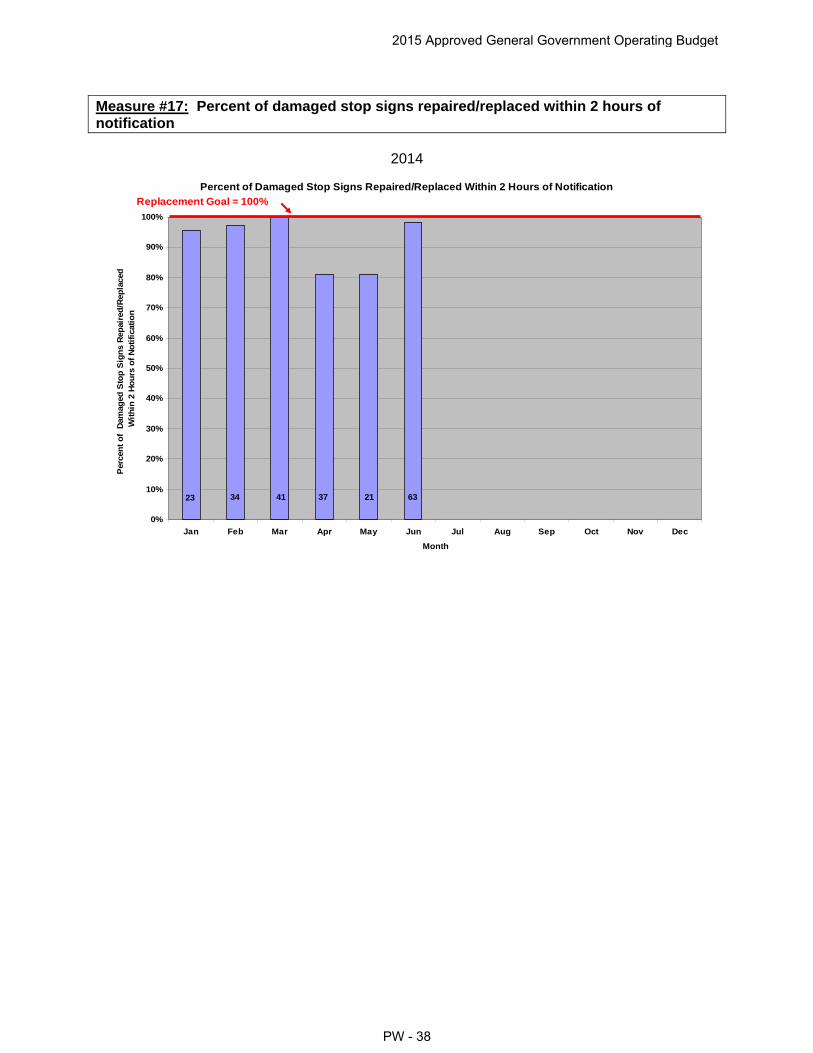
Measure #17: Percent of damaged stop signs repaired/replaced within 2 hours of notification
2014 Percent of Damaged Stop Signs Repaired/Replaced Within 2 Hours of Notification
0%
10%
20%
30%
40%
50%
60%
70%
80%
90%
100%
Jan Feb Mar Apr May Jun Jul Aug Sep Oct Nov Dec
Month
Per
cen
t o
f D
amag
ed S
top
Sig
ns
Rep
aire
d/R
epla
ced
W
ith
in 2
Ho
urs
of
No
tifi
cati
on
Replacement Goal = 100% 23 34 41 37 21 63
2015 Approved General Government Operating Budget
PW - 38
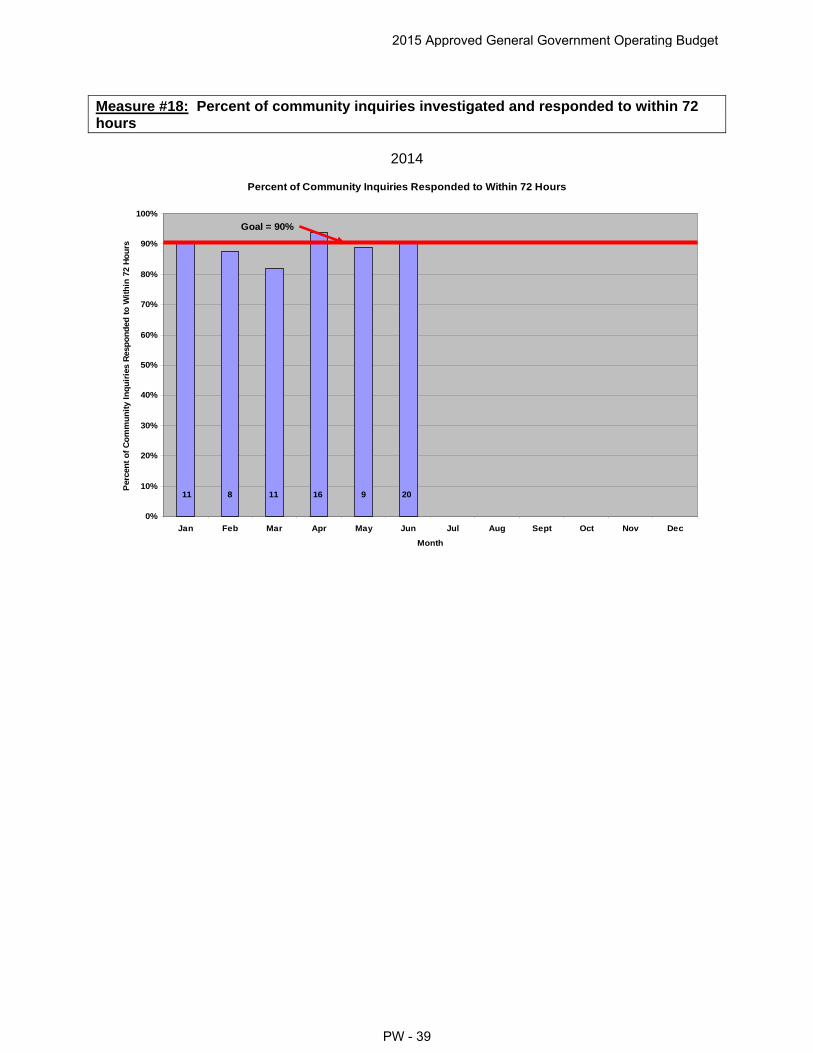
Measure #18: Percent of community inquiries investigated and responded to within 72 hours
2014
Percent of Community Inquiries Responded to Within 72 Hours
0%
10%
20%
30%
40%
50%
60%
70%
80%
90%
100%
Jan Feb Mar Apr May Jun Jul Aug Sept Oct Nov Dec
Month
Per
cen
t o
f C
om
mu
nit
y In
qu
irie
s R
esp
on
ded
to
Wit
hin
72
Ho
urs
Goal = 90%
11 8 11 16 9 20
2015 Approved General Government Operating Budget
PW - 39

PVR Measure WC: Managing Workers' Compensation Claims
No data for second quarter of 2013, changing to a new record keeping system
Reducing job-related injuries is a priority for the Administration by ensuring safe work conditions and safe practices. By instilling safe work practices we ensure not only the safety of our employees but reduce the potential for injuries and property damage to the public. The Municipality is self-insured and every injury poses a financial burden on the public and the injured worker's family. It just makes good sense to WORK SAFE.
Results are tracked by monitoring monthly reports issued by the Risk Management Division.
344,000 222,440
1,478,849
60,682 5,000 0
200,000
400,000
600,000
800,000
1,000,000
1,200,000
1,400,000
1,600,000
12/31/2011 12/31/2012 12/31/2013 3/31/2014 6/31/2014
Workers' Compensation Claims Public Works
2015 Approved General Government Operating Budget
PW - 40

Equipment Maintenance Operations
Description The Equipment Maintenance Operations is a section of the Maintenance and Operations Division in the Public Works Department. The Equipment Maintenance Operations section is appropriated to fund 601 which is classified as an internal service fund. The 601 fund accounts for the day-to-day operational management and maintenance of general government equipment and vehicles. The appropriation for this fund is separately disclosed on the ordinance that approves the General Government Operating Budget, as it is funded by direct cost expenditures included in the GGOB under each department’s Contractual/Other Services budget. Department Services To preserve, maintain, and manage Municipal general government vehicles and equipment while providing safe, effective vehicles and equipment for Municipal operations and programs.
2015 Approved General Government Operating Budget
PW - 41
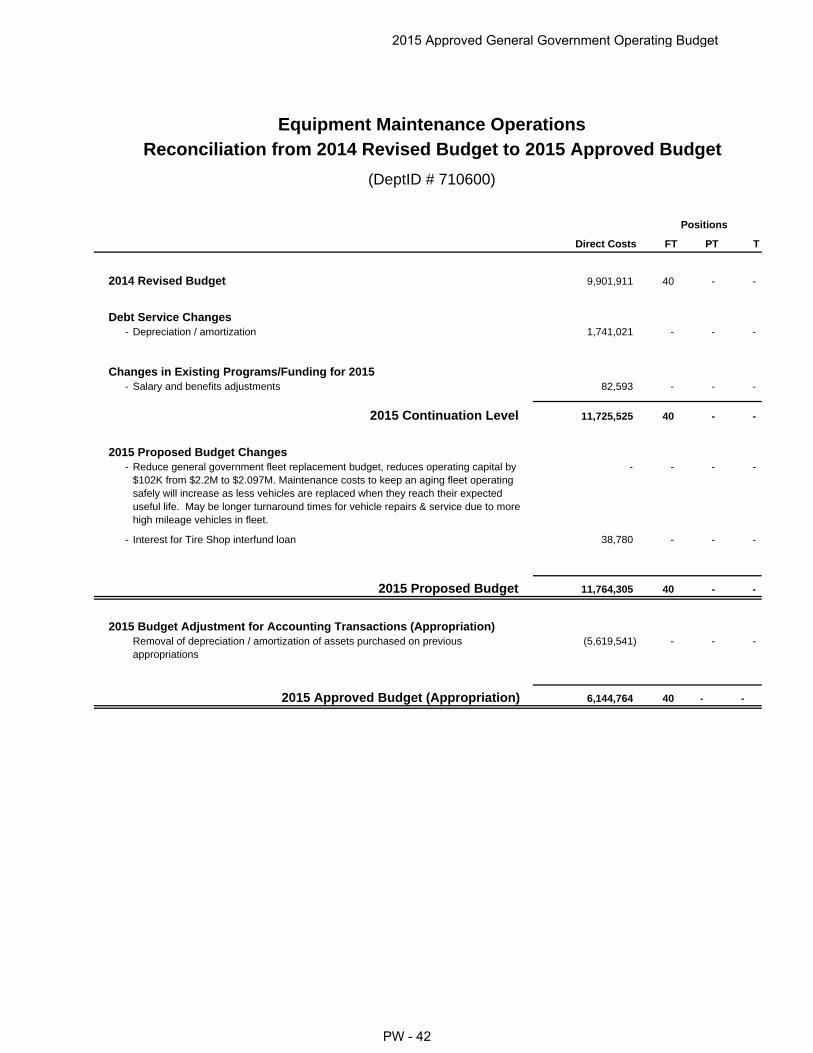
Direct Costs FT PT T
9,901,911 40 - -
- Depreciation / amortization 1,741,021 - - -
- Salary and benefits adjustments 82,593 - - -
11,725,525 40 - -
- Reduce general government fleet replacement budget, reduces operating capital by $102K from $2.2M to $2.097M. Maintenance costs to keep an aging fleet operating safely will increase as less vehicles are replaced when they reach their expected useful life. May be longer turnaround times for vehicle repairs & service due to morehigh mileage vehicles in fleet.
- - - -
- Interest for Tire Shop interfund loan 38,780 - - -
2015 Proposed Budget 11,764,305 40 - -
Removal of depreciation / amortization of assets purchased on previous appropriations
(5,619,541) - - -
2015 Approved Budget (Appropriation) 6,144,764 40 - -
Positions
(DeptID # 710600)
2015 Continuation Level
2015 Budget Adjustment for Accounting Transactions (Appropriation)
2015 Proposed Budget Changes
Equipment Maintenance Operations
Debt Service Changes
Changes in Existing Programs/Funding for 2015
2014 Revised Budget
Reconciliation from 2014 Revised Budget to 2015 Approved Budget
2015 Approved General Government Operating Budget
PW - 42

2013Actuals
2014Revised
2015Approved
15 v 14% Chg
Direct Cost by CategorySalaries and Benefits 3,905,475 4,394,891 4,477,483 1.88%
Supplies 1,324,406 1,393,500 1,393,500 -
Travel - - -
Contractual/Other Services 303,797 235,000 235,000 -
Equipment, Furnishings 718 - -
Manageable Direct Cost Total 5,534,396 6,023,391 6,105,983 1.37%
Debt Service 186 - 38,780
Depreciation/Amortization 4,187,102 3,878,520 5,619,541 44.89%
Direct Cost Total 9,721,683 9,901,911 11,764,304 18.81%
Revenue by FundFund 601000 - Equipment Maintenance 11,570,791 9,850,516 9,730,327 <1.22%>
Revenue Total 11,570,791 9,850,516 9,730,327 <1.22%>
Positions as Budgeted2013 Revised 2014 Revised 2015 Approved
Full Time Part Time Full Time Part Time Full Time Part Time
Body Repair Tech II 1 - 1 - 2 -
Equipment Service Tech I 4 - 4 - 3 -
Equipment Service Tech II 3 - 3 - 3 -
Equipment Technician 16 - 16 - 16 -
Equipment Technician/Welder 2 - 2 - 2 -
Expeditor - - - - 1 -
General Foreman 1 - 1 - 1 -
Lead Equipment Technician 2 - 2 - 2 -
Maintenance Supervisor 3 - 3 - 3 -
Maintenance Worker I 1 - 1 - 1 -
Maintenance Worker II 1 - 1 - 1 -
Manager - - - - 1 -
Parts Warehouser I 2 - 2 - - -
Parts Warehouser II 1 - 1 - 2 -
Public Works Superintendent 1 - 1 - - -
Senior Office Associate 1 - 1 - 1 -
Warranty Administrator 1 - 1 - 1 -
Positions as Budgeted Total 40 - 40 - 40 -
Public WorksDivision Summary
(Fund Center # 710600)
PW Maintenance & Operations
2015 Approved General Government Operating Budget
PW - 43

Net Cost
Manageable Direct Cost 5,534,396 6,023,391 6,105,983 1.37%
Debt Service 186 - 38,780 -
Depreciation/Amortization 4,187,102 3,878,520 5,619,541 44.89%
Charges by/to Other Departments 1,679,670 - 1,650,728 -
Program Generated Revenue (11,570,791) (9,850,516) (9,730,327) <1.22%>
Net Cost Total (169,438) 51,395 3,684,705 7069.35%
Direct Cost by CategorySalaries and Benefits 3,905,475 4,394,891 4,477,483 1.88%
Supplies 1,324,406 1,393,500 1,393,500 -
Travel - - - -
Contractual/Other Services 303,797 235,000 235,000 -
Equipment, Furnishings 718 - - -
Manageable Direct Cost Total 5,534,396 6,023,391 6,105,983 1.37%
Debt Service 186 - 38,780 -
Depreciation/Amortization 4,187,102 3,878,520 5,619,541 44.89%
Direct Cost Total 9,721,683 9,901,911 11,764,304 18.81%
Intra-Governmental ChargesCharges by/to Other Departments 1,679,670 - 1,650,728 -
Program Generated Revenue406620 - Reimbursed Cost-ER - 13,000 - -
406625 - Rmb Cost-NonGrntFund 968 - 13,000 -
408380 - Prior Yr Exp Recov 17,403 - - -
408390 - Insurance Recoveries 71,063 142,000 142,000 -
408540 - Fleet Rental Revs 9,893,106 9,851,269 9,731,080 <1.22%>
440010 - GCP CshPool ST-Int 52,547 170,000 170,000 -
440020 - CIP Csh Pools ST Int 51,981 (14,000) (14,000) -
440040 - Other Short Term Int - 6,000 6,000 -
440080 - UnRlzd Gns&Lss Invs (77,309) - - -
450010 - Contr Other Funds 316,639 - - -
460050 - Gn/Lss Sle Prprty (Full) 1,096,154 (375,000) (375,000) -
460070 - MOA Property Sales 148,239 57,247 57,247 -
Program Generated Revenue Total 11,570,791 9,850,516 9,730,327 <1.22%>
Public WorksDivision Detail
(Fund Center # 710600)
PW Maintenance & Operations
2014Revised
2015Approved
2013Actuals
15 v 14% Chg
2015 Approved General Government Operating Budget
PW - 44