public university of navarra department of health sciences
TRANSCRIPT

Public University of Navarra
Department of Health Sciences
Physical behaviors, sarcopenia and adverse events
in the Toledo Study of Healthy Ageing
Doctoral thesis
Juan Luis Sánchez-Sánchez
June 2020
Supervisors
Leocadio Rodríguez Mañas, MD
Mikel Izquierdo Redín, PhD


Physical behaviors, sarcopenia and
adverse events in the Toledo study
of healthy ageing
Juan Luis Sánchez-Sánchez
Department of Health Sciences
Public University of Navarre
Pamplona, Spain


“Let everything happen to you: beauty and terror.
Just keep going. No feeling is final.”
Book of Hours, I 59
Rainer Maria Rilke


“Lo mismo con las canciones los pájaros, los alfabetos,
si quieres que algo se muera déjalo quieto”.
Movimiento, Salvavidas de Hielo
Jorge Drexler

VIII
Agradecimientos
Pienso en la vida como una serie de casualidades que se suceden una tras otra. Necio
aquel que piensa que la parte que le toca es de algún modo sustancial en relación a la
que no.
En mi caso, hacer una tesis doctoral y lo que de ella resulta fue una de esas casualidades.
Hablo desde mi perspectiva (quizá alguno nació siendo doctor). Una cosa llevó a la otra.
Quiero aprovechar estos párrafos para reconocer a esas casualidades que han
contribuido positivamente de una u otra forma a que me encuentre hoy aquí.
En primer lugar, a mis padres, Juan Luis e Isi, por su amor inconmensurable, por su fe
ciega en sus hijos, por alegrarse más cuando vienen buenas y sufrir más que nosotros
cuando vienen malas. Por estar SIEMPRE ahí.
A mis hermanos. A María, por ser siempre un espejo en el que mirarse. A Alberto (más
compañero de vida no se puede ser), por enseñarme que existe la telepatía. Os quiero
hermanos. Y a los que los acompañan, Jordan y Carmen, por introducir mucho más que
acentos exóticos en mi familia (que también).
A mi abuela Joaquina, que hoy estará más ancha que larga, porque “una madre y una
capa tó lo tapan”. Imagínate la madre de otra madre. Por todo lo que te hubiera gustado
cogernos y no nos pudiste coger.
A mis abuelos, Luis y Carmen, por su eterna lucha por una vida mejor y ser mis conejillos
de indias preferidos.
A mis tíos y primos, por ser padres, amigos y hermanos.
Especialmente a María, mi compañera de vida. Por transformar a un pintas en lo que
hoy soy. Por el tiempo que te robo cuando mi sueño me lleva lejos. Por apuntalar la viga
cuando parece que todo se derrumba. Esto también es tuyo.
A mis amigos, por ser casualidades que llegaron para quedarse. A Tyces, por la portada
y por ser el tercer gemelo. A Pancho, porque mi alegría se correlaciona con la tuya. A
Rocío, por tu amor por la ciencia de la vida y por el que nos das a nosotros. A Kalvi,
Yusta, Peli y demás, por vaciar el pueblo cuando vas y no están. A Tetín, a Laura. A los
de Getafe por esa maravillosa certeza de que nada ha cambiado, nada cambia y nada
cambiará.
IX
Y a más casualidades que aparecieron por el camino. A mis compañeros de la Fundación
y del Servicio de Geriatría del Hospital de Getafe, por descubrirme la pasión por todo lo
que tenga más de 70 años. A los sujetos de los estudios en los que he participado, porque
yo les puse a hacer sentadillas, pero ellos me brindaron mucho más. A los que
aparecieron en Navarra: a Isa, por sus recetas y su amistad; a Miriam, por los cafés y su
sempiterna lucha por despertar en mí su amor por los bichos intestinales (algún día lo
conseguirás). A la gente del Servicio de Geriatría del Complejo Hospitalario de Navarra
y de Navarrabiomed, por tener siempre una sonrisa y hacerme sentir parte de ellos. A
los Santamaría Agudo, mi familia adoptiva al norte del Sadar.
A Bati, por presentarme Stata, por tu excepcional manera de sobreestimar mis
cualidades. Por tu apoyo y amistad.
A los coautores de mis trabajos, por su inestimable contribución, imprescindible para
que el barco llegase a buen puerto. Especialmente a Stefan y a José Antonio, por nuestras
peleas estadísticas. Al personal del Estudio de Toledo, a Franjo, por los datos y su entera
disposición.
A Leo, por confiar en mi cuando rompía el cascarón y por seguir haciéndolo después de
todo. Por pisarme el freno cuando hace falta y por tus siempre acertados consejos (jamás
me perdonaré haberlo contrastado). Por ser mejor persona que investigador.
A todos vosotros, gracias por haberos quedado e incorporaros a mi vida durante este
proceso. Sólo os pido que sigáis ahí.
¡¡GRACIAS!!
Juanlu.

X

XI
LIST OF ABBREVIATIONS
XII
List of abbreviations
ACSM: American College of Sports Medicine
ADL: Activities of Daily Living
AHA: American Heart Association
BADL: Basic Activities of Daily Living
BMI: Body Mass Index
CDCP: Center for Disease Control and Prevention
COPD: Chronic Obstructive Pulmonary Disease
CRP: C-Reactive Protein
CVD: Cardiovascular Disease
DHEA: Dehydroepiandrosterone
DHHS: Department of Health & Human Services
EU: European Union
EWGSOP: European Working Group on Sarcopenia in Older People
FI: Frailty Index
FNIH: Foundations of the National Institutes of Health
FP: Frailty Phenotype
FRADEA Study: Fragilidad y Dependencia en Albacete
GBTM: Group-Based Trajectory Modelling
GH: Growth Hormone
HF: Heart Failure
HIC: High-Income Countries
HT: Hypertension
HRQoL: Health-Related Quality of Life
IGF-I: Insulin-like Growth Factor-1
IADL: Instrumental Activities of Daily Living
ICD: International Classification of Diseases
IL-6: interleukin 6
LMIC: Low- and Middle- Income Countries
LPA: Light Physical Activity

LIST OF ABBREVIATIONS
XIII
£: United Kingdom Pounds Sterling
MET: Metabolic Equivalent
MHC-I: Myosin Heavy Chain-I
MHC-II: Myosin Heavy Chain-II
MI: Myocardial Infarction
MIC: Middle-Income Countries
MM: Muscle Mass
MPA: Moderate Physical Activity
MVPA: Moderate-to-Vigorous Physical Activity
PA: Physical Activity
PPM: Physical Performance Measures
RMR: Resting Metabolic Rate
SB: Sedentary Behaviour
SC: Satellite Cell
SPPB: Short-Physical Performance Battery
TNFα: Tumor Necrosis Factor Alpha
TSHA: Toledo Study of Healthy Ageing
T2DM: Type 2 Diabetes Mellitus
UN: United Nations
US: United States of America
USD: United States Dollars
VPA: Vigorous Physical Activity
WHO: World Health Organization
TABLE OF CONTENTS
XIV
Table of contents
Agradecimientos ................................................................................................................... VIII
Table of contents .................................................................................................................. XIV
List of abbreviations ............................................................................................................. XII
Summary-Resumen ................................................................................................................... 1
Declaration ................................................................................................................................. 8
Financial Support, List of Publications and Conference Papers .................................... 10
General Background ............................................................................................................... 12
1. Population Ageing ......................................................................................................... 12
1.1 Population projections in the World, Europe and Spain ............................................... 12
1.2 The demographic transition: a challenge for older adult’s care .................................. 17
2. Healthy vs. Accelerated Ageing .................................................................................... 20
2.1 What is beneath intrinsic capacity decline? .................................................................. 21
2.2 Healthy Ageing Phenotypes ........................................................................................... 23
3. Frailty ............................................................................................................................. 25
4. Sarcopenia ...................................................................................................................... 31
4.1 Sarcopenia definition .............................................................................................. 31
4.2 Sarcopenia epidemiology ........................................................................................ 31
4.3 Sarcopenia: a public health issue ........................................................................... 33
4.4 Sarcopenia evolution and physiopathology ............................................................ 34
4.5 Sarcopenia as a determinant of intrinsic capacity loss ........................................... 36
4.6 Sarcopenic Obesity and Osteosarcopenia ............................................................... 36
4.7 Sarcopenia: Frailty’s biological substrate? ............................................................ 38
5. Opportunities for healthy ageing promotion .............................................................. 39
6. Physical Activity: a potential Intrinsic Capacity Booster .......................................... 40
6.1 Physical Activity, Sedentary Behaviour, Exercise and Health ................................ 40
6.2 Physical Activity parameters as determinants of the response ............................... 42
6.3 Physical Activity Guidelines for Health .................................................................. 43
6.4 Mechanisms underlying benefits of Physical Activity/Exercise on Health.............. 44
6.5 Mechanisms underlying PA/SB effects on health .................................................... 48
7. Physical Activity and Health in Older Adults ............................................................. 49
7.1 Physical activity/exercise to counteract intrinsic capacity loss of ageing .............. 49
7.2 Free-Living Physical Behaviors and Healthy Ageing Epidemiology ...................... 51
7.3 Free-living PA epidemiology pitfalls ...................................................................... 52
8. Toledo Study of Healthy Ageing .................................................................................. 59

TABLE OF CONTENTS
XV
Aims and layouts of the thesis .............................................................................................. 83
Chapter 1: Sedentary behaviour, physical activity, and sarcopenia among older
adults in the TSHA: isotemporal substitution model ...................................................... 85
Chapter 2: Physical activity trajectories, mortality, hospitalization and disability in
the Toledo study of healthy aging ..................................................................................... 109
Chapter 3: General discussion ............................................................................................ 133
Physical Behaviors as modulators of healthy ageing ....................................................... 134
Associations between PA and SB and sarcopenia and its determinants (Chapter 1) .... 135
Late-life PA trajectories and healthy ageing (Chapter 2) ............................................... 144
Implications for clinical practice and public health ......................................................... 152
Future research ................................................................................................................... 157
Conclusions-Conclusiones .................................................................................................. 178
Publications-Publicaciones ................................................................................................. 181

TABLE INDEX
XVI
Table Index General Discussion Tables
Page
Table 1. Sarcopenia operationalizations and cut points proposed 30
Chapter 1 Tables
Table 1.1 Demographic characteristics stratified by the sarcopenia status according to FNIH
87
Table 1.2. Regression coefficients expressing associations between time engaged in different PA intensity bands and sarcopenia determinants
88
Table 1.3. Associations between time engaged in different PA intensity bands and sarcopenia prevalence
91
Table 1.4. OR of the isotemporal substitution of different volumes of SB and LPA with MVPA
92
Table 1.S1. Older adults-specific cut-off points for classifying PA behavior 100
Chapter 2 Tables
Table 2.1. Baseline Characteristics of the Sample
113
Table 2.2. Multivariate Associations between PA Trajectories and Adverseerse Outcomes
115

FIGURE INDEX
XVII
Figure Index
General Discussion Figures Page
Figure 1. Global population by broad age group demographic evolution of the different age population segments from 1980 to 2050
12
Figure 2. Population pyramid in Spain in the years 1950, 1990, 2020 and 2050 (projection)
13
Figure 3. Total fertility rate and life expectancy evolution and projections in the period 1950-2100 in Spain
14
Figure 4. Global life expectancy and Healthy Life Expectancy at birth and at age 60 in the period 2000-2016
15
Figure 5. National-level preventable fractions of disability associated with risk factors under elimination and reduction scenarios for adults ages 18–74, 2013
17
Figure 6. Domains of the intrinsic capacity construct
18
Figure 7. Physiological Reserve/Intrinsic Capacity Trajectories Associated and influence of comorbidities in the disabling cascade
20
Figure 8. Venn diagram displaying the overlap between frailty, comorbidity and disability
23
Figure 9. Frailty conceptual definitions
25
Figure 10. Cycle of frailty according to Fried’s conception
26
Figure 11. Frailty prevalence in older adults (>65 years), according to physical frailty and broader definitions and stratified by sex and age-groups
27
Figure 12. Adulthood trajectories in maximum knee extension torque, maximum handgrip strength, lower extremity muscle power and calf muscle area in the InChianti Study
32
Figure 13. Sarcopenia physiopathology
33
Figure 14. Risk factors, muscle–bone crosstalk (through myokines, osteokines, adipokines), and the pathophysiology of osteosarcopenia
36
Figure 15. Adjusted prevalence ratios for chronic conditions by categories of adherence to PA guidelines
39

FIGURE INDEX
18
Figure 16. Schematic representation of Excitation-Transcription-Adaptation Coupling in Skeletal Muscle
44
Figure 17. Summary of the main myokines, their putative effects, and the molecular signals/pathways involved
45
Figure 18. Putative mechanisms linking SB and chronic disease
46
Figure 19. Accelerometer-derived minute by minute and day-long estimates of time in each PA intensity category using healthy young adults reference PA intensity cut-points vs. age- and disease (T2DM)-specific PA intensity cut-points
52
Figure 20. Percentile Curves LPA, and MVPA over the lifespan (6 years old to 84 years old) for males and females
55
Figure 21. Conceptual map of research questions addressed by this thesis, within the healthy vs accelerated ageing scope
58
Chapter 1 Figures
Figure 1.1. Isotemporal substitution of SB (1h min/day) LPA and MVPA on
standardized sarcopenia determinant values
89
Figure 1.2. Predicted values for gait speed and handgrip strength for an average
male participant obtained from fitting a natural cubic spline with 5 degrees of
freedom
90
Chapter 2 Figures
Figure 2.1. PA Trajectories by age. PA groups based on self-reported PA via PASE scores
112
Figure 2.2. Forest plots of the risk of the different adverse outcomes in the different PA trajectory groups
116
Figure 2.3. Forests plot of the differences in the risk of adverse outcomes between Low Physical Activity-Increasing and Low Physical Activity Decreasing trajectory groups
116

XIX


1
Summary-Resumen

SUMMARY-RESUMEN
2
Summary Ageing population is a worldwide occurrence and this phenomenon poses substantial
burden on individuals and healthcare systems. Life expectancy increases have not been
accompanied by parallel healthspan expansions, which have led to higher rates of
disability among a growing share of the population. Primary ageing, lifestyle factors and
comorbidities interact to shape the functional trajectories along late-life. Healthy ageing
refers to the maintenance of functional ability that guarantees wellbeing in older persons
and is believed to occur in the absence of pathologies. In contrast, the presence of
diseases and deleterious lifestyle factors might drive an accelerated ageing and
premature disability.
The loss of muscle mass and function, termed sarcopenia, has recently being proposed
as a key factor leading to disability and adverse events in older adults. Physical exercise
has been proposed as the best strategy for maintenance and development of functional
ability. Nevertheless, few older adults partake in structured exercise regimes and the
best dosage and intensity remains unclear in such a heterogeneous population. In this
scenario, free-living physical activity and sedentary behaviour might constitute the
differential factor determining functional ability trajectories. Recent availability of
objective physical activity measures that allow better characterization of physical
behaviours together with novel statistical methods have allowed to address open
research questions regarding this relevant health determinant in older adults, such as
the role of light physical activity and sedentary behaviour and the dynamic nature of
physical activity on disability-related conditions and adverse outcomes.
The current Ph.D. dissertation intends to add insight into the associations between
physical activity and sedentary behaviour and healthy ageing, overcoming limitations
identified in previous research, through two scientific works using data from the TSHA,
an ongoing population-based study.

SUMMARY-RESUMEN
3
Study 1 (Chapter 1)
In the first study (Chapter 1), we explored the associations between objectively assessed
free-living physical activity and sedentary behaviour and sarcopenia and its
determinants. A common methodological limitation of physical activity epidemiology
when using accelerometers is the overlooking of the fact that the time in which a subject
can partake in physical activity and sedentary behaviour is limited. Isotemporal
substitution models allowed us for the mathematical estimation of the effect of
reallocating certain amount of time in one physical activity intensity category by the
same amount in other on the odds of sarcopenia and its determinants. Furthermore, we
used age-specific cut-points for physical activity intensity categorization, avoiding
underestimation due to energy cost differences in older adults. The results pointed to
the unique dose-response association between moderate-to-vigorous physical activity
and sarcopenia and its determinants, both substituting sedentary behaviour and light
physical activity, and an insufficient effect of the latter for promoting skeletal muscle
health. Our results support previous evidence of protective role of moderate-to-vigorous
physical activity on sarcopenia and suggest the presence of an intensity threshold below
which little benefit is obtained. These findings might guide interventions tailored at
preventing or reverting sarcopenia.

SUMMARY-RESUMEN
4
Study 2 (Chapter 2)
Despite substantial unequivocal evidence relating physical activity and healthy ageing
has been accumulated, physical activity is a dynamic behavior that changes along time
and its evolution might be associated to adverse events distinctly to cross-sectional
estimates. The main purpose of this study was to investigate the presence of different
late-life physical activity trajectories within the TSHA sample and their associations with
adverse outcomes. We found 5 physical activity trajectories within our sample.
Belonging to the trajectories prospectively maintaining/increasing baseline physical
activity levels was associated with a lower risk of mortality, hospitalization and onset
and worsening of disability compared to those presenting with low baseline physical
activity levels and reducing physical activity along follow-up. In addition, increasing
physical activity trajectory was associated with lower risk of disability outcomes in
comparison with decreasing physical activity levels despite similar low baseline values.
These findings support the beneficial effect of late-life physical activity maintenance for
adverse events prevention and the potential of increasing physical activity for activities
of daily living disability prevention, even in the most inactive older adults.
Consequently, the research results included in this thesis dissertation reinforce the role
of physical behaviors as modulators of the physiological reserve loss with ageing, both
captured through a single organic system and outcome levels.

SUMMARY-RESUMEN
5
Resumen
El envejecimiento de la población es un fenómeno global que puede tener unas
implicaciones relevantes tanto a nivel de la salud individual como en los sistemas
sanitarios. Esto se debe a que los aumentos en la esperanza de vida observados en los
últimos siglos no se han visto acompañados concurrentemente de aumentos de los años
vividos sin enfermedad. El desarrollo de enfermedades crónicas y su aparición en forma
de comorbilidad unido a los efectos del envejecimiento primario ha derivado en la
progresiva pérdida de función y el desarrollo de discapacidad.
El envejecimiento saludable se define como el mantenimiento de la capacidad funcional
que garantiza el bienestar en el adulto mayor. En contraposición, la acumulación de
patologías y la presencia de estilos de vida no saludables pueden condicionar un
envejecimiento acelerado y la emergencia prematura de la discapacidad.
La pérdida de masa y función muscular que acompaña al envejecimiento (sarcopenia),
constituye una de las piedras angulares en el desarrollo de la discapacidad en el anciano.
El ejercicio físico ha sido propuesto como la herramienta de elección para mantener y
aumentar la función física en ancianos y, por ende, prevenir el deterioro funcional
asociado con la sarcopenia.
Sin embargo, muy pocos sujetos ancianos participan en programas estructurados de
ejercicio y los parámetros óptimos de esos programas se desconocen. En ese contexto,
los comportamientos físicos espontáneos (comportamiento sedentario y actividad física),
podrían ser determinantes relevantes de la capacidad funcional en el anciano. La
incorporación de medidas objetivas en la epidemiología de la actividad física y el
reciente desarrollo de nuevos métodos estadísticos ha permitido atender preguntas de
investigación como las asociaciones del sedentarismo y distintos niveles de intensidad
de actividad física con parámetros de salud e incorporar la naturaleza dinámica de los
comportamientos físicos como factor determinante de salud.
La presente tesis doctoral pretende profundizar en las asociaciones entre los niveles de
actividad física y sedentarismo e indicadores de envejecimiento saludable (sarcopenia y
eventos adversos), superando algunas limitaciones identificadas en la evidencia previa.
En la misma se han incluido dos trabajos realizados con datos del Estudio de Toledo del
Envejecimiento Saludable, un estudio poblacional en curso.
SUMMARY-RESUMEN
6
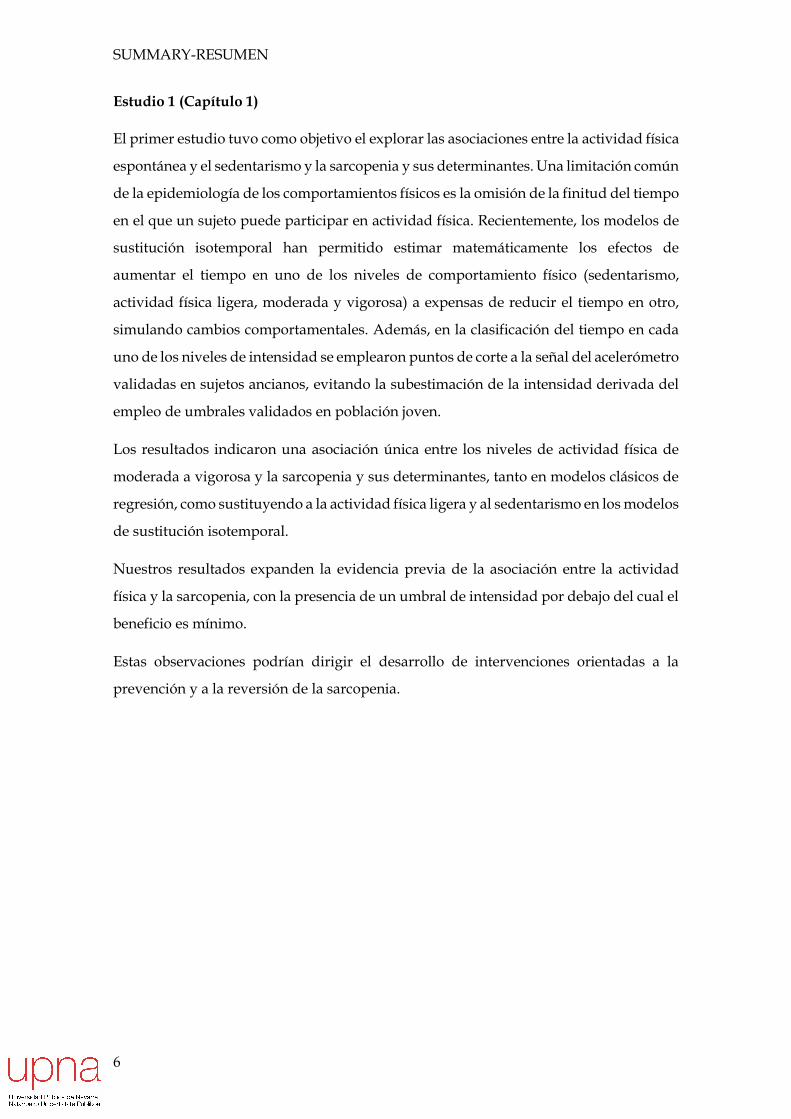
Estudio 1 (Capítulo 1)
El primer estudio tuvo como objetivo el explorar las asociaciones entre la actividad física
espontánea y el sedentarismo y la sarcopenia y sus determinantes. Una limitación común
de la epidemiología de los comportamientos físicos es la omisión de la finitud del tiempo
en el que un sujeto puede participar en actividad física. Recientemente, los modelos de
sustitución isotemporal han permitido estimar matemáticamente los efectos de
aumentar el tiempo en uno de los niveles de comportamiento físico (sedentarismo,
actividad física ligera, moderada y vigorosa) a expensas de reducir el tiempo en otro,
simulando cambios comportamentales. Además, en la clasificación del tiempo en cada
uno de los niveles de intensidad se emplearon puntos de corte a la señal del acelerómetro
validadas en sujetos ancianos, evitando la subestimación de la intensidad derivada del
empleo de umbrales validados en población joven.
Los resultados indicaron una asociación única entre los niveles de actividad física de
moderada a vigorosa y la sarcopenia y sus determinantes, tanto en modelos clásicos de
regresión, como sustituyendo a la actividad física ligera y al sedentarismo en los modelos
de sustitución isotemporal.
Nuestros resultados expanden la evidencia previa de la asociación entre la actividad
física y la sarcopenia, con la presencia de un umbral de intensidad por debajo del cual el
beneficio es mínimo.
Estas observaciones podrían dirigir el desarrollo de intervenciones orientadas a la
prevención y a la reversión de la sarcopenia.

SUMMARY-RESUMEN
7
Estudio 2 (Capítulo 2)
Pese a que la evidencia acumulada sobre el rol de la actividad física como determinante
del envejecimiento saludable es inequívoca, la naturaleza dinámica de la actividad física,
especialmente volátil en los últimos años de vida, ha despertado el interés sobre el papel
de la evolución en los patrones de actividad física como determinante de salud.
El objetivo del Estudio 2 fue el de evaluar la presencia de distintas trayectorias de
actividad física en la población del estudio de Toledo de Envejecimiento Saludable y sus
asociaciones con eventos adversos (mortalidad, hospitalización, discapacidad y
progresión de la discapacidad).
Se identificaron 5 trayectorias de actividad física que diferían tanto en los niveles de
actividad física inicial como en su progresión. La pertenencia a trayectorias de actividad
física de mantenimiento o aumento de la actividad física a lo largo del envejecimiento se
asoció con reducciones en la probabilidad de morir, ser hospitalizado, presentar alguna
limitación o empeoramiento en el estado funcional al seguimiento, en comparación a
aquellos presentando bajos niveles de actividad física iniciales y reducciones a lo largo
del tiempo.
Además, el aumento de la actividad física se asoció con reducciones en el riesgo de
limitación funcional incidente en aquellos sujetos con muy bajos niveles basales de
actividad física, en comparación con aquellos que la redujeron desde niveles similares.
Los resultados de este estudio contribuyen a la evidencia previa indicando el efecto
beneficioso del mantenimiento de la actividad física en los últimos años de vida en la
prevención de los eventos adversos y el potencial de obtención de beneficios con
incrementos de la actividad física, incluso en los sujetos ancianos más inactivos.

DECLARATION
8
Declaration
I, Juan Luis Sánchez Sánchez do hereby declare that scientific papers included in this
thesis dissertation have been published in international peer reviewed journals.
In order to adhere to the requirements of a thesis, the formats of the papers have been
adjusted accordingly. This edition did not change the content of the published articles.
The Ph.D. candidate was involved in study conception, data analysis, results
interpretation and the drafting of the manuscripts.

9
GENERAL BACKGROUND
10
Financial Support, List of Publications and Conference Papers
Financial Support
All the scientific publications embedded in this Ph.D. dissertation were produced using
data from the Toledo Study of Healthy Ageing (TSHA), which is funded by grants from
the Spanish Ministry of Economy, Industry and Competitiveness, co-financed by the
European Regional Development Funds (RD120001/0043) and the Centro de
Investigación Biomédica en Red en Fragilidad y Envejecimiento Saludable—CIBERFES
(CB16/10/00464). The funders had no role in the design and conduct of the study;
collection, management, analysis, and interpretation of the data; preparation, review, or
approval of the manuscript; and decision to submit the manuscript for publication.
The student did not receive any funding for the production of the research presented.
List of Publications
[1] Sánchez-Sánchez JL, Mañas A, García-García FJ, et al. Sedentary behaviour,
physical activity, and sarcopenia among older adults in the TSHA: isotemporal
substitution model. J Cachexia Sarcopenia Muscle 2019; 10: 188–198.
[2] Sanchez-Sanchez JL, Izquierdo M, Carnicero-Carreño JA, et al. Physical activity
trajectories, mortality, hospitalization, and disability in the Toledo Study of Healthy
Aging. J Cachexia Sarcopenia Muscle. Epub ahead of print 12 March 2020. DOI:
10.1002/jcsm.12566.
Scientific Communications at International Congresses
Oral Communication at the 15th International Congress of the European Geriatric
Medicine Society. “Longitudinal Physical Activity Trajectories and Mortality In The
Toledo Study Of Healthy Ageing”. Eur Geriatr Med (2019) 10 (Suppl 1):S1–S325-O-04.
Poster Communication at the International Conference on Frailty and Sarcopenia
Research: “Associations between physical activity levels, sedentary behavior and
sarcopenia in the Toledo Study using population-adapted cut-points”, J Frailty Aging
(2017) 6 (Suppl 1): S1-P-170.

11
General Background

GENERAL BACKGROUND
12
General Background
1. Population Ageing
1.1 Population projections in the World, Europe and Spain
Population ageing is a worldwide occurrence. The reduction of fertility rates together
with increases in life expectancy across the second half of the 20th and first decades of
21st century stand out as the main drivers of this demographic transition. Exceptional
life expectancy increases are the result of improvements in life conditions and
considerable advancements in medical science that have taken place during this period
[1].
During the period 1980-2019 the overall >65 years population has almost tripled, from
262 to 727 million persons worldwide. The increases in the proportion of octogenarians
has been especially appealing, since the number of people above 80 years of age have
grown from less than 36 to 143 million people [2, 3].
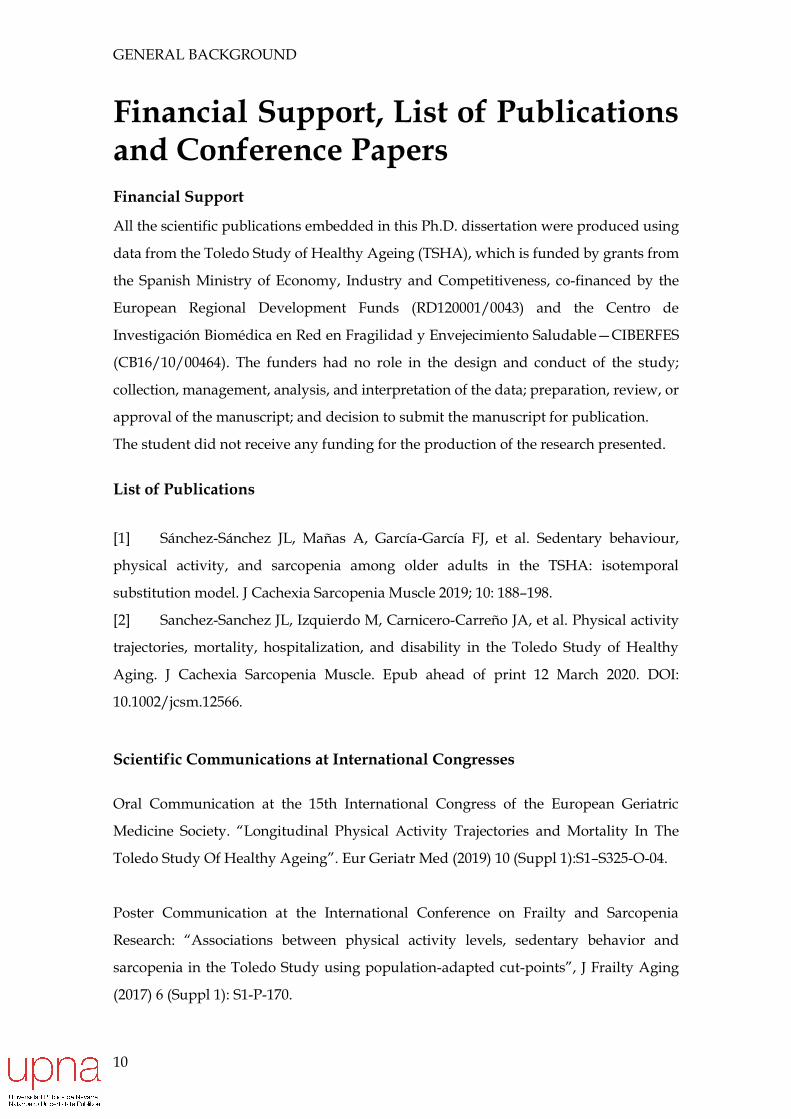
Notwithstanding these notable figures, this global demographic transition is an ongoing
process, believed to continue in the coming years, in which every country in the world
is expected to experience an increase in the share of population aged 65 or over (Figure
1). According to the UN 2019 World Population Prospects, it is expected that by 2050,
the share of the population above 65 years of age will rise from 9.3% in 2020 to 16% (1,5
billion people) of the total population. In addition, the number of very old people (i.e.
those above age 80) having tripled from 1990 to 2019, will grow even faster, and is
expected to triple again by 2050, reaching 426 million people worldwide [4].
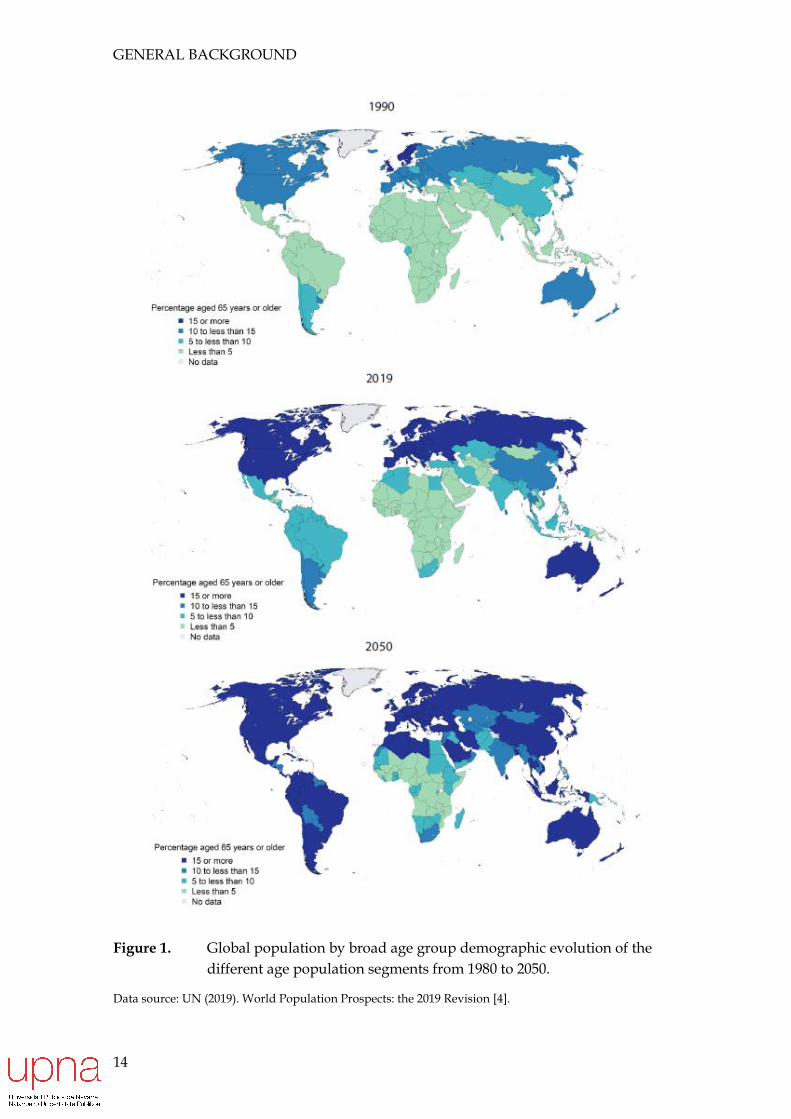
This population aging demographic transition has led to a reshaping of the age
distribution of our populations, with the narrowing of the bottom of population
pyramids in most of developed countries (Figure 2), with children and young age groups
becoming progressively smaller relative to aged groups. By 2045 it is projected that
people over 65 will outnumber the 15-24 age group (1.41 vs 1.35 billion people) and that
of children (0-14 years) by 2075 (2.1 billion vs 2.0) (Figure 3) [4].
Although the EU lies on an advanced stage of the ageing population process compared
to developing or low-income countries, life expectancy trends are expected to keep up,
with increases of 7.8 years and 6.6 years on average in the period 2016-2060 for men and

GENERAL BACKGROUND
13
women, respectively [5], which would make Europe the most aged geographical region
in the world.
Figures are especially remarkable in the case of Spain, due to the combination of sharp
fertility rate reductions, together with exceptional longevity achieved in the last decades.
From 1960 the total fertility rate has dropped from 2.7 to 1.34 [6] whereas life expectancy
at birth evolved from 71.98 to 83.6 in both sexes. It is estimated that by 2060 one third of
the population will be 65 years of age or above, and more than 50% of these will exceed
the age of 80 [7], placing Spain as the second oldest country in the world.
GENERAL BACKGROUND
14
Figure 1. Global population by broad age group demographic evolution of the
different age population segments from 1980 to 2050.
Data source: UN (2019). World Population Prospects: the 2019 Revision [4].
GENERAL BACKGROUND
15
Figure 2. Population pyramid in Spain in the years 1950, 1990, 2020 and 2050
(projection)*
*Uncertainty is shown in lighter shades for 95 per cent prediction intervals
Data source: UN (2019). World Population Prospects: the 2019 Revision [4].

GENERAL BACKGROUND
16
Figure 3. Total fertility rate (A) and life expectancy (B) evolution and projections
in the period 1950-2100 in Spain*.
*Medium-variant projections for 2020-2100 are shown as thin colored lines.
Data source: UN (2019). World Population Prospects: the 2019 Revision [4].
GENERAL BACKGROUND
17
1.2 The demographic transition: a challenge for older adult’s care
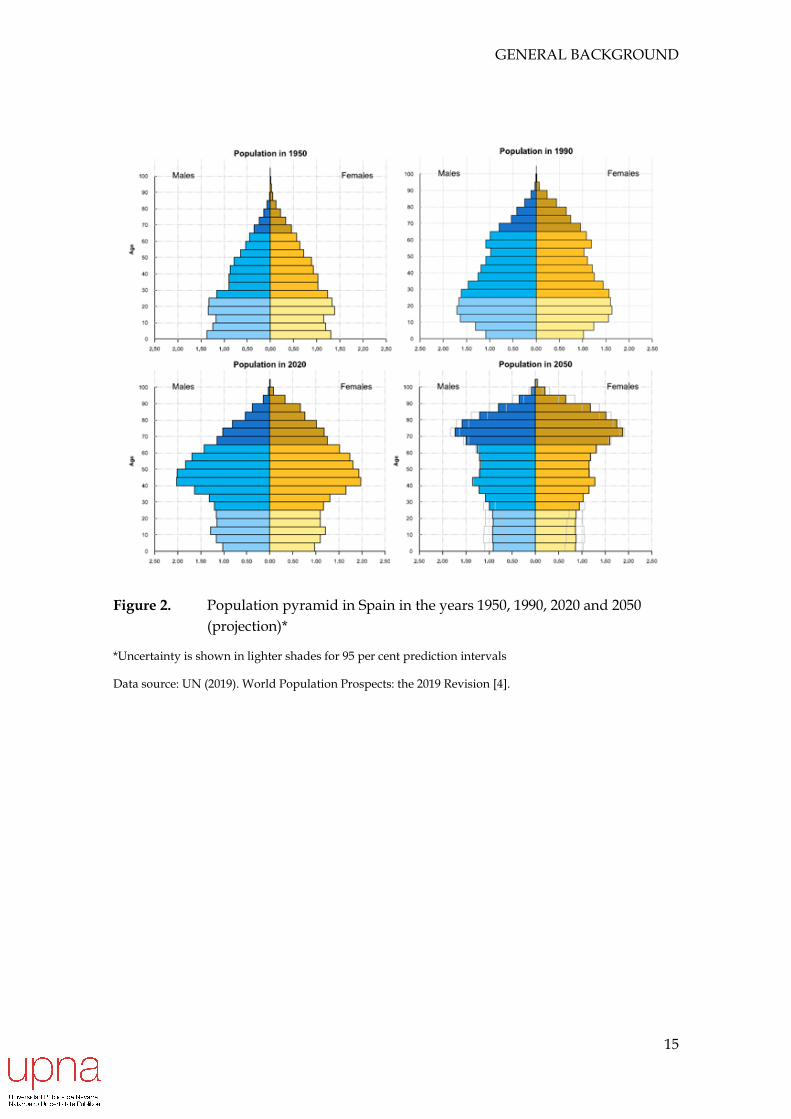
Although lifespan increase should undoubtedly be perceived as an important
accomplishment of modern societies comprising both improvements in life conditions
and fundamentally to the advances in medical science, this phenomenon has not been
accompanied with a concomitant increase in years of healthspan due to the
development of the so-called age-related pathologies. Whereas global life expectancy at
birth increased by 5.5 years between 2000 and 2016, the healthy life expectancy (mean
years lived without functional limitations and disability) did by 4.8 in the same period
(Figure 4) [8].
Figure 4. Global life expectancy and Healthy Life Expectancy (HALE) at birth and
at age 60 in the period 2000-2016
Data source: WHO (2019). World Health Statistics 2019: Monitoring health for the SDG [8].
In recent decades and from an epidemiological point of view, the burden of disease has
shifted from infectious diseases to morbidity from chronic non-communicable diseases
(cardiovascular diseases, cognitive disorders, T2DM, cancer, kidney disease, COPD, etc.)
[9]. These chronic conditions tend to accumulate (pluripathology), interact negatively in
a synergistic way with each other (comorbidity) and manifesting mainly as functional
decline rather than premature death.

GENERAL BACKGROUND
18
An increasing proportion of the population is living with multiple diseases and sub-
clinical impairments that together lead to disability and poor quality of life [1, 10].
Consequently, the entire society has become tasked with the care of a greater share of
persons characterized by high clinical complexity, the presence of disabling conditions
and social issues, drivers of increased financial and personal burden on healthcare and
social welfare systems, which finally might jeopardize their short-term sustainability [1,
5].
Among a constellation of issues, disability, the extreme end of the functional decline, is
the most appealing consequence of ageing populations [11]. The WHO has defined
disability as “an umbrella term for impairments, activity limitations and participation
restrictions”.
In the US, 3 out of 5 adults ≥ 65 years present with some kind of functional limitation
[12], whereas in Spain disability for IADL and ADL figures lay in 31,9% and 11,1%
among community-dwelling older adults. Disability prevalence is associated to female
sex and rockets in the oldest old, since 70% and 35% present with disability in IADL and
BADL, respectively [13].
Hence, a relevant question when judging the effect of ageing populations from the
individual and the entire society point of view, is whether increases in life duration
might in fact contribute to years lived in good health or being translated in a greater
number of years lived with disability [14, 15].
From a general point of view, incapacity for performing the ADLs in older people
decreases their quality of life, increases sanitary costs and contributes to premature death
[16–18]. Recent studies have shown that requiring major dependence on others for ADL
is a risk factor for elder abuse [19].
Although functional disability rates obviously increase in older and specially in the very
old people, disability is not arguably the unavoidable end of the ageing process [20] and
since its development rely on a myriad of not-fully understood factors, some of which
are surely modifiable (obesity, T2DM, smoking, alcohol consumption, physical activity,
cultural engagement and diet, among others) [21, 22]. In fact, some evidence has
estimated the share of disability potentially preventable through risk factors
elimination/reduction [23], and results points toward an hypothetical substantial

GENERAL BACKGROUND
19
reduction in disability rates if the burden of deleterious lifestyle factors was curbed
(Figure 5).
Therefore, the prevailing biomedical strategy has evolved from increasing longevity, to
the “compression of morbidity” paradigm, and finally to the increase of healthspan.
Increasing longevity is no longer a major concern of medicine, and the focus has moved
into the maintenance and prolongation of function along the ageing process [24] as a
mean of guaranteeing free-of-functional disabi ageing (i.e. optimal longevity).
To this end, the design and implementation of strategies for disability prevention and
postponement relies on the identification of target modifiable contributors to the
development and worsening of chronic conditions and functional decline.
Figure 5. National-level preventable fractions (expressed as percentages) of disability associated with risk factors under elimination and reduction scenarios for adults ages 18–74, 2013
Disability is defined as difficulty walking or climbing stairs; bathing; or independently conducting errands. 1+ Risk
Factor category indicates the presence of at least one of the five risk factors.
Data source: Mehta et al., 2017 [23].

GENERAL BACKGROUND
20
2. Healthy vs. Accelerated Ageing
In response to the demographic and epidemiological transitions, The WHO recently
defined a model of ageing termed “Healthy Ageing” as the ideal process of fostering and
maintaining the functional ability that enables wellbeing in older age. Functional ability
of an individual (health-related attributes that enable people to be and to do what they
have reason to value), by its part, is comprised by the intrinsic capacity (physical and
functional capabilities) and its interaction with the environment [25]. Intrinsic capacity
is the manifestation of the integrated function of different body functions and its
operationalization rely on 5 domains (locomotor, sensory, vitality, cognitive and
psychosocial) [26] (Figure 6).
From this perspective, older adult’s health is considered from a functional (intrinsic
capacity) rather than disease-based perspective. This has the potential to substantially
modify the way in which clinical practice is currently conducted, shifting from a reactive
disease-centered toward proactive functional ability-centered paradigms (with the aim
of preservation and promotion of intrinsic capacity and disability prevention),
addressing and adapting to the undergoing demographic and epidemiological
transitions.
Figure 6. Domains of the intrinsic capacity construct.
From Cesari et a., 2018 [26]

GENERAL BACKGROUND
21
2.1 What is beneath intrinsic capacity decline?
Mechanisms underlying the decreased physiological reserve of different body systems
mediating intrinsic capacity declines in ageing have been extensively researched [27–29].
A newly named area of biological research, geroscience, is devoted to the identification
of biological mechanisms determining trajectories of physiological ageing and the
strategies for healthspan expansion [30, 31]
Gradual declines in physiological reserve contribute to body system functions
impairment and functional decline along ageing. It has been suggested that these
changes could be the result of inherent (or primary) aging, secondary to health behaviors
(such as physical activity and nutrition) and the presence of comorbidities (obesity,
T2DM, CVDs, respiratory conditions such as COPD, etc.) and their interaction [11].
Harridge and Lazarus defined inherent (or primary) ageing as “inherited and intrinsic
biological process of change that occurs over time, unencumbered by confounding and
distorting negative lifestyle factors, which when present, ultimately lead to increased
risk of disease and death” [32]. Hence primary ageing, envisioned as a free-of-disease
and adverse health behaviors model of ageing, could the ideal target of the healthy
ageing paradigm prompted by the WHO in most of the individuals [24].
At the cellular and organ levels, chronic pro-inflammatory states, cellular senescence,
impaired proteostasis, hormonal changes, immunosenescence, insulin-resistance and
mitochondrial dysfunction drive changes that mediate reduced homeostatic responses
[33, 34], impaired function of integrated systems, such as musculoskeletal, vascular,
respiratory, endocrine, immune and nervous systems [28] and reduced intrinsic capacity
at the whole-body level.
When certain degree of decline is reached homeostatic mechanisms start failing [35], a
process that is overtly evident when the intrinsic capacity reserves are insufficient to
cope with requirements of ADLs [36] and the breaching of the disability threshold
ensues. Ideally, adverse events occur at the very end of life, but importantly, the presence
of deleterious life-long or late life-limited lifestyle factors (poor nutrition, inactivity,
alcohol and tobacco use among others) might lead to the development or aggravation of
comorbidities, such as respiratory (COPD) diseases, CVD (HF, HT, MI), obesity and
T2DM, that potentially condition an accelerated physiological reserve loss [37, 38].
GENERAL BACKGROUND
22
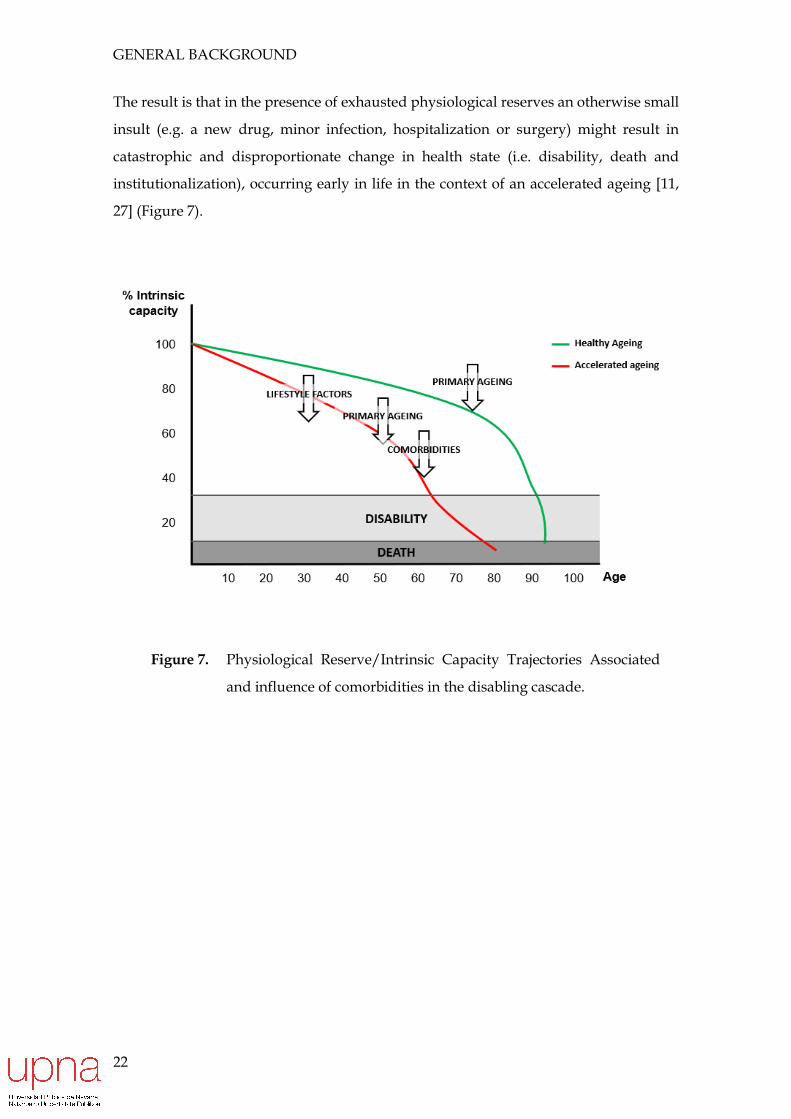
The result is that in the presence of exhausted physiological reserves an otherwise small
insult (e.g. a new drug, minor infection, hospitalization or surgery) might result in
catastrophic and disproportionate change in health state (i.e. disability, death and
institutionalization), occurring early in life in the context of an accelerated ageing [11,
27] (Figure 7).
Figure 7. Physiological Reserve/Intrinsic Capacity Trajectories Associated
and influence of comorbidities in the disabling cascade.

GENERAL BACKGROUND
23
2.2 Healthy Ageing Phenotypes
Extensive research has been carried out and several mechanisms have been identified
for explaining intrinsic capacity loss of ageing. As stated in previous sections, most are
ageing-inherent processes whose magnitude and pace are believed to be importantly
modulated by behaviors (such as PA, sedentarism, nutrition, smoking and alcohol
consumption) and co-occurrence of comorbidities. Unfortunately, the dissociation of
mechanisms being exclusively the result of primary ageing from those associated with
lifestyle and disease contributing to further impairment (and to what extent) or resulting
solely from disease remains a challenging enigma in the field of ageing physiology [39,
40].
Nevertheless, some evidences have been accumulated in this regard. As an example, loss
of muscle proteostasis has been putatively associated with normal ageing. Despite both
reduced protein synthesis and catabolic processes have been described in muscle ageing,
reduced anabolic responses following stimulus such as feeding and muscle contractions
is believed to occur in the healthily-ageing muscle (despite being greatly influenced by
the presence of factors such as inactivity and metabolic syndrome through insulin
resistance), whereas increased muscle protein breakdown has mostly been shown to be
present in extreme disuse and pathologic conditions [41, 42].
Master athletes as a healthy ageing model
In the study of different intrinsic capacity decline trajectories, senior master athletes have
arisen as an extreme primary ageing model lacking the influence of deleterious lifestyle
factors and comorbidities. Overt reductions in CRF [43–45], and MM at the single-
physiological system levels [46, 47] and progressive worse performance in sports (as
marker of integrative physiological function of multiple systems) [48], have been
described among senior athletes. These age-related declines in body systems function
occurring even in ideal aging conditions, such as high levels of PA, good nutrition and
absence of alcohol and tobacco consumption, can be consequently attributed to inherent
ageing per se.
Notwithstanding the age-declines in physiological systems seen also in master athletes,
these studies have also shown that CRF, strength and power are higher among active
GENERAL BACKGROUND
24
persons across all age groups, and that master athlete’s values remain probably well
above those sued by ADLs, being equal to 20 or 30 years younger inactive counterparts
[32], supporting that disability is not an irremediable end of ageing.
These findings suggest that factually there exist models of healthy ageing, in which
intrinsic capacity decrease does occur, but later in life and at a slower pace than
“pathologic/accelerated” ageing, solely as a result of inherent ageing, preventing or
postponing the breaching of the disability threshold.
Therefore, the understanding of the determinants of inter-individual variability in
functional changes with ageing and establishing effective strategies to enhance function
at the population level are among the research priorities moving forward.

GENERAL BACKGROUND
25
3. Frailty
In the process of understanding disability late-life development, the term frailty was
coined more than 20 years ago to designate a pre-disability state characterized by
reduced capacity to respond to stressors. The most common definition of frailty is that
of “an age associated, biological syndrome characterized by decreased biological
reserves, due to dysregulation of several physiological systems, which puts an
individual at risk of adverse events when facing minor stressors and is associated with
poor outcomes” [27].
Despite poor agreement exist regarding its operational definition [49, 50], experts concur
in that frailty is syndrome of decrease functional reserve and resistance to stressors, that
precedes disability and with a multidimensional and dynamic nature [50]. Frailty is an
independent construct distinct to comorbidity or disability. In fact, poor overlapping
between these three entities has been described (Figure 8) [49].
Frail individuals are more likely to require assisted living, susceptible to suffer adverse
events (hospitalization institutionalization, disability) and to die when compared to age-
matched counterparts [51, 52].
Figure 8. Venn diagram displaying the overlap between frailty, comorbidity
(presence of ≥2 diseases) and disability (difficulty in ≥1 ADL).
From Fried et al., 2001 [49].

GENERAL BACKGROUND
26
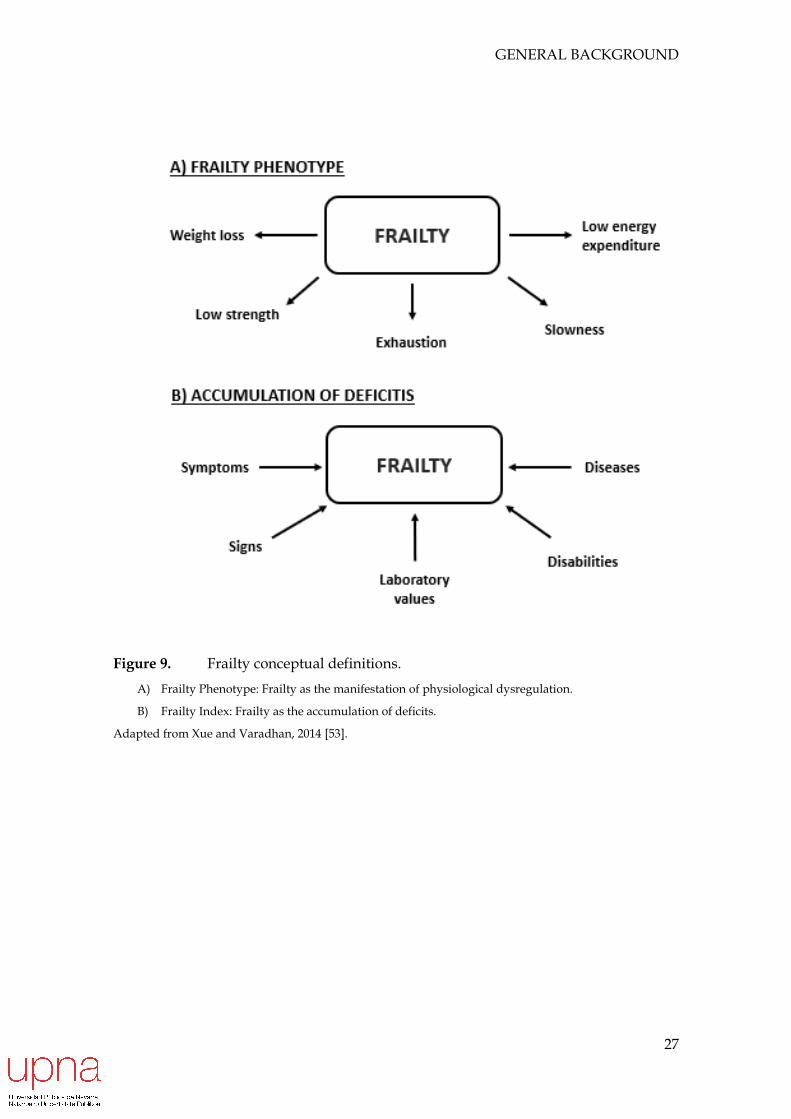
Two school of thought have prevailed in relation to frailty definition: The FP Model by
Fried and colleagues and the Deficits Accumulation Model by Rockwood and
colleagues. Whereas the Fried’s FP envisions frailty as a geriatric syndrome of
diminished functional reserve, captured as the empirical manifestation of a specific
biological model of energy dysregulation (i.e., the mismatch between energy uptake and
energy utilization) (Figure 10), in the accumulation of deficits model individual
contributors to frailty (including disability itself) constitute the drivers of frail subject’s
poor prognosis [53]. While these two frailty definitions present important conceptual
differences mainly in relation to the relationship between frailty and nosographically
classified conditions (non-necessarily present in the FP conception) and disability (frailty
envisioned as the precursor of disability from the FP perspective and possibly present in
the FI) [54], current evidence about a relevant convergence between the two principal
models of frailty should reinforce the validity of the concept [55].
Wide discrepancies exist in terms of frailty prevalence between studies. In a systematic
review and meta-analysis of 21 studies, Collard et al. observed a prevalence of frailty
ranging between 4.0% and 59.1% among community-dwelling older adults, with an
overall estimate of 10.7% for frailty and 41.6% for PF status. They also found higher
frailty prevalence among women (9.6 vs 5.2%) and with increasing age (from less than
5% among those aged 65-69 to 15.7% in the 80-84 and 26,1% in those ≥85 years of age)
[56] (Figure 11).
This huge variation in frailty prevalence estimations might be the result of the use of
different frailty operationalization across studies, the use of population-specific vs.
reference cut-off points, features of single-studies populations and settings (community,
primary care settings, nursing homes…).
For instance, among community-dwelling older adults, frailty prevalence has been
estimated to lay around 10% globally [56, 57], whereas rates are much higher among
institutionalized older adults, where figures approach 50-60% [57, 58], primary care
settings and geriatric units (30%) and hospitals (54%) [57].
Despite substantial heterogeneity in frailty distribution in different studies, frailty has
consistently been associated with older age, female sex and socioeconomic status [27,
59].
GENERAL BACKGROUND
27
Figure 9. Frailty conceptual definitions.
A) Frailty Phenotype: Frailty as the manifestation of physiological dysregulation.
B) Frailty Index: Frailty as the accumulation of deficits.
Adapted from Xue and Varadhan, 2014 [53].

GENERAL BACKGROUND
28
Figure 10. Cycle of frailty according to Fried’s conception From Fried et al., 2001 [49]

GENERAL BACKGROUND
29
Figure 11. Frailty prevalence in older adults (>65 years), according to physical frailty
and broader definitions and stratified by sex and age-groups.
From Collard et al., 2012 [56]

GENERAL BACKGROUND
30
3.1 Frailty relevance in the clinical scenario
Once disability in older adults is established, functional recovery is unlikely, whereas
frailty is a reversible dynamic process that offers an opportunity to gain functionality
[60], delaying or impeding the appearance of disability [61, 62]. Since frailty might
precede by several years the development of disability and other adverse events [63], its
detection, assessment and management at the individual level might lead to the
identification of its contributors and allow for the onset of interventions aimed at
preventing and/or postponing adverse events in older adults [64, 65]. Furthermore,
frailty status, by assuming the role of a biological age marker, is believed to add
prognostic value and assist at individually tailoring interventions among older adults
for which chronological age or the number of comorbidities are poor prognostic
indicators [66–73].
Hence, the value of frailty screening and assessment goes beyond the simple risk
stratification of the older person, and is rooted in the potential of providing added and
valuable information to define optimal care pathways by guiding clinical decisions [74–
76].

GENERAL BACKGROUND
31
4. Sarcopenia
In the mediation between frailty and disability, a prominent role is played by sarcopenia
[77, 78], whose development might be envisioned as a paradigmatic example of the
interaction of primary aging/diseases/lifestyle behaviors on a body system.
4.1 Sarcopenia definition
Sarcopenia (from Greek: “sarcos” referring to flesh and “penia,”: a lack of) was first
described by Rosenberg in 1989 [79]. Whilst originally referred just to the exclusively
age-related loss of lean mass, recent definitions have been expanded to include measures
of muscle function (strength and power) and physical performance [80].
The recent recognition of sarcopenia as an independent condition by an ICD code [81]
represents the increasing awareness regarding this entity as a relevant syndrome driving
important outcomes in older adults. However, there remains substantial controversy
regarding how sarcopenia should be defined and operationalized [82] (Table 1). The
inclusion of muscle function and physical performance in at-first exclusively MM-
centered construct and the selection of the best one among the existing operational
definitions are current glowing matters of discussion [83, 84].
4.2 Sarcopenia epidemiology
The relevance of sarcopenia arises from being relatively common condition and being
associated with short-term and long-term adverse effects but, regrettably, the lack of a
standardized sarcopenia definition hampered the accurate estimation of the burden of
disease, the study of its etiology and potential therapeutic options, which in the end has
preclude its translation into the clinical practice [85].
This fact becomes overtly evident given the disparate prevalence estimates yielded by
the use of different definitions (ranging from 9.9 using 40.4 % among community
dwellers in Mayhew et al., recent meta-analysis) [86], which suggests that different
operationalizations might not be interchangeably and might identify different at-risk
groups of older adults.

GENERAL BACKGROUND
32
Table 1. Sarcopenia operationalizations and cut points proposed
Diagnosis definition Muscle mass Muscle strength Physical Performance
Baumgartner et al., 1998 ALM < 2SD young values of the
same ethnic group - Not applicable
Cruz-Jentoft et al., (EWGSOP), 2010
Women: SMI ≤5.50 kg/m2 Men: SMI ≤7.26 kg/m2
Women: handgrip strength<20 kg Men: handgrip strength<30 kg
SPPB ≤8 Gait speed<0.8 m/s
Fielding et al., (IWGS), 2011 Women: SMI ≤5.67 kg/m2
Men: SMI ≤7.23 kg/m2 - Gait speed<1.0 m/s
Morley et al., (SSCWD), 2011 ALM < 2SD young values of the
same ethnic group - Gait speed<1.0 m/s
Chen et al., (AWGS), 2014 Women: SMI ≤5.40 kg/m2
Men: SMI ≤7.00 kg/m2 Women: handgrip strength<18 kg
Men: handgrip strength<26 kg Gait speed<0.8 m/s
Studenski et al., (FNIH), 2014 Women: ALM/BMI<0.512
Men: ALM/BMI<0.789 Women: handgrip strength<16 kg
Men: handgrip strength<26 kg Gait speed<0.8 m/s
Cruz-Jentoft et al., (EWGSOP) 2019
Women: SMI < 5.50 kg/m2 Men: SMI < 7.00 kg/m2
Or Women: ALM < 20 kg
Men: ALM < 15 kg
Women: handgrip strength<16 kg Men: handgrip strength<27 kg
Or 5-times chair stand test >15 s
SPPB ≤ 8 Or
Gait speed < 0.8 m/s Or
TUG ≥ 20 s Or
400-m walk ≥ 6 min
ALM: appendicular skeletal lean mass; BMI: body mass index; SMI: Skeletal Muscle Mass Index; EWGSOP: European Working Group on Sarcopenia in Older People; IWGS: International Working Group on Sarcopenia; SSCWD: Society of Sarcopenia, Cachexia and Wasting Disorders; AWGS: Asian Working Group for
Sarcopenia; FNIH: Foundations of the National Institute of Health; TUG: Test Up-and-Go; SPPB: Short Physical Performance Battery.

GENERAL BACKGROUND
33
Focusing on recent and more comprehensive sarcopenia definitions (including
muscle strength and physical performance measures), a lower proportion of older
adults present with sarcopenia, with overall prevalence around 10% for both
community-dwelling men and women [87].
Notwithstanding the differences in sarcopenia definitions and methodologies in the
studies, sarcopenia appears to be more prevalent in clinical settings such as nursing
homes (51% in men and 31% in women) [88], hospital (23% in men and 24% in
women) [88], post-acute care (56%) [89] and in populations of older adults presenting
with conditions (COPD [21.6%], CVD [31.4%], dementia [26.2%], T2DM [31.1%]) [90,
91].
Similarly to frailty, sarcopenia is more prevalent among oldest old subjects [86]
whereas the absence of clear sex-differences observed might be the result of the use
of sex-specific cut-points in most of the instruments.
4.3 Sarcopenia: a public health issue
From the clinical sense, sarcopenia might be the result and contribute to the
aggravation of several age-associated conditions (diabetes [92, 93], cancer [94], CVDs
[95]). Moreover, age-related muscle function losses mediate the deterioration of the
physical domain of intrinsic capacity [96], deriving in poor outcomes such as mobility
and ADL disability, severely impacting HRQoL [97, 98]
Sarcopenia has been associated with adverse outcomes such as mortality [99], falls
and fractures [100], functional decline and hospitalization [97] in older adults
populations.
Consequently, sarcopenia poses a huge financial stress on healthcare systems. In the
US, the costs associated with sarcopenia (defined only through MM) were estimated
at $18,5 billion in 2000 [101]; and the differential hospitalization-related healthcare
costs between sarcopenic and non-sarcopenic individuals in the same country
reached USD $2315 [102]. Recently, an analysis of the Hertfordshire Cohort Study the
presence of low HS resulted in an estimated excess economic burden for health and
social care of £2,5 billion [103].
Sarcopenia is considered a major public health issue, requiring correct assessment,
identification, prevention and if present, interventions to reverse or attenuating its
progression with the aim of avoiding its burdensome consequences [97].

GENERAL BACKGROUND
34
4.4 Sarcopenia evolution and physiopathology
Regarding the natural history of sarcopenia, MM and function have been shown to
peak around the fourth decade of live, to be maintained across adulthood and to
decrease thereafter in both sexes [104]. Importantly, losses in muscle function (i.e. in
muscle strength and power) precede and are steeper than those in MM [105],
indicating a decline in specific force area and in peak power per unit volume, usually
referred as “muscle quality” [106]. In a seminal study, Lauretani et al., showed that
MM, strength and power values at age >85 years were 25, 50 and 75% lower than that
observed in men 20-29 years old in the InChianti study (Figure 12) [107].
Figure 12. Adulthood trajectories in maximum knee extension torque (A),
maximum handgrip strength (B), lower extremity muscle power (C)
and calf muscle area (D) in the InChianti Study.
From Lauretani et al., 2003 [107].

GENERAL BACKGROUND
35
Of note is the evidence showing that skeletal muscle function, especially power, is
more strongly associated with physical function [96] and adverse outcomes in older
populations than measures of MM alone [108].
At the muscle histological level, sarcopenia is characterized by the loss of motor
neurons and motor units enlargement (due to partial reinnervation) of denervated
fibers [109], reduction in the number of both type I and II muscle fibers, accompanied
by type II fiber-specific atrophy [110], higher presence of mixed-fibers (co-expressing
both MHC-I and MHC-II) [111], muscle fat and fibrous tissue infiltration [112] and
reduced number and impaired function of SC [113].
These changes are the result of the interaction of a constellation of factors involving
the aging neuromuscular machinery (reduced fiber muscle perfusion and loss of
neurotrophic input secondary to motor neuron loss [114]), dysregulated proteostasis
(i.e. balance between muscle protein anabolic and catabolic processes), due to
anabolic resistance and downregulation of anabolic hormones (lower testosterone,
GH, IGF-I, DHEA levels) and increased catabolism by pro-inflammatory cytokine
activity (IL-6, TNFα. CRP) [115], mitochondrial dysfunction-mediated muscle fiber
bioenergetics failure [116, 117], all driven by environmental, genetic and behavioral
factors not fully unveiled and still under tracing.
Figure 13. Sarcopenia physiopathology
Adapted from Cruz-Jentoft and Sayer, 2019 [118]; and Kirk et al., 2020 [119].
GENERAL BACKGROUND
36
Important to remark is that, mechanisms underlying age or disease-related
impairments in muscle strength or power are not limited to muscle tissue or
peripheral nervous system. It has been observed that processes of neuronal atrophy,
dysregulation of neurotransmitters activity and reduced neuroplasticity at the central
nervous systems are also responsible of diminished muscle function [120], in addition
to peripheral processes of muscle mass and function reduction.
4.5 Sarcopenia as a determinant of intrinsic capacity loss
Accelerated MM and function loss might be envisioned as the organ-specific
pathophysiological background of the progressive reduction of the physical (or
locomotion) domain of intrinsic capacity, thus potentially influencing the ability to
reach and maintain the full functional ability of the individual [75].
Notably, the perception of skeletal muscle as pure locomotor unit has progressively
shifted. Skeletal muscle represents approximately 40% of the body weight and
constitutes the largest protein reservoir in the body. Additionally, muscle is
increasingly recognized as an endocrine organ [121], an immune system responses
regulator [122], playing a pivotal role in metabolic health, by being the major site of
glucose storage and utilization [123].
In turn, age-associated reductions in MM and function imply not only a physical
function impairment but the derange of the physiological cross-talk between muscle
and other organic systems through reduced and altered myokine-mediated signaling,
and might further aggravate chronic conditions including metabolic syndrome [124],
T2DM [92], CVDs [125], obesity [126], osteoporosis [127] and cognitive impairment
[128, 129], as well as poor immune responses when facing pathogens [122].
4.6 Sarcopenic Obesity and Osteosarcopenia
Two recently coined constructs stand out as examples of the relevance of skeletal
muscle mass as an endocrine organ, and specifically in the ageing process. The
constructs of sarcopenic obesity and osteosarcopenia have arisen as the combination
of age-related low muscle mass and obesity [130] and osteopenia/osteoporosis [131],
respectively.
Obesity has rapidly increased worldwide over the last three decades, largely due to
combined genetic predisposition and profound lifestyle changes including sedentary
GENERAL BACKGROUND
37
habits and high-calorie dietary intake [132]. Sarcopenia and obesity share common
pathophysiological mechanisms including insulin resistance [123], chronic
inflammation [126] and oxidative stress that mediate the presence of a dysfunctional
adipose tissue [124], increased catabolic activity and blunted anabolic responses at
the skeletal muscle level [133].
In the case of osteosarcopenia, both declines in muscle mass and function and bone
mass seem to share common pathogenesis, with factors such as certain common
genetic polymorphisms, endocrine activity decline-mediated anabolic resistance (low
IGF-I, GH, testosterone and estrogens) and reduced physical activity/mechanical
load [131].
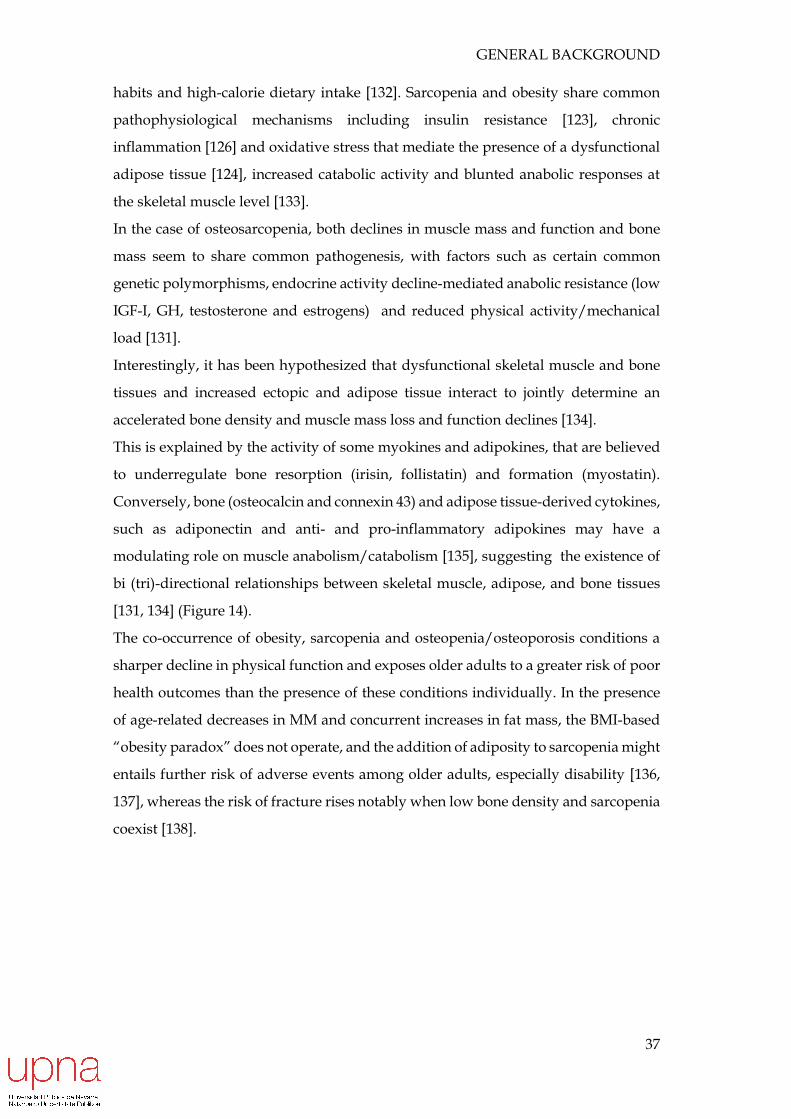
Interestingly, it has been hypothesized that dysfunctional skeletal muscle and bone
tissues and increased ectopic and adipose tissue interact to jointly determine an
accelerated bone density and muscle mass loss and function declines [134].
This is explained by the activity of some myokines and adipokines, that are believed
to underregulate bone resorption (irisin, follistatin) and formation (myostatin).
Conversely, bone (osteocalcin and connexin 43) and adipose tissue-derived cytokines,
such as adiponectin and anti- and pro-inflammatory adipokines may have a
modulating role on muscle anabolism/catabolism [135], suggesting the existence of
bi (tri)-directional relationships between skeletal muscle, adipose, and bone tissues
[131, 134] (Figure 14).
The co-occurrence of obesity, sarcopenia and osteopenia/osteoporosis conditions a
sharper decline in physical function and exposes older adults to a greater risk of poor
health outcomes than the presence of these conditions individually. In the presence
of age-related decreases in MM and concurrent increases in fat mass, the BMI-based
“obesity paradox” does not operate, and the addition of adiposity to sarcopenia might
entails further risk of adverse events among older adults, especially disability [136,
137], whereas the risk of fracture rises notably when low bone density and sarcopenia
coexist [138].
GENERAL BACKGROUND
38
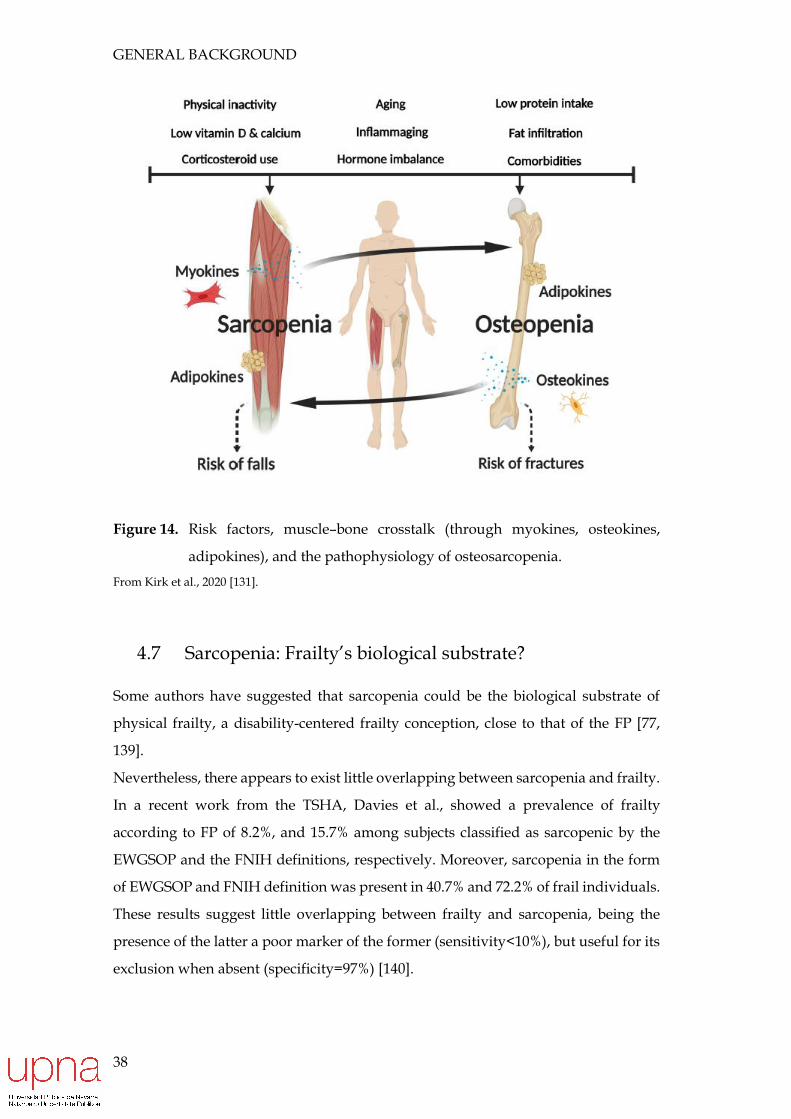
Figure 14. Risk factors, muscle–bone crosstalk (through myokines, osteokines,
adipokines), and the pathophysiology of osteosarcopenia.
From Kirk et al., 2020 [131].
4.7 Sarcopenia: Frailty’s biological substrate?
Some authors have suggested that sarcopenia could be the biological substrate of
physical frailty, a disability-centered frailty conception, close to that of the FP [77,
139].
Nevertheless, there appears to exist little overlapping between sarcopenia and frailty.
In a recent work from the TSHA, Davies et al., showed a prevalence of frailty
according to FP of 8.2%, and 15.7% among subjects classified as sarcopenic by the
EWGSOP and the FNIH definitions, respectively. Moreover, sarcopenia in the form
of EWGSOP and FNIH definition was present in 40.7% and 72.2% of frail individuals.
These results suggest little overlapping between frailty and sarcopenia, being the
presence of the latter a poor marker of the former (sensitivity<10%), but useful for its
exclusion when absent (specificity=97%) [140].

GENERAL BACKGROUND
39
Therefore, we can conclude that sarcopenia, besides being an obvious contributor to
physical function decline with ageing, by limiting force and power production, also
involves alterations in the physiological role of muscle mass in energy balance and as
a endocrine organ, constituting a phenomenon with whole-body effects, which
explain its associations with a wide range of conditions and adverse events.
Frailty, by its part, is a much broader construct, being musculoskeletal system only
one of the constellation of organic systems contributing to the frailty increased
vulnerability.
5. Opportunities for healthy ageing promotion
In response to the ageing population, a current major challenge for modern medicine
is to find ways for preventing and treating sarcopenia, frailty, and overall intrinsic
capacity decline in mid- and late life, in order to avoid disability. To this end, gaining
insight into the factors determining healthy and accelerated ageing phenotypes could
assist in the development and refinement of public health recommendations and
interventions for maintaining functional ability that enables well-being during late
life. Furthermore, recognizing that sarcopenia, frailty and intrinsic capacity loss are
the result of multi-systemic physiological impairments, the management of older
adults should be focused on the prevention of age- and disease-related physiological
function loss, fostering whole-body systems functioning as opposed to the diagnosis
and treatment of specific diseases [11].

GENERAL BACKGROUND
40
6. Physical Activity: a potential Intrinsic Capacity Booster
6.1 Physical Activity, Sedentary Behaviour, Exercise and
Health
PA defined as “any bodily movement produced by the contraction of skeletal muscle
that increases energy expenditure above a basal level [141] has gain recognition as
one of the critical determinants of health across life [142].
Since classical papers emerged in the middle of the 20th century linking labor-related
PA and lower CVD mortality [143, 144] a substantial bulk of research has proved the
health benefits of greater PA levels on several physiological systems and has pointed
to a protective effect of PA for a wide range of chronic diseases [125, 145–148] (Figure
15). These benefits of PA have systematically been traduced into lower mortality and
disability rates in both men and women [22, 142, 149, 150].
Physical exercise, “a subcategory of PA that is planned, structured, repetitive and
purposive in the sense that the improvement or maintenance of one or more
components of physical fitness is the objective” [141], has recently been envisioned as
a drug [151, 152]. Regular exercise is associated with increased longevity and reduced
risks for CVD, stroke, cognitive decline, some cancers, T2DM, osteoporosis, HT,
dyslipidemia, obesity, and osteoarthritis in the general population [146, 153].
Furthermore, high quality evidence has shown an important role of both forms of PA
in the secondary prevention of non-communicable diseases, such as cancer, T2DM,
CVD and HIV, by positively impacting all-cause [154] and disease-specific mortality
[154, 155], markers of disease progression [156–160] and disease-related constructs
such as physical function [161] and HRQOL [162, 163].
Hence both PA and exercise have been recognized as a cornerstone in the prevention,
management, and treatment of numerous chronic conditions.
An important physical behavior impacting health is the lack of PA. Despite SB and
inactivity have extensively used interchangeably to refer the accumulation of low-
energy consuming activities (usually sitting), they are distinct constructs. Physical
inactivity refers to the non-compliance with PA guidelines (lack of MVPA, see below),
whereas SB connotes different PA behaviors than non-MVPA, consisting of the

GENERAL BACKGROUND
41
accumulation of time in activities at the low end of the intensity range, eliciting very
low energy expenditures in a reclined or sitting position [164].
Figure 15. Adjusted prevalence ratios (APR; 95% CI) for chronic conditions by
categories of adherence to PA guidelines.
Meet neither=Subjects not adhered neither aerobic nor strength training recommendations.
MSE=Subjects uniquely adhering to muscle strength training recommendations. MVPA only= Subjects
uniquely adhering to aerobic MVPA recommendations. Meet both= Subjects fulfilling both
recommendations.
From Bennie et al., 2019
GENERAL BACKGROUND
42
Then, an individual might be physically active if meeting current PA
recommendations but sedentary as for spending large amounts of time in SB.
Conversely, a non-physically active individual might accumulate little proportion of
the day in SB by engaging in light activities, not accounted in PA recommendations.
Taking these insights into a public health research and translational framework, SB
may be understood to be a class of behaviors that can coexist with, and potentially
compete with PA, with independent health consequences and environmental and
social determinants [165, 166].
6.2 Physical Activity parameters as determinants of the
response
The effects of both PA and exercise on health rely on certain parameters that
determine the features of the homeostatic disruption exerted by PA/exercise and
consequently, the adaptative responses activated after muscle contractions.
Intensity refers to the rate at which energy is expended during a muscle contraction.
It is usually measured in multiples of the resting metabolic rate (1 MET=3.5 ml.kg-
1.min-1), and has been generally categorized as: SB (sitting or reclining activities <1.5
METs), LPA (1.5-2.99 METs), MPA (3-5.99 METs) and VPA (≥6 METs) [167–169] in
absolute terms. Duration is defined as the amount of time engaged in certain activity
or intensity category. The frequency is the times an activity is performed within a
specified period, usually expressed as bouts, episodes or sessions per week. Finally,
the mode or type of PA refers to the modality of PA: walking, swimming running,
etc.…, whereas in the case of exercise a classical distinction between aerobic (i.e. low-
intensity repetitive contractions) mainly inducing adaptations that lead to improved
oxygen uptake, transportation, and utilization, and resistance (i.e. low frequency and
high-resistance demand) exercises, believed to mainly play a role in proteostasis and
neuromuscular function [170].
PA/exercise parameters condition different responses at the cellular level in a
hormetic fashion: from insufficient stimulus to trigger responses to deleterious if
excessive, trough adequate at physiological ranges [171]. These stimuli, if repetitive,
induce adaptations according to the principles of overload, specificity and
progression [172].

GENERAL BACKGROUND
43
On the other hand, and despite its recent incorporation as an independent health
factor, parameters associated with SB accumulation, mean life of sedentary bouts, the
number of breaks in SB and even the type of activities while sitting/lying (TV
watching vs. reading or mentally demanding tasks) and their correlates (i.e. poor
nutrition) have been suggested to modulate the consequences of SB on health [166,
173].
Unfortunately, molecular mechanisms explaining the relationship between
PA/exercise and lower SB and benefits in specific disease processes have recently
started to be investigated and remain partially understood. In fact, whether the
deleterious effects of inactivity and SB are exactly opposite to the positive health
benefits of increased physical activity remains widely unresolved [174–176].
6.3 Physical Activity Guidelines for Health
Since in 1995 the US CDCP and the ACSM issued the first evidence-based PA
recommendation for public health [177], public PA recommendations have evolved
and expanded by different public health institutions (WHO, US DHHS, AHA [178–
180]), with the aim to adapt to growing evidence regarding the role of PA as a health
factor in different age (children, youth adults, older adults) and health process-
specific populations, and the emergence of SB as a crucial health factor.
Currently under-public consultation WHO Physical Activity and SB guidelines for
adults [181] recommend “to accumulate at least 150 minutes to 300 minutes of
moderate-intensity aerobic PA, or do at least 75 to 150 minutes of vigorous-intensity
aerobic PA or an equivalent combination of moderate- and vigorous-intensity PA
throughout the week for substantial health benefits. In addition, adults should also
engage in muscle-strengthening activities at a moderate or greater intensity 2 days a
week”. Nevertheless, PA associations with health benefits seems to have a curvilinear
dose-response shape in terms of volume and intensity, that level-off at the upper
limits. Hence, it points that “further benefits might be acquired by engaging in more
than 300 minutes and 150 minutes of moderate- and vigorous-intensity aerobic PA “.
Acknowledging that some adults with functional impairments or conditions might
not be able to reach recommended volumes and intensities of PA, the report indicate
that such individuals should be as physically active as their conditions allow, and
increase their PA in terms of intensity and volume with the aim of achieving PA
general goals, with the premise that any PA is better than none.

GENERAL BACKGROUND
44
With regards to SB, the recommendation advise “to limit the amount of time spent
being sedentary and replacing sedentary time with physical activity of any intensity
(including light intensity) has health benefits” and further recommend to those highly
sedentary (for example office-based workers) to achieve or exceed the upper levels of
PA recommendations in order to minimizing the detrimental effects of sedentariness
[182]. No SB maximum volume is advised since evidence remains scarce in this
regard.
6.4 Mechanisms underlying benefits of Physical
Activity/Exercise on Health
There is increasing consensus envisioning PA as a physiological need, giving that our
genetic background was forged in a milieu in which high levels of PA were crucial
for survival [183]. Hence, current chronic disease “pandemic”, besides of the
phenomenon of ageing population, might be the result of the discrepancy between
current day human PA levels and that required physiologically [184]
Unfortunately, despite an increasing number of scientific works are deepening in the
acute and long-term mechanisms triggered by muscle contraction impacting local and
systemic adaptations to exercise, the understanding of the molecular and
physiological mechanisms underlying the benefits of PA/exercise on health is in its
infancy [185, 186].
Those classically associated to physical fitness improvements through exercise might
be also responsible for the widely epidemiologically confirmed health benefits of PA.
Exercise adaptations at the cell and systemic levels
Any PA increase needs the coordinated activity of multiple body physiological
systems in order to match the mechanical/metabolic demand of the activity. PA
challenges practically every system in the body and start mechanisms to preserve or
re-establish homeostasis [186], that include both short-term and long-term processes.
Exercise induces adaptations in several cell types and tissues throughout the body.
At the cell level, structural and metabolic adaptations to PA and exercise are tailored
at minimizing the homeostatic disruption elicited by a subsequent PA/exercise bout.
These changes are mediated by a complex interplay between intracellular signaling
pathways activated in response to changes in cellular homeostatic parameters

GENERAL BACKGROUND
45
(metabolic and mechanical stress), which in turn regulate transcription and
translation, and exercise-responsive gene expression [170]. At the cellular level,
maximization of substrate delivery [187, 188], mitochondrial respiration and
improvements in contractile properties of the myocytes are common adaptations
to sustained PA/exercise participation [189, 190]. Figure 16 display the mechanisms
underlying skeletal muscle fiber adaptations to exercise.
Additionally, substances delivered by muscles are believed to induce systemic
adaptations. Despite mechanisms beneath remote effects of exercise still poorly
understood, recent research suggest that they might result from the secretory activity
by muscle cells of biomolecules that are synthesized and released by contracting
muscles in the form of myokines (cytokines or small peptides), growth factors and
metabolites [191] and extracellular vesicles implicated in the autocrine regulation of
metabolism in the muscle as well as in the paracrine/endocrine regulation of other
tissues [121, 192] (Figure 17). Hence, PA and exercise promote a crosstalk between
muscle and other tissues/organs including adipose tissue, the liver, bone,
myocardium, endothelium, the immune system and the brain [121, 127, 146], absent
in non-contracting muscle.

GENERAL BACKGROUND
46
Figure 16. Schematic representation of Excitation-Transcription-Adaptation
Coupling in Skeletal Muscle
Muscle contraction derives in biochemical and biophysical stimuli mainly related with mechanical and energy stress. These perturbations in skeletal muscle homeostasis lead the activation of networks of signaling molecules (enzymes) including protein kinases, phosphatases, and deacetylases, which are integrated into physiological processes by downstream targets, including transcription factors and transcriptional coregulators. Importantly, the relative activation, contribution, and magnitude of the described pathways and downstream targets are dependent on the intensity, duration, and mode of the PA/exercise. Linear pathways are depicted, but in fact, these pathways demonstrate some degree of dependence, crosstalk, interference, and redundancy in their regulation.
PiO2=oxygen partial pressure; ATP=adenosine triphosphate; AMP=adenosine mono-phosphate; ROS=reactive oxygen species; NAD+/NADH=oxidized/reduced nicotinamide adenine dinucleotide ratio; [Ca2+]i=ionized calcium concentration; PHDs=prolyl hydroxylase enzymes; CaMKIII=calmodulin-dependent protein kinase; SIRT=sirtuin; AMPK=AMP-activated protein kinase; p38=p38 mitogen-activated protein kinases; ERK1/2= Mitogen-activated protein kinase 3; JNK=c-Jun N-terminal kinases; FAK=focal adhesion kinase; PA=phosphatidic acid; PI3K=phosphatidylinositol 3-kinases; Akt=protein kinase B; mTOR=mammalian target of rapamycin; FOXO=forkhead box protein; HIF1-α=hypoxia inducible factor 1 α; PGC-1=peroxisome proliferator-activated receptor γ co-activator 1 α; HDAC=histone deacetylase; CREB=cAMP response element-binding; ATF2=activating transcription factor 2; SRF=serum response factor; p70s6k=ribosomal protein S6K; 4E-BP1: eukaryotic translation initiation factor 4E (eIF4E) binding protein. MAFbx= MAFbx/atrogin-1 ubiquitin ligase; MuRF1= muscle RING finger 1 ubiquitin ligase. Adapted and updated from Egan and Zierath, 2013 [170].

GENERAL BACKGROUND
47
Figure 17. Summary of the main myokines, their putative effects, and the
molecular signals/pathways involved.
From Fiuza-Luces, 2013

GENERAL BACKGROUND
48
6.5 Mechanisms underlying PA/SB effects on health
Overall, the benefits of PA on health might arise from increased insulin sensitivity
[193], optimized substrate utilization [194], reduction in low-grade chronic
inflammatory activity [195], and functional adaptations through increased
neurogenesis and neuroplasticity [196], skeletal muscle and myocardial hypertrophy
[189], neovascularization [197, 198] and improved endothelial-function [125], which
might prevent and positively impact cardio-metabolic diseases, diabetes, cancer,
neurodegenerative conditions and depressive disorders [146].
On the other hand, putative mechanisms through which SB might negatively impact
health and contribute to chronic disease might be related to the development of risk
factors such as hyperglycemia, dyslipidemia, and HT (Figure 18) [175], secondary to
reductions in both muscular/metabolic demand and blood flow/shear stress, muscle
atrophy, post-meal substrates loading, decreased lipid trafficking/oxidation, and
concurrent decrements in muscle/liver insulin sensitivity and vascular function, that
mediate processes that at current understanding are opposed to those of PA
(lipotoxicity, insulin resistance, excess oxidative stress, and impaired interorgan
signaling) [174].
Figure 18. Putative mechanisms linking SB and chronic disease
Lack of muscle contraction involves reductions in metabolic and mechanical demands that induce
insulin resistance, mitochondrial dysfunction, inflammation and lipotoxicity.
From Dempsey et al., 2019 [175]

GENERAL BACKGROUND
49
7. Physical Activity and Health in Older Adults
Older adults retain superbly abilities for PA/exercise adaptations. PA/exercise have
shown effectiveness for attenuation of age-related declines in physical fitness and
neurodegeneration [199]. Tellingly, increased PA has been proved to promote MM
and function enhancements [200–202], and to positively impact cardiorespiratory
[203, 204], cardiovascular [125], immune [205] and nervous systems [206] function in
older adult samples.
From the functional point of view, these adaptations to exercise are translated into
improved mobility and physical functioning [207, 208], reductions in the risk of
falling [209] and disability in older adult at-risk populations [210]. Importantly,
exercise has demonstrated effectiveness for maintenance or improvement of cognitive
function [211], and consequently, has proven positive impact on both intrinsic
capacity domains (physical and cognitive capacities).
Even in bedridden, hospitalized patients, early mobilization and participation in
resistance-based exercises have proven effectiveness for preventing hospitalization-
associated functional decline, which illustrates the potential of physical exercise to
countermeasure even the most extreme acute and sharp intrinsic capacity declines
[212].
7.1 Physical activity/exercise to counteract intrinsic capacity
loss of ageing
Due to their potential to attenuate or reverse age- and disease-related whole-body
declines in physiological reserve and functions, both PA and exercise are now
recognized as outstanding approaches for prevention, postponement or attenuation
of physiological reserve deterioration with age [213]. In the absence of pharmaceutical
interventions for frailty and sarcopenia, increased PA/exercise constitute unique
therapeutic strategies for the prevention and reversal of both syndromes [214–216].
Remarkably, similarly to drug-based therapeutic approaches, the effects of PA rely
on the treatment regimen. As mentioned in previous sections, in the case of exercise
it is determined by the mode (aerobic vs. resistance exercise), intensity, frequency and
volume [170].
In older adults, multicomponent exercise programs (especially those including
aerobic and high velocity power-based resistance exercises) [217, 218] appears to yield

GENERAL BACKGROUND
50
the greatest benefit in terms of overall physical fitness and health among older adults,
by combining different stimulus that promote positive adaptations at different
organic systems [219].
Despite unquestionable evidence regarding the positive effects of exercise on the
processes that mediate accelerated ageing [199] and the fact that great efforts are
being made to prompt implementation of exercise protocols in the daily practice
[220], evidence regarding the appropriate design (mode, frequency, intensity and
volume) of an exercise protocol tailored at maximizing its beneficial effects in specific
populations is still scarce [221–223], as illustrated by the substantial proportion of
non-responders to specific exercise regimens [224–226].
Additionally, the proportion of older adults that take part in structured physical
exercise regrettably remains very low [227, 228], due to barriers such as poor
perceived health and physical function limitations, presence of pain, lack of
motivation, depression and cognitive impairment, fear of falling or injury, lack of
accessible facilities, staffing shortages and funding constraints [229, 230].

GENERAL BACKGROUND
51
7.2 Free-Living Physical Behaviors and Healthy Ageing
Epidemiology
In this context, since it accounts for the major part of the PA in which older adults
partake, the role of non-structured PA behaviors, usually imputable to daily living
and leisure activities, might constitute a relevant differential factor determining
healthy ageing. Observational evidence might assist to gain insight into the
determinants (PA intensity, volume, frequency and mode) that maximize the PA
benefits on different older adult phenotypes and thereby inform the design of
optimally designed structured exercise programs and public health policies.
Interestingly, several observational studies have shown that higher levels of free-
living PA are associated with lower rates of frailty [231], sarcopenia [232, 233],
disability [234, 235], mortality [236, 237] and other adverse outcomes in older
populations [238, 239], supporting the role of free-living PA behaviors as the
determinants of healthy ageing.
PA and SB patterns, frailty and sarcopenia
As described before, lifestyles are considered a fundamental factor for health,
function and well-being at older ages. Although multiple modifiable factors might
influence physiological reserve trajectories along ageing, physical behaviors may play
a paramount role in the modulation of the decline in physiological reserves [231]
driving accelerated ageing.
PA and SB levels reduction have been suggested to counteract several of the
mechanisms underlying the deranges of multiple physiological systems driving
comorbidity (obesity, diabetes, CVD, cancer, etc…), sarcopenia and frailty
development such as chronic inflammation, mitochondrial dysfunction, insulin
resistance, neuroendocrine dysregulation and endothelial dysfunction [240].
Hence, physical behaviors are considered a milestone in frailty and sarcopenia
development. Xue et al. hypothesized that declines in PA, besides a component of
frailty syndrome, might trigger the development of the rest of the phenotype and
likely exacerbate both frailty-related outcomes and the underlying dysregulation
[241].
These assumptions have been confirmed by observational studies which have
associated higher PA levels with lower frailty levels both cross-sectionally and
longitudinally [242–244].

GENERAL BACKGROUND
52
Fewer studies have explored the associations between SB and frailty, with some
mixed results (positive [245–247] and non-significant associations [248]) observed. SB
effects on frailty seems to be independent of PA [231], but in a recent study from the
TSHA, the detrimental effect of SB on frailty was attenuated or even eliminated with
increased in PA in the form of MVPA [249].
In the same way, since mechanisms underlying losses of MM and function induced
by conditions such as increased adiposity, T2DM and other diseases are highly
dependent on lifestyle behaviors, it is not rare to envision PA and SB together with
nutrition habits as relevant determinants of sarcopenia modulation. Several studies
have shown clear associations between higher PA levels and MM [233, 250, 251],
muscle strength [104] and physical performance [252, 253] and sarcopenia rates in
older adults [254]. More scarcely studied have been the associations between SB and
musculoskeletal health, with existing research yielding mixed results [255, 256].
7.3 Free-living PA epidemiology pitfalls
Notwithstanding the extensive and consistent evidence linking higher levels of PA
and better health in senior populations, there remains pitfalls in late-life PA
epidemiology, mainly related to the way PA is assessed and categorized and how it
is defined as an exposure.
Subjective vs. Objective PA assessment tools
The majority of previous studies exploring associations between PA and SB levels
and health parameters have relied on self-report or questionnaires, which has raised
concerns regarding potential bias related to failures in subjective recall of activities
eliciting energy expenditure and social desirability, usually leading to free-living PA
overreporting and SB underestimation [257] , especially among older adults, probably
obscuring the associations between PA behaviors and the outcomes.
Relatively recent availability of wearable accelerometers assists to overcome self-
reported or questionnaire-based PA estimation bias by offering the opportunity of
objectively measuring PA in population-based studies [258]. Additionally,
accelerometry allows for comprehensive characterization of physical behaviors in
terms of intensity and duration, previously identified as important determinants of
PA effects [259]. Briefly, these devices are attached to body segments and measure

GENERAL BACKGROUND
53
accelerations resulting from motions, usually ambulation-related activities, converting
them into activity counts. The amount and intensity of daily SB and PA are then
obtained by classifying activity counts accumulated in a specific time interval (epoch)
with a set of cut-points, matched to the categories in which PA intensity continuum
has been classically split, based on multiples of the RMR (i.e. metabolic equivalents
of tasks; METs): SB (<1.5 METs), LPA (1.5-2.99 METs) MPA (3-5.99 METs) and VPA
(>6METs) ([167–169]. For practical analytical purposes and given the low engagement
in VPA in certain populations such as older adults, MPA and VPA are usually merged
in a MVPA intensity category. The amount of time spent in each of the intensity
categories can be computed by summing all the minutes within a category, which
allows to characterize PA and SB in terms of intensity, duration, frequency and
volume.
Rationale beneath the use of age-specific cut-points in PA intensity
characterization
Importantly, processing decisions regarding data collection (device placement and
sampling frequency) and processing (non-wear time identification, epoch length,
minimum duration of bouts within a intensity category, and cut-points for intensity
classification) have been shown to have a substantial impact on PA estimation [260].
Among these, cut-point selection has the greatest impact on PA and SB time estimates
[261]. These cut-point are usually computed and validated against the so-deemed
gold-standard indirect calorimetry. Due to differences in the relative energy cost of
activities and RMR, cut-points validated in specific groups might not be extrapolable
to other age, sex, fitness, disease or level-of-impairment groups [262]. This is
especially appealing among older adults, which present with a lower RMR than
young counterparts (RMR=2.8 ml O2. Kg-1. min-1 vs RMR=3.5 O2.Kg-1.min-1) [263].
Hence, the relative energy cost associated with a given activity is greater among this
age group [264]. For instance, the LPA-MVPA transition in a young adult (3
METs=10.5 ml O2. Kg-1.min-1) would imply an exertion of 3.75 METs in an average
older adult.
Despite this important fact, most of previous works using accelerometry in older
adults have categorize both PA and SB using cut-points validated in healthy, young
adults populations [167, 265], leading to substantial misclassification of actual PA
levels [266]. Recent research have derived accelerometry cut-points for older adults

GENERAL BACKGROUND
54
[267–270]. Using age-standardized cut-points, Koster et al. demonstrated that the use
of young-adults reference cut-points implied an overestimation of time spent in SB
by almost 2 hours [267]. PA underestimation has also been shown to be induced using
young-adults reference cut-points [271] (Figure 19).
Figure 19. Accelerometer-derived minute by minute (a) and day-long (b)
estimates of time in each PA intensity category using healthy young adults reference
PA intensity cut-points vs. age- and disease (T2DM)-specific PA intensity cut-points.
PS= Population Specific; min/d= minutes per day.
From Welch et al., 2017 [271].

GENERAL BACKGROUND
55
Altogether, these observations illustrate the necessity of using age-specific
accelerometry cut-points when assessing PA in older adults to ensure accuracy in the
observations and correct categorization of PA intensity, an outstanding crucial
mediator of the effects of PA on health.
Intensity as a relevant determinant of the effect of PA on health
Similarly to exercise responses, free-living PA effects on health are highly dependent
on parameters such as volume and intensity [170]. The role of MVPA as a determinant
of health has been widely studied. Of special interest is the potential role of LPA in
highly inactive older adults, for whom the more strenuous MVPA might be hardly
bearable [272, 273]. LPA constitutes a distinct stimulus and is believed to trigger
differential responses and adaptations compared to the widely previously explored
MVPA [274–276], but unfortunately, there still exist limited evidence of its
associations with relevant outcomes in older adults populations, such as frailty or
sarcopenia.
Additionally, as stated before, SB has recently been suggested as a relevant health
determinant. Despite SB, LPA and MVPA being presumably highly co-dependent,
they have been scarcely considered jointly in late-life epidemiology until recently
[277].
The described advancements in PA volume and intensity characterization (objective
estimation tools and availability of age-specific cut-points) may lead to better
understanding of the relationships between distinct types and patterns of PA and SB
and health outcomes, which in turn should inform intervention goals, whose
effectiveness should be subject of experimental research.
Classical vs. Isotemporal Substitution Regression Models
Second, a relevant issue when exploring the associations between PA and health
outcomes arise from the truism fact that the time in which a subject can partake in PA
is finite. Given that the effect of different PA behaviors are highly interdependent, the
effects of a certain PA intensity (for example, LPA) are highly reliant not only on that
specific PA intensity but also on the type of intensity it displaces (SB or MVPA) [278].
Associations between PA and SB and health outcomes in previous research have been
explored by means of classical regression models that assess the strength of the

GENERAL BACKGROUND
56
relationships by estimating the effect of increasing an amount of time in one PA
behaviour or intensity category on a given outcome, accounting for confounding
factors (such as time in other activities and other possible covariates). Nevertheless,
these approaches do so by artificially “adding” time to the day, given that the rest of
PA behaviors remain constant, overlooking two important facts: a) available hours in
a day are fixed, finite, and may differ between subjects, and b) physical behaviors are
co-dependent and hence, augments in one of them indispensably occur at expenses
of reducing time in others. Accordingly, this approach might lead to unrealistic and
distorted associations between PA behaviors and health-related outcomes and have
little utility in informing PA public health endpoints.
To account for this limitation, substitution models, developed in the context of
isocaloric nutrition epidemiology, have been recently incorporated into the PA
epidemiology field [279, 280]. Isotemporal substitution regression models allow for
the mathematical simulation of the effects of increasing a given amount of time
engaged in certain activity or PA intensity by displacing an equal amount of time in
others in the context of a finite period of time (day, week, etc.…) [281], mathematically
mirroring real behavioral PA-related changes.
Single time-point estimation vs. Prospective changes in PA as the exposure
variable
Most of available evidence exploring associations between PA and health outcomes
in older adults use single time-point assessment of PA (primarily baseline PA levels)
as the exposure variable [268, 282]. PA is a dynamic behaviour that undergo a steep
decline during ageing (Figure 20) [283–285]. In turn, it is plausible that the study of
different prospective patterns of change in PA behaviors may influence associations
with health parameters compared to cross-sectional estimates [286]. Several studies
have accounted for this shortcoming and used PA change as the exposure variable.
Nevertheless, most of these works defined PA evolution groups of individuals based
on clinical or empirical cut-points (based on percentiles, the adherence to PA
recommendations, etc.…), qualitatively classifying subjects into PA-increasing,
decreasing or maintaining categories [287].
PA prospective changes might not only differ in their direction, but also in their
magnitude and rate of occurrence. In turn, categorical classifications of changes might

GENERAL BACKGROUND
57
result coarse and limited for fully capturing the nature of PA evolution, undermining
the possibility of drawing inferences, since they only accounts for qualitative changes.
Group-Based Trajectory Modelling
Novel data-driven methods (such as GBTM) have arisen as informative analytical
methods that enable the identification of individuals within a population following
similar patterns of change for a variable along follow-up from a similar baseline value
[288, 289].
Figure 20. Percentile Curves LPA, and MVPA over the lifespan (6 years old to
84 years old) for males (left) and females (right).
Percentiles of LPA, and MVPA, from 5%-95%, are indicated using different colors (black = 95%, gray =
90%, yellow = 75%, purple = 50%, cyan = 25%, blue = 10%, green = 5%).
From Varma et al., 2018 [284]
The incorporation of these methods into PA epidemiology contributes to refining the
definition of PA evolution as an independent variable, overcoming the limitations of
categorial definitions. Due to the recent incorporation of data-driven methods into
PA epidemiology and the need for several PA estimations along time to identify PA
trajectories within a study, there is a scarcity of evidence linking PA patterns of
evolution and relevant outcomes at older ages [290].

GENERAL BACKGROUND
58
Novel advancements in PA characterization (age-specific accelerometry cut-points,
isotemporal substitution models, GBTM) allow to partly address and overcome some
of previous late life PA epidemiology evidence limitations. In addition to the
reshaping of outcome definitions (frailty, sarcopenia) [80, 291–293] and availability of
data related to previously scarcely researched outcomes (intrinsic capacity, adverse
events), altogether, they have opened new research questions amenable to be
addressed in relation to PA, one of the most promising healthy ageing determinants.

GENERAL BACKGROUND
59
8. Toledo Study of Healthy Ageing
To give response to some of these questions, data from the TSHA was used in the
studies included in this thesis dissertation. TSHA is an ongoing population-based
study primarily designed for gaining insight into frailty determinants in a Spanish
older adult population. 2488 subjects <65 years were recruited through a two-stage
random sampling of Toledo province census. The whole sample was comprised of
two different cohorts: the survivors of a previous study (the Toledo Study), that were
older than 77 years [294] and individuals recruited on purpose ranging 65-76 years
of age. Baseline data collection (wave 1) took place between 2006 and 2009 and
subsequent assessments (waves 2 and 3) were carried out between 2011-2013 and
2015-2017, respectively.
This thesis is intended to contribute to the evidence exploring the role of physical
behaviors as healthy ageing determinants, overcoming some limitations of previous
research (Figure 21).

GENERAL BACKGROUND
60
Sedentary behaviour, physical activity, and sarcopenia among older adults in the TSHA:
isotemporal substitution model
Physical activity trajectories, mortality, hospitalization and disability in the Toledo study of healthy
aging
Figure 21. Conceptual map of research questions addressed by this thesis, within the
healthy vs accelerated ageing scope.
SB=Sedentary Behavior; LPA=Light PA; MVPA: Moderate-to-vigorous PA; T2DM=Type 2 Diabetes
Mellitus; COPD=Chronic Obstructive Pulmonary Disease; CNS=Central Nervous System; NMuscular=
Neuromuscular; CVS=Cardiovascular System; CVDs=Cardiovascular Diseases; VO2MAX=Maximum
oxygen uptake. NDD= Neurodegenerative Diseases;

GENERAL BACKGROUND
61
General Background References
[1] Brown GC. Living too long: the current focus of medical research on increasing the quantity, rather than the quality, of life is damaging our health and harming the economy. EMBO Rep 2015; 16: 137–141.
[2] Vaupel JW. Biodemography of human ageing. Nature 2010; 464: 536–542.
[3] Oeppen J, Vaupel JW. Demography. Broken limits to life expectancy. Science 2002; 296: 1029–1031.
[4] World Population Prospects 2019: Data Booklet, https://www.un-ilibrary.org/population-and-demography/world-population-prospects-2019-data-booklet_3e9d869f-en (accessed 17 March 2020).
[5] The 2015 Ageing Report: Economic and budgetary projections for the 28 EU Member States (2013-2060) - European Commission, https://ec.europa.eu/economy_finance/publications/european_economy/2015/ee3_en.htm (accessed 29 October 2019).
[6] Eurostat - Data Explorer, http://appsso.eurostat.ec.europa.eu/nui/show.do?dataset=tps00199&lang=en (accessed 18 March 2020).
[7] Un perfil de las personas mayores en España, 2019 Indicadores estadísticos básicos – EnR?|, http://envejecimientoenred.es/un-perfil-de-las-personas-mayores-en-espana-2019-indicadores-estadisticos-basicos/ (accessed 13 January 2020).
[8] WHO | World Health Statistics 2019: Monitoring health for the SDGs. WHO, http://www.who.int/gho/publications/world_health_statistics/2019/en/ (accessed 18 March 2020).
[9] Murray CJL, Lopez AD. Measuring the global burden of disease. N Engl J Med 2013; 369: 448–457.
[10] Klijs B, Nusselder WJ, Looman CW, et al. Contribution of chronic disease to the burden of disability. PLoS ONE 2011; 6: e25325.
[11] Rodriguez-Mañas L, Fried LP. Frailty in the clinical scenario. Lancet 2015; 385: e7–e9.
[12] National Center for Health Statistics (US). Health, United States, 2012: With Special Feature on Emergency Care. Hyattsville (MD): National Center for Health Statistics (US), http://www.ncbi.nlm.nih.gov/books/NBK148940/ (2013, accessed 7 March 2020).
[13] Carmona-Torres JM, Rodríguez-Borrego MA, Laredo-Aguilera JA, et al. Disability for basic and instrumental activities of daily living in older individuals. PLoS One; 14. Epub ahead of print 26 July 2019. DOI: 10.1371/journal.pone.0220157.

GENERAL BACKGROUND
62
[14] Christensen K, Doblhammer G, Rau R, et al. Ageing populations: the challenges ahead. Lancet 2009; 374: 1196–1208.
[15] Crimmins EM, Zhang Y, Saito Y. Trends Over 4 Decades in Disability-Free Life Expectancy in the United States. Am J Public Health 2016; 106: 1287–1293.
[16] Chen Y, Sloan FA. Explaining Disability Trends in the U.S. Elderly and Near-Elderly Population. Health Serv Res 2015; 50: 1528–1549.
[17] Kuo H-T, Lin K-C, Lan C-F, et al. Activities of daily living trajectories among institutionalised older adults: A prospective study. J Clin Nurs 2017; 26: 4756–4767.
[18] Zhang X, Zhang W, Wang C, et al. Sarcopenia as a predictor of hospitalization among older people: a systematic review and meta-analysis. BMC Geriatr; 18. Epub ahead of print 22 August 2018. DOI: 10.1186/s12877-018-0878-0.
[19] Carmona-Torres JM, Carvalhal R, Gálvez-Rioja RM, et al. Elder Abuse in the Iberian Peninsula and Bolivia: A Multicountry Comparative Study. J Interpers Violence 2017; 886260517713712.
[20] Gill TM, Gahbauer EA, Allore HG, et al. Transitions between frailty states among community-living older persons. Arch Intern Med 2006; 166: 418–423.
[21] Wong E, Stevenson C, Backholer K, et al. Predicting the risk of physical disability in old age using modifiable mid-life risk factors. J Epidemiol Community Health 2015; 69: 70–76.
[22] Fancourt D, Steptoe A. Comparison of physical and social risk-reducing factors for the development of disability in older adults: a population-based cohort study. J Epidemiol Community Health 2019; 73: 906–912.
[23] Mehta NK, Patel SA, Ali MK, et al. Preventing Disability in the United States: The Role of Modifiable Risk Factors on State and National Disability Prevalence. Health Aff (Millwood) 2017; 36: 626–635.
[24] WHO | WHO Guidelines on Integrated Care for Older People (ICOPE). WHO, http://www.who.int/ageing/publications/guidelines-icope/en/ (accessed 7 February 2019).
[25] de Carvalho IA, Martin FC, Cesari M, et al. Operationalising the concept of intrinsic capacity in clinical settings. 2017; 31.
[26] Cesari M, Araujo de Carvalho I, Amuthavalli Thiyagarajan J, et al. Evidence for the Domains Supporting the Construct of Intrinsic Capacity. J Gerontol A Biol Sci Med Sci 2018; 73: 1653–1660.
[27] Clegg A, Young J, Iliffe S, et al. Frailty in elderly people. Lancet 2013; 381: 752–762.
[28] Angulo J, El Assar M, Rodríguez-Mañas L. Frailty and sarcopenia as the basis for the phenotypic manifestation of chronic diseases in older adults. Mol Aspects Med 2016; 50: 1–32.

GENERAL BACKGROUND
63
[29] Walston J, Hadley EC, Ferrucci L, et al. Research agenda for frailty in older adults: toward a better understanding of physiology and etiology: summary from the American Geriatrics Society/National Institute on Aging Research Conference on Frailty in Older Adults. J Am Geriatr Soc 2006; 54: 991–1001.
[30] Burch JB, Augustine AD, Frieden LA, et al. Advances in geroscience: impact on healthspan and chronic disease. J Gerontol A Biol Sci Med Sci 2014; 69 Suppl 1: S1-3.
[31] Seals DR, Justice JN, LaRocca TJ. Physiological geroscience: targeting function to increase healthspan and achieve optimal longevity. J Physiol (Lond) 2016; 594: 2001–2024.
[32] Harridge SDR, Lazarus NR. Physical Activity, Aging, and Physiological Function. Physiology (Bethesda) 2017; 32: 152–161.
[33] Puts MTE, Visser M, Twisk JWR, et al. Endocrine and inflammatory markers as predictors of frailty. Clin Endocrinol (Oxf) 2005; 63: 403–411.
[34] Leng SX, Xue Q-L, Tian J, et al. Inflammation and frailty in older women. J Am Geriatr Soc 2007; 55: 864–871.
[35] Ferrucci L, Cavazzini C, Corsi A, et al. Biomarkers of frailty in older persons. J Endocrinol Invest 2002; 25: 10–15.
[36] Fried LP, Xue Q-L, Cappola AR, et al. Nonlinear Multisystem Physiological Dysregulation Associated With Frailty in Older Women: Implications for Etiology and Treatment. J Gerontol A Biol Sci Med Sci 2009; 64A: 1049–1057.
[37] Booth FW, Roberts CK, Laye MJ. Lack of exercise is a major cause of chronic diseases. Compr Physiol 2012; 2: 1143–1211.
[38] Pérez LM, Pareja-Galeano H, Sanchis-Gomar F, et al. ‘Adipaging’: ageing and obesity share biological hallmarks related to a dysfunctional adipose tissue. J Physiol (Lond) 2016; 594: 3187–3207.
[39] Lazarus NR, Lord JM, Harridge SDR. The relationships and interactions between age, exercise and physiological function. J Physiol (Lond) 2019; 597: 1299–1309.
[40] Distefano G, Goodpaster BH. Effects of Exercise and Aging on Skeletal Muscle. Cold Spring Harb Perspect Med; 8. Epub ahead of print 01 2018. DOI: 10.1101/cshperspect.a029785.
[41] Bowen TS, Schuler G, Adams V. Skeletal muscle wasting in cachexia and sarcopenia: molecular pathophysiology and impact of exercise training. J Cachexia Sarcopenia Muscle 2015; 6: 197–207.
[42] Rudrappa SS, Wilkinson DJ, Greenhaff PL, et al. Human Skeletal Muscle Disuse Atrophy: Effects on Muscle Protein Synthesis, Breakdown, and Insulin Resistance-A Qualitative Review. Front Physiol 2016; 7: 361.

GENERAL BACKGROUND
64
[43] Wilson TM, Tanaka H. Meta-analysis of the age-associated decline in maximal aerobic capacity in men: relation to training status. Am J Physiol Heart Circ Physiol 2000; 278: H829-834.
[44] Pollock ML, Mengelkoch LJ, Graves JE, et al. Twenty-year follow-up of aerobic power and body composition of older track athletes. J Appl Physiol 1997; 82: 1508–1516.
[45] Hawkins SA, Marcell TJ, Victoria Jaque S, et al. A longitudinal assessment of change in VO2max and maximal heart rate in master athletes. Med Sci Sports Exerc 2001; 33: 1744–1750.
[46] Pearson SJ, Young A, Macaluso A, et al. Muscle function in elite master weightlifters. Med Sci Sports Exerc 2002; 34: 1199–1206.
[47] Klitgaard H, Mantoni M, Schiaffino S, et al. Function, morphology and protein expression of ageing skeletal muscle: a cross-sectional study of elderly men with different training backgrounds. Acta Physiol Scand 1990; 140: 41–54.
[48] Baker AB, Tang YQ. Aging performance for masters records in athletics, swimming, rowing, cycling, triathlon, and weightlifting. Exp Aging Res 2010; 36: 453–477.
[49] Fried LP, Tangen CM, Walston J, et al. Frailty in older adults: evidence for a phenotype. J Gerontol A Biol Sci Med Sci 2001; 56: M146-156.
[50] Rodríguez-Mañas L, Féart C, Mann G, et al. Searching for an operational definition of frailty: a Delphi method based consensus statement: the frailty operative definition-consensus conference project. J Gerontol A Biol Sci Med Sci 2013; 68: 62–67.
[51] Joseph B, Pandit V, Zangbar B, et al. Superiority of frailty over age in predicting outcomes among geriatric trauma patients: a prospective analysis. JAMA Surg 2014; 149: 766–772.
[52] Robinson TN, Eiseman B, Wallace JI, et al. Redefining geriatric preoperative assessment using frailty, disability and co-morbidity. Ann Surg 2009; 250: 449–455.
[53] Xue Q-L, Varadhan R. What is missing in the validation of frailty instruments? J Am Med Dir Assoc 2014; 15: 141–142.
[54] Cesari M, Gambassi G, van Kan GA, et al. The frailty phenotype and the frailty index: different instruments for different purposes. Age Ageing 2014; 43: 10–12.
[55] Howlett SE, Rockwood K. New horizons in frailty: ageing and the deficit-scaling problem. Age Ageing 2013; 42: 416–423.
[56] Collard RM, Boter H, Schoevers RA, et al. Prevalence of frailty in community-dwelling older persons: a systematic review. J Am Geriatr Soc 2012; 60: 1487–1492.

GENERAL BACKGROUND
65
[57] O’Caoimh R, Galluzzo L, Rodríguez-Laso Á, et al. Prevalence of frailty at population level in European ADVANTAGE Joint Action Member States: a systematic review and meta-analysis. Ann Ist Super Sanita 2018; 54: 226–238.
[58] Kojima G. Prevalence of Frailty in Nursing Homes: A Systematic Review and Meta-Analysis. J Am Med Dir Assoc 2015; 16: 940–945.
[59] Gale CR, Cooper C, Aihie Sayer A. Prevalence of frailty and disability: findings from the English Longitudinal Study of Ageing. Age Ageing 2015; 44: 162–165.
[60] Pollack LR, Litwack-Harrison S, Cawthon PM, et al. Patterns and Predictors of Frailty Transitions in Older Men: The Osteoporotic Fractures in Men Study. J Am Geriatr Soc 2017; 65: 2473–2479.
[61] Cesari M, Vellas B, Hsu F-C, et al. . J Gerontol A Biol Sci Med Sci 2015; 70: 216–222.
[62] Gill TM, Gahbauer EA, Han L, et al. The relationship between intervening hospitalizations and transitions between frailty states. J Gerontol A Biol Sci Med Sci 2011; 66: 1238–1243.
[63] Rodríguez-Mañas L, Walston JD. Frailty, what are we talking about? Implications for the daily clinical practice. Rev Esp Geriatr Gerontol 2017; 52: 179–181.
[64] Cesari M, Prince M, Thiyagarajan JA, et al. Frailty: An Emerging Public Health Priority. J Am Med Dir Assoc 2016; 17: 188–192.
[65] Morley JE, Vellas B, Abellan van Kan G, et al. Frailty Consensus: A Call to Action. Journal of the American Medical Directors Association 2013; 14: 392–397.
[66] Krishnan M, Beck S, Havelock W, et al. Predicting outcome after hip fracture: using a frailty index to integrate comprehensive geriatric assessment results. Age Ageing 2014; 43: 122–126.
[67] Hubbard RE, Story DA. Patient frailty: the elephant in the operating room. Anaesthesia 2014; 69 Suppl 1: 26–34.
[68] Roe L, Normand C, Wren M-A, et al. The impact of frailty on healthcare utilisation in Ireland: evidence from the Irish longitudinal study on ageing. BMC Geriatr 2017; 17: 203.
[69] Muscedere J, Waters B, Varambally A, et al. The impact of frailty on intensive care unit outcomes: a systematic review and meta-analysis. Intensive Care Med 2017; 43: 1105–1122.
[70] Sy J, Johansen KL. The impact of frailty on outcomes in dialysis. Curr Opin Nephrol Hypertens 2017; 26: 537–542.
[71] Sepehri A, Beggs T, Hassan A, et al. The impact of frailty on outcomes after cardiac surgery: a systematic review. J Thorac Cardiovasc Surg 2014; 148: 3110–3117.

GENERAL BACKGROUND
66
[72] Laube R, Wang H, Park L, et al. Frailty in advanced liver disease. Liver Int 2018; 38: 2117–2128.
[73] Hewitt J, Long S, Carter B, et al. The prevalence of frailty and its association with clinical outcomes in general surgery: a systematic review and meta-analysis. Age Ageing 2018; 47: 793–800.
[74] Hamel MB, Henderson WG, Khuri SF, et al. Surgical outcomes for patients aged 80 and older: morbidity and mortality from major noncardiac surgery. J Am Geriatr Soc 2005; 53: 424–429.
[75] Cesari M, Nobili A, Vitale G. Frailty and sarcopenia: From theory to clinical implementation and public health relevance. Eur J Intern Med 2016; 35: 1–9.
[76] Lee L, Patel T, Hillier LM, et al. Identifying frailty in primary care: A systematic review. Geriatr Gerontol Int 2017; 17: 1358–1377.
[77] Cesari M, Landi F, Vellas B, et al. Sarcopenia and physical frailty: two sides of the same coin. Front Aging Neurosci 2014; 6: 192.
[78] Morley JE, Abbatecola AM, Argiles JM, et al. Sarcopenia with limited mobility: an international consensus. J Am Med Dir Assoc 2011; 12: 403–409.
[79] Rosenberg IH. Sarcopenia: origins and clinical relevance. J Nutr 1997; 127: 990S-991S.
[80] Cruz-Jentoft AJ, Bahat G, Bauer J, et al. Sarcopenia: revised European consensus on definition and diagnosis. Age Ageing 2019; 48: 601.
[81] Cao L, Morley JE. Sarcopenia Is Recognized as an Independent Condition by an International Classification of Disease, Tenth Revision, Clinical Modification (ICD-10-CM) Code. J Am Med Dir Assoc 2016; 17: 675–677.
[82] Cawthon PM, Travison TG, Manini TM, et al. Establishing the Link Between Lean Mass and Grip Strength Cut Points With Mobility Disability and Other Health Outcomes: Proceedings of the Sarcopenia Definition and Outcomes Consortium Conference. J Gerontol A Biol Sci Med Sci 2020; 75: 1317–1323.
[83] Langer HT, Mossakowski AA, Baar K, et al. Commentaries on Viewpoint: Rejuvenation of the term sarcopenia. J Appl Physiol 2019; 126: 257–262.
[84] Bhasin S, Travison TG, Manini TM, et al. Sarcopenia Definition: The Position Statements of the Sarcopenia Definition and Outcomes Consortium. J Am Geriatr Soc. Epub ahead of print 9 March 2020. DOI: 10.1111/jgs.16372.
[85] Cawthon PM, Travison TG, Manini TM, et al. Establishing the Link Between Lean Mass and Grip Strength Cut-points With Mobility Disability and Other Health Outcomes: Proceedings of the Sarcopenia Definition and Outcomes Consortium Conference. J Gerontol A Biol Sci Med Sci. Epub ahead of print 14 March 2019. DOI: 10.1093/gerona/glz081.
[86] Mayhew AJ, Amog K, Phillips S, et al. The prevalence of sarcopenia in community-dwelling older adults, an exploration of differences between studies

GENERAL BACKGROUND
67
and within definitions: a systematic review and meta-analyses. Age Ageing 2019; 48: 48–56.
[87] Shafiee G, Keshtkar A, Soltani A, et al. Prevalence of sarcopenia in the world: a systematic review and meta- analysis of general population studies. J Diabetes Metab Disord; 16. Epub ahead of print 16 May 2017. DOI: 10.1186/s40200-017-0302-x.
[88] Papadopoulou SK, Tsintavis P, Potsaki P, et al. Differences in the Prevalence of Sarcopenia in Community-Dwelling, Nursing Home and Hospitalized Individuals. A Systematic Review and Meta-Analysis. J Nutr Health Aging 2020; 24: 83–90.
[89] Churilov I, Churilov L, MacIsaac RJ, et al. Systematic review and meta-analysis of prevalence of sarcopenia in post acute inpatient rehabilitation. Osteoporos Int 2018; 29: 805–812.
[90] Benz E, Trajanoska K, Lahousse L, et al. Sarcopenia in COPD: a systematic review and meta-analysis. Eur Respir Rev; 28. Epub ahead of print 31 December 2019. DOI: 10.1183/16000617.0049-2019.
[91] Pacifico J, Geerlings MAJ, Reijnierse EM, et al. Prevalence of sarcopenia as a comorbid disease: A systematic review and meta-analysis. Exp Gerontol 2020; 131: 110801.
[92] Morley JE, Malmstrom TK, Rodriguez-Mañas L, et al. Frailty, sarcopenia and diabetes. J Am Med Dir Assoc 2014; 15: 853–859.
[93] Sinclair AJ, Abdelhafiz AH, Rodríguez-Mañas L. Frailty and sarcopenia - newly emerging and high impact complications of diabetes. J Diabetes Complicat 2017; 31: 1465–1473.
[94] Ruiz JR, Sui X, Lobelo F, et al. Association between muscular strength and mortality in men: prospective cohort study. BMJ 2008; 337: a439.
[95] Yang J, Christophi CA, Farioli A, et al. Association Between Push-up Exercise Capacity and Future Cardiovascular Events Among Active Adult Men. JAMA Netw Open 2019; 2: e188341.
[96] Reid KF, Fielding RA. Skeletal muscle power: a critical determinant of physical functioning in older adults. Exerc Sport Sci Rev 2012; 40: 4–12.
[97] Beaudart C, Zaaria M, Pasleau F, et al. Health Outcomes of Sarcopenia: A Systematic Review and Meta-Analysis. PLoS ONE 2017; 12: e0169548.
[98] Locquet M, Beaudart C, Hajaoui M, et al. Three-Year Adverse Health Consequences of Sarcopenia in Community-Dwelling Older Adults According to 5 Diagnosis Definitions. J Am Med Dir Assoc. Epub ahead of print 19 July 2018. DOI: 10.1016/j.jamda.2018.06.004.
[99] Liu P, Hao Q, Hai S, et al. Sarcopenia as a predictor of all-cause mortality among community-dwelling older people: A systematic review and meta-analysis. Maturitas 2017; 103: 16–22.

GENERAL BACKGROUND
68
[100] Yeung SSY, Reijnierse EM, Pham VK, et al. Sarcopenia and its association with falls and fractures in older adults: A systematic review and meta‐analysis. J Cachexia Sarcopenia Muscle 2019; 10: 485–500.
[101] Janssen I, Shepard DS, Katzmarzyk PT, et al. The healthcare costs of sarcopenia in the United States. J Am Geriatr Soc 2004; 52: 80–85.
[102] Goates S, Du K, Arensberg MB, et al. Economic Impact of Hospitalizations in US Adults with Sarcopenia. J Frailty Aging 2019; 8: 93–99.
[103] Pinedo-Villanueva R, Westbury LD, Syddall HE, et al. Health Care Costs Associated With Muscle Weakness: A UK Population-Based Estimate. Calcif Tissue Int 2019; 104: 137–144.
[104] Dodds RM, Syddall HE, Cooper R, et al. Global variation in grip strength: a systematic review and meta-analysis of normative data. Age Ageing 2016; 45: 209–216.
[105] Goodpaster BH, Park SW, Harris TB, et al. The loss of skeletal muscle strength, mass, and quality in older adults: the health, aging and body composition study. J Gerontol A Biol Sci Med Sci 2006; 61: 1059–1064.
[106] Alcazar J, Aagaard P, Haddock B, et al. Age- and sex-specific changes in lower-limb muscle power throughout the lifespan. J Gerontol A Biol Sci Med Sci. DOI: 10.1093/gerona/glaa013.
[107] Lauretani F, Russo CR, Bandinelli S, et al. Age-associated changes in skeletal muscles and their effect on mobility: an operational diagnosis of sarcopenia. J Appl Physiol 2003; 95: 1851–1860.
[108] Visser M, Goodpaster BH, Kritchevsky SB, et al. Muscle mass, muscle strength, and muscle fat infiltration as predictors of incident mobility limitations in well-functioning older persons. J Gerontol A Biol Sci Med Sci 2005; 60: 324–333.
[109] Aagaard P, Suetta C, Caserotti P, et al. Role of the nervous system in sarcopenia and muscle atrophy with aging: strength training as a countermeasure. Scand J Med Sci Sports 2010; 20: 49–64.
[110] Miljkovic N, Lim J-Y, Miljkovic I, et al. Aging of skeletal muscle fibers. Ann Rehabil Med 2015; 39: 155–162.
[111] D’Antona G, Pellegrino MA, Adami R, et al. The effect of ageing and immobilization on structure and function of human skeletal muscle fibres. J Physiol (Lond) 2003; 552: 499–511.
[112] Casas-Herrero A, Cadore EL, Zambom-Ferraresi F, et al. Functional capacity, muscle fat infiltration, power output, and cognitive impairment in institutionalized frail oldest old. Rejuvenation Res 2013; 16: 396–403.
[113] Snijders T, Nederveen JP, McKay BR, et al. Satellite cells in human skeletal muscle plasticity. Front Physiol 2015; 6: 283.

GENERAL BACKGROUND
69
[114] Budui SL, Rossi AP, Zamboni M. The pathogenetic bases of sarcopenia. Clin Cases Miner Bone Metab 2015; 12: 22–26.
[115] Ziaaldini MM, Marzetti E, Picca A, et al. Biochemical Pathways of Sarcopenia and Their Modulation by Physical Exercise: A Narrative Review. Front Med (Lausanne) 2017; 4: 167.
[116] Calvani R, Joseph A-M, Adhihetty PJ, et al. Mitochondrial pathways in sarcopenia of aging and disuse muscle atrophy. Biol Chem 2013; 394: 393–414.
[117] Boengler K, Kosiol M, Mayr M, et al. Mitochondria and ageing: role in heart, skeletal muscle and adipose tissue. J Cachexia Sarcopenia Muscle 2017; 8: 349–369.
[118] Cruz-Jentoft AJ, Sayer AA. Sarcopenia. Lancet 2019; 393: 2636–2646.
[119] Kirk B, Phu S, Debruin DA, et al. Aging Muscle and Sarcopenia. In: Rattan SIS (ed) Encyclopedia of Biomedical Gerontology. Oxford: Academic Press, pp. 120–131.
[120] Manini TM, Hong SL, Clark BC. Aging and muscle: a neuron’s perspective. Curr Opin Clin Nutr Metab Care 2013; 16: 21–26.
[121] Pedersen BK. Muscles and their myokines. J Exp Biol 2011; 214: 337–346.
[122] Nelke C, Dziewas R, Minnerup J, et al. Skeletal muscle as potential central link between sarcopenia and immune senescence. EBioMedicine 2019; 49: 381–388.
[123] Cleasby ME, Jamieson PM, Atherton PJ. Insulin resistance and sarcopenia: mechanistic links between common co-morbidities. J Endocrinol 2016; 229: R67-81.
[124] Rubio-Ruiz ME, Guarner-Lans V, Pérez-Torres I, et al. Mechanisms Underlying Metabolic Syndrome-Related Sarcopenia and Possible Therapeutic Measures. Int J Mol Sci; 20. Epub ahead of print 2 February 2019. DOI: 10.3390/ijms20030647.
[125] Fiuza-Luces C, Santos-Lozano A, Joyner M, et al. Exercise benefits in cardiovascular disease: beyond attenuation of traditional risk factors. Nat Rev Cardiol. Epub ahead of print 16 August 2018. DOI: 10.1038/s41569-018-0065-1.
[126] Kalinkovich A, Livshits G. Sarcopenic obesity or obese sarcopenia: A cross talk between age-associated adipose tissue and skeletal muscle inflammation as a main mechanism of the pathogenesis. Ageing Res Rev 2017; 35: 200–221.
[127] Gomarasca M, Banfi G, Lombardi G. Myokines: The endocrine coupling of skeletal muscle and bone. Adv Clin Chem 2020; 94: 155–218.
[128] Lauretani F, Meschi T, Ticinesi A, et al. ‘Brain-muscle loop’ in the fragility of older persons: from pathophysiology to new organizing models. Aging Clin Exp Res 2017; 29: 1305–1311.

GENERAL BACKGROUND
70
[129] Peng T-C, Chen W-L, Wu L-W, et al. Sarcopenia and cognitive impairment: A systematic review and meta-analysis. Clin Nutr. Epub ahead of print 17 December 2019. DOI: 10.1016/j.clnu.2019.12.014.
[130] Barazzoni R, Bischoff S, Boirie Y, et al. Sarcopenic Obesity: Time to Meet the Challenge. Obes Facts 2018; 11: 294–305.
[131] Kirk B, Zanker J, Duque G. Osteosarcopenia: epidemiology, diagnosis, and treatment—facts and numbers. Journal of Cachexia, Sarcopenia and Muscle; n/a. DOI: 10.1002/jcsm.12567.
[132] Withrow D, Alter DA. The economic burden of obesity worldwide: a systematic review of the direct costs of obesity. Obes Rev 2011; 12: 131–141.
[133] Czech MP. Insulin action and resistance in obesity and type 2 diabetes. Nat Med 2017; 23: 804–814.
[134] Hirschfeld HP, Kinsella R, Duque G. Osteosarcopenia: where bone, muscle, and fat collide. Osteoporos Int 2017; 28: 2781–2790.
[135] Hong S-H, Choi KM. Sarcopenic Obesity, Insulin Resistance, and Their Implications in Cardiovascular and Metabolic Consequences. Int J Mol Sci; 21. Epub ahead of print 13 January 2020. DOI: 10.3390/ijms21020494.
[136] Baumgartner RN, Wayne SJ, Waters DL, et al. Sarcopenic obesity predicts instrumental activities of daily living disability in the elderly. Obes Res 2004; 12: 1995–2004.
[137] Hirani V, Naganathan V, Blyth F, et al. Longitudinal associations between body composition, sarcopenic obesity and outcomes of frailty, disability, institutionalisation and mortality in community-dwelling older men: The Concord Health and Ageing in Men Project. Age Ageing 2017; 46: 413–420.
[138] Sepúlveda-Loyola W, Phu S, Bani Hassan E, et al. The Joint Occurrence of Osteoporosis and Sarcopenia (Osteosarcopenia): Definitions and Characteristics. J Am Med Dir Assoc 2020; 21: 220–225.
[139] Landi F, Calvani R, Cesari M, et al. Sarcopenia as the Biological Substrate of Physical Frailty. Clin Geriatr Med 2015; 31: 367–374.
[140] Davies B, García F, Ara I, et al. Relationship Between Sarcopenia and Frailty in the Toledo Study of Healthy Aging: A Population Based Cross-Sectional Study. J Am Med Dir Assoc. Epub ahead of print 24 October 2017. DOI: 10.1016/j.jamda.2017.09.014.
[141] CDC. Physical Activity. Centers for Disease Control and Prevention, https://www.cdc.gov/physicalactivity/index.html (2020, accessed 6 February 2020).
[142] Ekelund U, Tarp J, Steene-Johannessen J, et al. Dose-response associations between accelerometry measured physical activity and sedentary time and all cause mortality: systematic review and harmonised meta-analysis. BMJ 2019; 366: l4570.
GENERAL BACKGROUND
71
[143] Morris JN, Heady JA, Raffle PA, et al. Coronary heart-disease and physical activity of work. Lancet 1953; 262: 1053–1057.
[144] Morris JN, Crawford MD. Coronary Heart Disease and Physical Activity of Work. Br Med J 1958; 2: 1485–1496.
[145] Moore SC, Lee I-M, Weiderpass E, et al. Association of Leisure-Time Physical Activity With Risk of 26 Types of Cancer in 1.44 Million Adults. JAMA Intern Med 2016; 176: 816–825.
[146] Pareja-Galeano H, Garatachea N, Lucia A. Exercise as a Polypill for Chronic Diseases. Prog Mol Biol Transl Sci 2015; 135: 497–526.
[147] Aune D, Norat T, Leitzmann M, et al. Physical activity and the risk of type 2 diabetes: a systematic review and dose-response meta-analysis. Eur J Epidemiol 2015; 30: 529–542.
[148] Guure CB, Ibrahim NA, Adam MB, et al. Impact of Physical Activity on Cognitive Decline, Dementia, and Its Subtypes: Meta-Analysis of Prospective Studies. Biomed Res Int 2017; 2017: 9016924.
[149] Löllgen H, Böckenhoff A, Knapp G. Physical activity and all-cause mortality: an updated meta-analysis with different intensity categories. Int J Sports Med 2009; 30: 213–224.
[150] Paffenbarger RS, Hyde RT, Wing AL, et al. Physical activity, all-cause mortality, and longevity of college alumni. N Engl J Med 1986; 314: 605–613.
[151] Fiuza-Luces C, Garatachea N, Berger NA, et al. Exercise is the real polypill. Physiology (Bethesda) 2013; 28: 330–358.
[152] Pedersen BK, Saltin B. Exercise as medicine - evidence for prescribing exercise as therapy in 26 different chronic diseases. Scand J Med Sci Sports 2015; 25 Suppl 3: 1–72.
[153] Lee I-M, Shiroma EJ, Lobelo F, et al. Effect of physical inactivity on major non-communicable diseases worldwide: an analysis of burden of disease and life expectancy. Lancet 2012; 380: 219–229.
[154] Friedenreich CM, Stone CR, Cheung WY, et al. Physical Activity and Mortality in Cancer Survivors: A Systematic Review and Meta-Analysis. JNCI Cancer Spectr; 4. Epub ahead of print 1 February 2020. DOI: 10.1093/jncics/pkz080.
[155] Lauche R, Peng W, Ferguson C, et al. Efficacy of Tai Chi and qigong for the prevention of stroke and stroke risk factors: A systematic review with meta-analysis. Medicine (Baltimore) 2017; 96: e8517.
[156] Liu J-X, Zhu L, Li P-J, et al. Effectiveness of high-intensity interval training on glycemic control and cardiorespiratory fitness in patients with type 2 diabetes: a systematic review and meta-analysis. Aging Clin Exp Res. Epub ahead of print 30 July 2018. DOI: 10.1007/s40520-018-1012-z.

GENERAL BACKGROUND
72
[157] Sampath Kumar A, Maiya AG, Shastry BA, et al. Exercise and insulin resistance in type 2 diabetes mellitus: A systematic review and meta-analysis. Ann Phys Rehabil Med 2019; 62: 98–103.
[158] Cao L, Li X, Yan P, et al. The effectiveness of aerobic exercise for hypertensive population: A systematic review and meta-analysis. J Clin Hypertens (Greenwich) 2019; 21: 868–876.
[159] Song G, Chen C, Zhang J, et al. Association of traditional Chinese exercises with glycemic responses in people with type 2 diabetes: A systematic review and meta-analysis of randomized controlled trials. J Sport Health Sci 2018; 7: 442–452.
[160] De Nardi AT, Tolves T, Lenzi TL, et al. High-intensity interval training versus continuous training on physiological and metabolic variables in prediabetes and type 2 diabetes: A meta-analysis. Diabetes Res Clin Pract 2018; 137: 149–159.
[161] Lee J, Kim D, Kim C. Resistance Training for Glycemic Control, Muscular Strength, and Lean Body Mass in Old Type 2 Diabetic Patients: A Meta-Analysis. Diabetes Ther 2017; 8: 459–473.
[162] Ambrosetti M, Abreu A, Corrà U, et al. Secondary prevention through comprehensive cardiovascular rehabilitation: From knowledge to implementation. 2020 update. A position paper from the Secondary Prevention and Rehabilitation Section of the European Association of Preventive Cardiology. Eur J Prev Cardiol 2020; 2047487320913379.
[163] Ligibel JA, Basen-Engquist K, Bea JW. Weight Management and Physical Activity for Breast Cancer Prevention and Control. Am Soc Clin Oncol Educ Book 2019; 39: e22–e33.
[164] Stamatakis E, Hamer M. Sedentary behaviour: redefining its meaning and links to chronic disease. Br J Hosp Med (Lond) 2011; 72: 192–195.
[165] Koster A, Caserotti P, Patel KV, et al. Association of sedentary time with mortality independent of moderate to vigorous physical activity. PLoS ONE 2012; 7: e37696.
[166] Owen N, Healy GN, Dempsey PC, et al. Sedentary Behavior and Public Health: Integrating the Evidence and Identifying Potential Solutions. Annu Rev Public Health 2020; 41: 265–287.
[167] Freedson PS, Melanson E, Sirard J. Calibration of the Computer Science and Applications, Inc. accelerometer. Med Sci Sports Exerc 1998; 30: 777–781.
[168] Evenson KR, Wen F, Herring AH, et al. Calibrating physical activity intensity for hip-worn accelerometry in women age 60 to 91 years: The Women’s Health Initiative OPACH Calibration Study. Prev Med Rep 2015; 2: 750–756.
[169] Copeland JL, Esliger DW. Accelerometer assessment of physical activity in active, healthy older adults. J Aging Phys Act 2009; 17: 17–30.

GENERAL BACKGROUND
73
[170] Egan B, Zierath JR. Exercise metabolism and the molecular regulation of skeletal muscle adaptation. Cell Metab 2013; 17: 162–184.
[171] Radak Z, Chung HY, Goto S. Exercise and hormesis: oxidative stress-related adaptation for successful aging. Biogerontology 2005; 6: 71–75.
[172] McArdle WD, Katch FI, Katch VL. Exercise Physiology: Nutrition, Energy, and Human Performance. Lippincott Williams & Wilkins, 2010.
[173] Tremblay MS, Aubert S, Barnes JD, et al. Sedentary Behavior Research Network (SBRN) – Terminology Consensus Project process and outcome. Int J Behav Nutr Phys Act; 14. Epub ahead of print 10 June 2017. DOI: 10.1186/s12966-017-0525-8.
[174] Thyfault JP, Du M, Kraus WE, et al. Physiology of sedentary behavior and its relationship to health outcomes. Med Sci Sports Exerc 2015; 47: 1301–1305.
[175] Dempsey PC, Matthews CE, Dashti SG, et al. Sedentary Behavior and Chronic Disease: Mechanisms and Future Directions. J Phys Act Health 2019; 1–10.
[176] Stamatakis E, Ekelund U, Ding D, et al. Is the time right for quantitative public health guidelines on sitting? A narrative review of sedentary behaviour research paradigms and findings. Br J Sports Med 2019; 53: 377–382.
[177] Pate RR, Pratt M, Blair SN, et al. Physical activity and public health. A recommendation from the Centers for Disease Control and Prevention and the American College of Sports Medicine. JAMA 1995; 273: 402–407.
[178] Physical Activity Guidelines Advisory Committee report, 2008. To the Secretary of Health and Human Services. Part A: executive summary. Nutr Rev 2009; 67: 114–120.
[179] Haskell WL, Lee I-M, Pate RR, et al. Physical activity and public health: updated recommendation for adults from the American College of Sports Medicine and the American Heart Association. Circulation 2007; 116: 1081–1093.
[180] WHO | Global recommendations on physical activity for health. WHO, https://www.who.int/dietphysicalactivity/factsheet_recommendations/en/ (accessed 2 April 2020).
[181] Public consultation on the draft WHO Guidelines on physical activity and sedentary behaviour for children and adolescents, adults and older adults 2020, https://www.who.int/news-room/articles-detail/public-consultation-on-the-draft-who-guidelines-on-physical-activity-and-sedentary-behaviour-for-children-and-adolescents-adults-and-older-adults-2020 (accessed 2 April 2020).
[182] Ekelund U, Steene-Johannessen J, Brown WJ, et al. Does physical activity attenuate, or even eliminate, the detrimental association of sitting time with mortality? A harmonised meta-analysis of data from more than 1 million men and women. Lancet 2016; 388: 1302–1310.

GENERAL BACKGROUND
74
[183] Booth FW, Laye MJ, Lees SJ, et al. Reduced physical activity and risk of chronic disease: the biology behind the consequences. Eur J Appl Physiol 2008; 102: 381–390.
[184] O’Keefe JH, Vogel R, Lavie CJ, et al. Exercise like a hunter-gatherer: a prescription for organic physical fitness. Prog Cardiovasc Dis 2011; 53: 471–479.
[185] Neufer PD, Bamman MM, Muoio DM, et al. Understanding the Cellular and Molecular Mechanisms of Physical Activity-Induced Health Benefits. Cell Metabolism 2015; 22: 4–11.
[186] Hawley JA, Hargreaves M, Joyner MJ, et al. Integrative biology of exercise. Cell 2014; 159: 738–749.
[187] Lundby C, Jacobs RA. Adaptations of skeletal muscle mitochondria to exercise training. Exp Physiol 2016; 101: 17–22.
[188] Stanford KI, Middelbeek RJW, Townsend KL, et al. A novel role for subcutaneous adipose tissue in exercise-induced improvements in glucose homeostasis. Diabetes 2015; 64: 2002–2014.
[189] Schoenfeld BJ. The mechanisms of muscle hypertrophy and their application to resistance training. J Strength Cond Res 2010; 24: 2857–2872.
[190] Brook MS, Wilkinson DJ, Smith K, et al. It’s not just about protein turnover: the role of ribosomal biogenesis and satellite cells in the regulation of skeletal muscle hypertrophy. Eur J Sport Sci 2019; 19: 952–963.
[191] Pedersen BK. Myokines and Metabolism. In: Ahima RS (ed) Metabolic Syndrome: A Comprehensive Textbook. Cham: Springer International Publishing, pp. 541–554.
[192] Vechetti IJ, Valentino T, Mobley CB, et al. The role of extracellular vesicles in skeletal muscle and systematic adaptation to exercise. The Journal of Physiology; n/a. DOI: 10.1113/JP278929.
[193] Blüher M. Adipose tissue inflammation: a cause or consequence of obesity-related insulin resistance? Clin Sci 2016; 130: 1603–1614.
[194] Nystoriak MA, Bhatnagar A. Cardiovascular Effects and Benefits of Exercise. Front Cardiovasc Med 2018; 5: 135.
[195] Viña J, Rodriguez‐Mañas L, Salvador‐Pascual A, et al. Exercise: the lifelong supplement for healthy ageing and slowing down the onset of frailty. J Physiol 2016; 594: 1989–1999.
[196] Delezie J, Handschin C. Endocrine Crosstalk Between Skeletal Muscle and the Brain. Front Neurol 2018; 9: 698.
[197] Hoier B, Hellsten Y. Exercise-induced capillary growth in human skeletal muscle and the dynamics of VEGF. Microcirculation 2014; 21: 301–314.

GENERAL BACKGROUND
75
[198] Pinckard K, Baskin KK, Stanford KI. Effects of Exercise to Improve Cardiovascular Health. Front Cardiovasc Med 2019; 6: 69.
[199] Garatachea N, Pareja-Galeano H, Sanchis-Gomar F, et al. Exercise attenuates the major hallmarks of aging. Rejuvenation Res 2015; 18: 57–89.
[200] Peterson MD, Sen A, Gordon PM. Influence of resistance exercise on lean body mass in aging adults: a meta-analysis. Med Sci Sports Exerc 2011; 43: 249–258.
[201] Peterson MD, Rhea MR, Sen A, et al. Resistance exercise for muscular strength in older adults: a meta-analysis. Ageing Res Rev 2010; 9: 226–237.
[202] Fiatarone MA, O’Neill EF, Ryan ND, et al. Exercise training and nutritional supplementation for physical frailty in very elderly people. N Engl J Med 1994; 330: 1769–1775.
[203] Valenzuela PL, Maffiuletti NA, Joyner MJ, et al. Lifelong Endurance Exercise as a Countermeasure Against Age-Related $$\dot{V}{\text{O}}_{{ 2 {\text{max}}}}$$V˙O2max Decline: Physiological Overview and Insights from Masters Athletes. Sports Med. Epub ahead of print 24 December 2019. DOI: 10.1007/s40279-019-01252-0.
[204] Izquierdo M, Ibañez J, HAkkinen K, et al. Once weekly combined resistance and cardiovascular training in healthy older men. Med Sci Sports Exerc 2004; 36: 435–443.
[205] Duggal NA, Niemiro G, Harridge SDR, et al. Can physical activity ameliorate immunosenescence and thereby reduce age-related multi-morbidity? Nat Rev Immunol 2019; 19: 563–572.
[206] Meeusen R. Exercise, Nutrition and the Brain. Sports Med 2014; 44: 47–56.
[207] Rodriguez-Mañas L, Laosa O, Vellas B, et al. Effectiveness of a multimodal intervention in functionally impaired older people with type 2 diabetes mellitus. J Cachexia Sarcopenia Muscle 2019; 10: 721–733.
[208] de Vries NM, van Ravensberg CD, Hobbelen JSM, et al. Effects of physical exercise therapy on mobility, physical functioning, physical activity and quality of life in community-dwelling older adults with impaired mobility, physical disability and/or multi-morbidity: a meta-analysis. Ageing Res Rev 2012; 11: 136–149.
[209] Sherrington C, Fairhall NJ, Wallbank GK, et al. Exercise for preventing falls in older people living in the community. Cochrane Database Syst Rev 2019; 1: CD012424.
[210] Pahor M, Guralnik JM, Ambrosius WT, et al. Effect of structured physical activity on prevention of major mobility disability in older adults: the LIFE study randomized clinical trial. JAMA 2014; 311: 2387–2396.
[211] Sáez de Asteasu ML, Martínez-Velilla N, Zambom-Ferraresi F, et al. Role of physical exercise on cognitive function in healthy older adults: A systematic review of randomized clinical trials. Ageing Res Rev 2017; 37: 117–134.

GENERAL BACKGROUND
76
[212] Martínez-Velilla N, Casas-Herrero A, Zambom-Ferraresi F, et al. Effect of Exercise Intervention on Functional Decline in Very Elderly Patients During Acute Hospitalization: A Randomized Clinical Trial. JAMA Intern Med 2019; 179: 28–36.
[213] Valenzuela PL, Morales JS, Pareja-Galeano H, et al. Physical strategies to prevent disuse-induced functional decline in the elderly. Ageing Res Rev 2018; 47: 80–88.
[214] Dent E, Morley JE, Cruz-Jentoft AJ, et al. International Clinical Practice Guidelines for Sarcopenia (ICFSR): Screening, Diagnosis and Management. J Nutr Health Aging 2018; 22: 1148–1161.
[215] Dent E, Morley JE, Cruz-Jentoft AJ, et al. Physical Frailty: ICFSR International Clinical Practice Guidelines for Identification and Management. J Nutr Health Aging 2019; 23: 771–787.
[216] Macdonald SH-F, Travers J, Shé ÉN, et al. Primary care interventions to address physical frailty among community-dwelling adults aged 60 years or older: A meta-analysis. PLoS ONE 2020; 15: e0228821.
[217] Cadore EL, Izquierdo M. Muscle Power Training: A Hallmark for Muscle Function Retaining in Frail Clinical Setting. J Am Med Dir Assoc 2018; 19: 190–192.
[218] Casas Herrero Á, Cadore EL, Martínez Velilla N, et al. [Physical exercise in the frail elderly: an update]. Rev Esp Geriatr Gerontol 2015; 50: 74–81.
[219] Cadore EL, Casas-Herrero A, Zambom-Ferraresi F, et al. Multicomponent exercises including muscle power training enhance muscle mass, power output, and functional outcomes in institutionalized frail nonagenarians. Age (Dordr) 2014; 36: 773–785.
[220] Izquierdo M, Rodriguez-Mañas L, Sinclair AJ. Editorial: What Is New in Exercise Regimes for Frail Older People - How Does the Erasmus Vivifrail Project Take Us Forward? J Nutr Health Aging 2016; 20: 736–737.
[221] Viña J, Salvador-Pascual A, Tarazona-Santabalbina FJ, et al. Exercise training as a drug to treat age associated frailty. Free Radic Biol Med 2016; 98: 159–164.
[222] Vlietstra L, Hendrickx W, Waters DL. Exercise interventions in healthy older adults with sarcopenia: A systematic review and meta-analysis. Australas J Ageing. Epub ahead of print 11 April 2018. DOI: 10.1111/ajag.12521.
[223] Bangsbo J, Blackwell J, Boraxbekk C-J, et al. Copenhagen Consensus statement 2019: physical activity and ageing. Br J Sports Med 2019; 53: 856–858.
[224] Álvarez C, Ramírez-Campillo R, Ramírez-Vélez R, et al. Effects and prevalence of nonresponders after 12 weeks of high-intensity interval or resistance training in women with insulin resistance: a randomized trial. J Appl Physiol 2017; 122: 985–996.

GENERAL BACKGROUND
77
[225] Barbalho M de SM, Gentil P, Izquierdo M, et al. There are no no-responders to low or high resistance training volumes among older women. Exp Gerontol 2017; 99: 18–26.
[226] Sáez de Asteasu ML, Martínez‐Velilla N, Zambom‐Ferraresi F, et al. Inter‐
individual variability in response to exercise intervention or usual care in hospitalized older adults. J Cachexia Sarcopenia Muscle 2019; 10: 1266–1275.
[227] Nyman SR, Victor CR. Older people’s participation in and engagement with falls prevention interventions in community settings: an augment to the cochrane systematic review. Age Ageing 2012; 41: 16–23.
[228] Bennie JA, De Cocker K, Teychenne MJ, et al. The epidemiology of aerobic physical activity and muscle-strengthening activity guideline adherence among 383,928 U.S. adults. Int J Behav Nutr Phys Act; 16. Epub ahead of print 18 April 2019. DOI: 10.1186/s12966-019-0797-2.
[229] Bender AA, Halpin SN, Kemp CL, et al. Barriers and Facilitators to Exercise Participation Among Frail Older African American Assisted Living Residents. J Appl Gerontol 2019; 733464819893923.
[230] Forechi L, Mill JG, Griep RH, et al. Adherence to physical activity in adults with chronic diseases: ELSA-Brasil. Rev Saude Publica 2018; 52: 31.
[231] Kehler DS, Theou O. The impact of physical activity and sedentary behaviors on frailty levels. Mech Ageing Dev 2019; 180: 29–41.
[232] Volpato S, Bianchi L, Cherubini A, et al. Prevalence and clinical correlates of sarcopenia in community-dwelling older people: application of the EWGSOP definition and diagnostic algorithm. J Gerontol A Biol Sci Med Sci 2014; 69: 438–446.
[233] Aggio DA, Sartini C, Papacosta O, et al. Cross-sectional associations of objectively measured physical activity and sedentary time with sarcopenia and sarcopenic obesity in older men. Prev Med 2016; 91: 264–272.
[234] Liao C-D, Tsauo J-Y, Lin L-F, et al. Effects of elastic resistance exercise on body composition and physical capacity in older women with sarcopenic obesity: A CONSORT-compliant prospective randomized controlled trial. Medicine (Baltimore) 2017; 96: e7115.
[235] Tak E, Kuiper R, Chorus A, et al. Prevention of onset and progression of basic ADL disability by physical activity in community dwelling older adults: a meta-analysis. Ageing Res Rev 2013; 12: 329–338.
[236] Wannamethee SG, Shaper AG, Walker M. Changes in physical activity, mortality, and incidence of coronary heart disease in older men. Lancet 1998; 351: 1603–1608.
[237] Hupin D, Roche F, Gremeaux V, et al. Even a low-dose of moderate-to-vigorous physical activity reduces mortality by 22% in adults aged ≥60 years: a systematic review and meta-analysis. Br J Sports Med 2015; 49: 1262–1267.

GENERAL BACKGROUND
78
[238] Paterson DH, Warburton DE. Physical activity and functional limitations in older adults: a systematic review related to Canada’s Physical Activity Guidelines. Int J Behav Nutr Phys Act 2010; 7: 38.
[239] Peeters GMEEG, Gardiner PA, Dobson AJ, et al. Associations between physical activity, medical costs and hospitalisations in older Australian women: Results from the Australian Longitudinal Study on Women’s Health. J Sci Med Sport 2018; 21: 604–608.
[240] Fried LP. Interventions for Human Frailty: Physical Activity as a Model. Cold Spring Harb Perspect Med; 6. Epub ahead of print June 2016. DOI: 10.1101/cshperspect.a025916.
[241] Xue Q-L, Bandeen-Roche K, Mielenz TJ, et al. Patterns of 12-year change in physical activity levels in community-dwelling older women: can modest levels of physical activity help older women live longer? Am J Epidemiol 2012; 176: 534–543.
[242] Savela SL, Koistinen P, Stenholm S, et al. Leisure-time physical activity in midlife is related to old age frailty. J Gerontol A Biol Sci Med Sci 2013; 68: 1433–1438.
[243] Woo J, Chan R, Leung J, et al. Relative contributions of geographic, socioeconomic, and lifestyle factors to quality of life, frailty, and mortality in elderly. PLoS ONE 2010; 5: e8775.
[244] Zhang X, Tan SS, Franse CB, et al. Longitudinal Association Between Physical Activity and Frailty Among Community-Dwelling Older Adults. J Am Geriatr Soc. Epub ahead of print 20 March 2020. DOI: 10.1111/jgs.16391.
[245] Kehler DS, Clara I, Hiebert B, et al. The association between patterns of physical activity and sedentary time with frailty in relation to cardiovascular disease. Aging Med (Milton) 2019; 2: 18–26.
[246] Blodgett J, Theou O, Kirkland S, et al. The association between sedentary behaviour, moderate-vigorous physical activity and frailty in NHANES cohorts. Maturitas 2015; 80: 187–191.
[247] del Pozo-Cruz B, Mañas A, Martín-García M, et al. Frailty is associated with objectively assessed sedentary behaviour patterns in older adults: Evidence from the Toledo Study for Healthy Aging (TSHA). PLoS One; 12. Epub ahead of print 11 September 2017. DOI: 10.1371/journal.pone.0183911.
[248] Chen S, Chen T, Kishimoto H, et al. Associations of Objectively Measured Patterns of Sedentary Behavior and Physical Activity with Frailty Status Screened by The Frail Scale in Japanese Community-Dwelling Older Adults. J Sports Sci Med 2020; 19: 166–174.
[249] Mañas A, Pozo-Cruz BD, Rodríguez-Gómez I, et al. Can Physical Activity Offset the Detrimental Consequences of Sedentary Time on Frailty? A Moderation Analysis in 749 Older Adults Measured With Accelerometers. J Am Med Dir Assoc 2019; 20: 634-638.e1.
GENERAL BACKGROUND
79
[250] Foong YC, Chherawala N, Aitken D, et al. Accelerometer-determined physical activity, muscle mass, and leg strength in community-dwelling older adults. J Cachexia Sarcopenia Muscle 2016; 7: 275–283.
[251] Park H, Park S, Shephard RJ, et al. Yearlong physical activity and sarcopenia in older adults: the Nakanojo Study. Eur J Appl Physiol 2010; 109: 953–961.
[252] Patel KV, Coppin AK, Manini TM, et al. Midlife physical activity and mobility in older age: The InCHIANTI study. Am J Prev Med 2006; 31: 217–224.
[253] Dodds R, Kuh D, Aihie Sayer A, et al. Physical activity levels across adult life and grip strength in early old age: updating findings from a British birth cohort. Age Ageing 2013; 42: 794–798.
[254] Steffl M, Bohannon RW, Sontakova L, et al. Relationship between sarcopenia and physical activity in older people: a systematic review and meta-analysis. Clin Interv Aging 2017; 12: 835–845.
[255] Gianoudis J, Bailey CA, Daly RM. Associations between sedentary behaviour and body composition, muscle function and sarcopenia in community-dwelling older adults. Osteoporos Int 2015; 26: 571–579.
[256] Smith L, Tully M, Jacob L, et al. The Association Between Sedentary Behavior and Sarcopenia Among Adults Aged ≥65 Years in Low- and Middle-Income Countries. Int J Environ Res Public Health; 17. Epub ahead of print 05 2020. DOI: 10.3390/ijerph17051708.
[257] Prince SA, Cardilli L, Reed JL, et al. A comparison of self-reported and device measured sedentary behaviour in adults: a systematic review and meta-analysis. International Journal of Behavioral Nutrition and Physical Activity 2020; 17: 31.
[258] Warren JM, Ekelund U, Besson H, et al. Assessment of physical activity - a review of methodologies with reference to epidemiological research: a report of the exercise physiology section of the European Association of Cardiovascular Prevention and Rehabilitation. Eur J Cardiovasc Prev Rehabil 2010; 17: 127–139.
[259] Izquierdo M, Martínez-Ramírez A, Larrión JL, et al. [Functional capacity evaluation in a clinical and ambulatory setting: new challenges of accelerometry to assessment balance and muscle power in aging population]. An Sist Sanit Navar 2008; 31: 159–170.
[260] Migueles JH, Cadenas-Sanchez C, Ekelund U, et al. Accelerometer Data Collection and Processing Criteria to Assess Physical Activity and Other Outcomes: A Systematic Review and Practical Considerations. Sports Med 2017; 47: 1821–1845.
[261] Cleland CL, Ferguson S, McCrorie P, et al. Considerations in Processing Accelerometry Data to Explore Physical Activity and Sedentary Time in Older Adults. J Aging Phys Act 2020; 1–11.
[262] Zisko N, Carlsen T, Salvesen Ø, et al. New relative intensity ambulatory accelerometer thresholds for elderly men and women: the Generation 100 study. BMC Geriatr 2015; 15: 97.

GENERAL BACKGROUND
80
[263] Kwan M, Woo J, Kwok T. The standard oxygen consumption value equivalent to one metabolic equivalent (3.5 ml/min/kg) is not appropriate for elderly people. Int J Food Sci Nutr 2004; 55: 179–182.
[264] Miller NE, Strath SJ, Swartz AM, et al. Estimating absolute and relative physical activity intensity across age via accelerometry in adults. J Aging Phys Act 2010; 18: 158–170.
[265] Matthew CE. Calibration of accelerometer output for adults. Med Sci Sports Exerc 2005; 37: S512-522.
[266] Aspvik NP, Viken H, Zisko N, et al. Are Older Adults Physically Active Enough - A Matter of Assessment Method? The Generation 100 Study. PLoS ONE 2016; 11: e0167012.
[267] Koster A, Shiroma EJ, Caserotti P, et al. Comparison of Sedentary Estimates between activPAL and Hip- and Wrist-Worn ActiGraph. Med Sci Sports Exerc 2016; 48: 1514–1522.
[268] Barnett A, Smith B, Lord SR, et al. Community-based group exercise improves balance and reduces falls in at-risk older people: a randomised controlled trial. Age Ageing 2003; 32: 407–414.
[269] Aguilar-Farías N, Brown WJ, Peeters GMEEG. ActiGraph GT3X+ cut-points for identifying sedentary behaviour in older adults in free-living environments. J Sci Med Sport 2014; 17: 293–299.
[270] Santos-Lozano A, Santín-Medeiros F, Cristi-Montero C, et al. GT1M, GT3X and ActiTrainer counts comparison during standardized activities in young, adults and older adults. Nutr Hosp 2016; 33: 280.
[271] Welch WA, Alexander NB, Swartz AM, et al. Individualized Estimation of Physical Activity in Older Adults with Type 2 Diabetes. Med Sci Sports Exerc 2017; 49: 2185–2190.
[272] American College of Sports Medicine, Chodzko-Zajko WJ, Proctor DN, et al. American College of Sports Medicine position stand. Exercise and physical activity for older adults. Med Sci Sports Exerc 2009; 41: 1510–1530.
[273] Rees-Punia E, Evans EM, Schmidt MD, et al. Mortality Risk Reductions for Replacing Sedentary Time With Physical Activities. Am J Prev Med 2019; 56: 736–741.
[274] Füzéki E, Engeroff T, Banzer W. Health Benefits of Light-Intensity Physical Activity: A Systematic Review of Accelerometer Data of the National Health and Nutrition Examination Survey (NHANES). Sports Med 2017; 47: 1769–1793.
[275] Chastin SFM, De Craemer M, De Cocker K, et al. How does light-intensity physical activity associate with adult cardiometabolic health and mortality? Systematic review with meta-analysis of experimental and observational studies. Br J Sports Med 2019; 53: 370–376.

GENERAL BACKGROUND
81
[276] LaCroix AZ, Bellettiere J, Rillamas-Sun E, et al. Association of Light Physical Activity Measured by Accelerometry and Incidence of Coronary Heart Disease and Cardiovascular Disease in Older Women. JAMA Netw Open 2019; 2: e190419.
[277] de Rezende LFM, Rey-López JP, Matsudo VKR, et al. Sedentary behavior and health outcomes among older adults: a systematic review. BMC Public Health 2014; 14: 333.
[278] Mekary RA, Willett WC, Hu FB, et al. Isotemporal substitution paradigm for physical activity epidemiology and weight change. Am J Epidemiol 2009; 170: 519–527.
[279] Willett W. Implications of Total Energy Intake for Epidemiologic Analyses. Oxford University Press, https://www.oxfordscholarship.com/view/10.1093/acprof:oso/9780199754038.001.0001/acprof-9780199754038-chapter-11 (2012, accessed 5 February 2020).
[280] Willett W, Stampfer MJ. Total energy intake: implications for epidemiologic analyses. Am J Epidemiol 1986; 124: 17–27.
[281] Mekary RA, Willett WC, Hu FB, et al. Isotemporal substitution paradigm for physical activity epidemiology and weight change. Am J Epidemiol 2009; 170: 519–527.
[282] Arem H, Moore SC, Patel A, et al. Leisure time physical activity and mortality: a detailed pooled analysis of the dose-response relationship. JAMA Intern Med 2015; 175: 959–967.
[283] Santos DA, Júdice PB, Magalhães JP, et al. Patterns of accelerometer-derived sedentary time across the lifespan. J Sports Sci 2018; 36: 2809–2817.
[284] Varma VR, Dey D, Leroux A, et al. Re-evaluating the effect of age on physical activity over the lifespan. Prev Med 2017; 101: 102–108.
[285] Kats D, Evenson KR, Zeng D, et al. Leisure-time physical activity volume, intensity, and duration from mid- to late-life in U.S. subpopulations by race and sex. The Atherosclerosis Risk In Communities (ARIC) Study. Aging (Albany NY) 2020; 12: 4592–4602.
[286] Shortreed SM, Peeters A, Forbes AB. Estimating the effect of long-term physical activity on cardiovascular disease and mortality: evidence from the Framingham Heart Study. Heart 2013; 99: 649–654.
[287] Gregg EW, Cauley JA, Stone K, et al. Relationship of changes in physical activity and mortality among older women. JAMA 2003; 289: 2379–2386.
[288] Nagin DS. Group-based trajectory modeling: an overview. Ann Nutr Metab 2014; 65: 205–210.
[289] Nagin DS, Jones BL, Passos VL, et al. Group-based multi-trajectory modeling. Stat Methods Med Res 2018; 27: 2015–2023.

GENERAL BACKGROUND
82
[290] Laddu DR, Cawthon PM, Parimi N, et al. Trajectories of the relationships of physical activity with body composition changes in older men: the MrOS study. BMC Geriatr 2017; 17: 119.
[291] García-García FJ, Carcaillon L, Fernandez-Tresguerres J, et al. A new operational definition of frailty: the Frailty Trait Scale. J Am Med Dir Assoc 2014; 15: 371.e7-371.e13.
[292] McLean RR, Shardell MD, Alley DE, et al. Criteria for clinically relevant weakness and low lean mass and their longitudinal association with incident mobility impairment and mortality: the foundation for the National Institutes of Health (FNIH) sarcopenia project. J Gerontol A Biol Sci Med Sci 2014; 69: 576–583.
[293] Studenski SA, Peters KW, Alley DE, et al. The FNIH sarcopenia project: rationale, study description, conference recommendations, and final estimates. J Gerontol A Biol Sci Med Sci 2014; 69: 547–558.
[294] García García FJ, Sánchez Ayala MI, Pérez Martín A, et al. [The prevalence of dementia and its main subtypes in subjects older than 65 years: impact of occupation and education. The Toledo Study]. Med Clin (Barc) 2001; 116: 401–407.

AIMS AND LAYOUTS OF THE THESIS
83
Aims and layouts of the thesis
Chapter 1
Study 1
Title:
Sedentary behaviour, physical activity, and sarcopenia among older adults in the
TSHA: isotemporal substitution model
Research aim:
To explore the associations between reallocations of time engaged in different PA
intensities and SB and sarcopenia and its determinants in an older adult cohort.
Hypothesis: Increasing time spent in SB is inversely associated with MM, gait speed, and handgrip
strength and with a higher sarcopenia prevalence whereas greater time spent in LPA
and MVPA are associated with higher MM and handgrip strength, faster gait speed,
and a lower sarcopenia prevalence. Furthermore, we hypothesize differential effects
of increasing time spent in a specific intensity category depending on the intensity
nature of the time displaced in the isotemporal substitution models.
Chapter 2
Study 2
Title:
Physical activity trajectories, mortality, hospitalization, and disability in the Toledo
Study of Healthy Aging
Research aim:
To investigate the existence of different PA trajectories within the Toledo Study of
Healthy Aging (TSHA) sample, a Spanish longitudinal population-based study, and
to evaluate their associations with adverse outcomes (mortality, disability onset and
worsening, and hospitalization).
Hypothesis:
Chronically active older adults and those maintaining PA over time will have a lower
likelihood of experiencing adverse outcomes compared with consistently inactive

84
subjects or those reducing PA levels during follow-up and that increasing PA even at
older ages promotes healthy aging, as characterized by reduced mortality, disability
onset/worsening, and hospitalization rates.

85
Chapter 1: Sedentary behaviour, physical activity,
and sarcopenia among older adults in the TSHA: isotemporal substitution model
Published in the Journal of Cachexia, Sarcopenia and Muscle

Chapter 1-PHYSICAL BEHAVIOURS AND SARCOPENIA
86
Introduction
Sarcopenia is an age-associated syndrome which comprises loss of muscle mass plus
a loss of muscle function (strength and power) and/or physical performance [1].
Sarcopenia is a core contributor to frailty, physical limitations and disability at
advanced ages [2]. Although primary ageing contributes to sarcopenia, the rate of
muscle mass and function loss appears to be modifiable relying upon lifestyle habits,
mainly diet and physical activity (PA) [3]. Structured physical exercise, specifically
strength training, has shown to be effective in sarcopenia prevention and reversal [3–
5]. However, the associations between walking-related daily PA and sarcopenia
remains to be elucidated. Moreover, the majority of the studies have assessed PA and
SB by either self-report or using questionnaires, raising potential biases related to
failures in subjective recall of past events associated with activities eliciting energy
expenditure and social desirability, yielding daily-living PA overreporting and/or SB
underestimation [6,7]. The use of accelerometers has allowed the objective daily
living-related-PA estimation, trough motions derived from ambulation. Studies that
aimed to improve the insight into the preventive role of objectively measured PA and
health-related conditions at older ages have applied thresholds validated in healthy
young adults for PA intensity categorization [8,9]. This could have led to inaccuracy
and misclassification of actual PA behaviors, generating an overestimation of SB [10]
and underestimation of actual PA [11], due to differences in energy cost of a given
activity in older adults, when compared to younger cohorts [12]. It has already been
demonstrated that using classical younger-adults cut-points when exploring older
adults PA patterns can artificially decrease PA adherence rates among older adults
[12,13], and that PA estimates vary notably depending upon the cut-points used [14].
Recently, isotemporal substitution models were introduced to the analysis of PA data.
They take account for the finiteness of the time in which a subject can partake in
activities in the different intensity categories of PA. Engaging in activities in a specific
level of intensity, necessarily involves reducing time in another. Although previous
research suggests a beneficial effect of PA on sarcopenia, the analytic methods
overlooked the possibility of different effects elicited by the reallocation of time in a
given intensity, relying upon the nature of the intensity it displaces. For example, an
increase of time in LPA is likely to induce different effect on sarcopenia and its
determinants whether it displaces SB or MVPA [15].

Chapter 1-PHYSICAL BEHAVIOURS AND SARCOPENIA
87
The aim of the current study is to assess the associations between objectively-
measured PA levels and different sarcopenia-related variables (muscle mass (MM),
gait speed (GS), and handgrip strength (HS)) and sarcopenia prevalence, by using
accelerometers that can objectively assess ambulation-related PA and SB [16], and
classifying the intensity of activities using age-specific cut-off points for older adults
in order to classify time into different PA intensity bands and SB. Our hypothesis is
that increasing time spent in SB is inversely associated with MM, GS, and HS, and
with a higher sarcopenia prevalence whereas greater time spent in LPA and MVPA
are associated with higher MM, HS and faster GS and a lower sarcopenia prevalence.
Furthermore, we hypothesize differential effects of increasing time spent in a specific
intensity category depending on the intensity nature of the time displaced in the
isotemporal substitution model.
Methods
This work describes a cross-sectional analysis of the data from the Toledo Study of
Healthy Ageing (TSHA), a Spanish longitudinal population-based study, designed
for evaluating frailty determinants in individuals older than 65 years of age [17]. The
study protocol was approved by the Clinical Research Ethics Committee of the Toledo
Hospital, Spain. Participants signed informed consent forms prior to their inclusion
in the cohort.
Measurements
Identification of sarcopenia
MM was measured using Dual X-ray Absorptiometry scan (DEXA) (Hologic, Serie
Discovery QDR, Bedford, USA). All DEXA scan tests were analysed using the
software Physician’s Viewer, APEX System Software Version 3.1.2. (Bedford, USA).
Whole-body scans were made in a supine position, in which the participants were
scanned wearing light clothing with no metal and no shoes or jewellery. Body Mass
Index-adjusted Appendicular Lean Mass (ALM/BMI) was used as marker. Low
muscle strength in kilograms was assessed with HG measurement using a JAMAR
hydraulic hand dynamometer (J. A. Preston Corporation, Clifton, NJ, USA); three
attempts were performed in the dominant hand with the elbow extended while sitting
and the best record was registered. Low physical performance was defined as a low

Chapter 1-PHYSICAL BEHAVIOURS AND SARCOPENIA
88
GS, computed by measuring the time (seconds) needed to cover a 3-meters path at a
usual gait speed. The best of two measurements was recorded. Sarcopenia was
identified using the FNIH diagnosis algorithm. According to this algorithm,
sarcopenia is present in older adults with a gait speed <0.8 m/s in both genders [18]
plus clinically relevant low MM and weakness. As stated by FNIH report, cut points
for low MM and HG were an ALM/BMI below 0.789 in men and 0.512 in women, a
HS lower than 26 kg for men and lower than 16 kg.
Physical Activity Assessment
Physical activity and SB were estimated using an ActiTrainer accelerometer
(ActiGraph, LLC, Fort Walton Beach, FL, USA). All participants were asked to wear
a device on the left hip during waking hours for 7 consecutive days and remove them
during any bathing or swimming activities. The delivery and reception, as well as the
explanation of use, were made in person by trained staff [19]. Data were processed
using standard methods; Raw ActiTrainer data were converted to counts per minute
(CPM), which reflects the acceleration and hence the intensity of PA. The higher the
CPM, the higher intensity of movement measured. Data collected from movement
were integrated into 60 s increment periods (epochs).
PA intensity is typically categorized based on metabolic equivalents (METs), being
the unit of the resting metabolic rate (RMR). Each valid wearing-time minute was
classified using CPM-based thresholds matched to the classical MET-based
transitions between intensity categories: SB (<1.5 METs in lying or sitting position),
LPA (1.5–2.99 METs), and MVPA (≥3 METs). In this study, cut-off points specific to
the older adult population were applied to classify minutes per day spent in each
intensity band based on the conversion of accelerometer vector magnitude (that
integrates the three axes of movement) CPM to MET [10,20] (Table S1). Moderate
intensity and vigorous intensity were merged together in an MVPA category.
Non-wear time was defined as periods of at least 60 consecutive minutes of zero
counts, with allowance for 2 min of counts from the accelerometer-vertical axis
between 0 and 100 [21] . The study included the results from participants with at least
four valid days recorded. A valid day was defined as at least 480 min (8 h) of wearing
without excessive counts (>20 000 vertical-axis counts). Minutes spent in each of these
activity intensity bands were computed and used as the number of 1 hr intervals per

Chapter 1-PHYSICAL BEHAVIOURS AND SARCOPENIA
89
day in the analysis. Also, total activity counts (TAC) was taken as a composite
measure of PA, independent of intensity, frequency, and patterns.
Statistical Analysis
All analyses were adjusted for age residuals obtained from the linear regression of
chronological age on the three levels of PA [23]. T-Student test was used for between-
groups comparison. Three different linear regression models were used for the
associations between PA and SB and sarcopenia determinants: a) single PA-
parameter model, b) a partition model and c) an isotemporal substitution. For the
analysis of the association between PAL levels and sarcopenia we used logistic
regression. All models adjusted for age residuals, sex, the presence of comorbidities
(Charlson Index) and functional ability (Katz and Lawton Indexes). Statistical
significance was set at p<0.05. All analyses were done in R 3.4.1 (R Core Team, Vienna,
Austria).
Results
512 subjects with DEXA and valid accelerometer measures available were included
in this analysis. Among them, 497 subjects had available data for sarcopenia diagnosis
and 116 (23.3%) were classified as sarcopenic according to FNIH criteria. Mean age of
the whole sample was 78.08 (5.71) years and 54.3% of subjects were women. Mean
MM, GS and HS were 0.72 (0.1) kg/(kg. h-2), 0.77 (0.26) m/s, 28.01 (7.65) kg for men
and 0.51 (0.07), 0.69 (0.25) and 17.53 (5.02) for women, respectively. Participants spent
53.6% of the wearing time in SB, 38.6% in LPA and 7.8% in MVPA.
In the bivariate comparisons, subjects classified as sarcopenic showed differences
with regard to those classified as non-sarcopenic in the variables related to sarcopenia
and in those related to PA: longer time in SB (p<0.01) and shorter time in both LPA
(p<0.01) and MVPA (p<0.001) (Table 1.1).
In the single PA-parameter model (Table 1.2, model A) each 1-hour/day increase in
MVPA showed a significant association with greater values in MM, GS and HS,
whereas each 1-hour/day increase in LPA did so with a higher HS; 1SD increase in
TAC was significantly associated with MM, GS, HS. In the partition model (Table 1.2,
model B), adding 1-hour/day of MVPA to the actual PA and SB patterns was
associated with greater MM and GS, whereas adding 1-hour/day of LPA was
associated with a reduction in GS (β=-0.022; 95% CI=-0.040, -0.004; p=0.017).

Chapter 1-PHYSICAL BEHAVIOURS AND SARCOPENIA
90
Table 1.1 Demographic characteristics stratified by the sarcopenia status according to FNIH
Whole sample (n=512¥)
Non-Sarcopenic (n=381)
Sarcopenic (n=116)
Demographic data
Age (mean/SD) 78.08 (5.71) 77.4 (5.83) 80.21 (4.8) ***
Women (n, %) 278 (54.3%) 218 (57.2%) 54 (46.6%)
Accelerometer-related data
Total Wearing Time (h, mean/SD) 84.39 (16.03) 85.15 (15.86) 82.66 (15.82)
SB h/day, (mean/SD) 6.98 (1.62) 6.82 (1.57) 7.53 (1.63) ***
LPA h/day, (mean/SD) 5.01 (1.5) 5.15 (1.47) 4.63 (1.53) **
MVPA h/day, (mean/SD) 1.02 (0.78) 1.09 (0.79) 0.76 (0.69) ***
TAC/day (mean/SD) 409365.62 (180677.01) 428558.64 (179575.42) 343391.76 (167575.43) ***
Sarcopenia-related measures
ALM/BMI (mean/SD) 0.6 (0.13) 0.62 (0.14) 0.56 (0.12) ***
Gait Speed (m/s, mean/SD) 0.73 (0.26) 0.79 (0.25) 0.52 (0.14) ***
Handgrip Strength (kg, mean/SD) 22.26 (8.21) 24.1 (8.04) 16.45 (5.2) ***
Conditions
Type 2 Diabetes Mellitus (n, %) 117 (22.9%) 79 (20.7%) 33 (28.4%) *
Hypertension (n, %) 335 (65.4%) 242 (63.5%) 82 (70.7%)
Myocardial Infarction (n, %) 23 (4.5%) 18 (4.7%) 5 (4.3%)
Heart Failure (n, %) 11 (2.1%) 8 (2.1%) 3 (2.6%)
Charlson Index Score (mean, SD) 1.97 (1.75) 1.77 (1.54) 2.64 (2.21) ***
Functional Ability Measures
ADL Dependency, Katz Index (n, %) 96 (18.8%) 64 (16.8%) 29 (25%)
IADL Dependency, Lawton Index (n, %)
278 (54.3%) 187 (49.1%) 81 (69.8%) ***
¥ =Missing data for at least one FNIH sarcopenia determinant in 15 subjects (2.9%). Statistically significant between group differences in boldface, when P-value <0.05: *p<0.05; **p<0.01; ***p<0.001; SD=Standard Deviation. SB=Sedentary Behaviour; LPA=Light Physical Activity; MVPA=Moderate-to-Vigorous Physical Activity; TAC=Total Activity Counts; ADL=Activities of Daily Living; IADL=Instrumental Activities of Daily Living

Chapter 1-PHYSICAL BEHAVIOURS AND SARCOPENIA
91
Table 1.2. Regression coefficients expressing associations between time engaged in different PA intensity bands and sarcopenia determinants
Muscle Mass (ALM/BMI)
β (95% CI) Gait Speed (m/s)
β (95% CI) Handgrip Strength (Kg)
β (95% CI)
A) A) Single Parameter Model
Each 1-hour increase (independent of the rest of PA categories)
SB -0.003
(-0.007, 0.001) -0.010
(-0.024, 0.003) -0.467
(-0.807, -0.128)
LPA 0.003
(-0.002, 0.008) -0.006
(-0.021, 0.009) 0.428*
(0.051, 0.805)
MVPA 0.015**
(0.005, 0.024) 0.070***
(0.043, 0.097) 0.933**
(0.246, 1.620)
B) Partition Model
Adding 1 hour/day of
SB 0.001
(-0.005, 0.007) -0.007
(-0.024, 0.011) -0.243
(-0.687, 0.202)
LPA 0.001
(-0.005, 0.008) -0.022*
(-0.040, -0.004) 0.179
(-0.289, 0.647)
MVPA 0.0147**
(0.004, 0.025) 0.076***
(0.046, 0.105) 0.645
(-0.108, 1.399)
C) Isotemporal Substitution Model
Replacing 1 hour/day of
With LPA With MVPA With LPA With MVPA With LPA With MVPA
SB 0.001
(-0.005, 0.007) 0.014**
(0.004, 0.024) -0.015
(-0.031, 0.001) 0.082***
(0.054, 0.11) 0.422
(-0.014, 0.857) 0.888*
(0.145, 1.631)
LPA 0.013*
(0.001, 0.025)
0.090*** (0.057, 0.122)
0.466
(-0.437, 1.370)
A) Single PA-parameter model. examining the association of each intensity category (SB, LPA, and MVPA) individually (one regression model for each
one) with the values of sarcopenia determinants. B) Partition model, displaying the association of a 1-hour increase in each activity, adjusted by time
engaged in the rest of activity categories, with the values of sarcopenia determinants. C) Isotemporal substitution model, considering a finite timeframe,
examining the effect replacing 1-hour engagement in each activity with 1 hour in a distinct intensity band on sarcopenia determinant values. All models
are adjusted by age, sex, the presence of comorbidities (Charlson Index) and Functional Ability (Katz and Lawton Indexes). *P<0.05. **P<0.01; ***P<0.001.
95% CI = 95% confidence interval; β = beta coefficient. SB = Sedentary Behaviour; LPA = Light Physical Activity; MVPA = Moderate-to-Vigorous Physical
Activity;
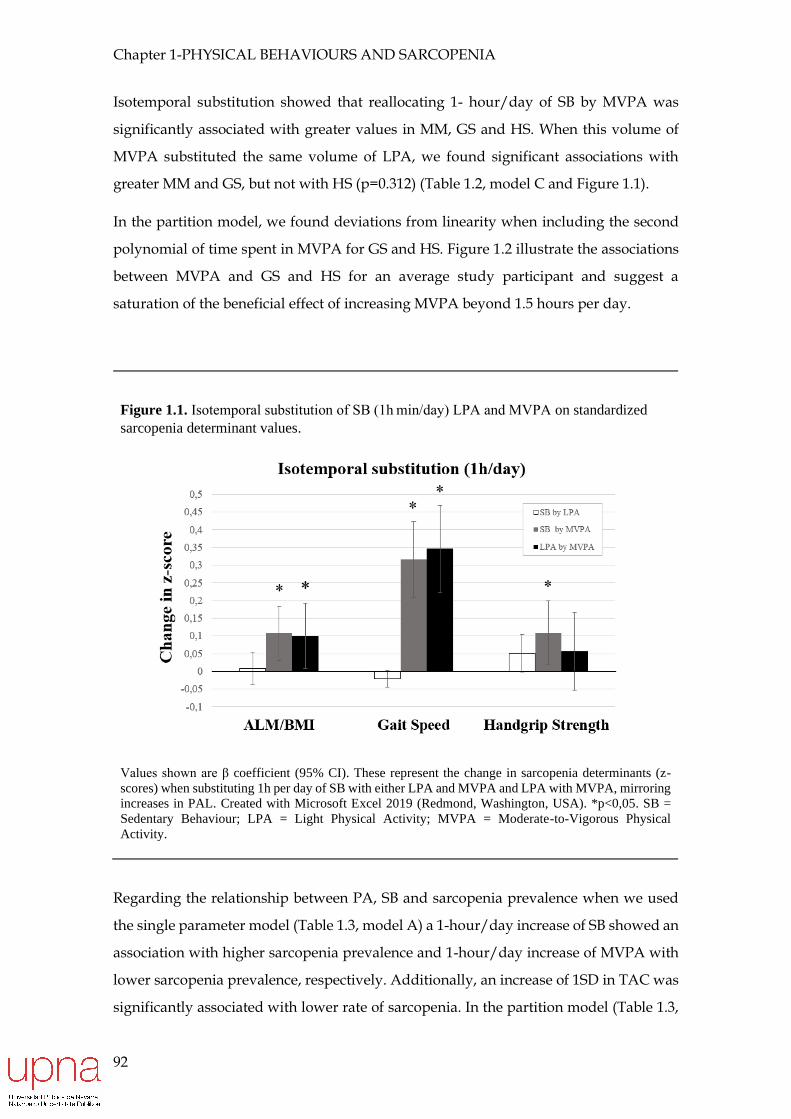
Chapter 1-PHYSICAL BEHAVIOURS AND SARCOPENIA
92
Isotemporal substitution showed that reallocating 1- hour/day of SB by MVPA was
significantly associated with greater values in MM, GS and HS. When this volume of
MVPA substituted the same volume of LPA, we found significant associations with
greater MM and GS, but not with HS (p=0.312) (Table 1.2, model C and Figure 1.1).
In the partition model, we found deviations from linearity when including the second
polynomial of time spent in MVPA for GS and HS. Figure 1.2 illustrate the associations
between MVPA and GS and HS for an average study participant and suggest a
saturation of the beneficial effect of increasing MVPA beyond 1.5 hours per day.
Figure 1.1. Isotemporal substitution of SB (1h min/day) LPA and MVPA on standardized
sarcopenia determinant values.
Values shown are β coefficient (95% CI). These represent the change in sarcopenia determinants (z-
scores) when substituting 1h per day of SB with either LPA and MVPA and LPA with MVPA, mirroring
increases in PAL. Created with Microsoft Excel 2019 (Redmond, Washington, USA). *p<0,05. SB =
Sedentary Behaviour; LPA = Light Physical Activity; MVPA = Moderate-to-Vigorous Physical
Activity.
Regarding the relationship between PA, SB and sarcopenia prevalence when we used
the single parameter model (Table 1.3, model A) a 1-hour/day increase of SB showed an
association with higher sarcopenia prevalence and 1-hour/day increase of MVPA with
lower sarcopenia prevalence, respectively. Additionally, an increase of 1SD in TAC was
significantly associated with lower rate of sarcopenia. In the partition model (Table 1.3,

Chapter 1-PHYSICAL BEHAVIOURS AND SARCOPENIA
93
model B), the inclusion of the time spent in other intensity categories suppressed the
association between SB and higher sarcopenia risk, whereas MVPA-sarcopenia rate
association remained significant (OR=0.555; 95% CI = 0.376, 0.799; p=0.002). In the
isotemporal substitution model, the reallocation of SB only yielded a significant lower
sarcopenia risk when it was substituted with MVPA (OR = 0.520; 95%CI = 0.361, 0.750;
p<0.001). Likewise, a significant risk reduction was observed when displacing LPA with
MVPA (OR = 0.557; 95% CI = 0.356, 0.871; p = 0.01). The effect of reducing SB at expenses
of increasing LPA on sarcopenia risk pointed into the expected direction but did not
reach statistical significance (OR=0.935; 95% CI = 0.766. 1.141; p=0.507).
Figure 1.2. Predicted values for gait speed (a) and handgrip strength (b) for an average male
participant obtained from fitting a natural cubic spline with 5 degrees of freedom.
Created with R 3.4.1 (R Core Team, Vienna, Austria). MVPA, moderate-to-vigorous physical activity.
As behavioral changes entailing a 1 hour-increments in MVPA are rather unattainable
in our population [24], we calculated the effects from the isotemporal substitution model
of shorter periods of time at different PA intensities, emulating more feasible
modifications in PAL patterns (Table 1.4).
a) b)

Chapter 1-PHYSICAL BEHAVIOURS AND SARCOPENIA
94
Table 1.3. Associations between time engaged in different PA intensity bands and sarcopenia prevalence
A) Single Parameter Model; OR (95% CI)
Each 1-hour increase
(independent of the rest of PA categories)
SB 1.206 (1.039, 1.404) *
LPA 0.872 (0.736, 1.030)
MVPA 0.522 (0.367, 0.726) ***
B) Partition Model; OR (95% CI)
Adding 1 hour of
SB 1.067 (0.879, 1.298)
LPA 0.998 (0.812, 1.224)
MVPA 0.555 (0.376, 0.799) **
C) Isotemporal Substitution Model; OR (95% CI)
With SB With LPA With MVPA
Replacing 1 hour of
SB 0.935 (0.766, 1.141) 0.520 (0.361, 0.750) ***
LPA 1.070 (0.876, 1.306) 0.557 (0.356, 0.871) *
MVPA 1.922 (1.333, 2.771) *** 1.797 (1.149, 2.811) *
A) Single PA-parameter model. examining the association of each intensity category (SB, LPA, and MVPA) individually (one regression model for each one) with the values of sarcopenia. B) Partition model, displaying the association of a 1-hour increase in each activity, adjusted by time engaged in the rest of activity categories, with the values of sarcopenia. C) Isotemporal substitution model, considering a finite timeframe, examining the effect replacing 1-hour engagement in each activity with 1 hour in a distinct intensity band on sarcopenia. All models are adjusted by age, sex, the presence of comorbidities (Charlson Index) and Functional Ability (Katz and Lawton Indexes). *P<0.05. **P<0.01; ***P<0.001. 95% CI = 95% confidence interval; OR=odds ratio. SB=Sedentary Behaviour; LPA=Light Physical Activity; MVPA=Moderate-to-Vigorous Physical Activity;

Chapter 1-PHYSICAL BEHAVIOURS AND SARCOPENIA
95
Discussion
This analysis of data from a community-based cohort of older people revealed that more
time engaged in PA is congruently positively associated with better performance of
sarcopenia-related measures (MM, GS and HS) and with a lower prevalence of
sarcopenia, independent of the analytic method and adjustment for age, sex, the
presence of comorbidities and the functional ability. Being engaged in MVPA accounts
for the major part of this benefit, while engagement in LPA only shows a marginal effect
on some of the components related to sarcopenia, without any significant effect on the
sarcopenia prevalence.
These observations suggest the presence of an intensity threshold under which little
benefit is obtained. In this regard, it must be underscored that even little increases in the
levels of MVPA could be enough to significantly reduce the prevalence of sarcopenia,
either replacing SB or LPA. Although our main analysis is focused in the substitution of
1-hour MVPA, of note is the reduction in sarcopenia prevalence associated with only a
15-minute/day increase in MVPA at expenses of reducing either SB or LPA (15% and
Table 1.4. OR of the isotemporal substitution of different volumes of SB and LPA with MVPA.
With MVPA
Replacing 15 min/day of
SB 0.85 (0.78, 0.93)
LPA 0.86 (0.77, 0.97)
Replacing 30 min/day of
SB 0.72 (0.60, 0.87)
LPA 0.75 (0.60, 0.93)
Replacing 45 min/day of
SB 0.61 (0.47, 0.81)
LPA 0.64 (0.46, 0.90)
Replacing 1 hour/day of
SB 0.52 (0.36, 0.75)
LPA 0.56 (0.36, 0.87)
All models are adjusted by age, sex, the presence of comorbidities (Charlson Index) and Functional Ability (Katz and Lawton Indexes). *P<0.05. **P<0.01; ***P<0.001. 95% CI = 95% confidence interval; OR=odds ratio. SB=Sedentary Behaviour; LPA=Light Physical Activity; MVPA=Moderate-to-Vigorous Physical Activity;

Chapter 1-PHYSICAL BEHAVIOURS AND SARCOPENIA
96
14%, respectively) (Table 4). This suggests that even little changes in PA patterns,
embracing intensity and volume, might have positive effects on sarcopenia. Focusing on
sarcopenia determinants, it appears to be that higher PA engagement improves
performance across all sarcopenia determinants.
In accordance with our results, previous literature supports the positive association of
greater PA levels and MM at old ages [23,25–29], but there have been some contradictory
findings in this regard [30–32]. With respect to the relationship between PA and
performance measures (GS and HS), existing evidence points towards a positive effect
of greater levels of PA on performance and maintenance of physical function
[26,30,33,34]. Our study reinforces these observations. Of note is the trajectory of the
association between the amount of PA and HS and GS with increasing MVPA,
displaying a probable ceiling effect with values greater than 1,5 hours/day of MVPA
eliciting modest improvements in HS and GS (Figures 1 and 2). The partition model
showed an absence of association between MVPA and HG in our sample. This might be
due to the activity registered by the accelerometer (mainly ambulation) having little
effect on upper limbs strength. In this sense, it could be interesting to study the
relationship between accelerometer-derived PA and lower limb strength. Although SB
was not significantly associated with any sarcopenia determinants, the direction of the
effect was in the expected direction of SB in producing worse performance across all of
them (MM [35], HS [23,30], and GS [25]).
Our results support the accumulating evidence of an inverse association between PA
and sarcopenia prevalence, reinforcing the unique role of MVPA on sarcopenia
reduction. LPA seems to be insufficient to reduce sarcopenia rates. Mijnarends et al. [26]
and Tyrovolas et al. [31] showed a protective effect of greater accumulation of self-
reported PA on sarcopenia. In contrast, in the study by Hai et al. in community-dwelling
Chinese people aged 60 years and older (mean age 68 years old) no association was
found using questionnaires-based PA assessment [36].
Controversy might be caused by differential PA assessment tools and sarcopenia
definitions. In fact, the three studies previously cited used self-reported activity,
showing striking differences both in the amount and intensity of PA and their
association to sarcopenia. They also used different sarcopenia definitions (European
Working Group on Sarcopenia in Older People definition, a body weight-adjusted ASM
of -2SD with respect to a healthy-young cohort in body weight-adjusted ASM, Asian
Chapter 1-PHYSICAL BEHAVIOURS AND SARCOPENIA
97
Working Group for Sarcopenia criteria). But even if a definition of sarcopenia can be
agreed up, different sarcopenia assessment tools for MM (DEXA, BIA analysis,
anthropometry-based measures), strength (HS, lower extremity strength) and gait
performance (GS, up and go test), and the absence of population-specific cut-points may
lead to discrepancies in the conclusions. Importantly, it should be recognized that the
sarcopenia criteria employed may arguably condition the associations. Recent research
suggests the need for MM, GS and HS cut-points harmonization following the
characteristics of the population [37–39].
The role of LPA for MM and function preservation remains controversial. Some previous
work has showed an association between light activity (assessed objectively) and HS in
men but not women [33]. The link between LPA and HS might be explained by the effects
of myokines released by the muscle after muscle contraction [40,41], among other
potential explanations [42]. In our study, such LPA-HS association was only significant
in the single parameter approach and faded both in the partition and isotemporal
substitution models.
Parameters such as mode, intensity, duration and volume of and the type of muscle
contraction (i.e. aerobic, resistance, concentric, eccentric…) determine the induced
homeostasis disruption PA generates, and consequently the adaptations obtained
through muscle activation. Aerobic and resistance exercise represent extremes on a
continuum and elicit markedly different metabolic and structural responses. Whereas
aerobic PA (i.e. low-intensity repetitive contractions) mainly induces adaptations that
lead to improved oxygen uptake, transportation and utilization, resistance exercise (i.e.
low frequency, high resistance demand) is believed to play a role in proteostasis and
neuromuscular function [43]. The beneficial effect of high intensity, explosive resistance
training on muscle mass and output, and physical function, maintenance at older ages
is clear [44–46]. The LPA captured in our study might be classified as aerobic, having
little effect on these outcomes. Conversely, we suggest that activities classified as MVPA
(energy expenditure ≥ 3 MET) according to the Compendium of Physical Activities by
Ainsworth and colleagues [47] and correcting MET values to the mean age of our
populations [48], constitute a sufficient stimulus to trigger responses that stimulates
MM, strength and physical function. Walking for pleasure (4.375 MET), Tai Chi (5 MET)
and recreational swimming (6 MET) are among that type of activities.

Chapter 1-PHYSICAL BEHAVIOURS AND SARCOPENIA
98
Considering sarcopenia as one of the biologic substrates of frailty, our group showed
similar results when exploring the associations between PA, SB and frailty status in the
same cohort [49].
Strengths and limitations
The present study has several strengths. Consequently, objective measures are assumed
to solve limitations of self-reported estimation. However, there are important issues to
consider when classifying PA behaviors through accelerometry. As stated in the
methods section, Actigraph monitors typically categorize activities intensity classifying
each valid wearing-time minute into one of the classical intensity bands using count-
based (CPM) thresholds, usually those defined in calibration studies among healthy
young cohorts [9,52]. With a lower RMR, the relative energy expenditure (MET value)
associated with these CPM thresholds, would be greater in older adults in relation to
younger counterparts. For instance, the LPA-MVPA transition (3 METs) in a young
person (= 10.5 ml O2. Kg-1 . Min-1 , assuming a RMR of 3.5 ml O2. Kg-1 . Min-1 ) would
imply an exertion of 3.75 METs in an older adult (with a RMR = 2.8 ml O2. Kg-1 ) [53,54].
Despite this limitation, most previous studies objectively measuring PA and SB patterns
considered thresholds validated in healthy young adults, systematically assuming
similar energy costs across different age-groups. In an attempt to solve these problems,
Koster et al., calculated a threshold for the SB-LPA transition against a measure deemed
a gold-standard (ActivPAL accelerometers) among elders. Additionally, they
demonstrated an overestimation of time spent in SB by almost 2 hours per day among
older adults when using the classical cut-points in the The Aging Research Evaluating
Accelerometry (AREA) study [10]. Similarly, Barnett et al., determined an age-specific
LPA-MVPA transition threshold in a population of older adults (mean age 70.2), in a
calibration study against indirect calorimetry [20]. The use of these age-specific
thresholds in our study, partially overcomes the previously described shortcomings.
Nevertheless, and very importantly, we acknowledge there could still be bias because of
variability in several factors that might influence energy cost, such as sex, fitness, body
weight, disability, movement impairment and illnesses [55]. In addition, subjects in our
study wore a triaxial accelerometer (ActiTrainer). Triaxial accelerometer data capture
motions in all three axes resulting from more complex movements [56,57] and has shown

Chapter 1-PHYSICAL BEHAVIOURS AND SARCOPENIA
99
better performance in terms of intensity prediction in laboratory-based validation
studies in relation to uniaxial accelerometry [55].
Second, as the time in a day in which a person can partake in PA is finite, engaging in
one intensity category inevitably means reducing the time engaged in another. The
benefits of different PA intensities depend not only on the specific PA intensity but also
on the type of intensity it displaces. This fact has been systematically overlooked in
previous research using different statistical models. For example, the single PA-
parameter model separately examines the associations between an amount of time in
each intensity category and its effect on a dependent variable, disregarding the amounts
of time spent in other intensities. The partition model accounts for the role of the amount
of time in distinct intensity categories but analyses the effect of adding time in the
intended PA intensity category to the actual distribution of time in all the intensity
bands, instead of accounting for the limited time available. Thus, it is not a realistic
approach. Conversely, the use isotemporal substitution might mirror feasible changes in
PA patterns by accounting for the finiteness of the time in which a subject can engage in
different-intensity activities in a given period and captures disparate effects of lifestyle
changes in one dominion that affects other behaviors [15]. This fact reinforces the
external validity of our observations and its suitability for formulating public health
recommendations.
Finally, in contrast to the majority of the studies published to date assessing the
relationships between PA and sarcopenia, we have used DEXA scans to assess MM, a
more reliable and accurate method than the estimations of MM derived from
anthropometric measures or bioelectrical impedance analysis [58] Moreover, we used an
internationally recognized sarcopenia definition based on MM, HS and GS (FNIH
criteria).
Nevertheless, our work presents some limitations. The cross-sectional nature of this
study hampers exploration of directionality between PA and SB and sarcopenia and its
determinants and reverse causality could not be ascertained: Although we hypothesized
that higher PA and lower SB would lead to lower sarcopenia prevalence; lower MM, HS,
and GS might also diminish PA and increase SB. In addition, although ActiGraph
accelerometers can accurately estimate PA derived from walking, the most popular
activity among older people [14], they are unable to capture non-ambulatory PA like
resistance training swimming or cycling; activities that have shown a strong association

Chapter 1-PHYSICAL BEHAVIOURS AND SARCOPENIA
100
with muscle mass and function [59,60]. In any case, this kind of activities are rather
unusual in our population. Furthermore, we could not capture vigorous intensity
(corresponding to energy expenditures over 6 METs) because of the absence of cut-
points for this the transition between moderate and vigorous PA intensity categories.
Notwithstanding, a very low proportion of older adults regularly reaches vigorous
intensities.
Current PA-recommendations suggest a minimum MVPA bout-duration of 10 minutes
to gain health benefits [61], but acknowledge the inconclusively nature of previous
evidence [62] and the possibility that shorter periods might be valid in sedentary
individuals, as those in our cohort [63]. Taking this into account, in our analysis the SB,
LPA and MVPA variables were computed summing all the minutes within each
category, irrespective of the duration of the bout in which they were contained. Hence,
we could not evaluate how differences in PA-bout length contribute to overall PA effect
on sarcopenia and its determinants. Considering our observations (as few as 15-
miutes/day of MVPA is good enough to produce some benefit on sarcopenia), this
finding does not look to support the need of bouts of a minimum of 10 minutes to get
benefits in terms of MM and muscle function.
Finally, we recognize that although isotemporal substitution might be a more realistic
approach, it is not more than a mathematical method for replacing time in one intensity
with another and in no case could substitute experimental evidence. Research is
guaranteed to explore the potential effects of reducing SB and increasing LPA and
MVPA on MM and function through properly designed randomized clinical trials.
To our knowledge, this is the first study in exploring the associations of sarcopenia and
objectively estimated PA classified using age-specific thresholds. In addition, we
explored the associations through different analytic methods, among which the
isotemporal substitution, that yields more directly interpretable and meaningful results
to public health evidence. In conclusion, our findings, stemming from a study with an
accurate assessment of both PA and the presence of sarcopenia, strongly support the
hypothesis of the association between higher PA levels, in the form of increments in
MVPA and SB reduction, lower sarcopenia rates and better performance across
sarcopenia determinants in older people. LPA appears to have marginal effects on
sarcopenia determinants and but any on the risk since the substitution of SB by LPA is
not significantly associated.

Chapter 1-PHYSICAL BEHAVIOURS AND SARCOPENIA
101
Considering the growing older population in Western countries and the functional and
economic burden of sarcopenia [64], improving insight into its aetiology, contributing
factors and possible interventions should be a priority for researchers. Appropriately
designed longitudinal studies assessing the causal relationships and which of the
components of the PA are involved in that association with sarcopenia are needed to
design targeted interventions in the older population at risk or suffering sarcopenia.

Chapter 1-PHYSICAL BEHAVIOURS AND SARCOPENIA
102
Conflict of interest
The authors declare that they have no conflict of interest.
Ethical issues
The study protocol was approved by the Clinical Research Ethics Committee of the
Toledo Hospital, Spain. This work was performed according to the ethical standards laid
down in the 1964 Declaration of Helsinki and later amendments. Participants signed
informed consent forms prior to their inclusion in the cohort. The authors certify that
they comply with the ethical guidelines for authorship and publishing of the Journal of
Cachexia, Sarcopenia and Muscle [65].
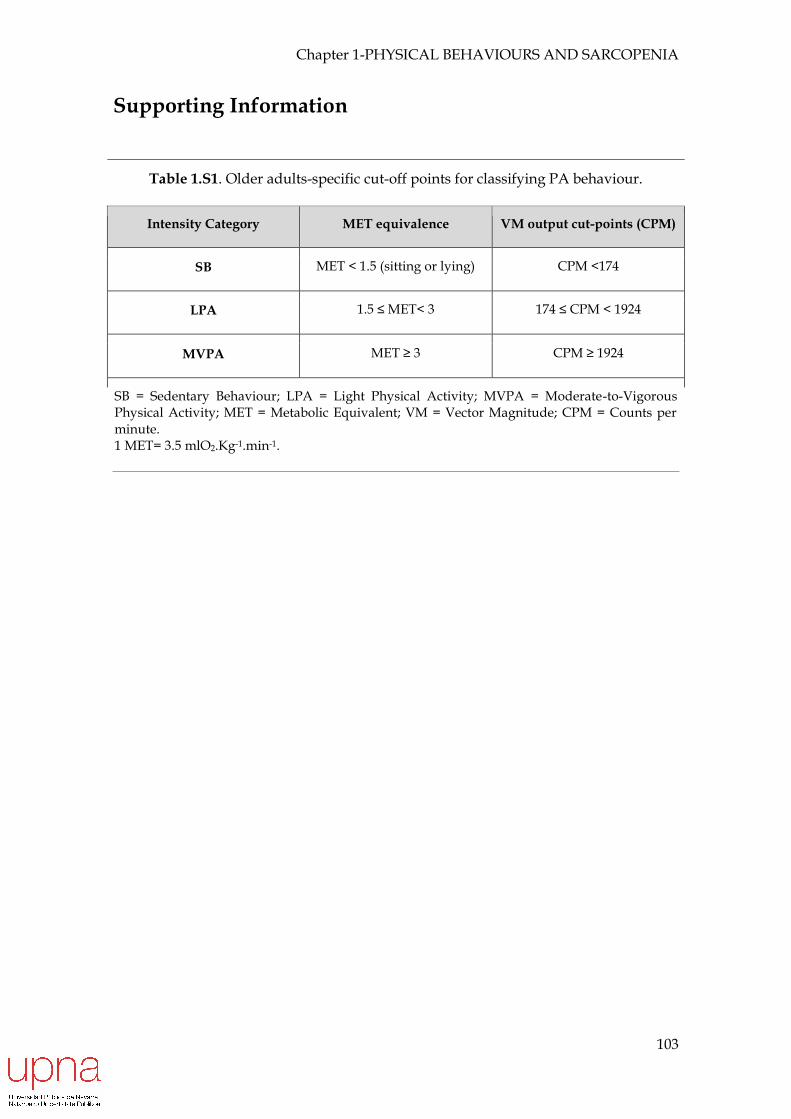
Chapter 1-PHYSICAL BEHAVIOURS AND SARCOPENIA
103
Supporting Information
Table 1.S1. Older adults-specific cut-off points for classifying PA behaviour.
Intensity Category MET equivalence VM output cut-points (CPM)
SB MET < 1.5 (sitting or lying) CPM <174
LPA 1.5 ≤ MET< 3 174 ≤ CPM < 1924
MVPA MET ≥ 3 CPM ≥ 1924
SB = Sedentary Behaviour; LPA = Light Physical Activity; MVPA = Moderate-to-Vigorous Physical Activity; MET = Metabolic Equivalent; VM = Vector Magnitude; CPM = Counts per minute. 1 MET= 3.5 mlO2.Kg-1.min-1.

Chapter 1-PHYSICAL BEHAVIOURS AND SARCOPENIA
104
References
[1] Fielding RA, Vellas B, Evans WJ, et al. Sarcopenia: an undiagnosed condition in older adults. Current consensus definition: prevalence, etiology, and consequences. International working group on sarcopenia. J Am Med Dir Assoc 2011; 12: 249–256.
[2] Cesari M, Landi F, Vellas B, et al. Sarcopenia and physical frailty: two sides of the same coin. Front Aging Neurosci 2014; 6: 192.
[3] Martone AM, Marzetti E, Calvani R, et al. Exercise and Protein Intake: A Synergistic Approach against Sarcopenia. Biomed Res Int 2017; 2017: 2672435.
[4] Fiatarone MA, O’Neill EF, Ryan ND, et al. Exercise training and nutritional supplementation for physical frailty in very elderly people. N Engl J Med 1994; 330: 1769–1775.
[5] Montero-Fernández N, Serra-Rexach JA. Role of exercise on sarcopenia in the elderly. Eur J Phys Rehabil Med 2013; 49: 131–143.
[6] Sallis JF, Saelens BE. Assessment of physical activity by self-report: status, limitations, and future directions. Res Q Exerc Sport 2000; 71: S1-14.
[7] Atkin AJ, Gorely T, Clemes SA, et al. Methods of Measurement in epidemiology: sedentary Behaviour. Int J Epidemiol 2012; 41: 1460–1471.
[8] Loyen A, Clarke-Cornwell AM, Anderssen SA, et al. Sedentary Time and Physical Activity Surveillance Through Accelerometer Pooling in Four European Countries. Sports Med. Epub ahead of print 10 December 2016. DOI: 10.1007/s40279-016-0658-y.
[9] Freedson PS, Melanson E, Sirard J. Calibration of the Computer Science and Applications, Inc. accelerometer. Med Sci Sports Exerc 1998; 30: 777–781.
[10] Koster A, Shiroma EJ, Caserotti P, et al. Comparison of Sedentary Estimates between activPAL and Hip- and Wrist-Worn ActiGraph. Med Sci Sports Exerc 2016; 48: 1514–1522.
[11] Hall KS, Howe CA, Rana SR, et al. METs and accelerometry of walking in older adults: standard versus measured energy cost. Med Sci Sports Exerc 2013; 45: 574–582.
[12] Aspvik NP, Viken H, Zisko N, et al. Are Older Adults Physically Active Enough - A Matter of Assessment Method? The Generation 100 Study. PLoS ONE 2016; 11: e0167012.
[13] Jefferis BJ, Sartini C, Lee I-M, et al. Adherence to physical activity guidelines in older adults, using objectively measured physical activity in a population-based study. BMC Public Health 2014; 14: 382.
[14] Copeland JL, Esliger DW. Accelerometer assessment of physical activity in active, healthy older adults. J Aging Phys Act 2009; 17: 17–30.

Chapter 1-PHYSICAL BEHAVIOURS AND SARCOPENIA
105
[15] Mekary RA, Willett WC, Hu FB, et al. Isotemporal substitution paradigm for physical activity epidemiology and weight change. Am J Epidemiol 2009; 170: 519–527.
[16] Trost SG, O’Neil M. Clinical use of objective measures of physical activity. Br J Sports Med 2014; 48: 178–181.
[17] Garcia-Garcia FJ, Gutierrez Avila G, Alfaro-Acha A, et al. The prevalence of frailty syndrome in an older population from Spain. The Toledo Study for Healthy Aging. J Nutr Health Aging 2011; 15: 852–856.
[18] McLean RR, Shardell MD, Alley DE, et al. Criteria for clinically relevant weakness and low lean mass and their longitudinal association with incident mobility impairment and mortality: the foundation for the National Institutes of Health (FNIH) sarcopenia project. J Gerontol A Biol Sci Med Sci 2014; 69: 576–583.
[19] Matthews CE, Hagströmer M, Pober DM, et al. Best practices for using physical activity monitors in population-based research. Med Sci Sports Exerc 2012; 44: S68-76.
[20] Barnett A, van den Hoek D, Barnett D, et al. Measuring moderate-intensity walking in older adults using the ActiGraph accelerometer. BMC Geriatr 2016; 16: 211.
[21] Colley R, Connor Gorber S, Tremblay MS. Quality control and data reduction procedures for accelerometry-derived measures of physical activity. Health Rep 2010; 21: 63–69.
[22] Charlson M, Szatrowski TP, Peterson J, et al. Validation of a combined comorbidity index. J Clin Epidemiol 1994; 47: 1245–1251.
[23] Foong YC, Chherawala N, Aitken D, et al. Accelerometer-determined physical activity, muscle mass, and leg strength in community-dwelling older adults. J Cachexia Sarcopenia Muscle 2016; 7: 275–283.
[24] Hallal PC, Andersen LB, Bull FC, et al. Global physical activity levels: surveillance progress, pitfalls, and prospects. Lancet 2012; 380: 247–257.
[25] Ryu M, Jo J, Lee Y, et al. Association of physical activity with sarcopenia and sarcopenic obesity in community-dwelling older adults: the Fourth Korea National Health and Nutrition Examination Survey. Age Ageing 2013; 42: 734–740.
[26] Mijnarends DM, Koster A, Schols JMGA, et al. Physical activity and incidence of sarcopenia: the population-based AGES-Reykjavik Study. Age Ageing 2016; 45: 614–620.
[27] Park H, Park S, Shephard RJ, et al. Yearlong physical activity and sarcopenia in older adults: the Nakanojo Study. Eur J Appl Physiol 2010; 109: 953–961.
[28] Raguso CA, Kyle U, Kossovsky MP, et al. A 3-year longitudinal study on body composition changes in the elderly: role of physical exercise. Clin Nutr 2006; 25: 573–580.
Chapter 1-PHYSICAL BEHAVIOURS AND SARCOPENIA
106
[29] Kim G-S, Im E, Rhee J-H. Association of physical activity on body composition, cardiometabolic risk factors, and prevalence of cardiovascular disease in the Korean population (from the fifth Korea national health and nutrition examination survey, 2008-2011). BMC Public Health 2017; 17: 275.
[30] Aggio DA, Sartini C, Papacosta O, et al. Cross-sectional associations of objectively measured physical activity and sedentary time with sarcopenia and sarcopenic obesity in older men. Prev Med 2016; 91: 264–272.
[31] Tyrovolas S, Koyanagi A, Olaya B, et al. Factors associated with skeletal muscle mass, sarcopenia, and sarcopenic obesity in older adults: a multi-continent study. J Cachexia Sarcopenia Muscle 2016; 7: 312–321.
[32] Volpato S, Bianchi L, Cherubini A, et al. Prevalence and clinical correlates of sarcopenia in community-dwelling older people: application of the EWGSOP definition and diagnostic algorithm. J Gerontol A Biol Sci Med Sci 2014; 69: 438–446.
[33] Bann D, Hire D, Manini T, et al. Light Intensity physical activity and sedentary behavior in relation to body mass index and grip strength in older adults: cross-sectional findings from the Lifestyle Interventions and Independence for Elders (LIFE) study. PLoS ONE 2015; 10: e0116058.
[34] Dodds R, Kuh D, Aihie Sayer A, et al. Physical activity levels across adult life and grip strength in early old age: updating findings from a British birth cohort. Age Ageing 2013; 42: 794–798.
[35] Gianoudis J, Bailey CA, Daly RM. Associations between sedentary behaviour and body composition, muscle function and sarcopenia in community-dwelling older adults. Osteoporos Int 2015; 26: 571–579.
[36] Hai S, Cao L, Wang H, et al. Association between sarcopenia and nutritional status and physical activity among community-dwelling Chinese adults aged 60 years and older. Geriatr Gerontol Int. Epub ahead of print 11 February 2017. DOI: 10.1111/ggi.13001.
[37] Alonso Bouzón C, Carnicero JA, Turín JG, et al. The Standardization of Frailty Phenotype Criteria Improves Its Predictive Ability: The Toledo Study for Healthy Aging. J Am Med Dir Assoc 2017; 18: 402–408.
[38] Lourenço RA, Pérez-Zepeda M, Gutiérrez-Robledo L, et al. Performance of the European Working Group on Sarcopenia in Older People algorithm in screening older adults for muscle mass assessment. Age Ageing 2015; 44: 334–338.
[39] Davies B, García F, Ara I, et al. Relationship Between Sarcopenia and Frailty in the Toledo Study of Healthy Aging: A Population Based Cross-Sectional Study. J Am Med Dir Assoc. Epub ahead of print 24 October 2017. DOI: 10.1016/j.jamda.2017.09.014.
[40] Donnelly JE, Honas JJ, Smith BK, et al. Aerobic exercise alone results in clinically significant weight loss for men and women: midwest exercise trial 2. Obesity (Silver Spring) 2013; 21: E219-228.

Chapter 1-PHYSICAL BEHAVIOURS AND SARCOPENIA
107
[41] Crane JD, Macneil LG, Tarnopolsky MA. Long-term aerobic exercise is associated with greater muscle strength throughout the life span. J Gerontol A Biol Sci Med Sci 2013; 68: 631–638.
[42] Cooper R, Mishra GD, Kuh D. Physical activity across adulthood and physical performance in midlife: findings from a British birth cohort. Am J Prev Med 2011; 41: 376–384.
[43] Egan B, Zierath JR. Exercise metabolism and the molecular regulation of skeletal muscle adaptation. Cell Metab 2013; 17: 162–184.
[44] Cadore EL, Casas-Herrero A, Zambom-Ferraresi F, et al. Multicomponent exercises including muscle power training enhance muscle mass, power output, and functional outcomes in institutionalized frail nonagenarians. Age (Dordr) 2014; 36: 773–785.
[45] Cadore EL, Izquierdo M. Muscle Power Training: A Hallmark for Muscle Function Retaining in Frail Clinical Setting. J Am Med Dir Assoc 2018; 19: 190–192.
[46] Lopez P, Pinto RS, Radaelli R, et al. Benefits of resistance training in physically frail elderly: a systematic review. Aging Clin Exp Res. Epub ahead of print 29 November 2017. DOI: 10.1007/s40520-017-0863-z.
[47] Ainsworth BE, Haskell WL, Herrmann SD, et al. 2011 Compendium of Physical Activities: a second update of codes and MET values. Med Sci Sports Exerc 2011; 43: 1575–1581.
[48] Harris JA, Benedict FG. A Biometric Study of Human Basal Metabolism. Proc Natl Acad Sci USA 1918; 4: 370–373.
[49] Mañas A, Del Pozo-Cruz B, Guadalupe-Grau A, et al. Reallocating Accelerometer-Assessed Sedentary Time to Light or Moderate- to Vigorous-Intensity Physical Activity Reduces Frailty Levels in Older Adults: An Isotemporal Substitution Approach in the TSHA Study. J Am Med Dir Assoc 2018; 19: 185.e1-185.e6.
[50] Steene-Johannessen J, Anderssen SA, van der Ploeg HP, et al. Are Self-report Measures Able to Define Individuals as Physically Active or Inactive? Med Sci Sports Exerc 2016; 48: 235–244.
[51] Hekler EB, Buman MP, Haskell WL, et al. Reliability and validity of CHAMPS self-reported sedentary-to-vigorous intensity physical activity in older adults. J Phys Act Health 2012; 9: 225–236.
[52] Troiano RP, Berrigan D, Dodd KW, et al. Physical activity in the United States measured by accelerometer. Med Sci Sports Exerc 2008; 40: 181–188.
[53] Miller NE, Strath SJ, Swartz AM, et al. Estimating absolute and relative physical activity intensity across age via accelerometry in adults. J Aging Phys Act 2010; 18: 158–170.
Chapter 1-PHYSICAL BEHAVIOURS AND SARCOPENIA
108
[54] Kwan M, Woo J, Kwok T. The standard oxygen consumption value equivalent to one metabolic equivalent (3.5 ml/min/kg) is not appropriate for elderly people. Int J Food Sci Nutr 2004; 55: 179–182.
[55] Zisko N, Carlsen T, Salvesen Ø, et al. New relative intensity ambulatory accelerometer thresholds for elderly men and women: the Generation 100 study. BMC Geriatr 2015; 15: 97.
[56] Sun F, Norman IJ, While AE. Physical activity in older people: a systematic review. BMC Public Health 2013; 13: 449.
[57] Santos-Lozano A, Santín-Medeiros F, Cristi-Montero C, et al. GT1M, GT3X and ActiTrainer counts comparison during standardized activities in young, adults and older adults. Nutr Hosp 2016; 33: 280.
[58] Kim J, Wang Z, Heymsfield SB, et al. Total-body skeletal muscle mass: estimation by a new dual-energy X-ray absorptiometry method. Am J Clin Nutr 2002; 76: 378–383.
[59] Peterson MD, Sen A, Gordon PM. Influence of resistance exercise on lean body mass in aging adults: a meta-analysis. Med Sci Sports Exerc 2011; 43: 249–258.
[60] Van Abbema R, De Greef M, Crajé C, et al. What type, or combination of exercise can improve preferred gait speed in older adults? A meta-analysis. BMC Geriatr 2015; 15: 72.
[61] Garber CE, Blissmer B, Deschenes MR, et al. American College of Sports Medicine position stand. Quantity and quality of exercise for developing and maintaining cardiorespiratory, musculoskeletal, and neuromotor fitness in apparently healthy adults: guidance for prescribing exercise. Med Sci Sports Exerc 2011; 43: 1334–1359.
[62] Murphy MH, Blair SN, Murtagh EM. Accumulated versus continuous exercise for health benefit: a review of empirical studies. Sports Med 2009; 39: 29–43.
[63] Lee IM, Sesso HD, Paffenbarger RS. Physical activity and coronary heart disease risk in men: does the duration of exercise episodes predict risk? Circulation 2000; 102: 981–986.
[64] Janssen I, Shepard DS, Katzmarzyk PT, et al. The healthcare costs of sarcopenia in the United States. J Am Geriatr Soc 2004; 52: 80–85.
[65] von Haehling S, Morley JE, Coats AJS, et al. Ethical guidelines for publishing in the journal of cachexia, sarcopenia and muscle: update 2017. J Cachexia Sarcopenia Muscle 2017; 8: 1081–1083.

109
Chapter 2: Physical activity trajectories, mortality,
hospitalization and disability in the Toledo study of healthy aging
Published in the Journal of Cachexia, Sarcopenia and Muscle

Chapter 2-PHYSICAL ACTIVITY TRAJECTORIES AND ADVERSE EVENTS
110
Introduction
Lifelong physical activity (PA) promotes a wide range of health benefits and has long
been recognized as an important protective factor for chronic diseases [1–6]. These
beneficial effects consistently translate into lower mortality rates in both men and
women [7–12]
The salutary effects of PA might extend to late life, as it is known to delay the onset of
disability [13,14], and to increase lifespan [7,8,15,16]. Furthermore, PA might be
negatively associated with other adverse outcomes such as hospitalization, thereby
reducing healthcare expenditure [17,18]. Remarkably, at advanced ages, PA levels might
surpass other cardiovascular or sociodemographic risk factors that are classically
associated with adverse outcomes in younger cohorts [19,20].
The World Health Organization (WHO) defines “Healthy Aging” as the process of
developing and maintaining the functional ability that enables wellbeing in older age
[21]. Accordingly, PA is suggested to be an important contributor to healthy aging
through the maintenance and enhancement of intrinsic capacity – mental and especially
physical capacities [22]. A common methodological limitation in exploring the
association between PA and adverse outcomes in older populations is the use of a single
time-point assessment of PA (primarily the baseline PA levels) as the exposure variable
[23–29], which does not account for the dynamic nature of PA behaviors [30]. It is
plausible that prospective trajectories (patterns) of PA levels along time in late life may
influence adverse outcomes distinctly as compared with cross-sectional estimates
[31,32], a hypothesis that remains untested to our knowledge.
Some studies have recently addressed this shortcoming and used prospective PA level
evolution as the exposure variable. Most of these studies employed categorical analyses
with clinical or empirical cut-points for identifying groups with different PA progression
patterns [9,33–35].
Data-driven approaches such as Group-Based Trajectory Modelling (GBTM) have
emerged as an informative and interesting analytical method that allows grouping of
subjects presenting with similar baseline values and longitudinal patterns of change, in
terms of their direction and magnitude, along follow-up for a given variable within a
population [36,37]. Using this methodology, some studies have shown the existence of

Chapter 2-PHYSICAL ACTIVITY TRAJECTORIES AND ADVERSE EVENTS
111
different PA level trajectories in older adult cohorts [30,38], and one study explored their
associations with mortality in a sample of older men [39].
The main aim of this study is to investigate the existence of different PA trajectories
within the Toledo Study of Healthy Aging (TSHA) sample, a Spanish longitudinal
population-based study, and to evaluate their associations with adverse outcomes
(mortality, disability onset and worsening, and hospitalization). Our hypothesis is that
chronically active subjects and those maintaining PA over time will have a lower
likelihood of experiencing adverse outcomes compared with consistently inactive
subjects or those reducing PA levels during follow-up, and that increasing PA even at
older ages promotes healthy aging, as characterized by reduced mortality, disability
onset/worsening and hospitalization rates.
Methods
Study Design and Participants
Data were taken from the TSHA study, the details of which have been reported
elsewhere [40]. Briefly, this is a population-based prospective cohort study examining
the determinants and consequences of frailty in institutionalized and community-
dwelling individuals older than 65 years living in the province of Toledo (Spain). For the
present analysis, we used data from those subjects with non-missing PA scores from the
first (2006–2009) and second (2011–2013) TSHA waves, and available mortality and
hospitalization information at the censoring time and functional ability from the third
wave (2015–2017).
The Clinical Research Ethics Committee of Toledo Hospital, Spain, approved the study
protocol and participants signed an informed consent prior to their inclusion in the
study.
Measures
Physical Activity Scale for the Elderly
PA levels were estimated using the Physical Activity Scale for the Elderly (PASE). This
questionnaire was designed to assess PA in epidemiologic studies of older people over
a 1-week period. It ascertains the duration, intensity and frequency of several activities
and consists of 10 items that focus on three domains: leisure (5 components), household
(4), and work (1) activities. Participation in leisurely activities is recorded by frequency

Chapter 2-PHYSICAL ACTIVITY TRAJECTORIES AND ADVERSE EVENTS
112
(e.g., never, seldom, sometimes, and often) and duration (e.g., less than an hour, 2–4
hours, or >4 hours); paid or unpaid work is recorded by total hours of work per week;
and household activities and care for others are recorded with yes or no answers. Total
PASE score is calculated by multiplying activity participation (yes/no) or the amount of
time spent on each activity (hours/week) by empirically derived item weights, which
are summed [41]. In the present study, PASE was administered by interview, because
this modality has proven superior reliability than self-administration [42]. We used
PASE scores from wave 1 and wave 2 to construct the trajectories.
Mortality
Vital status was ascertained through the information provided by the Spanish National
Death Index (Ministry of Health and Social Services). Participants were followed-up to
death or June 2018, whichever came first. The average follow-up for mortality was 5.92
years (range 0.01–7.5 years).
Hospitalization
Hospitalization was ascertained by review of the Toledo Hospital Complex records and
was defined as the occurrence of a first admission to the hospital during follow-up, up
to December 2016. Median follow-up for hospitalization was 4.08 years (range 0.01–5.24
years).
Disability and worsening disability
The Katz Index was used to assess the functional ability in basic activities of daily living
(BADL) [43]. Incident disability was defined as the transition from a score of 6 to 5 or
less in the Katz Index at follow-up. Worsening disability at follow-up was defined as the
advent of a new difficulty in the Katz Index at follow-up in those participants with a
prevalent disability at baseline. Median follow-up for disability onset/worsening was
2.99 years (range 2–5.4 years).
Covariates
We selected covariates based on the literature and the biological plausibility for
confounding the main associations of interest. Age, sex, education (non-educated, non-
finished primary education, finished primary education/superior) and smoking status
(yes/past/never) were registered during study visits. Presence of comorbidities was
ascertained by self-report and by checking the medical history to compute the Charlson
Index score [44]. Body mass index (BMI) was computed using the standard formula

Chapter 2-PHYSICAL ACTIVITY TRAJECTORIES AND ADVERSE EVENTS
113
(body mass × height-2). Cognitive status was assessed by using the Mini-Mental State
Examination (MMSE) [45]. The number of prescription and non-prescription drugs
within the Anatomical Therapeutic Chemical Classification System taken by the
participant was calculated. Polypharmacy was defined as the intake of ≥5 drugs/day
[46]. All covariates were measured at wave 2 assessment.
Statistical Analysis
Descriptive analysis
All analyses were performed using the R statistical environment for Windows. Mean
(standard deviation) and frequency (percentage) are provided for continuous and
categorical variables, respectively. Descriptive variables were compared between
included and excluded subjects and between trajectories with an independent Student´s
t-test or analysis of variance for continuous variables, and the Chi-square test for
categorical variables.
Trajectory modelling
We used a GBTM approach to identify PA trajectories within our population. This type
of finite mixture model provides an empirical means of identifying clusters of
individuals defined by their developmental courses for a variable over time (trajectories)
within a population. Briefly, this method assumes that the general population is
composed of literally distinct subpopulations that are not identifiable based on
measured characteristics ex-ante. In GBTM, each group is conceptually thought of a
collection of individuals who follow approximately the same developmental trajectory,
where population variability is captured by differences across groups in the shape and
direction of their trajectories [37]. First, the best model among those with different
number of classes (trajectories) were identified by using Bayesian Information Criterion
(BIC). BIC is an index used in Bayesian statistics to choose between two or more
alternative models, given the data. In our study, two-times the change in the BIC
between model greater than 10 was used as indicative of better fit in order to compare
more complex – with a greater number of trajectories – versus more parsimonious – with
a lower number of trajectories – models [47]. Each subject was assigned to a trajectory
depending upon his individual values (baseline PASE score and progression patterns).
Secondly, average posterior probabilities of membership were computed for each group
to estimate the reliability of the classification. Individual posterior probability of

Chapter 2-PHYSICAL ACTIVITY TRAJECTORIES AND ADVERSE EVENTS
114
membership for a subject represents his probability of belonging to the group he is
assigned to by previous grouping based on his individual features. Trajectory average
posterior probability of membership represents its internal consistency, with higher
values indicating better classification quality [37]. We finally checked the number of
subjects within each trajectory to ensure adequate sample size for assessing the
subsequent risk of adverse outcomes.
Associations between PA trajectories and adverse events
Cox proportional hazards regression was used to investigate the associations between
the GBTM-derived PA trajectories and the adverse outcomes for which we had the date
of occurrence (mortality and hospitalization). Logistic regression analysis was used for
disability onset and disability worsening (that were registered during study visits).
Multivariate trajectory models were adjusted for age and sex (Model 1), plus Charlson
Index (Model 2), and additionally for baseline Katz Index, level of education,
polypharmacy, cognitive status (MMSE) and smoking status (Model 3).
Results
Baseline characteristics of the subjects within each trajectory are presented in Table 2.1.
1679 subjects (67.48% of TSHA whole sample; mean age = 74.26 ± 5.32; 41% men) had
data available for the purpose of this analysis. Not-included subjects were significantly
older, had lower scores for the MMSE, Charlson Index, and Katz Index (Supplementary
Table 1).
GBTM yielded 5 PA trajectories as the best model: 1) High PA-Consistent (n=566; 33.7%),
2) Moderate PA-Mildly Decreasing (n=392; 23.3%), 3) Low PA-Increasing (n=237; 14.1%),
4) Moderate PA-Consistent (n=191; 11.7%), 5) and Low PA-Decreasing (n=293, 17.5%)
(Figure 2.1). The mean posterior probability of membership, an index of quality
classification used in GBTM like ours, was 0.79 ± 0.65, indicating an acceptable
classification of the subjects within each PA trajectory.

Chapter 2-PHYSICAL ACTIVITY TRAJECTORIES AND ADVERSE EVENTS
115
Figure 2.1. PA Trajectories by age. N = 1679; PA groups based on self-reported PA via
PASE scores
HPAC= High Physical Activity-Consistent; MPAMD: Moderate Physical Activity-Mildly Decreasing; MPAC: Moderate Physical Activity-Consistent; LPAD: Low Physical Activity-Decreasing; LPAI: Low Physical Activity-Increasing; PASE: Physical Activity Scale for the
Elderly.

Chapter 2-PHYSICAL ACTIVITY TRAJECTORIES AND ADVERSE EVENTS
116
Table 2.1. Baseline Characteristics of the Sample
HPAC
n=566; 33.7% MPAD
n=392; 23.3 % LPAI
n=191; 11.7% MPAC
n=293, 17.5% LPAD
n=237; 14.1% Whole sample
n=1679
Between groups differences
(p-value)
Age, mean (SD) 72.37 (4.41) 73.76 (4.83) 74.94 (5.06) 72.42 (4.41) 78.9 (5.56) 74.94 (5.06) <0.001
Men, No. (%) 287 (50.71) 156 (39.79) 107 (56.02) 57 (19.45) 94 (39.66) 701 (41.74) <0.001
BMI, mean (SD), kg.m-2 28.9 (4.1) 29.3 (4.5) 30.1 (5.6) 29.5 (5.1) 29.9 (5.2) 29.4 (4.7) <0.05
Current smoker, No. (%) 181 (31.98) 109 (27.81) 77 (40.31)
45 (15.36)
60 (25.32)
472 (28.11)
<0.001
BADL disability, No. (%) 37 (6.54) 45 (11.48) 49 (26.06) 42 (14.33) 94 (39.66) 267 (15.9) <0.001
MMSE score, mean (SD) 25.47 (3.8) 24.02 (4.37) 22.56 (5.91) 23.5 (3.96) 20.34 (7.14) 23.8 (5.07) <0.001
Charlson Index, mean (SD) 0.82 (1.33) 1.02 (1.45) 1.37 (1.71) 1.02 (1.56) 1.45 (1.9) 1.05 (1.55) <0.001
Depression (GDS ≥ 5), No. (%)
48 (9.76) 45 (12.71) 47 (27.01) 52 (19.11) 59 (29.21) 251 (16.8) <0.001
PASE score, mean (SD) 115.61 (49.15) 80.65 (11.32) 21.53 (11.88) 53.27 (3.82) 28.74 (20.81) 73.6 (46.85) <0.001
∆ in PASE, mean (SD) -3.26 (18.24) -5.64 (7.22) 5.92 (6.27) 0.87 (5.97) -4.69 (3.74) -2.25 (12.24) <0.001
Data are presented as mean (SD) or No. (%). Significant differences between men and women group were analyzed by Student’s t-test or Chi2 test. HPAC: High PA-Consistent; MPAMD: Moderate PA-Mildly Decreasing; MPAC: Moderate PA-Consistent; LPAD: Low PA-Decreasing; LPAI: Low-PA Increasing; BMI: Body Mass Index; BADL: Basic Activities of Daily Living; MMSE: Mini-Mental State Examination; GDS: Geriatric Depression Scale; PASE: Physical Activity Scale for the Elderly. ∆: Change.

Chapter 2-PHYSICAL ACTIVITY TRAJECTORIES AND ADVERSE EVENTS
117
In the Cox regression model, subjects in Low PA-Decreasing trajectory group had a
higher mortality risk than peers in the reference group (High PA-Consistent) across all
models (hazard ratio [HR] = 1.68; 95% confidence interval [CI] = 1.21–2.31 in the fully-
adjusted model [model 3] ; Table 2.2, Figure 2.2).
Subjects in the Low PA-Increasing (HR = 1.24; 95%CI = 1.004–1.54, [model 3]) and Low
PA-Decreasing (HR = 1.25; 95%CI = 1.01–1.55, [model 3]) trajectory groups showed a
significant increase in the likelihood of hospitalization when compared to subjects in the
High PA-Consistent group, across all models (Table 2.2, Figure 2.2).
In the “raw” model, logistic regression analysis showed a greater risk of progressing into
incident disability across all the trajectories as compared with the reference High PA-
Consistent group. These associations weakened as covariates were included in the
models but remained significant for Low PA-Decreasing trajectory group (OR = 3.14;
95%CI = 1.59–6.19, model 3).
Low-PA Decreasing trajectory group showed significant increased risk of worsening
disability when compared with subjects classified into the High PA-Consistent group
(OR = 2.16; 95%CI = 1.35–3.45, model 3; Table 2.2, Figure 2.2).
We additionally sought to compare groups with similar baseline PA (similar starting
risk) but divergent PA trends along time (Low PA-Increasing vs. Low PA-Decreasing
trajectory groups). Subjects in the Low PA-Decreasing trajectory group were more likely
to be women (56 vs. 39%; p=0.001), older (78.9 vs. 74.4 years; p<0.0001), and to have
difficulties in one or more BADLs at baseline (39.7% vs. 25.6%; p=0.0032) (Data not
shown).
Taking the Low PA-Decreasing as the reference, subjects in the Low PA-Increasing
trajectory showed a significantly lower risk for disability onset (OR = 0.39; 95%CI = 0.19–
0.82; Figure 2.3) in the fully adjusted model. We failed to find differences between these
two trajectories in terms of mortality, hospitalization or worsening disability risks.
Sensitivity analyses excluding subjects with posterior probabilities <0.5 (n=65; 3.87% of
the sample) for the group they were classified into did not meaningfully change the
associations [30].
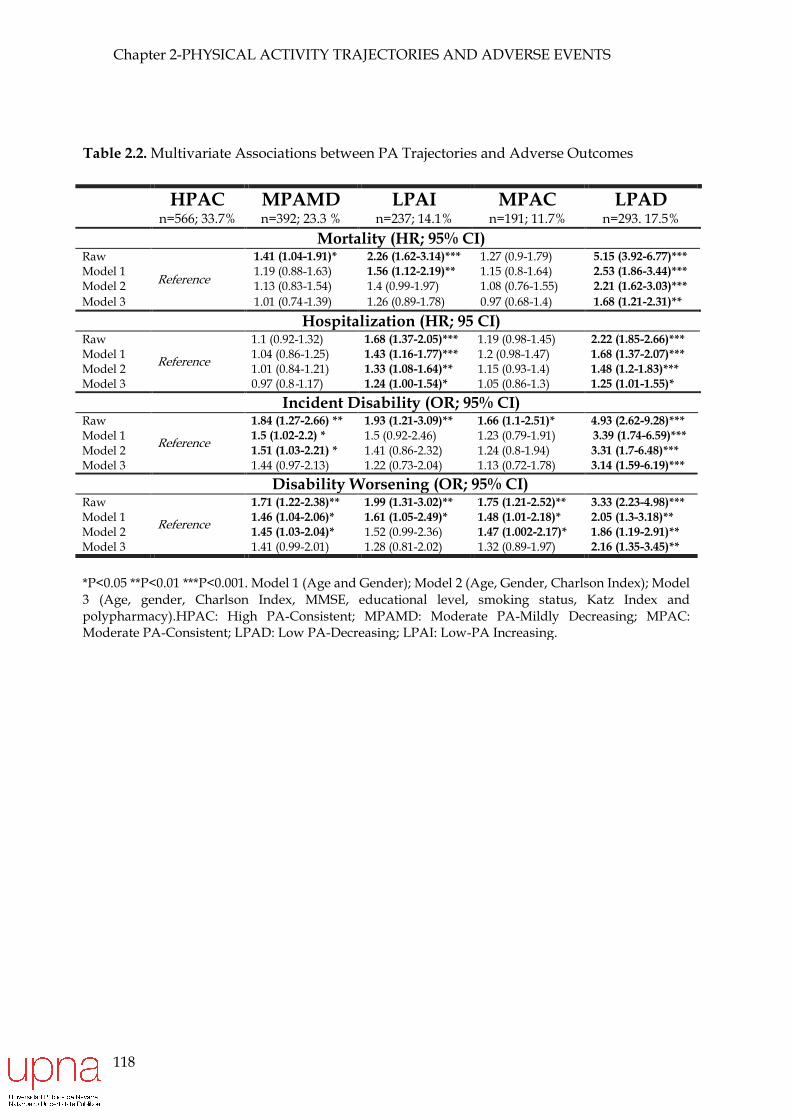
Chapter 2-PHYSICAL ACTIVITY TRAJECTORIES AND ADVERSE EVENTS
118
Table 2.2. Multivariate Associations between PA Trajectories and Adverse Outcomes
HPAC n=566; 33.7%
MPAMD n=392; 23.3 %
LPAI n=237; 14.1%
MPAC n=191; 11.7%
LPAD n=293. 17.5%
Mortality (HR; 95% CI)
Raw
Reference
1.41 (1.04-1.91)* 2.26 (1.62-3.14)*** 1.27 (0.9-1.79) 5.15 (3.92-6.77)***
Model 1 1.19 (0.88-1.63) 1.56 (1.12-2.19)** 1.15 (0.8-1.64) 2.53 (1.86-3.44)***
Model 2 1.13 (0.83-1.54) 1.4 (0.99-1.97) 1.08 (0.76-1.55) 2.21 (1.62-3.03)***
Model 3 1.01 (0.74-1.39) 1.26 (0.89-1.78) 0.97 (0.68-1.4) 1.68 (1.21-2.31)**
Hospitalization (HR; 95 CI)
Raw
Reference
1.1 (0.92-1.32) 1.68 (1.37-2.05)*** 1.19 (0.98-1.45) 2.22 (1.85-2.66)***
Model 1 1.04 (0.86-1.25) 1.43 (1.16-1.77)*** 1.2 (0.98-1.47) 1.68 (1.37-2.07)***
Model 2 1.01 (0.84-1.21) 1.33 (1.08-1.64)** 1.15 (0.93-1.4) 1.48 (1.2-1.83)***
Model 3 0.97 (0.8-1.17) 1.24 (1.00-1.54)* 1.05 (0.86-1.3) 1.25 (1.01-1.55)*
Incident Disability (OR; 95% CI)
Raw
Reference
1.84 (1.27-2.66) ** 1.93 (1.21-3.09)** 1.66 (1.1-2.51)* 4.93 (2.62-9.28)***
Model 1 1.5 (1.02-2.2) * 1.5 (0.92-2.46) 1.23 (0.79-1.91) 3.39 (1.74-6.59)***
Model 2 1.51 (1.03-2.21) * 1.41 (0.86-2.32) 1.24 (0.8-1.94) 3.31 (1.7-6.48)***
Model 3 1.44 (0.97-2.13) 1.22 (0.73-2.04) 1.13 (0.72-1.78) 3.14 (1.59-6.19)***
Disability Worsening (OR; 95% CI)
Raw
Reference
1.71 (1.22-2.38)** 1.99 (1.31-3.02)** 1.75 (1.21-2.52)** 3.33 (2.23-4.98)***
Model 1 1.46 (1.04-2.06)* 1.61 (1.05-2.49)* 1.48 (1.01-2.18)* 2.05 (1.3-3.18)**
Model 2 1.45 (1.03-2.04)* 1.52 (0.99-2.36) 1.47 (1.002-2.17)* 1.86 (1.19-2.91)**
Model 3 1.41 (0.99-2.01) 1.28 (0.81-2.02) 1.32 (0.89-1.97) 2.16 (1.35-3.45)**
*P<0.05 **P<0.01 ***P<0.001. Model 1 (Age and Gender); Model 2 (Age, Gender, Charlson Index); Model 3 (Age, gender, Charlson Index, MMSE, educational level, smoking status, Katz Index and polypharmacy).HPAC: High PA-Consistent; MPAMD: Moderate PA-Mildly Decreasing; MPAC: Moderate PA-Consistent; LPAD: Low PA-Decreasing; LPAI: Low-PA Increasing.

Chapter 2-PHYSICAL ACTIVITY TRAJECTORIES AND ADVERSE EVENTS
119
Figure 2.2. Forest plots of the risk of the different adverse outcomes in the different PA
trajectory groups
HPAC= High Physical Activity-Consistent; MPAMD: Moderate Physical Activity-Mildly Decreasing;
MPAC: Moderate Physical Activity-Consistent; LPAD: Low Physical Activity-Decreasing; LPAI: Low
Physical Activity-Increasing; OR=Odds Ratio; HR: Hazard Ratio; 95% CI: 95% Confidence Interval.
Figure 2.3. Forests plot of the differences in the risk of adverse outcomes between Low Physical Activity-Increasing and Low Physical Activity Decreasing trajectory groups.
LPAD: Low Physical Activity-Decreasing; LPAI: Low Physical Activity-Increasing; OR=Odds Ratio; HR: Hazard Ratio; 95% CI: 95% Confidence Interval
Chapter 2-PHYSICAL ACTIVITY TRAJECTORIES AND ADVERSE EVENTS
120
Discussion
The present study aimed at identifying PA trajectories in the TSHA and exploring their
association with adverse outcomes. Overall, our study shows that in this large
representative cohort of older adults, prospectively maintaining higher baseline PA
levels at older ages is associated with a lower risk of relevant adverse outcomes
(mortality, disability onset and worsening, and hospitalization), independently of
important confounding factors. Subjects showing higher PA levels at baseline and
sustaining them along time (High PA-Consistent trajectory) had lower odds of all
adverse outcomes compared with those presenting with low baseline PA levels and an
important decline along time (Low PA-Decreasing trajectory), and lower risk for
hospitalization than those with a low initial PASE score even when PA increased over
time (Low PA-Increasing trajectory). These findings support the need to promote
effective intervention strategies aiming to maintain or increase PA among older adults,
as a key factor for healthy aging.
We identified five longitudinal trajectories within our population. Of these, four showed
a prospective reduction in PA at old age, which agrees with previous observations of a
majority of older adults reducing PA along time [48]. Of special note is the presence of
one PA-increasing trajectory (Low PA-Increasing), suggesting the existence of
qualitatively distinct trajectories in our population of interest, as previously described in
other works [49–54], and extending the findings of classical studies describing
heterogeneous patterns of free-living PA at older ages [55].
Regarding the GBTM algorithm classification quality, the identified trajectory groups
showed mean posterior probabilities of membership that were close to 0.8. As values of
0.7–0.8 are deemed indicative of an aggrupation that sufficiently discriminates between
individuals with dissimilar patterns of change in a behaviour over time [56], we
conclude that our classification is reliable.
In relation to the association of prospective PA changes and mortality, our results
showing an increased risk for Low PA-Decreasing in relation to High PA-Consistent
trajectory groups are consistent with the general notion that increased levels of PA lead
to greater longevity in both men and women. These findings were also observed when
using cross-sectional PA estimates [9,20,23,23–25,27–29], prospective categorical changes
in PA [9,33,57] and, more recently, finite mixture-modelling approaches for PA
trajectories identification as the exposure variable [39], irrespective of the PA-estimation
Chapter 2-PHYSICAL ACTIVITY TRAJECTORIES AND ADVERSE EVENTS
121
tool (self-reported vs. objective measures) [58]. While it is known that even a low level
of participation in PA reduces mortality rates in comparison with inactive behaviour
[8,27,28], the benefits increase in a dose-response manner at older ages in both men and
women, with a saturation effect in the upper limit of both intensity and volume of PA
[23]. Interestingly, the magnitude of PA effect on mortality might be contingent upon
the intensity of the displaced activity, which underscores the importance of this
parameter as a determinant of PA effects on health [59].
Importantly, the mortality-sparing benefits of late-life PA might only be slightly affected
by pre-cohort PA behaviour [60], meaning that at advanced age even subjects that have
never engaged in PA might gain similar benefits to those that used to be active.
Additionally, PA seems to attenuate the excess risk of mortality associated with other
classical predictors such as frailty [61], cognitive impairment [62] and poor mental, social
and physical health among elders [63].
Because PA is a powerful countermeasure against the development and progression of
chronic conditions, it is assumed to constitute a means to reduce healthcare system
utilization [71]. In this context, our results point to an important reduction in the
likelihood of hospitalization among those remaining active along time (High PA-
Consistent trajectory) versus those showing low PA baseline levels (Low PA-Increasing
and Low PA-Decreasing trajectories). The little research that is available has
demonstrated that PA is related to fewer and shorter hospital admissions [72, 73].
With regards to the association between PA and disability onset, our results support
previous work reporting an inverse association [14,67], with greater PA levels (measured
heterogeneously) associated with lower likelihood of functional disability captured as
mobility [67,68], clusters of BADL [69,70], instrumental ADL (IADL) [69,70], or both [69–
71]. The inverse PA-disability association seems to be graded, since slight increases in
terms of volume [71] and intensity [72] are associated with significantly better
functionality
Yu et al. sought to explore associations between PA-trajectories and functionality in a
Taiwanese older-adult cohort of 3186 subjects (mean age 63.89 ± 8.17 years; 50% women)
using a growth mixture model along 11 years follow-up [73]. Notwithstanding the
differences in methodology between their study and ours, the results were similar.
Importantly, and analogous to our findings, their PA-increasing trajectory group

Chapter 2-PHYSICAL ACTIVITY TRAJECTORIES AND ADVERSE EVENTS
122
benefitted from protection against disability to a similar extent as those who remained
highly active along follow-up, despite their low baseline PA levels [73].
Regarding the associations between PA levels and disability worsening, the limited
evidence points to a negative association between higher activity levels (measured in
diverse ways) and the odds of showing lower functionality at follow-up. In this line, Tak
et al. performed a meta-analysis of 4 studies that reported associations between PA and
BADL disability progression [14]. These findings are also compatible with our data.
Given the paucity of studies, further research is needed to study the complex
relationships between PA and other determinants of disability.
The Low PA-Increasing trajectory group showed an increased risk of hospitalization, but
not disability, when compared with the High PA-Consistent group. We hypothesize that
the strong association between increasing-activity and functionality during late life
might arise as the result of actual improvements in the physical domain of intrinsic
capacity resulting from PA. Tellingly, associations between PA and functionality tend to
be stronger in the case of motor ADL [54, 66], whereas the associations with performance
on more cognitive demanding tasks might be more modest [69,74]. On the other hand,
the absence of significant reductions in hospitalization in the Low PA-Increasing
trajectory group observed here might suggest a limited potential of late-life increases in
PA to avoid outcomes that lead to hospitalization in senior populations – mainly
cardiovascular events, pulmonary disease exacerbations and fractures resulting from
lifelong development of prevalent conditions in the presence of low PA levels.
Accordingly, members of more active trajectories are more likely to have been active
during mild-life, and thus their odds of developing these conditions and subsequently
being admitted to the hospital might be lower.
Our study has several strengths including the large sample size, excellent ascertainment
of adverse outcomes and the inclusion of relevant variables that could confound the
associations. The TSHA is a representative population of community-dwelling and
institutionalized men and women with a wide range of ages. Furthermore, we used the
novel GBTM, a powerful statistical tool to group subjects into qualitatively distinct
developmental progressions that differ not only at baseline, but also in the direction and
magnitude of the change and that are not readily identifiable using ad hoc, ex ante
classification rules. By doing so, we accounted for the factual dynamic nature of PA,
overcoming bias of previous research. Although GBTM might remain unfamiliar for

Chapter 2-PHYSICAL ACTIVITY TRAJECTORIES AND ADVERSE EVENTS
123
most of clinical focused researchers, it presents some compelling features that might be
quite useful to study longitudinal data. The characterization of groups of subjects
following different evolutions for a variable has commonly relied on subjective
categorization based on clinical or empirical thresholds (cut-points derived in other
cohorts, tertiles, etc…). Although reasonable, these assignment rules present with some
pitfalls. First, the existence of different groups is assumed a priori, and this point cannot
be tested objectively. Second, they do not allow for assessing the precision of individual
classifications to the various groups and hence, uncertainty about individual group
membership might emerge. In our case, an important strength of GBTM is that it allows
for a data-based in-depth study of the features of potential healthy aging-phenotypes
(PA-maintainers/increasers), which in turn could help clinicians to identify strategies
for maintaining PA engagement among senior. To estimate PA levels, we used a well-
validated tool specific for older adults, whose advantages include its brevity, easy
scoring process, the inclusion of activities other than exercise, and the inclusion of
activities common to older ensuring a comprehensive assessment of overall PA. While
objective PA measures are more reliable and overcome PA questionnaires’ limitations,
they might be impractical in large cohorts, as in ours. This work is one of the first to our
knowledge trying to explore the presence of different PA trajectories within a cohort of
older adults and their associations with important adverse outcomes in an older adult
cohort.
Our study, nevertheless, has important limitations. First, self-reported PA tools are
poorly correlated with objectively measured PA and their use is subject to the inclusion
of recall errors and social desirability leading to bias, especially among older adults.
Additionally, over-reporting of PA levels, if present, would lead to an underestimation
of the actual effect of PA on adverse outcomes [7,32]. Secondly, PASE cannot be
translated into actual PA levels or the metabolic equivalent of task or time performing
exercise. Thus, it fails at directly accounting for important modulators of the effect of PA
on health, mainly intensity and volume. This makes our results challenging to interpret
in relationship with other studies or PA recommendations. Thirdly, hospitalization was
only ascertained by checking Toledo’s Hospital Complex records. Although this centre
is the reference hospital for the Toledo’s province, where the whole sample dwelled at
baseline, it is possible that some subjects have travelled or moved during follow-up and
some events could have gone unreported.
Chapter 2-PHYSICAL ACTIVITY TRAJECTORIES AND ADVERSE EVENTS
124
Although GBTM is increasingly been used for identifying trajectories both for exposures
and outcomes in observational and experimental research, it is inherently limited in
capturing individual variability and may lead to over-grouping [36]. Furthermore, we
could only construct linear trajectories since we could only evaluate two time-points
prior to follow-up.
Reverse causality cannot be excluded in our study, due to its observational nature. PA
participation might be conditioned by health status and vice versa. Nevertheless, the
associations remained significant after adjustment for important risk factors,
comorbidities and functional status.
We acknowledge the potential absence of unrecognized or uncontrolled covariates that
could affect our observations. Of note is the absence of a measure of sedentary behaviour
as a competing exposure. Sedentary behaviour has recently been postulated as a key
health factor, independent of PA patterns, and is associated with mortality [75,76],
disability [69,77] and increased healthcare expenditure [78]. Furthermore, as we did not
have information about PA before the study entry time, we are not able to assess whether
the benefit from PA observed in this study could respond to a life-long acquired benefit
rather than to a recently gained PA beneficial effect. Direct comparison of our study with
others is not possible due to the unique distribution of trajectories that GBTM yields
within individual populations. Finally, our sample is restricted to a specific area of Spain
with unique features. Although this fact may limit the generalizability of our results, it
offers the advantage of reduced potential confounding by race, education, social
economic class and access to healthcare.
Our study contributes to expand the notion of PA as a powerful modifiable factor that
promotes healthy aging by means of preventing important adverse outcomes including
mortality, disability, and hospitalization. It does so from a new perspective, by using a
novel approach that allows to empirically identify different PA-related aging
phenotypes, that as our results suggest, are associated with relevant outcomes for older
people. The prevention of BADL disability is especially relevant, since it is associated
with receiving home-care services, and an increased risk of long-term nursing home
admission and healthcare costs [14]. In the context of a global aging population, our
findings have important clinical and economic implications. Given that the association
between PA and healthy aging seems to be valid and physiologically plausible,
especially if the PA is in the form of structured exercise, the goal should be to enhance

Chapter 2-PHYSICAL ACTIVITY TRAJECTORIES AND ADVERSE EVENTS
125
exercise participation among older people living in the community. Unfortunately, PA
levels fall dramatically in the last years of life [20]. If, as the evidence indicates, any
activity above sedentarism in terms of volume [8,27–29,35] and intensity [23,32,59], and
longitudinally maintaining PA levels, are associated with better health outcomes in older
adults [27,29,79], clinicians, relatives and caregivers should encourage them to be as
active as possible, both during planned exercise sessions and in everyday life activities.
Policymakers, for their part, should increase social awareness and promote accessible,
popular and everyday activities such as walking and active commuting among older
populations. Hopefully, efforts are being made to increase late-life PA participation [80].
In summary, we confirmed our hypotheses in our older adult cohort that consistent high
PA levels provide protection against important adverse outcomes when compared with
low PA baseline levels and decreasing PA. Importantly, increasing PA levels during late
life might entail a lower risk of disability in comparison with prospectively reducing
activity.
Conflict of interest
The authors declare that they have no conflict of interest.
Ethical issues
The study protocol was approved by the Clinical Research Ethics Committee of the
Toledo Hospital, Spain. This work was performed according to the ethical standards laid
down in the 1964 Declaration of Helsinki and later amendments. Participants signed
informed consent forms prior to their inclusion in the cohort. The authors certify that
they comply with the ethical guidelines for authorship and publishing of the Journal of
Cachexia, Sarcopenia and Muscle [81].
Chapter 2-PHYSICAL ACTIVITY TRAJECTORIES AND ADVERSE EVENTS
126
References
[1] Moore SC, Lee I-M, Weiderpass E, et al. Association of Leisure-Time Physical Activity With Risk of 26 Types of Cancer in 1.44 Million Adults. JAMA Intern Med 2016; 176: 816–825.
[2] Pareja-Galeano H, Garatachea N, Lucia A. Exercise as a Polypill for Chronic Diseases. Prog Mol Biol Transl Sci 2015; 135: 497–526.
[3] Fiuza-Luces C, Santos-Lozano A, Joyner M, et al. Exercise benefits in cardiovascular disease: beyond attenuation of traditional risk factors. Nat Rev Cardiol. Epub ahead of print 16 August 2018. DOI: 10.1038/s41569-018-0065-1.
[4] Aune D, Norat T, Leitzmann M, et al. Physical activity and the risk of type 2 diabetes: a systematic review and dose-response meta-analysis. Eur J Epidemiol 2015; 30: 529–542.
[5] Guure CB, Ibrahim NA, Adam MB, et al. Impact of Physical Activity on Cognitive Decline, Dementia, and Its Subtypes: Meta-Analysis of Prospective Studies. Biomed Res Int 2017; 2017: 9016924.
[6] Löllgen H, Böckenhoff A, Knapp G. Physical activity and all-cause mortality: an updated meta-analysis with different intensity categories. Int J Sports Med 2009; 30: 213–224.
[7] Nocon M, Hiemann T, Müller-Riemenschneider F, et al. Association of physical activity with all-cause and cardiovascular mortality: a systematic review and meta-analysis. Eur J Cardiovasc Prev Rehabil 2008; 15: 239–246.
[8] Löllgen H, Löllgen D. [Risk reduction in cardiovascular diseases by physical activity]. Internist (Berl) 2012; 53: 20–29.
[9] Wannamethee SG, Shaper AG, Walker M. Changes in physical activity, mortality, and incidence of coronary heart disease in older men. Lancet 1998; 351: 1603–1608.
[10] Paffenbarger RS, Hyde RT, Wing AL, et al. Physical activity, all-cause mortality, and longevity of college alumni. N Engl J Med 1986; 314: 605–613.
[11] Woodcock J, Franco OH, Orsini N, et al. Non-vigorous physical activity and all-cause mortality: systematic review and meta-analysis of cohort studies. Int J Epidemiol 2011; 40: 121–138.
[12] Ekelund U, Tarp J, Steene-Johannessen J, et al. Dose-response associations between accelerometry measured physical activity and sedentary time and all cause mortality: systematic review and harmonised meta-analysis. BMJ 2019; 366: l4570.
[13] Paterson DH, Warburton DE. Physical activity and functional limitations in older adults: a systematic review related to Canada’s Physical Activity Guidelines. Int J Behav Nutr Phys Act 2010; 7: 38.

Chapter 2-PHYSICAL ACTIVITY TRAJECTORIES AND ADVERSE EVENTS
127
[14] Tak E, Kuiper R, Chorus A, et al. Prevention of onset and progression of basic ADL disability by physical activity in community dwelling older adults: a meta-analysis. Ageing Res Rev 2013; 12: 329–338.
[15] Hupin D, Roche F, Gremeaux V, et al. Even a low-dose of moderate-to-vigorous physical activity reduces mortality by 22% in adults aged ≥60 years: a systematic review and meta-analysis. Br J Sports Med 2015; 49: 1262–1267.
[16] Garatachea N, Santos-Lozano A, Hughes DC, et al. Physical Exercise as an Effective Antiaging Intervention. Biomed Res Int; 2017. Epub ahead of print 2017. DOI: 10.1155/2017/7317609.
[17] Peeters GMEEG, Gardiner PA, Dobson AJ, et al. Associations between physical activity, medical costs and hospitalisations in older Australian women: Results from the Australian Longitudinal Study on Women’s Health. J Sci Med Sport 2018; 21: 604–608.
[18] Jacobs JM, Rottenberg Y, Cohen A, et al. Physical activity and health service utilization among older people. J Am Med Dir Assoc 2013; 14: 125–129.
[19] Aijö M, Parkatti T. Independent and combined association of physical activity and cardiac disease on mortality risk in the very old. J Aging Health 2011; 23: 70–85.
[20] Muscari A, Bianchi G, Forti P, et al. Physical Activity and Other Determinants of Survival in the Oldest Adults. J Am Geriatr Soc 2017; 65: 402–406.
[21] WHO | Global recommendations on physical activity for health. WHO, https://www.who.int/dietphysicalactivity/factsheet_recommendations/en/ (accessed 2 April 2020).
[22] Izquierdo M, Rodriguez-Mañas L, Casas-Herrero A, et al. Is It Ethical Not to Precribe Physical Activity for the Elderly Frail? J Am Med Dir Assoc 2016; 17: 779–781.
[23] Arem H, Moore SC, Patel A, et al. Leisure time physical activity and mortality: a detailed pooled analysis of the dose-response relationship. JAMA Intern Med 2015; 175: 959–967.
[24] Gebel K, Ding D, Chey T, et al. Effect of Moderate to Vigorous Physical Activity on All-Cause Mortality in Middle-aged and Older Australians. JAMA Intern Med 2015; 175: 970–977.
[25] Hirsch CH, Diehr P, Newman AB, et al. Physical activity and years of healthy life in older adults: results from the cardiovascular health study. J Aging Phys Act 2010; 18: 313–334.
[26] Moore SC, Patel AV, Matthews CE, et al. Leisure time physical activity of moderate to vigorous intensity and mortality: a large pooled cohort analysis. PLoS Med 2012; 9: e1001335.
[27] Paganini-Hill A, Kawas CH, Corrada MM. Activities and mortality in the elderly: the Leisure World cohort study. J Gerontol A Biol Sci Med Sci 2011; 66: 559–567.

Chapter 2-PHYSICAL ACTIVITY TRAJECTORIES AND ADVERSE EVENTS
128
[28] Ottenbacher AJ, Snih SA, Karmarkar A, et al. Routine physical activity and mortality in Mexican Americans aged 75 and older. J Am Geriatr Soc 2012; 60: 1085–1091.
[29] Brown WJ, McLaughlin D, Leung J, et al. Physical activity and all-cause mortality in older women and men. Br J Sports Med 2012; 46: 664–668.
[30] Barnett TA, Gauvin L, Craig CL, et al. Distinct trajectories of leisure time physical activity and predictors of trajectory class membership: a 22 year cohort study. Int J Behav Nutr Phys Act 2008; 5: 57.
[31] Shortreed SM, Peeters A, Forbes AB. Estimating the effect of long-term physical activity on cardiovascular disease and mortality: evidence from the Framingham Heart Study. Heart 2013; 99: 649–654.
[32] Hamer M, de Oliveira C, Demakakos P. Non-exercise physical activity and survival: English longitudinal study of ageing. Am J Prev Med 2014; 47: 452–460.
[33] Stessman J, Hammerman-Rozenberg R, Cohen A, et al. Physical activity, function, and longevity among the very old. Arch Intern Med 2009; 169: 1476–1483.
[34] Almeida OP, Khan KM, Hankey GJ, et al. 150 minutes of vigorous physical activity per week predicts survival and successful ageing: a population-based 11-year longitudinal study of 12 201 older Australian men. Br J Sports Med 2014; 48: 220–225.
[35] Gregg EW, Cauley JA, Stone K, et al. Relationship of changes in physical activity and mortality among older women. JAMA 2003; 289: 2379–2386.
[36] Nagin DS, Odgers CL. Group-based trajectory modeling in clinical research. Annu Rev Clin Psychol 2010; 6: 109–138.
[37] Nagin DS. Group-Based Trajectory Modeling: An Overview. ANM 2014; 65: 205–210.
[38] Laddu DR, Cawthon PM, Parimi N, et al. Trajectories of the relationships of physical activity with body composition changes in older men: the MrOS study. BMC Geriatr 2017; 17: 119.
[39] Laddu D, Parimi N, Cauley JA, et al. The Association between Trajectories of Physical Activity and All-cause and Cause-specific Mortality. J Gerontol A Biol Sci Med Sci. Epub ahead of print 26 February 2018. DOI: 10.1093/gerona/gly037.
[40] García García FJ, Sánchez Ayala MI, Pérez Martín A, et al. [The prevalence of dementia and its main subtypes in subjects older than 65 years: impact of occupation and education. The Toledo Study]. Med Clin (Barc) 2001; 116: 401–407.
[41] Washburn RA, Smith KW, Jette AM, et al. The Physical Activity Scale for the Elderly (PASE): development and evaluation. J Clin Epidemiol 1993; 46: 153–162.

Chapter 2-PHYSICAL ACTIVITY TRAJECTORIES AND ADVERSE EVENTS
129
[42] Washburn RA, Ficker JL. Physical Activity Scale for the Elderly (PASE): the relationship with activity measured by a portable accelerometer. J Sports Med Phys Fitness 1999; 39: 336–340.
[43] Katz S, Downs TD, Cash HR, et al. Progress in development of the index of ADL. Gerontologist 1970; 10: 20–30.
[44] Charlson ME, Pompei P, Ales KL, et al. A new method of classifying prognostic comorbidity in longitudinal studies: development and validation. J Chronic Dis 1987; 40: 373–383.
[45] Folstein MF, Folstein SE, McHugh PR. ‘Mini-mental state’. A practical method for grading the cognitive state of patients for the clinician. J Psychiatr Res 1975; 12: 189–198.
[46] Gnjidic D, Hilmer SN, Blyth FM, et al. Polypharmacy cutoff and outcomes: five or more medicines were used to identify community-dwelling older men at risk of different adverse outcomes. J Clin Epidemiol 2012; 65: 989–995.
[47] JONES BL, NAGIN DS, ROEDER K. A SAS Procedure Based on Mixture Models for Estimating Developmental Trajectories: Sociological Methods & Research. Epub ahead of print 30 June 2016. DOI: 10.1177/0049124101029003005.
[48] Lounassalo I, Salin K, Kankaanpää A, et al. Distinct trajectories of physical activity and related factors during the life course in the general population: a systematic review. BMC Public Health 2019; 19: 271.
[49] Artaud F, Sabia S, Dugravot A, et al. Trajectories of Unhealthy Behaviors in Midlife and Risk of Disability at Older Ages in the Whitehall II Cohort Study. J Gerontol A Biol Sci Med Sci 2016; 71: 1500–1506.
[50] Aggio D, Papachristou E, Papacosta O, et al. Trajectories of self-reported physical activity and predictors during the transition to old age: a 20-year cohort study of British men. Int J Behav Nutr Phys Act 2018; 15: 14.
[51] Pan L-Y, Hsu H-C, Chang W-C, et al. Trajectories of physical activity and risk factors among Taiwanese older adults. Int J Behav Med 2015; 22: 62–69.
[52] Xue Q-L, Bandeen-Roche K, Mielenz TJ, et al. Patterns of 12-year change in physical activity levels in community-dwelling older women: can modest levels of physical activity help older women live longer? Am J Epidemiol 2012; 176: 534–543.
[53] Hsu H-C, Luh D-L, Chang W-C, et al. Joint trajectories of multiple health-related behaviors among the elderly. Int J Public Health 2013; 58: 109–120.
[54] Pettee Gabriel K, Sternfeld B, Colvin A, et al. Physical activity trajectories during midlife and subsequent risk of physical functioning decline in late mid-life: The Study of Women’s Health Across the Nation (SWAN). Prev Med 2017; 105: 287–294.
[55] Jackson EL, Dunn E. Integrating Ceasing Participation With Other Aspects of Leisure Behavior. Journal of Leisure Research 1988; 20: 31–45.
Chapter 2-PHYSICAL ACTIVITY TRAJECTORIES AND ADVERSE EVENTS
130
[56] Andruff H, Carraro N, Thompson A, et al. Latent Class Growth Modelling: A Tutorial. Tutorials in Quantitative Methods for Psychology 2009; 5: 11–24.
[57] Gopinath B, Kifley A, Flood VM, et al. Physical Activity as a Determinant of Successful Aging over Ten Years. Sci Rep 2018; 8: 10522.
[58] Jefferis BJ, Parsons TJ, Sartini C, et al. Objectively measured physical activity, sedentary behaviour and all-cause mortality in older men: does volume of activity matter more than pattern of accumulation? Br J Sports Med. Epub ahead of print 12 February 2018. DOI: 10.1136/bjsports-2017-098733.
[59] Stamatakis E, Rogers K, Ding D, et al. All-cause mortality effects of replacing sedentary time with physical activity and sleeping using an isotemporal substitution model: a prospective study of 201,129 mid-aged and older adults. Int J Behav Nutr Phys Act; 12. Epub ahead of print 30 September 2015. DOI: 10.1186/s12966-015-0280-7.
[60] Bembom O, van der Laan M, Haight T, et al. Leisure-time physical activity and all-cause mortality in an elderly cohort. Epidemiology 2009; 20: 424–430.
[61] Higueras-Fresnillo S, Cabanas-Sánchez V, Lopez-Garcia E, et al. Physical Activity and Association Between Frailty and All-Cause and Cardiovascular Mortality in Older Adults: Population-Based Prospective Cohort Study. J Am Geriatr Soc 2018; 66: 2097–2103.
[62] Esteban-Cornejo I, Cabanas-Sánchez V, Higueras-Fresnillo S, et al. Cognitive Frailty and Mortality in a National Cohort of Older Adults: the Role of Physical Activity. Mayo Clin Proc. Epub ahead of print 6 March 2019. DOI: 10.1016/j.mayocp.2018.10.027.
[63] Martinez-Gomez D, Guallar-Castillon P, Higueras-Fresnillo S, et al. Physical Activity Attenuates Total and Cardiovascular Mortality Associated With Physical Disability: A National Cohort of Older Adults. J Gerontol A Biol Sci Med Sci 2018; 73: 240–247.
[64] Simmonds B, Fox K, Davis M, et al. Objectively assessed physical activity and subsequent health service use of UK adults aged 70 and over: a four to five year follow up study. PLoS ONE 2014; 9: e97676.
[65] Li C-L, Chu S-J, Sheu J-T, et al. Impact of physical activity on hospitalization in older adults: a nationwide cohort from Taiwan. Arch Gerontol Geriatr 2011; 53: 141–145.
[66] Sari N. Sports, Exercise, and Length of Stay in Hospitals: Is There a Differential Effect for the Chronically Ill People? Contemporary Economic Policy 2014; 32: 247–260.
[67] Liao W-C, Li C-R, Lin Y-C, et al. Healthy behaviors and onset of functional disability in older adults: results of a national longitudinal study. J Am Geriatr Soc 2011; 59: 200–206.

Chapter 2-PHYSICAL ACTIVITY TRAJECTORIES AND ADVERSE EVENTS
131
[68] DiPietro L, Jin Y, Talegawkar S, et al. The Joint Associations of Sedentary Time and Physical Activity With Mobility Disability in Older People: The NIH-AARP Diet and Health Study. J Gerontol A Biol Sci Med Sci 2018; 73: 532–538.
[69] Cawthon PM, Blackwell TL, Cauley JA, et al. Objective assessment of activity, energy expenditure, and functional limitations in older men: the Osteoporotic Fractures in Men study. J Gerontol A Biol Sci Med Sci 2013; 68: 1518–1524.
[70] Young DR, Masaki KH, Curb JD. Associations of physical activity with performance-based and self-reported physical functioning in older men: the Honolulu Heart Program. J Am Geriatr Soc 1995; 43: 845–854.
[71] Ćwirlej-Sozańska A, Sozański B, Wiśniowska-Szurlej A, et al. Assessment of Disability and Factors Determining Disability among Inhabitants of South-Eastern Poland Aged 71-80 Years. Biomed Res Int 2018; 2018: 3872753.
[72] Dunlop DD, Song J, Semanik PA, et al. Relation of physical activity time to incident disability in community dwelling adults with or at risk of knee arthritis: prospective cohort study. BMJ 2014; 348: g2472.
[73] Yu H-W, Chiang T-L, Chen D-R, et al. Trajectories of Leisure Activity and Disability in Older Adults Over 11 Years in Taiwan. J Appl Gerontol 2018; 37: 706–727.
[74] Manini TM, Beavers DP, Pahor M, et al. Effect of Physical Activity on Self-Reported Disability in Older Adults: Results from the LIFE Study. J Am Geriatr Soc 2017; 65: 980–988.
[75] Koster A, Caserotti P, Patel KV, et al. Association of sedentary time with mortality independent of moderate to vigorous physical activity. PLoS ONE 2012; 7: e37696.
[76] Loyen A, Clarke-Cornwell AM, Anderssen SA, et al. Sedentary Time and Physical Activity Surveillance Through Accelerometer Pooling in Four European Countries. Sports Med. Epub ahead of print 10 December 2016. DOI: 10.1007/s40279-016-0658-y.
[77] Dunlop DD, Song J, Arnston EK, et al. Sedentary time in US older adults associated with disability in activities of daily living independent of physical activity. J Phys Act Health 2015; 12: 93–101.
[78] Biswas A, Oh PI, Faulkner GE, et al. Sedentary time and its association with risk for disease incidence, mortality, and hospitalization in adults: a systematic review and meta-analysis. Ann Intern Med 2015; 162: 123–132.
[79] Moore DS, Ellis R, Allen PD, et al. Construct validation of physical activity surveys in culturally diverse older adults: a comparison of four commonly used questionnaires. Res Q Exerc Sport 2008; 79: 42–50.
[80] Izquierdo M, Rodriguez-Mañas L, Sinclair AJ. Editorial: What Is New in Exercise Regimes for Frail Older People - How Does the Erasmus Vivifrail Project Take Us Forward? J Nutr Health Aging 2016; 20: 736–737.

Chapter 2-PHYSICAL ACTIVITY TRAJECTORIES AND ADVERSE EVENTS
132
[81] von Haehling S, Morley JE, Coats AJS, et al. Ethical guidelines for publishing in the journal of cachexia, sarcopenia and muscle: update 2017. J Cachexia Sarcopenia Muscle 2017; 8: 1081–1083.

133
Chapter 3: General discussion
GENERAL DISCUSSION
134
General Discussion In the following sections I discuss the implications of the results of the present thesis and
I debate surrounding their possible applications.
Physical Behaviors as modulators of healthy ageing
The ongoing demographic and epidemiologic transitions worldwide, have contributed
to growing interest in the physiology of the ageing process [1]. The superimposition of
chronic diseases to the “physiological” primary ageing conditions an accelerated loss of
physiological reserve at whole-body systems [2] and drives reductions in intrinsic
capacity, which in turns conditions premature disability, poor health outcomes and
compromise health-related quality of life. Importantly, neither the development of
chronic disease or disability are irremediable consequences ageing, since “healthy
ageing” models do exist [3, 4].
Therefore, the understanding of the processes underlying healthy versus accelerated
ageing and the factors associated with different intrinsic capacity trajectories have
attracted the interest of healthcare professionals and researchers in the field of ageing.
Among the myriad of known and unknown factors potentially determining biological
age, special interest has been posed on modifiable lifestyle factors (physical behaviors,
nutrition, toxic habits…). Of those, physical activity, physical inactivity and sedentary
behavior, have widely been identified as decisive determinants of health [5].
Part of this doctoral thesis focused on the role of physical behaviors as determinants of
healthy ageing, focusing on a crucial organ-specific age-related process (i.e. sarcopenia)
and the association between temporal evolution of physical activity and adverse
outcomes.

GENERAL DISCUSSION
135
Associations between PA and SB and sarcopenia and its
determinants (Chapter 1)
Among the constellation of physiological function losses in body systems along the
ageing process, that affecting the musculoskeletal system, sarcopenia, stands out as one
of the most critical given its relatively high prevalence [6], direct implications
(association with development and aggravation of chronic diseases) [7–9], falls and
fractures [10], disability [11], mortality [12, 13] and increased healthcare expenditure
[14]). In fact, some experts consider sarcopenia to be at the forefront of health issues
associated with ageing and to constitute a public health concern [15].
Consequently, it seems mandatory to increase the awareness about the need of the
maintenance of muscle mass and function levels across the lifetime and to prompt
initiatives aimed at attenuating sharp decreases in muscle mass and function in late life
[16].
Focusing on the role of free-living physical activity, available evidence remains scarce
(mainly in relation to physical activity parameters such as intensity and volume) and
presents with several limitations that could be overcome given the recent advances in
late-life physical behaviors epidemiology (use of accelerometers [17], isotemporal
substitution models [18]) and recent reshaping of sarcopenia definition [19–21].
The study presented in Chapter 1 [22] aimed at exploring the cross-sectional associations
between objectively assessed physical behaviors and sarcopenia and its determinants in
a Spanish older adults’ population. Our results suggest that greater levels of moderate-
to vigorous physical activity are associated with lower sarcopenia rates and greater
muscle mass and gait speed, independently of light physical activity or sedentary
behavior, whereas the association with handgrip strength seems to be confounded by
sedentary behavior and light physical activity. Additionally, the isotemporal
substitution model showed that replacing both sedentary behavior and light physical
activity with moderate-to-vigorous physical activity is associated to a reduction in the
odds of presenting with sarcopenia and is positively related to muscle mass and gait
speed, whereas in the case of handgrip strength, only the substitution of sedentary
behavior with moderate-to-vigorous physical activity resulted significant.
To this day, several observational studies have explored the association between leisure-
time, total physical activity and lower sedentary behavior accumulation and sarcopenia

GENERAL DISCUSSION
136
rates, obtaining mixed results. A recent meta-analysis of cross-sectional observational
studies showed that physical activity was associated with a 45% (OR=45; 95% CI=0,37-
0,55) lower probability of presenting with sarcopenia [23], including both muscle mass-
based and multi-domains sarcopenia definitions.
Using physical activity questionnaires, studies such as those of Tyrovolas et al. (2016)
[24] and Rosique-Esteban et al., (2018) [25] showed cross-sectional associations between
higher levels of physical activity and lower sarcopenia rates; whereas Volpato et al.,
(2014) (using a non-validated physical activity questionnaire) [26] and Hai et al., (2017)
[27], did not find such association. Longitudinally, Mijarends et al. (2016) [28] found a
protective role of high levels of physical activity on sarcopenia incidence. Regarding self-
reported sedentary behavior, evidence points towards a positive association [29, 30].
Recent advancements in actimetry have allowed to better characterize physical activity
in terms of intensity and volume, overcoming limitations of self-reported questionnaires.
Hence the poorly understood association between sedentary behavior and different
physical activity intensities (probably triggering different response at the cellular, organ
and systemic levels) with sarcopenia and its determinants is now possible. In this regard,
sarcopenia has consistently been negatively associated with accumulation of time in the
higher end of the intensity continuum (moderate-to-vigorous physical activity) [31–33],
with only one study showing associations between light physical activity (termed non-
sedentary activity) and lower sarcopenia rates [34]. The role of sedentary behavior by its
part has been less investigated, with two accelerometer-based studies showing no
association with greater sarcopenia rates [31, 33, 35].
Concurrent to the evolution of sarcopenia envisioned as a condition not only comprising
age-related reductions in muscle mass but also in physical performance and muscle
strength, studies started to explore the association between physical behaviors and
individual sarcopenia determinants. Overall, observed associations tended to be graded,
greater at higher levels of physical activity in terms of volume and intensity and stronger
in the case of muscle strength [31, 33, 36–38] and physical performance [31, 33, 34, 39],
over those with muscle mass [32, 33, 36]. Sedentary behavior by its part was poorly
associated with sarcopenia determinants as an independent factor with some significant
associations observed with muscle mass [36] and gait speed [31, 40].

GENERAL DISCUSSION
137
Among the available studies employing the presumable more valid accelerometer-based
physical behaviors estimation, the results were unanimous pointing towards a unique
and independent association between moderate-to-vigorous physical activity and
sarcopenia [31–33] and its determinants [31, 33, 36, 38, 39], which is compatible with our
results, with the exception of handgrip strength. With regards to sedentary behavior,
previous research has pointed to the absence of an independent association between
total time in sedentary behavior [31, 33, 35] and sarcopenia, congruently with our results.
Findings might be expanded to muscle mass [31, 33, 35, 38] and handgrip strength [33,
35–38, 40], whereas the associations between sedentary behavior and gait speed have
been mixed [11, 13, 19, 20], with significant [31, 39, 40], and non-significant associations
encountered [33, 35, 38].
Physical Activity Intensity and Sarcopenia and its Determinants
Altogether, available evidence suggests that in order to gain benefits in terms of muscle
mass, strength and physical performance, the breaching of a physical activity intensity
threshold might be required, with little or none benefit obtained at physical activity
lower intensities. In fact, light physical activity benefits observed in single-parameter
models tend to fade when accounting for time spent at moderate-to-vigorous physical
activity, which reinforces the independent effects of different physical activity intensities
and the role of intensity as a crucial determinant of physical activity benefits on health.
These findings have recently been reinforced by emerging experimental research,
proving that moderate-intensity walking-based aerobic exercise programs have the
potential to contribute to musculoskeletal health. Brightwell et al., showed that a 24-
weeks aerobic exercise training (3 times a week, 45 minutes per session, at an intensity
of 70%of the heart rate reserve) was associated with increases in muscle capillarization,
muscle proteostasis, and lower-limb muscle strength in a sample of sedentary older
adults [41]. They failed at reporting gains in muscle cross-sectional area, confirming the
expected little potential of aerobic exercise for muscle hypertrophy [42]
Anyhow, the increases in muscle function (strength) observed after aerobic training have
relevant implications since this parameter is a better predictor of functional ability than
muscle mass [43, 44] among older adults.
Notwithstanding, long-lasting aerobic exercise training participation might contribute
to muscle mass maintenance by means of preserving a healthier muscle fiber phenotype,

GENERAL DISCUSSION
138
extending survival and hence preventing inactivity and age-related muscle atrophy [45,
46], which is consistent with findings of some observational studies showing
associations between ambulatory “aerobic” moderate-to-vigorous physical activity and
muscle mass [28, 32, 36, 36]. Unfortunately, experimental research is scarce and optimal
aerobic exercise parameters for prevention of late-life sarcopenia attenuation remain to
be elucidated.
Importantly, similar to observational studies, available clinical trials point to the
intensity reliance of adaptations to aerobic exercise training, with low intensity exerting
insufficient stimulus such as to promote adaptations in terms of muscle protein synthesis
[47, 48].
Contrary to this hypothesis, some observational studies showed associations between
light physical activity and some sarcopenia determinants: muscle mass [33, 36], handgrip
strength [37], and physical performance [33, 34, 36, 49].
Two potential explanations for these incompatible observations regarding light physical
activity exist. First, in mentioned studies, time in each physical activity intensity category
was determined using accelerometry cut-points validated in healthy young reference
populations [50–52], which could have leaded to labelling as light of minutes actually
corresponding to moderate-to-vigorous physical activity, explaining the positive
associations between light physical activity and some sarcopenia determinants. In our
study, we employed age-specific intensity cut-points [53, 54]. Thus, the minutes
identified as light physical activity in our study correspond to much lower intensities,
with a substantial lesser potential for disrupting homeostasis and hence triggering
responses than actual moderate-to-vigorous physical activity minutes misclassified as
light physical activity in previous studies.
The striking differences in estimates of sedentary behavior, light physical activity and
moderate-to-vigorous physical activity by using young-reference or older adult
thresholds are illustrative of the importance of using age-specific cut-points for activity
classification by accelerometers. The use of Freedson et al. cut-points [50] in the same
Toledo Study of Healthy Ageing population as ours yielded greater sedentary behavior
(540 minutes/day), and underestimated light physical activity (by 73 minutes) and
moderate-to-vigorous physical activity (by 41 minutes) in comparison with the use of
age-specific cut-points in our work [55]. This fact exemplifies the degree of distortion

GENERAL DISCUSSION
139
arising from the use of standard reference cut-points for intensity categorization, and the
imperative need of the use of population-specific cut-points to allow for correct inference
[17, 56]
Second, another potential explanation for the recurrent association between light
physical activity and better gait speed (observed in most of previous studies) might
result from the reliance of the latter on body functions besides those involved in pure
strength production [57–59], resulting from the integrative function of organic systems
that might be positively impacted by light physical activity, such as cardiovascular [60]
and central nervous systems [61] .
Moreover, light physical activity might exert some beneficial effects on muscle mass and
function indirectly through its potential effects on visceral adiposity [62] and obesity [63]
and its consequences (low-grade inflammation) and lipotoxicity, known core processes
of sarcopenia pathophysiology [64], especially in sarcopenic obese subjects [31, 65], but
this might be confirmed by further research.
Sedentary Behaviour and Sarcopenia and its determinants
Whereas evidence is consensual regarding the cross-sectional associations of greater
levels of physical activity in terms of intensity and volume with lower sarcopenia rates,
evidence regarding the role of sedentary behaviors is ambiguous.
Congruent with our results, accelerometer-based works found no association between
sedentary behavior and sarcopenia when taking into account light physical activity and
moderate-to-vigorous physical activity [31–33, 35]. Nevertheless, two studies by
Gianoudis et al. [30] and Smith et al. [29] found a significant increased risk of sarcopenia
with self-reported sedentary behavior. Disparity in findings could be due to
measurement error or recall bias in self-reports (for which there is evidence particularly
among older adults) [66]. Additionally, sedentary behavior is usually associated
heterogeneously to a range of specific activities in self-reported instruments (television
viewing, labor-related activities or screen time), potentially overlooking a proportion of
sedentary behavior corresponding to activities non-included in questionnaires.
Furthermore, sedentary activities include different chores, whose effects on health might
be differential upon the presence of different correlates, for example associated
behaviors including poor nutritional habits, and their nature (mentally-demanding
activities vs. mentally-inactive sedentary behaviour) [30].

GENERAL DISCUSSION
140
Regarding the association between sedentary behaviors and sarcopenia determinants,
evidence suggest that physical performance (in the form of gait speed) might be the only
sarcopenia-related parameter affected by sedentary behavior [31, 33, 35, 40]. Again, in
the absence of associations between sedentary behavior and muscle mass or muscle
strength, the link between higher sitting or reclining activities with gait speed might
respond to the same rationale than the proposed reduced light physical activity-
mediated impairment of other systems involved in gait performance. In fact, time
engaged in light physical activity has been seen to correlate with sedentary behaviour
breaks and (negatively) with total sedentary time [63], which suggest that both physical
behaviors might be complementary and so their effects on health.
The SB/LPA Sarcopenic Obesity association
Similarly to our results, Aggio et al. found a significant elevated risk (OR=1.19; 95%
CI=1.06-1.35) of sarcopenia with increasing time in sedentary behavior in raw models
[31]. Nevertheless, such an association faded when moderate-to-vigorous physical
activity levels were accounted for in both studies. Interestingly, in the same British
Regional Study cohort, excess and lower risks associated with sedentary behavior and
light physical activity, respectively, remained marginally significant after controlling for
time in moderate-to-vigorous physical activity in the case of sarcopenic obesity [31].
Taken together, the uniqueness of moderate-to-vigorous physical activity as a
sarcopenia protective physical behaviour factor and the independence of sedentary
behavior and light physical activity for sarcopenic obesity risk might be justified by the
existence of two sarcopenia phenotypes resulting from different physical behavior
patterns. On one hand, a model of sarcopenia resulting from lack of higher intensity
physical activity stimulus and on the other, sarcopenic obesity, in which muscle wasting
is further aggravated by the additive detrimental consequences associated to increased
adiposity (low-grade inflammation, insulin resistance, etc.…) [67], for what light
physical activity might be protective by means of reducing time in sedentary behavior
[68].
Isotemporal substitution
An exclusive novelty of our work is the use of isotemporal substitution models to explore
the associations of reallocating different physical behaviors and sarcopenia, mimicking
behavioral changes or interventions from a mathematical approach. This type of
analyses considers the finiteness of the time in which a subject can partake in physical

GENERAL DISCUSSION
141
activity. Thus, spending time in one behavior (i.e. sedentary behavior) results in less time
being spent in another (i.e. moderate-to-vigorous physical activity) [18], further
understanding that daily behaviors (sedentary behavior and physical activity) are co-
dependent [69]. Hence, the use of isotemporal substitution might pave the way for the
development and refinement of effective lifestyle-based interventions in older adults.
To our knowledge, Study 1 is unique in the use of isotemporal substitution to explore
associations between different physical behaviors and sarcopenia. Our findings support
the existence of an intensity threshold below which no benefit is achieved in terms of
sarcopenia risk and/or muscle health parameters, as observed in studies using classical
linear regression models. In the Study 1 both the replacement of either sedentary
behavior or light physical activity with moderate-to-vigorous physical activity were
associated with lower sarcopenia rates and better values in its determinants, except for
handgrip strength, for which only the substitution of sedentary behavior by moderate-
to-vigorous physical activity yielded a significant association. The latter might be
explained by the little involvement of upper limbs in ambulatory activities captured by
accelerometers.
Several studies have used isotemporal substitution approaches to disentangle the effects
of time reallocation between intensities on older adult’s health outcomes.
Overall, associations with better physical function outcomes (such as gait speed [39, 70]
and self-reported physical function [71]) were restricted to moderate-to-vigorous
increases, which is compatible with our observations. In fact, the evident health benefits
of light physical activity increase and reductions in sedentary behavior may be restricted
to cardio-metabolic health in older adults. The reduction of sedentary behavior at
expenses of increasing light physical activity has been associated with reductions in
body mass index, waist circumference [62], total fat, visceral adipose tissue, markers of
glucose metabolism dysfunction (fasting glucose and HbAC1) and triglycerides, with
concomitant increases in muscle mass and HDL-cholesterol [62], which might explain
observed reductions in cardiovascular disease risk factors such as heightened resting
heart rate, endothelial dysfunction and increased inflammatory activity (fibrinogen
levels) [72].
Isotemporal substitution models have also showed theoretical positive effects of both
light and moderate-to-vigorous physical activity increases on depressive symptoms [73],

GENERAL DISCUSSION
142
whereas improvements in executive function were restricted to sedentary behavior-
moderate-to-vigorous physical activity substitutions [74] among elders.
Special attention deserves the sarcopenia-related frailty syndrome, for which four
studies using isotemporal substitutions are available. All of them showed associations
between increasing moderate-to-vigorous physical activity reducing sedentary behavior
with lower frailty levels using four distinct definitions (Frailty Phenotype [75], Frailty
Trait Scale-12 [76], Frailty Index [77] and a continuous modified version of the Frailty
Phenotype [71]). Nagai et al. [75], and Godin et al [77], found significant beneficial effects
of the sedentary behavior-light physical activity reallocation on frailty, whereas Mañas
et al. [76], did so only among older adults with comorbidities. Finally, no associations of
increases in light physical activity and frailty were found in the isotemporal substitution
in Higueras-Fresnillo et al. [71]. These contradictory findings might result from the use
of different frailty operationalizations, with light physical activity positively impacting
more comprehensive definitions (i.e. Frailty Trait Scale-12 and Frailty Index), and no
effect on oligo-dimensional (physical dominion) frailty conceptualizations (such as
Frailty Phenotype).
Mechanisms underlying PA and SB associations with sarcopenia
Mechanistic research deepening in the physiological processes underlying the
association of free-living moderate-to-vigorous physical activity and musculoskeletal
health is scarce. However, we hypothesize that putative mechanisms linked to exercise
responses and adaptations in basic and experimental research [78, 79] might be valid to
explain beneficial effects of free-living physical activity on muscle mass, strength and
physical performance. First, the bioenergetics/mechanical homeostatic disruption
caused by physical activity (absent during sedentary behavior) at the muscle tissue
might trigger responses that start molecular signaling pathways leading to expression
of genes involved in the improvement of fiber bioenergetics [80], upregulation of anti-
oxidant defenses [81, 82] and contractile properties (protein synthesis [83] and satellite
cell differentiation [84]), attenuating or preventing age-related fiber atrophy and
apoptosis and consequently, the loss of muscle mass, strength and physical performance
[79]. Furthermore, it is possible that both increases in moderate-to-vigorous and light
physical activity (the latter probably implying sedentary behavior reductions) might
promote a healthier muscle fiber and adipocyte secretomes, putatively exerting local and

GENERAL DISCUSSION
143
remote (nervous, cardiovascular and skeletal systems) beneficial effects in an auto, para,
endocrine fashion, prompting whole body health [85–87].
Nevertheless, these hypotheses are mere assumptions, that might be confirmed by future
research.
In summary, the results of Study 1 support available evidence of the association between
higher intensities of physical activity and sarcopenia and its determinants, although the
presence of some mixed findings in previous studies should be acknowledged. These
inconsistencies might be the result of specific features of individual populations, the use
of different methods to estimate physical behaviors (self-reporting vs objective
instruments) and sarcopenia definitions (only muscle mass-based vs. more
comprehensive sarcopenia definitions including muscle mass and performance) and cut-
points and instruments (reference, population-specific) for muscle mass (bioimpedance,
dual-X-ray absorptiometry scan, anthropometric measures, height and weight derived
equations), physical performance (usual gait speed, fast gait speed, Up and go Test,
Short Physical Performance Battery) and strength measurement (handgrip strength, leg
strength, 30-seconds Chair Stand Test…) [23].

GENERAL DISCUSSION
144
Late-life PA trajectories and healthy ageing (Chapter 2)
The sub-clinical physiological changes occurring during ageing together with the
accumulation of chronic conditions manifest in the form of functional decline and
increased risk and premature advent of the so-called age-related adverse outcomes
(mortality, hospitalization, disability, and institutionalization).
Physical activity promotes ample health benefits and has long been recognized as an
important determinant of survival [88–91].
The salutary effects of greater levels of physical activity on body physiological systems
have been traduced increased life- and healthspan [88, 92]. These observations might be
explained from the fact that lifelong physical behaviors are key factors in the
development of chronic diseases and determine the pace of derange of physiological
systems along ageing. Hence physical activity and sedentary behavior might be key
factors of intrinsic capacity at older ages and therefore, of healthy ageing [93, 94].
Previous research tended to use a single-point estimation of physical activity as
exposure. Nevertheless, physical activity behaviors are strikingly volatile, especially
among older adults [95–97], and therefore, the study of physical activity evolution as a
predictor of healthy ageing might be of high interest. Physical activity intensity and
volume have been seen to be maintained from mild life into old adulthood, where both
suffer a sharp decline around the age of 70 [98]. Despite mean population values point
to these generalized decreases in physical activity, inter-individual variability might
exist within populations [99], and different rates of decline and even late life physical
activity-increasing trajectories might condition different physiological ageing, and
hence, the occurrence of adverse events.
The Chapter 2 of this thesis dissertation presents the results of Study 2 [100], whose aim
was to explore the presence of different late-life physical activity evolution patterns in
the Toledo Study of Healthy Ageing and their associations with relevant adverse
outcomes in the older populations (mortality, disability, and hospitalization). Briefly,
our study demonstrates the presence of different physical activity trajectories within the
Toledo Study of Healthy Ageing sample, differing both in the baseline levels and
evolution; and the association between maintenance of high physical activity levels and
healthy ageing, characterized by lower rate of adverse events. Furthermore, it suggests
that increases in physical activity might exert benefits in the disability dominion,

GENERAL DISCUSSION
145
irrespective of baseline levels, but fail at reducing death or hospitalization rates, which
reinforces the potential of physical activity benefits even in the most inactive older
adults.
Late-life physical activity and mortality
Our results contribute to previous evidence linking single-time point physical activity
estimates and survival in older adult cohorts [101–103]. The protective role of physical
activity seems to follow a dose-response pattern, with the maximum reductions in the
likelihood of early-mortality at higher intensity and volume, showing some saturation
in the upper limits [89, 90] but pointing to overt benefits gained from the lowest physical
activity participation, compared to no engagement [101, 104–109]. Recent research
incorporating objectively assessed physical activity corroborated such findings [92, 106,
110]. Interestingly, physical activity might outpace or attenuate classical mortality risk
factors at advanced ages, such as the presence of multiple diseases [110, 111], disability
[112] or cardiovascular disease [113]. In fact, physical activity-associated reductions in
mortality seems to be greater at older ages [89, 114]
With regards to studies exploring late-life physical activity evolution using a crude
physical activity categorical classification, Stessman et al. showed that both
prospectively keeping up high physical activity levels and becoming active from
sedentary was associated with reduced mortality at follow-up, whereas reducing
physical activity or remaining sedentary conferred an increased risk [115].
Wannamethee et al. found similar results in the British Regional Heart Study [109].
Recent works have incorporated data-driven methods in order to identify trajectories of
physical activity over the life course. Overall, these studies point to a beneficial effect of
maintaining baseline physical activity levels, compared to reducing or showing
persistently low physical activity on all-cause and cause-specific mortality. Interestingly,
prospectively increasing physical activity seems to contribute to survival, with these
physical activity prospective patterns reaching risk reductions similar to those maintain
physical activity levels, irrespective of baseline values [114, 116]. However, these works
focused on physical activity evolution from early adulthood to mild-life and followed
individuals up until early late-life.
To our knowledge, only two studies have restricted the study of the evolution of physical
activity to late-life using data-driven methods.

GENERAL DISCUSSION
146
Using latent class analysis, Xue et al., found the presence of four 12-year physical activity
trajectories within the Women Health and Aging Study (n=443 women; mean age 73,9 ±
2,8 years of age) and found a stepwise association between physical activity trajectories
and mortality, with an increased risk in those in the persistent low physical activity level
trajectory (HR=3,34; 95%CI=1,2-4,59) and those in the “fast declining” trajectory
(HR=2,34; 95%CI=1,72-6,47). Interestingly, those maintaining moderate physical activity
levels did not show an excess risk of mortality when compared to those “always active”
[117]. More recently, Laddu et al. identified three physical activity-decreasing
trajectories in a sample of older men (mean age=79,24 ± 5,2) that differed mainly in
baseline levels. Belonging to the trajectories with higher baseline physical activity
engagement was associated with reductions in the odds of dying during the average 7-
year follow-up in a dose response fashion (HR=0,78;95%CI=0,7-0,88 and HR=0,69;
95%CI=0,57-0,83 for the moderate- and high-physical activity levels at baseline-
trajectories, respectively), compared to the baseline low-physical activity trajectory [99].
The results in Study 2 are consistent with these observations pointing to a positive
association between physical activity maintenance/increase along follow-up and
survival, given that in our study, only the group that showed reductions in physical
activity from low levels showed an increased risk for mortality in multivariate models,
compared to those belonging to trajectories of physical activity increase and
maintenance.
Late-life physical activity and hospitalizations
The accumulation of comorbidities and sub-clinical processes mediated by physiological
reserves exhaustion associated with ageing conditions an increased risk of hospital
admission and longer stays, which drives an increased hospitalization-associated
healthcare cost [118, 119]. A current key public health issue is the increased stress that a
growing ageing population poses on public healthcare systems. But besides the
economic burden of this adverse event, hospitalizations have been associated with sharp
functional declines and increased risk for nosocomial disability among older adults
[120], resulting from forced inactivity [121], which produces sharp reductions in
different body systems functioning [122].
Therefore, the identification of strategies for avoiding the development of conditions or
paroxysmal events (such as falls or fractures) leading to hospital admission acquires
special relevance. As described before, physical activity attenuates age-related
GENERAL DISCUSSION
147
physiological declines and is protective against chronic conditions development and
aggravation [123] and the occurrence of falls [124, 125] and might therefore reduce rates
of hospital admission.
Our results are in line with scant previous research pointing to a protective role of
physical activity for hospitalizations [126, 127]. Some studies also suggested an
association between physical activity and shorter hospital admissions [128, 129], which
might further reduce hospitalization-related healthcare costs and diminish the potential
exposition to nosocomial disability and infections.
Nevertheless, none of previous studies exploring physical activity-healthcare utilization
associations included physical activity evolution as the exposure variable.
Late-life physical activity and disability
In the context of ageing populations, and with the premise of the need of promoting a
free-of-disability ageing, the exploration of age-related functional decline-related factors
is of paramount importance, in order to develop preventive strategies [130]. The World
Health Organization defines disability as “an umbrella term for impairments, activity
limitations and participation restrictions” [131]. Disability has often be captured as the
difficulty for performing activities of daily living, that represent severe limitations,
threatening the ability of an individual to live independently, and being associated with
early mortality and burden on public health and social services [132].
In the development of disability, several intrinsic and extrinsic and modifiable and non-
modifiable factors are believed to intervene [133]. Among them, physical activity has
outstanded as a critical protective factor against functional decline in epidemiological
studies [134–136], often captured as ability for activities of daily living [134].
Likewise in the case of mortality, virtually all studies exploring physical activity-
disability associations at older ages used single-time physical activity estimations as the
exposure variable [137]. In these studies, physical activity was associated with better
functional status captured as ability to perform basic activities of daily living [137–142],
instrumental activities of daily living [137, 139, 141, 142] or mobility performance [141–
143].
Recent studies incorporating accelerometers for physical activity estimation point to a
positive association between moderate-to-vigorous physical activity and lower rates of

GENERAL DISCUSSION
148
disability, in a volume linear dose-response manner [137, 144–146]. In the case of light
physical activity mixed results point to a protective effect when it is accumulated <10
minutes but not in longer bouts, which can be a reflection of the observed effect of
breaking sedentary behaviour [147] rather than the direct effects of light physical activity
[144], given the existing correlation between short light physical activity bouts and
sedentary breaks [63].
Until today, only one study approached associations between physical activity and
disability using data-driven methods to identify different trajectories. Yu et al., identified
four 11-year leisure activity trajectories (consistent-high, decreasers, increasers and
consistent-low) by using a growth mixture modelling approach in a cohort of older
adults (aged >60). Their consistent-high and increasers trajectory groups showed
significantly better function, whereas decreasers experienced a greater functional decline
than the consistent low leisure activities at follow-up [148]. In their study, functional
ability was captured through a cluster of 12-item scale (including 6 basic activities of
daily living and 6 instrumental activities of daily living), whereas leisure activities
corresponded to a cluster of 8 daily living chores including sedentary and strenuous
physical activities, which might poorly capture actual physical behaviors or energy
expenditure. Interestingly, in addition to the high-consistent leisure activities, those in
the increased activity trajectory group showed better functional ability than those in the
low-consistent or decreasing longitudinal patterns, which is compatible with our results
showing the potential of increasing physical activity for disability onset prevention,
irrespective of baseline levels.
Recent research by Laddu et al., using data from two cohort of older men (Osteoporotic
fractures in men) [149] and women (Women’s Health Initiative) [150] found a lower rate
of decline in physical performance measures (gait, speed, grip strength and the chair-
stand test) in subjects belonging to late-life trajectories of high physical activity
(measured with the Physical Activity Scale for the Elderly) along time. The observed
preservation of physical function by sustained physical activity is compatible with the
attenuation of the physiological losses that concurrently mediate the progression from
functional decline to overt disability, hypothetically, by preserving muscle strength,
balance, and mobility [151, 152]. Therefore, the results by Laddu et al. might be
complementary to our observations, pointing to an association between higher physical
activity maintenance along ageing on the preservation of the physical domain of intrinsic

GENERAL DISCUSSION
149
capacity, that together with mental capacities, also positively influenced by higher
physical activity continuance [153], determines a retention of functional ability.
From the clinical point of view, the reduction in the progression of functional decline
might acquire special relevance. It is well known that prodromic phases are much more
reversable than more advanced stages of functional decline [154, 155]. Hence, the
reduction in the pace of disability progression might expand the opportunities for
functional gain through interventions. Our study contributes to the scarce previous
evidence showing associations between higher physical activity levels (both in the form
of moderate-to-vigorous and light intensities) and lower odds of presenting greater
levels of disability at follow-up [134, 145].
Notwithstanding the fact that the link between physical activity and functional ability
arise from well-designed and at times very large prospective cohort studies and are
pathophysiologically plausible, experimental research is lacking. Unfortunately,
randomizing populations to be physically active over longer periods of time and
comparing them to others that were instructed to remain inactive is infeasible.
Recently, well-powered randomized clinical trials have been designed to evaluate the
effectiveness of sustained participation in physical activity (usually based on current
physical activity recommendations) and disability development in older adults at risk of
disability. [156, 157]. In particular, the LIFE study (clinicaltrials.gov identifier:
NCT01072500), which recruited 1635 American older adults (mean age=78,9 ± 5,2) at risk
of mobility disability (Short Physical Performance Battery ≤ 9), showed that those
randomized to the intervention program (multicomponent exercise comprising aerobic,
lower limb-strengthening, balance and flexibility domains) experienced significantly
less mobility disability that those in the control group during 2,6 years of follow-up.
Mobility disability is a crucial determinant of functional independence [158] and hence
its prevention might directly relate to the ability to carry activities of daily living. A post-
hoc analysis showed a dose-response effect of increase in physical activity and reduced
mobility disability, which is consistent with our findings pointing to the beneficial effect
of late-life increases in physical activity on disability [159]. Song et al., also found
functional improvements after 2-year physical activity increases among previously
inactive older adults with osteoarthritis, even when not reaching the public health
recommended levels [157].
GENERAL DISCUSSION
150
Late-life sedentary behaviour and adverse events
A relevant pitfall of our study using the Physical Scale for the Elderly for physical
behavior characterization is the inability of this instrument for capturing sedentary
behaviors and its limited potential for distinct intensities of physical activity.
As mentioned in previous sections, activities eliciting very low energy expenditure in a
reclining or sitting position might play a fundamental and independent role in the
development of chronic conditions and the rate of functional decline [160, 161],
especially among older adults, that are the highest sedentary age-group (65-80% of
waking hours) [162, 163].
Epidemiological evidence has pointed to an association of greater amounts of sedentary
behaviour and adverse outcomes in cohorts of older adults [164, 165].
Previous research exploring possible links between sedentary behavior and survival in
older adults has yielded mixed results, probably due to the use of different instruments
for assessing sedentary behaviors [166]. A recent systematic review and meta-regression
of accelerometer-based studies showed a dose-response effect in the association between
sedentary behavior and mortality [167], but acknowledged that, as observed in studies
controlling for time in moderate-to-vigorous physical activity, the excess risk might be
eliminated by increases in the latter, as previously described in younger cohorts [88],
since the inclusion of moderate-to-vigorous physical activity as a covariate tends to
attenuate the associations [106, 168]. Nevertheless, in some studies such attenuation did
not appear and sedentary behavior stood as an independent risk factor [92, 169]. These
inconsistencies might mainly result from the misclassification of substantial proportion
of time in sedentary behavior/moderate-to-vigorous physical activity estimations due
to the use of several cut-points when using accelerometry [165]. Irrespective of the true
existence of a buffering effect of physical activity for sedentary behavior deleterious
influence on survival, it has been suggested that the combination of low levels of
moderate-to-vigorous physical activity and high levels of sedentariness might confer the
highest mortality risk among older adults [161, 170].
Likewise, physical activity, sedentary behavior patterns are believed to change along
late-life [96]. Very few studies have accounted for this fact by cross-classifying sedentary
categories over two time-points. Results pointed to decreased mortality risk for those
remaining lowly sedentary [171–173], with one study also showing benefit from

GENERAL DISCUSSION
151
longitudinally reducing sitting time [173], compared to those increasing time in
sedentary time or remaining highly sedentary, independently of leisure-time physical
activity.
With regards to the associations between sedentary behavior and functional ability,
some recent studies showed an association of greater volume of sitting or reclining
positions and increased odds of presenting with difficulties in activities of daily living,
irrespective of moderate-to-vigorous physical activity levels [145, 146, 174, 175]. These
findings suggest that total sedentary time might play a crucial role in the development
of disability at advanced ages. Interestingly, not only the volume of sedentary behaviors
but the pattern of accumulation might influence disability development. Chen et al.,
showed that breaking sedentary behavior up was associated with lower odds of
presenting difficulties for instrumental activities of daily living. Afterwards, Sardinha et
al. confirmed such findings and expanded evidence to basic, and advanced activities of
daily living independent of moderate-to-vigorous physical activity levels [147, 174].
These observations support the role of sedentary behavior as an independent contributor
to functional decline and therefore, the need of shifting sedentary behavior patterns
towards a reduction of long periods besides increasing moderate-to-vigorous physical
activity levels.
In summary, the results of Study 2 support available evidence linking late-life physical
activity levels maintenance and healthy ageing, characterized by a reduction in the
incidence of adverse outcomes. Unfortunately, given the scarcity of studies including
late-life prospective changes in physical activity and the novel incorporation of data-
driven methods, comparability of our results is limited.

GENERAL DISCUSSION
152
Implications for clinical practice and public health
In the context of globally ageing populations, the prevention of conditions and
physiological changes driving intrinsic capacity decline and leading to burdensome
adverse events such as falls, fractures, hospitalization and disability constitutes a
priority of current medicine. Fortunately, such conditions are partially due to modifiable
lifestyle behaviors and hence, there is a possibility for the modulation of the rate of
physiological reserve and functional decline with ageing.
The findings of the research included in this thesis dissertation contribute to the
unequivocal evidence supporting the role of physical behaviors as critical determinants
of the functional trajectories of ageing. Its implications stretch to clinical practice, public
health and policymaking.
From a clinical perspective the recognition of physical behaviors as key risk factors in
the development of a relevant syndrome with important multiple associated adverse
outcomes (sarcopenia) and the occurrence of relevant late-life adverse events constitutes
a call for the need of accounting for physical behaviors in the processes of anamnesis,
evaluation and management of older populations in routine clinical practice. Since
physical behaviors might be more predictive than classical risk factors at older age, the
assessment of physical behaviors in the clinical scenario might be highly advisable given
that it could assist risk profiling, care planning and tailoring of interventions. Moreover,
physical activity has been suggested as a biological age marker, and hence, a sharp
reduction observed in opportunistic assessments in consecutive medical visits could
constitute a red flag for subsequent exploration of the causes driving such changes.
Given that physical activity increases and sedentary behavior reductions have been
shown to positively impact sub-clinical health processes and prevent the development
of non-communicable conditions, efforts should be made by both healthcare
professionals managing older adults and the relatives to keep older adults as active as
possible and to reduce time spent sitting in daily living and leisure-time activities [94].
Of relevance are the prevention of functional ability decline resulting from increases in
physical activity participation even in those previously inactive, as our results indicate.
Furthermore, physical activity, (preferably in the form of exercise), has recently gain
recognition as a therapeutic agent for a wide range of conditions [176]. Physical activity-
based interventions might act synergistically to or even supersede pharmacological

GENERAL DISCUSSION
153
approaches for the management of chronic diseases, that are more costly and entail
potential adverse side-effects. In a usually multi-morbid older adult population,
polypharmacy, the harmful use of multiple drugs [177], might be reduced by the
adoption of effective and safe non-pharmacological approaches with whole-body
potential, such as exercise [178].
Besides the fragmented individual disease management, current focus of medicine has
shifted to the preservation of function along ageing [179, 180]. Strategies for the
attenuation or elimination of age-related functional decline should target the multi-
systemic physiological deranges that underly body functions impairment and might
ultimately compromise intrinsic capacity. Therefore, physical activity and exercise,
given their whole-body effects have been envisioned as unique and critical candidate
strategies for functional decline prevention [5, 181] .
With regards to free-living physical activity, benefits on older adult’s health seems to
follow a dose-response pattern both in terms of intensity and volume, starting from
slight increases and expanding thereafter. Hence, older adults should be advised to
reach the higher zones of the intensity continuum whenever possible, but the potential
of lesser intensities must be remarked [182]. In addition, encouragement should
emphasize the reductions of prolonged sedentary periods [160, 163].
Out of the scope of this thesis dissertation is the role of exercise-based interventions on
older adult health. Nevertheless, epidemiological and experimental evidence is
unequivocal in the potential of structured physical exercise for healthy ageing
promotion. Individually tailored multicomponent exercise programs, involving
different stimulus (mainly endurance, resistance and balance) have been suggested as
the most effective strategies for healthy ageing [183–185]. Despite the fact that optimal
features of exercise programs for the older adults remain to be elucidated, in general
terms, benefits widely exceed the harms [185]. Therefore, exercise participation should
be counselled and considered as a potential intervention in different sub-populations of
older adults [186].
Possibly, the combination of resistance exercise training [176], embedded in a
multicomponent exercise program (including aerobic exercise and balance training)
[183, 187], increases in free-living moderate to vigorous physical activity, and breaking-
up of sedentary behaviour with light physical activity might be the best option for

GENERAL DISCUSSION
154
healthy ageing, given their synergistic effects [84, 188]. Recently, high-velocity resistance
exercise training (low-moderate loads with high velocity of execution) has gained
recognition as the optimal approach to avoid physical function decline, given the tight
link between muscle power output and the capacity to perform activities of daily living
in older populations and so, might be an interesting and well-tolerated alternative
approach [183, 189].
From our perspective, the current physical activities recommendations that advise
moderate-to-vigorous physical activity [190, 191] are valid in that they generate a frame
for public health messaging. Nevertheless, currently upcoming updates should
emphasize the potential of high-velocity resistance training and the reduction of long-
lasting sedentary activities by means of light physical activity, along with the
establishment of minimum cut-points of volumes of higher intensities activities.
From the economical perspective, the adoption of more active lifestyles leading to
reduced rates of sarcopenia, disability and lower healthcare utilization might have
relevant implications in the sustainability of jeopardized healthcare and social welfare
systems in the context of a growing aged population and reduced support ratios [192].
Therefore, in the sphere of healthcare management and planning, accumulating
evidence linking physical behaviors and health in older populations should be translated
into the real scenario and incentive the setting-up of policies aimed at increasing physical
activity and exercise participation in this population. Providing healthcare providers
specific training, easing of access to exercise facilities and skilled personnel, barriers
elimination for non-structured physical activity participation, and public awareness
increase of the potential of physical activities to promote health may be keystones in the
development of such strategies [193].
Physical activity for sarcopenia management
In the absence of pharmacological interventions for sarcopenia prevention and
management [16, 194, 195] non-pharmacological approaches have arisen as current
unique therapeutic options [16].
In this regard, resistance exercise, has been suggested as the first-line therapy to reverse
muscle mass and function loss, given that it has demonstrated to induce increases in
muscle strength and power, and physical performance improvements in older
populations [196]. Nevertheless, studies exploring the effectiveness of this mode of

GENERAL DISCUSSION
155
exercise in sarcopenic populations in scant and the assumption that resistance exercise
is effective for sarcopenia arises from the generalization of observations in healthy older
adults [197]. Emerging research is restricting the samples to sarcopenic individuals and
recent meta-analyses have shown positive effects of resistance exercise in strength and
physical performance also in older adults with sarcopenia [198–200].
Unfortunately, given the methodological heterogeneity among published studies, the
subsequent application in the clinical setting is limited by uncertainty regarding the
optimal type, volume and intensity of resistance exercise required to optimize the
response [200]. Interestingly, despite the wide variability in exercise response in
heterogenous older populations, there seems to be no non-responders to resistance
exercise, which reinforces the potential of this exercise modality for sarcopenia
management [201].
In any case, before clinical guidelines for the treatment of sarcopenia with exercise can
be established, further research providing more precision with regards to programs
features in populations with diagnosed sarcopenia are needed [101].
In addition, although resistance exercise participation should be advised for both
healthy and at-risk older adults, owing to its well-known benefits besides sarcopenia,
several barriers limit its correct implementation in clinical scenarios and contributes to
the very low adherence in this age-group [202]. Furthermore, older adults’ acceptance of
structured resistance exercise programs might be restricted to scenarios in which
physical function impairments are already present (secondary prevention) [16].
In this context, the potential of free-living physical activity (usually corresponding to
walking activities, the type of physical activity in which older adults engage the most)
as an intervention for sarcopenia prevention/reversal has recently attracted attention
[41]
As reviewed in previous sections, currently available evidence derived from
observational and experimental research indicate that free-living activities such as
walking may play a crucial role as modifiable factors in the modulation of muscle mass,
strength and physical performance losses associated with ageing [24, 28, 31–33, 41, 49,
203].
Consequently, until proper prescription, generalized access to facilities and adherence
to resistance exercise is achieved, effective sarcopenia prevention strategies should

GENERAL DISCUSSION
156
include increased participation in free-living activities in the higher intensity continuum
zone whenever possible, corresponding to moderate-to-vigorous intensity range.
Examples of this activities include fast walking, cycling or swimming [204]. In addition,
lighter physical activities as a means of sedentary activities (sedentary breaks) reduction
might also benefit musculoskeletal health through indirect influences on mechanisms
involved in the pathogenesis of sarcopenia such as increased adiposity, insulin
resistance and low-grade non-functional inflammation [37, 182]. Additionally, the
incorporation of protein supplementation to the physical activity/exercise intervention
plan might have a synergistic effect, especially for those with nutritional deficits [16, 205,
206].
In view of the lack of guidelines for sarcopenia prevention and management through
exercise, the World Health Organization physical activity recommendations for older
adults together with the fulfillment of current protein intake recommendations (1.0-1.2
g protein/kg body weight/day)* might be useful as temporary approaches for
sarcopenia prevention [101, 190].
*An exception concerns older people with severe kidney disease (eGFR<30 mL/min/1.73m2) and not in dialysis treatment should limit protein intake

GENERAL DISCUSSION
157
Future research
Although robust emerging evidence seems to support the pivotal role of physical
behaviors as healthy ageing determinants, there are still several easily identifiable gaps
in knowledge amenable to be addressed by coming research.
There is substantial uncertainty regarding the mutual exclusivity of sedentary behaviors
and physical activity, or in other words, if increased levels of physical activity might
offset high volumes of sedentary behavior. Some previous research has shown that
moderate-to-vigorous physical activity might attenuate, but not fully eliminate the
negative effect of sedentary behaviors on health [88, 161, 207], but further research is
needed for exploring causal links.
Moreover, the potential of different physical behaviors accumulation patterns besides
total volume in different physical behaviors is gaining recognition as a modulator of the
effects of physical behaviors on health. Whether physical activity or sedentary behavior
health effects depend on the duration of the periods in these intensity bands or not
remains a matter of discussion. Whereas physical activity public health
recommendations emphasize the need of 10-minute minimum bout duration of
moderate-to-vigorous physical activity to gain health benefits, such statement lacks a
robust evidence basis. In fact, recent research has pointed to similar mortality risk
reductions and cardiometabolic benefits obtained from shorter sustained intensity bouts
[63, 106]. Moreover, it has been suggested that accumulation of sedentary behavior in
longer time intervals might be more harmful than same total amounts scattered in
shorter periods along the day. To address these advancements in the understanding of
physical behaviors and health associations, new physical behavior metrics have recently
been operationalized (i.e., the number of sedentary breaks, mean life duration of
sedentary behavior bouts), but its incorporation as exposure variables remains scarce
[96, 147, 208].
Despite accelerometers are increasingly being incorporated into large population-based
studies, the validity of the observations substantially relies on the data-handling
processes. One of the most relevant issues is the use of one-size-fits-all cut-points for
intensity categorization, which might inevitably distort estimates and associations with
health-outcomes. Physical behaviors studies using accelerometers should incorporate
age- or disease-group specific intensity cut-points to minimize the inherent inaccuracy

GENERAL DISCUSSION
158
when using reference cut-points to individual physical behaviors estimation, given to
different in energy cost of activities between subjects.
In addition, the use of physical activity and sedentary behaviors evolution as the
exposure variable has been residual in populations of older adults. Given the dynamic
nature of these behaviors among older adults, researchers should try to address this fact
and include physical behaviors evolution as independent variable. Although data-
driven methods do assist in trajectories identification and might be more informative
than crude prospective categorical changes, they have been barely incorporated to
physical behaviors epidemiology, which limits comparability between studies. A
recently designed evolution of group-based trajectory modelling (Group-Based Multi-
Trajectory Modelling) might be highly promising, given that it allows to identify subjects
following similar trajectories in two or more variables, hypothetically allowing for the
joint study of physical activity (i.e. moderate-to-vigorous physical activity) and
sedentary behavior [209].
Sarcopenia research field has been ubiquitously hampered by the absence of a consensus
definition, that has leaded to substantial heterogeneity in sarcopenia operationalizations
among studies. Therefore, between-studies inferences comparability is limited due to
potential differences in the phenotypes captured by different definitions. Current efforts
are being made to generate sarcopenia definition that maximize adverse outcome risk-
profiling [210]. Consequently, future research should attempt to adhere to the use of a
valid and contrasted consensual sarcopenia definition (preferably using standardized
population-specific determinant values), with the aim of eliminating current
heterogeneity and allow for more robust and uniform inferences derived from the
studies.
With regards to the epidemiological association between physical behaviors and
sarcopenia, the deepening in the association between patterns of sedentary behavior
accumulation and musculoskeletal health might be specially appealing, given that long-
lasting sitting periods avoidance in such a sedentary population might have promising
effects, but has not be confirmed by well-powered research [30, 35].
Lastly, of interest are also the associations between physical behaviors and sarcopenic
obesity, a more burdensome condition that pool detrimental consequences of sarcopenia

GENERAL DISCUSSION
159
and obesity, two overlapping conditions that might specially benefit from physical
activity enhancements.
In the pursuit of expanding insights into the features of exercise programs (intensity of
physical activity, duration, frequency and volume) tailored at influencing specific health
processes in older adults with particular features (age, comorbidities, functional status,
medications…), faster and cheaper epidemiological evidence might pave the way and
assist in the generation of experimental research hypothesis [211].
However, laboratory-based and clinical experimental research is needed to contrast
hypothesis generated through observational studies, with the aim of providing
healthcare policymakers, professionals and users with contrasted therapeutic options.
Although resistance exercise training has shown promising results for sarcopenia
management given its effects on its individual components in healthy older adults, little
is known regarding the optimal features of programs or its potential combination with
other exercise types or diet/supplement-based nutritional interventions on functional
outcomes in at-risk older adults [196, 198, 200, 205, 212].
Importantly, there is a lack of studies with long intervention times (>12 weeks) in older
adults with sarcopenia, which in turn precludes the ascertainment of the effectiveness of
such interventions for sarcopenia-related adverse outcomes prevention. Given that such
events (falls, fractures and disability onset) require long periods to occur [124, 125],
randomized clinical trials with long-lasting interventions and follow-up times are
needed, in order to clarify the effectiveness of continued exercise on sarcopenia
secondary prevention. Currently the effectiveness of exercise is assumed from the
translation of results of studies investigating the effects of long-lasting resistance and
multicomponent exercise [213] programs in cohorts of older adults without a sarcopenia
diagnosis [214, 215]. Despite biological plausibility-and practically common sense-may
allow for translation of these changes to reduced number of falls and functional decline
avoidance in older adults with prevalent sarcopenia, future research should confirm
such assumptions [156, 216].
Home-based exercise programs have been postulated as possible solutions to overcome
one of the barriers to exercise adherence among older adults, the need to commute to the
exercise facilities. Currently, some options exist [217, 218], but the effectiveness of these
programs should be ascertained in sarcopenic populations by experimental research.

GENERAL DISCUSSION
160
In addition, although biologically plausible, described molecular mechanisms
underlying increasing physical activity and sedentary behavior reductions benefits on
health remain obscure and should be subject of further investigation [160]. Since the
understanding of intracellular/extracellular processes underlying sarcopenia
development and adaptations to exercise is poor, research incorporating recent genomic,
metabolomic, transcriptomics, and proteomics technologies would be of high interest in
order to identify potential novel molecular targets of interventions aimed at promoting
healthy ageing [219, 220].

GENERAL DISCUSSION
161
General Discussion References
[1] World Population Prospects 2019: Data Booklet, https://www.un-ilibrary.org/population-and-demography/world-population-prospects-2019-data-booklet_3e9d869f-en (accessed 17 March 2020).
[2] Angulo J, El Assar M, Rodríguez-Mañas L. Frailty and sarcopenia as the basis for the phenotypic manifestation of chronic diseases in older adults. Mol Aspects Med 2016; 50: 1–32.
[3] Harridge SDR, Lazarus NR. Physical Activity, Aging, and Physiological Function. Physiology (Bethesda) 2017; 32: 152–161.
[4] Lazarus NR, Harridge SDR. The Inherent Human Aging Process and the Facilitating Role of Exercise. Front Physiol 2018; 9: 1135.
[5] Garatachea N, Pareja-Galeano H, Sanchis-Gomar F, et al. Exercise attenuates the major hallmarks of aging. Rejuvenation Res 2015; 18: 57–89.
[6] Mayhew AJ, Amog K, Phillips S, et al. The prevalence of sarcopenia in community-dwelling older adults, an exploration of differences between studies and within definitions: a systematic review and meta-analyses. Age Ageing 2019; 48: 48–56.
[7] Morley JE, Malmstrom TK, Rodriguez-Mañas L, et al. Frailty, sarcopenia and diabetes. J Am Med Dir Assoc 2014; 15: 853–859.
[8] Ruiz JR, Sui X, Lobelo F, et al. Association between muscular strength and mortality in men: prospective cohort study. BMJ 2008; 337: a439.
[9] Yang J, Christophi CA, Farioli A, et al. Association Between Push-up Exercise Capacity and Future Cardiovascular Events Among Active Adult Men. JAMA Netw Open 2019; 2: e188341.
[10] Yeung SSY, Reijnierse EM, Pham VK, et al. Sarcopenia and its association with falls and fractures in older adults: A systematic review and meta‐analysis. J Cachexia Sarcopenia Muscle 2019; 10: 485–500.
[11] Kelley GA, Kelley KS. Is sarcopenia associated with an increased risk of all-cause mortality and functional disability? Exp Gerontol 2017; 96: 100–103.
[12] Liu P, Hao Q, Hai S, et al. Sarcopenia as a predictor of all-cause mortality among community-dwelling older people: A systematic review and meta-analysis. Maturitas 2017; 103: 16–22.
[13] Sim M, Prince RL, Scott D, et al. Sarcopenia Definitions and Their Associations With Mortality in Older Australian Women. J Am Med Dir Assoc 2019; 20: 76-82.e2.
[14] Janssen I, Shepard DS, Katzmarzyk PT, et al. The healthcare costs of sarcopenia in the United States. J Am Geriatr Soc 2004; 52: 80–85.
[15] Cruz-Jentoft AJ, Landi F, Topinková E, et al. Understanding sarcopenia as a geriatric syndrome. Curr Opin Clin Nutr Metab Care 2010; 13: 1–7.

GENERAL DISCUSSION
162
[16] Dent E, Morley JE, Cruz-Jentoft AJ, et al. International Clinical Practice Guidelines for Sarcopenia (ICFSR): Screening, Diagnosis and Management. J Nutr Health Aging 2018; 22: 1148–1161.
[17] Migueles JH, Cadenas-Sanchez C, Ekelund U, et al. Accelerometer Data Collection and Processing Criteria to Assess Physical Activity and Other Outcomes: A Systematic Review and Practical Considerations. Sports Med 2017; 47: 1821–1845.
[18] Mekary RA, Willett WC, Hu FB, et al. Isotemporal substitution paradigm for physical activity epidemiology and weight change. Am J Epidemiol 2009; 170: 519–527.
[19] McLean RR, Shardell MD, Alley DE, et al. Criteria for clinically relevant weakness and low lean mass and their longitudinal association with incident mobility impairment and mortality: the foundation for the National Institutes of Health (FNIH) sarcopenia project. J Gerontol A Biol Sci Med Sci 2014; 69: 576–583.
[20] Studenski SA, Peters KW, Alley DE, et al. The FNIH sarcopenia project: rationale, study description, conference recommendations, and final estimates. J Gerontol A Biol Sci Med Sci 2014; 69: 547–558.
[21] Cruz-Jentoft AJ, Bahat G, Bauer J, et al. Sarcopenia: revised European consensus on definition and diagnosis. Age Ageing 2019; 48: 601.
[22] Sánchez-Sánchez JL, Mañas A, García-García FJ, et al. Sedentary behaviour, physical activity, and sarcopenia among older adults in the TSHA: isotemporal substitution model. J Cachexia Sarcopenia Muscle 2019; 10: 188–198.
[23] Steffl M, Bohannon RW, Sontakova L, et al. Relationship between sarcopenia and physical activity in older people: a systematic review and meta-analysis. Clin Interv Aging 2017; 12: 835–845.
[24] Tyrovolas S, Koyanagi A, Olaya B, et al. Factors associated with skeletal muscle mass, sarcopenia, and sarcopenic obesity in older adults: a multi-continent study. J Cachexia Sarcopenia Muscle 2016; 7: 312–321.
[25] Rosique-Esteban N, Babio N, Díaz-López A, et al. Leisure-time physical activity at moderate and high intensity is associated with parameters of body composition, muscle strength and sarcopenia in aged adults with obesity and metabolic syndrome from the PREDIMED-Plus study. Clin Nutr 2019; 38: 1324–1331.
[26] Volpato S, Bianchi L, Cherubini A, et al. Prevalence and clinical correlates of sarcopenia in community-dwelling older people: application of the EWGSOP definition and diagnostic algorithm. J Gerontol A Biol Sci Med Sci 2014; 69: 438–446.
[27] Hai S, Cao L, Wang H, et al. Association between sarcopenia and nutritional status and physical activity among community-dwelling Chinese adults aged 60 years and older. Geriatr Gerontol Int. Epub ahead of print 11 February 2017. DOI: 10.1111/ggi.13001.

GENERAL DISCUSSION
163
[28] Mijnarends DM, Koster A, Schols JMGA, et al. Physical activity and incidence of sarcopenia: the population-based AGES-Reykjavik Study. Age Ageing 2016; 45: 614–620.
[29] Smith L, Tully M, Jacob L, et al. The Association Between Sedentary Behavior and Sarcopenia Among Adults Aged ≥65 Years in Low- and Middle-Income Countries. Int J Environ Res Public Health; 17. Epub ahead of print 05 2020. DOI: 10.3390/ijerph17051708.
[30] Gianoudis J, Bailey CA, Daly RM. Associations between sedentary behaviour and body composition, muscle function and sarcopenia in community-dwelling older adults. Osteoporos Int 2015; 26: 571–579.
[31] Aggio DA, Sartini C, Papacosta O, et al. Cross-sectional associations of objectively measured physical activity and sedentary time with sarcopenia and sarcopenic obesity in older men. Prev Med 2016; 91: 264–272.
[32] Park H, Park S, Shephard RJ, et al. Yearlong physical activity and sarcopenia in older adults: the Nakanojo Study. Eur J Appl Physiol 2010; 109: 953–961.
[33] Scott D, Johansson J, Gandham A, et al. Associations of accelerometer-determined physical activity and sedentary behavior with sarcopenia and incident falls over 12 months in community-dwelling Swedish older adults. Journal of Sport and Health Science. Epub ahead of print 5 February 2020. DOI: 10.1016/j.jshs.2020.01.006.
[34] Westbury LD, Dodds RM, Syddall HE, et al. Associations Between Objectively Measured Physical Activity, Body Composition and Sarcopenia: Findings from the Hertfordshire Sarcopenia Study (HSS). Calcif Tissue Int 2018; 103: 237–245.
[35] Reid N, Healy GN, Gianoudis J, et al. Association of sitting time and breaks in sitting with muscle mass, strength, function, and inflammation in community-dwelling older adults. Osteoporos Int 2018; 29: 1341–1350.
[36] Foong YC, Chherawala N, Aitken D, et al. Accelerometer-determined physical activity, muscle mass, and leg strength in community-dwelling older adults. J Cachexia Sarcopenia Muscle 2016; 7: 275–283.
[37] Bann D, Hire D, Manini T, et al. Light Intensity physical activity and sedentary behavior in relation to body mass index and grip strength in older adults: cross-sectional findings from the Lifestyle Interventions and Independence for Elders (LIFE) study. PLoS ONE 2015; 10: e0116058.
[38] Rojer AGM, Reijnierse EM, Trappenburg MC, et al. Instrumented Assessment of Physical Activity Is Associated With Muscle Function but Not With Muscle Mass in a General Population. J Aging Health 2018; 30: 1462–1481.
[39] Yasunaga A, Shibata A, Ishii K, et al. Associations of sedentary behavior and physical activity with older adults’ physical function: an isotemporal substitution approach. BMC Geriatr 2017; 17: 280.
[40] Liao C-D, Tsauo J-Y, Lin L-F, et al. Effects of elastic resistance exercise on body composition and physical capacity in older women with sarcopenic obesity: A

GENERAL DISCUSSION
164
CONSORT-compliant prospective randomized controlled trial. Medicine (Baltimore) 2017; 96: e7115.
[41] Brightwell CR, Markofski MM, Moro T, et al. Moderate‐intensity aerobic exercise improves skeletal muscle quality in older adults. Transl Sports Med 2019; 2: 109–119.
[42] Lee H, Kim I-G, Sung C, et al. Exercise training increases skeletal muscle strength independent of hypertrophy in older adults aged 75 years and older. Geriatr Gerontol Int 2019; 19: 265–270.
[43] Wang DXM, Yao J, Zirek Y, et al. Muscle mass, strength, and physical performance predicting activities of daily living: a meta-analysis. Journal of Cachexia, Sarcopenia and Muscle 2020; 11: 3–25.
[44] Kim YH, Kim K-I, Paik N-J, et al. Muscle strength: A better index of low physical performance than muscle mass in older adults. Geriatr Gerontol Int 2016; 16: 577–585.
[45] Mikkelsen UR, Couppé C, Karlsen A, et al. Life-long endurance exercise in humans: circulating levels of inflammatory markers and leg muscle size. Mech Ageing Dev 2013; 134: 531–540.
[46] Crane JD, Macneil LG, Tarnopolsky MA. Long-term aerobic exercise is associated with greater muscle strength throughout the life span. J Gerontol A Biol Sci Med Sci 2013; 68: 631–638.
[47] Sheffield-Moore M, Yeckel CW, Volpi E, et al. Postexercise protein metabolism in older and younger men following moderate-intensity aerobic exercise. Am J Physiol Endocrinol Metab 2004; 287: E513-522.
[48] Bell KE, Séguin C, Parise G, et al. Day-to-Day Changes in Muscle Protein Synthesis in Recovery From Resistance, Aerobic, and High-Intensity Interval Exercise in Older Men. J Gerontol A Biol Sci Med Sci 2015; 70: 1024–1029.
[49] Savikangas T, Tirkkonen A, Alen M, et al. Associations of physical activity in detailed intensity ranges with body composition and physical function. a cross-sectional study among sedentary older adults. Eur Rev Aging Phys Act 2020; 17: 4.
[50] Freedson PS, Melanson E, Sirard J. Calibration of the Computer Science and Applications, Inc. accelerometer. Med Sci Sports Exerc 1998; 30: 777–781.
[51] Matthew CE. Calibration of accelerometer output for adults. Med Sci Sports Exerc 2005; 37: S512-522.
[52] Troiano RP, Berrigan D, Dodd KW, et al. Physical activity in the United States measured by accelerometer. Med Sci Sports Exerc 2008; 40: 181–188.
[53] Barnett A, Smith B, Lord SR, et al. Community-based group exercise improves balance and reduces falls in at-risk older people: a randomised controlled trial. Age Ageing 2003; 32: 407–414.
GENERAL DISCUSSION
165
[54] Aguilar-Farías N, Brown WJ, Peeters GMEEG. ActiGraph GT3X+ cut-points for identifying sedentary behaviour in older adults in free-living environments. J Sci Med Sport 2014; 17: 293–299.
[55] Mañas A, Pozo-Cruz BD, Rodríguez-Gómez I, et al. Can Physical Activity Offset the Detrimental Consequences of Sedentary Time on Frailty? A Moderation Analysis in 749 Older Adults Measured With Accelerometers. J Am Med Dir Assoc 2019; 20: 634-638.e1.
[56] Aspvik NP, Viken H, Zisko N, et al. Are Older Adults Physically Active Enough - A Matter of Assessment Method? The Generation 100 Study. PLoS ONE 2016; 11: e0167012.
[57] Beauchet O, Allali G, Montero-Odasso M, et al. Motor phenotype of decline in cognitive performance among community-dwellers without dementia: population-based study and meta-analysis. PLoS ONE 2014; 9: e99318.
[58] Clark DJ. Automaticity of walking: functional significance, mechanisms, measurement and rehabilitation strategies. Front Hum Neurosci 2015; 9: 246.
[59] Montero-Odasso M, Verghese J, Beauchet O, et al. Gait and cognition: a complementary approach to understanding brain function and the risk of falling. J Am Geriatr Soc 2012; 60: 2127–2136.
[60] Wennberg AMV, Savica R, Mielke MM. Association between Various Brain Pathologies and Gait Disturbance. Dement Geriatr Cogn Disord 2017; 43: 128–143.
[61] Spartano NL, Davis-Plourde KL, Himali JJ, et al. Association of Accelerometer-Measured Light-Intensity Physical Activity With Brain Volume: The Framingham Heart Study. JAMA Netw Open 2019; 2: e192745.
[62] Galmes-Panades AM, Varela-Mato V, Konieczna J, et al. Isotemporal substitution of inactive time with physical activity and time in bed: cross-sectional associations with cardiometabolic health in the PREDIMED-Plus study. Int J Behav Nutr Phys Act 2019; 16: 137.
[63] Jefferis BJ, Parsons TJ, Sartini C, et al. Does duration of physical activity bouts matter for adiposity and metabolic syndrome? A cross-sectional study of older British men. Int J Behav Nutr Phys Act; 13. Epub ahead of print 15 March 2016. DOI: 10.1186/s12966-016-0361-2.
[64] Kalinkovich A, Livshits G. Sarcopenic obesity or obese sarcopenia: A cross talk between age-associated adipose tissue and skeletal muscle inflammation as a main mechanism of the pathogenesis. Ageing Res Rev 2017; 35: 200–221.
[65] Rossi AP, Bianchi L, Volpato S, et al. Dynapenic Abdominal Obesity as a Predictor of Worsening Disability, Hospitalization, and Mortality in Older Adults: Results From the InCHIANTI Study. J Gerontol A Biol Sci Med Sci 2017; 72: 1098–1104.
[66] Prince SA, Cardilli L, Reed JL, et al. A comparison of self-reported and device measured sedentary behaviour in adults: a systematic review and meta-analysis. International Journal of Behavioral Nutrition and Physical Activity 2020; 17: 31.

GENERAL DISCUSSION
166
[67] Abete I, Konieczna J, Zulet MA, et al. Association of lifestyle factors and inflammation with sarcopenic obesity: data from the PREDIMED-Plus trial. J Cachexia Sarcopenia Muscle 2019; 10: 974–984.
[68] Barbat-Artigas S, Garnier S, Joffroy S, et al. Caloric restriction and aerobic exercise in sarcopenic and non-sarcopenic obese women: an observational and retrospective study. J Cachexia Sarcopenia Muscle 2016; 7: 284–289.
[69] Dumuid D, Pedišić Ž, Stanford TE, et al. The compositional isotemporal substitution model: A method for estimating changes in a health outcome for reallocation of time between sleep, physical activity and sedentary behaviour. Stat Methods Med Res 2019; 28: 846–857.
[70] Lerma NL, Cho CC, Swartz AM, et al. Isotemporal Substitution of Sedentary Behavior and Physical Activity on Function. Med Sci Sports Exerc 2018; 50: 792–800.
[71] Higueras-Fresnillo S, de la Cámara MÁ, Cabanas-Sánchez V, et al. Associations of Frailty and Physical Function with a Daily Activities Measured by a Pattern-Recognition Activity Monitor: An Isotemporal Substitution Analysis in the IMPACT65+ Study. J Nutr Health Aging 2020; 24: 55–62.
[72] Ryan DJ, Wullems JA, Stebbings GK, et al. Segregating the Distinct Effects of Sedentary Behavior and Physical Activity on Older Adults’ Cardiovascular Profile: Part 2-Isotemporal Substitution Approach. J Phys Act Health 2018; 15: 537–542.
[73] Wei J, Xie L, Song S, et al. Isotemporal substitution modeling on sedentary behaviors and physical activity with depressive symptoms among older adults in the U.S.: The national health and nutrition examination survey, 2007-2016. J Affect Disord 2019; 257: 257–262.
[74] Fanning J, Porter G, Awick EA, et al. Replacing sedentary time with sleep, light, or moderate-to-vigorous physical activity: Effects on self-regulation and executive functioning. J Behav Med 2017; 40: 332–342.
[75] Nagai K, Tamaki K, Kusunoki H, et al. Isotemporal substitution of sedentary time with physical activity and its associations with frailty status. Clin Interv Aging 2018; 13: 1831–1836.
[76] Mañas A, Del Pozo-Cruz B, Guadalupe-Grau A, et al. Reallocating Accelerometer-Assessed Sedentary Time to Light or Moderate- to Vigorous-Intensity Physical Activity Reduces Frailty Levels in Older Adults: An Isotemporal Substitution Approach in the TSHA Study. J Am Med Dir Assoc 2018; 19: 185.e1-185.e6.
[77] Godin J, Blodgett JM, Rockwood K, et al. Replacing Sedentary Time with Light or Moderate-Vigorous Physical Activity Across Levels of Frailty. J Aging Phys Act 2019; 1–19.
[78] Egan B, Zierath JR. Exercise metabolism and the molecular regulation of skeletal muscle adaptation. Cell Metab 2013; 17: 162–184.

GENERAL DISCUSSION
167
[79] Angulo J, El Assar M, Álvarez-Bustos A, et al. Physical activity and exercise: Strategies to manage frailty. Redox Biology 2020; 101513.
[80] Leick L, Lyngby SS, Wojtasewski JF, et al. PGC-1α is required for training-induced prevention of age-associated decline in mitochondrial enzymes in mouse skeletal muscle. Experimental Gerontology 2010; 45: 336–342.
[81] Di Meo S, Napolitano G, Venditti P. Mediators of Physical Activity Protection against ROS-Linked Skeletal Muscle Damage. International Journal of Molecular Sciences 2019; 20: 3024.
[82] Joseph A-M, Adhihetty PJ, Leeuwenburgh C. Beneficial effects of exercise on age-related mitochondrial dysfunction and oxidative stress in skeletal muscle. J Physiol (Lond) 2016; 594: 5105–5123.
[83] Viña J, Rodriguez‐Mañas L, Salvador‐Pascual A, et al. Exercise: the lifelong supplement for healthy ageing and slowing down the onset of frailty. J Physiol 2016; 594: 1989–1999.
[84] Moro T, Brightwell CR, Volpi E, et al. Resistance exercise training promotes fiber type-specific myonuclear adaptations in older adults. J Appl Physiol 2020; 128: 795–804.
[85] Gomarasca M, Banfi G, Lombardi G. Myokines: The endocrine coupling of skeletal muscle and bone. Adv Clin Chem 2020; 94: 155–218.
[86] Pedersen BK. Muscles and their myokines. J Exp Biol 2011; 214: 337–346.
[87] Arai Y, Kamide K, Hirose N. Adipokines and Aging: Findings From Centenarians and the Very Old. Front Endocrinol (Lausanne) 2019; 10: 142.
[88] Ekelund U, Steene-Johannessen J, Brown WJ, et al. Does physical activity attenuate, or even eliminate, the detrimental association of sitting time with mortality? A harmonised meta-analysis of data from more than 1 million men and women. Lancet 2016; 388: 1302–1310.
[89] Löllgen H, Böckenhoff A, Knapp G. Physical activity and all-cause mortality: an updated meta-analysis with different intensity categories. Int J Sports Med 2009; 30: 213–224.
[90] Nocon M, Hiemann T, Müller-Riemenschneider F, et al. Association of physical activity with all-cause and cardiovascular mortality: a systematic review and meta-analysis. Eur J Cardiovasc Prev Rehabil 2008; 15: 239–246.
[91] Stamatakis E, Rogers K, Ding D, et al. All-cause mortality effects of replacing sedentary time with physical activity and sleeping using an isotemporal substitution model: a prospective study of 201,129 mid-aged and older adults. Int J Behav Nutr Phys Act; 12. Epub ahead of print 30 September 2015. DOI: 10.1186/s12966-015-0280-7.

GENERAL DISCUSSION
168
[92] Schmid D, Ricci C, Leitzmann MF. Associations of objectively assessed physical activity and sedentary time with all-cause mortality in US adults: the NHANES study. PLoS ONE 2015; 10: e0119591.
[93] Daskalopoulou C, Koukounari A, Wu Y-T, et al. Healthy ageing trajectories and lifestyle behaviour: the Mexican Health and Aging Study. Sci Rep 2019; 9: 11041.
[94] Gopinath B, Kifley A, Flood VM, et al. Physical Activity as a Determinant of Successful Aging over Ten Years. Sci Rep 2018; 8: 10522.
[95] Varma VR, Dey D, Leroux A, et al. Re-evaluating the effect of age on physical activity over the lifespan. Prev Med 2017; 101: 102–108.
[96] Santos DA, Júdice PB, Magalhães JP, et al. Patterns of accelerometer-derived sedentary time across the lifespan. J Sports Sci 2018; 36: 2809–2817.
[97] Jefferis BJ, Sartini C, Ash S, et al. Trajectories of objectively measured physical activity in free-living older men. Med Sci Sports Exerc 2015; 47: 343–349.
[98] Kats D, Evenson KR, Zeng D, et al. Leisure-time physical activity volume, intensity, and duration from mid- to late-life in U.S. subpopulations by race and sex. The Atherosclerosis Risk In Communities (ARIC) Study. Aging (Albany NY) 2020; 12: 4592–4602.
[99] Laddu DR, Cawthon PM, Parimi N, et al. Trajectories of the relationships of physical activity with body composition changes in older men: the MrOS study. BMC Geriatr 2017; 17: 119.
[100] Sanchez-Sanchez JL, Izquierdo M, Carnicero-Carreño JA, et al. Physical activity trajectories, mortality, hospitalization, and disability in the Toledo Study of Healthy Aging. J Cachexia Sarcopenia Muscle. Epub ahead of print 12 March 2020. DOI: 10.1002/jcsm.12566.
[101] Moore SA, Hrisos N, Errington L, et al. Exercise as a treatment for sarcopenia: an umbrella review of systematic review evidence. Physiotherapy 2019; 107: 189–201.
[102] Muscari A, Bianchi G, Forti P, et al. Physical Activity and Other Determinants of Survival in the Oldest Adults. J Am Geriatr Soc 2017; 65: 402–406.
[103] Hirsch CH, Diehr P, Newman AB, et al. Physical activity and years of healthy life in older adults: results from the cardiovascular health study. J Aging Phys Act 2010; 18: 313–334.
[104] Gebel K, Ding D, Chey T, et al. Effect of Moderate to Vigorous Physical Activity on All-Cause Mortality in Middle-aged and Older Australians. JAMA Intern Med 2015; 175: 970–977.
[105] Ottenbacher AJ, Snih SA, Karmarkar A, et al. Routine physical activity and mortality in Mexican Americans aged 75 and older. J Am Geriatr Soc 2012; 60: 1085–1091.

GENERAL DISCUSSION
169
[106] Jefferis BJ, Parsons TJ, Sartini C, et al. Objectively measured physical activity, sedentary behaviour and all-cause mortality in older men: does volume of activity matter more than pattern of accumulation? Br J Sports Med. Epub ahead of print 12 February 2018. DOI: 10.1136/bjsports-2017-098733.
[107] Paganini-Hill A, Kawas CH, Corrada MM. Activities and mortality in the elderly: the Leisure World cohort study. J Gerontol A Biol Sci Med Sci 2011; 66: 559–567.
[108] Arem H, Moore SC, Patel A, et al. Leisure time physical activity and mortality: a detailed pooled analysis of the dose-response relationship. JAMA Intern Med 2015; 175: 959–967.
[109] Wannamethee SG, Shaper AG, Walker M. Changes in physical activity, mortality, and incidence of coronary heart disease in older men. Lancet 1998; 351: 1603–1608.
[110] LaMonte MJ, Buchner DM, Rillamas-Sun E, et al. Accelerometer-Measured Physical Activity and Mortality in Women Aged 63 to 99. J Am Geriatr Soc 2018; 66: 886–894.
[111] Martinez-Gomez D, Guallar-Castillon P, Garcia-Esquinas E, et al. Physical Activity and the Effect of Multimorbidity on All-Cause Mortality in Older Adults. Mayo Clin Proc 2017; 92: 376–382.
[112] Martinez-Gomez D, Guallar-Castillon P, Higueras-Fresnillo S, et al. Physical Activity Attenuates Total and Cardiovascular Mortality Associated With Physical Disability: A National Cohort of Older Adults. J Gerontol A Biol Sci Med Sci 2018; 73: 240–247.
[113] Martinez-Gomez D, Guallar-Castillon P, Higueras-Fresnillo S, et al. Physical Activity Attenuates Total and Cardiovascular Mortality Associated With Physical Disability: A National Cohort of Older Adults. J Gerontol A Biol Sci Med Sci 2018; 73: 240–247.
[114] Mok A, Khaw K-T, Luben R, et al. Physical activity trajectories and mortality: population based cohort study. BMJ; 365. Epub ahead of print 26 June 2019. DOI: 10.1136/bmj.l2323.
[115] Stessman J, Hammerman-Rozenberg R, Cohen A, et al. Physical activity, function, and longevity among the very old. Arch Intern Med 2009; 169: 1476–1483.
[116] Saint-Maurice PF, Coughlan D, Kelly SP, et al. Association of Leisure-Time Physical Activity Across the Adult Life Course With All-Cause and Cause-Specific Mortality. JAMA Netw Open 2019; 2: e190355.
[117] Xue Q-L, Bandeen-Roche K, Mielenz TJ, et al. Patterns of 12-year change in physical activity levels in community-dwelling older women: can modest levels of physical activity help older women live longer? Am J Epidemiol 2012; 176: 534–543.
[118] Ensrud KE, Kats AM, Schousboe JT, et al. Frailty Phenotype and Healthcare Costs and Utilization in Older Women. J Am Geriatr Soc 2018; 66: 1276–1283.

GENERAL DISCUSSION
170
[119] Fernando SM, McIsaac DI, Perry JJ, et al. Frailty and Associated Outcomes and Resource Utilization Among Older ICU Patients With Suspected Infection. Crit Care Med 2019; 47: e669–e676.
[120] Martínez-Velilla N, Herrero AC, Cadore EL, et al. Iatrogenic Nosocomial Disability Diagnosis and Prevention. J Am Med Dir Assoc 2016; 17: 762–764.
[121] Lim SER, Dodds R, Bacon D, et al. Physical activity among hospitalised older people: insights from upper and lower limb accelerometry. Aging Clin Exp Res 2018; 30: 1363–1369.
[122] Brown CJ, Friedkin RJ, Inouye SK. Prevalence and outcomes of low mobility in hospitalized older patients. J Am Geriatr Soc 2004; 52: 1263–1270.
[123] de Souto Barreto P, Cesari M, Andrieu S, et al. Physical Activity and Incident Chronic Diseases: A Longitudinal Observational Study in 16 European Countries. Am J Prev Med 2017; 52: 373–378.
[124] Gillespie LD, Robertson MC, Gillespie WJ, et al. Interventions for preventing falls in older people living in the community. Cochrane Database Syst Rev 2012; CD007146.
[125] Sherrington C, Fairhall NJ, Wallbank GK, et al. Exercise for preventing falls in older people living in the community. Cochrane Database Syst Rev 2019; 1: CD012424.
[126] Peeters GMEEG, Gardiner PA, Dobson AJ, et al. Associations between physical activity, medical costs and hospitalisations in older Australian women: Results from the Australian Longitudinal Study on Women’s Health. J Sci Med Sport 2018; 21: 604–608.
[127] Simmonds B, Fox K, Davis M, et al. Objectively assessed physical activity and subsequent health service use of UK adults aged 70 and over: a four to five year follow up study. PLoS ONE 2014; 9: e97676.
[128] Sari N. Sports, Exercise, and Length of Stay in Hospitals: Is There a Differential Effect for the Chronically Ill People? Contemporary Economic Policy 2014; 32: 247–260.
[129] Sari N. A short walk a day shortens the hospital stay: physical activity and the demand for hospital services for older adults. Can J Public Health 2010; 101: 385–389.
[130] Cesari M, Prince M, Thiyagarajan JA, et al. Frailty: An Emerging Public Health Priority. J Am Med Dir Assoc 2016; 17: 188–192.
[131] WHO|World report on disability. WHO, http://www.who.int/disabilities/world_report/2011/report/en/ (accessed 27 April 2020).
[132] Fried TR, Bradley EH, Williams CS, et al. Functional disability and health care expenditures for older persons. Arch Intern Med 2001; 161: 2602–2607.

GENERAL DISCUSSION
171
[133] Verbrugge LM, Jette AM. The disablement process. Soc Sci Med 1994; 38: 1–14.
[134] Tak E, Kuiper R, Chorus A, et al. Prevention of onset and progression of basic ADL disability by physical activity in community dwelling older adults: a meta-analysis. Ageing Res Rev 2013; 12: 329–338.
[135] Ćwirlej-Sozańska A, Sozański B, Wiśniowska-Szurlej A, et al. Assessment of Disability and Factors Determining Disability among Inhabitants of South-Eastern Poland Aged 71-80 Years. Biomed Res Int 2018; 2018: 3872753.
[136] Yu H-W, Chen D-R, Chiang T-L, et al. Disability trajectories and associated disablement process factors among older adults in Taiwan. Arch Gerontol Geriatr 2015; 60: 272–280.
[137] Cawthon PM, Blackwell TL, Cauley JA, et al. Objective assessment of activity, energy expenditure, and functional limitations in older men: the Osteoporotic Fractures in Men study. J Gerontol A Biol Sci Med Sci 2013; 68: 1518–1524.
[138] Liao W-C, Li C-R, Lin Y-C, et al. Healthy behaviors and onset of functional disability in older adults: results of a national longitudinal study. J Am Geriatr Soc 2011; 59: 200–206.
[139] Huisingh-Scheetz MJ, Kocherginsky M, Magett E, et al. Relating wrist accelerometry measures to disability in older adults. Arch Gerontol Geriatr 2016; 62: 68–74.
[140] Sjölund B-M, Wimo A, Engström M, et al. Incidence of ADL Disability in Older Persons, Physical Activities as a Protective Factor and the Need for Informal and Formal Care--Results from the SNAC-N Project. PLoS ONE 2015; 10: e0138901.
[141] Brach JS, FitzGerald S, Newman AB, et al. Physical activity and functional status in community-dwelling older women: a 14-year prospective study. Arch Intern Med 2003; 163: 2565–2571.
[142] Delaney M, Warren M, Kinslow B, et al. Association and Dose-Response Relationship of Self-Reported Physical Activity and Disability Among Adults ≥50 Years: National Health and Nutrition Examination Survey, 2011-2016. J Aging Phys Act 2019; 1–8.
[143] DiPietro L, Jin Y, Talegawkar S, et al. The Joint Associations of Sedentary Time and Physical Activity With Mobility Disability in Older People: The NIH-AARP Diet and Health Study. J Gerontol A Biol Sci Med Sci 2018; 73: 532–538.
[144] Chen S, Chen T, Kishimoto H, et al. Associations of Objectively Measured Patterns of Sedentary Behavior and Physical Activity with Frailty Status Screened by The Frail Scale in Japanese Community-Dwelling Older Adults. J Sports Sci Med 2020; 19: 166–174.
[145] Dunlop DD, Song J, Semanik PA, et al. Relation of physical activity time to incident disability in community dwelling adults with or at risk of knee arthritis: prospective cohort study. BMJ 2014; 348: g2472.

GENERAL DISCUSSION
172
[146] Blodgett J, Theou O, Kirkland S, et al. The association between sedentary behaviour, moderate-vigorous physical activity and frailty in NHANES cohorts. Maturitas 2015; 80: 187–191.
[147] Sardinha LB, Ekelund U, dos Santos L, et al. Breaking-up sedentary time is associated with impairment in activities of daily living. Exp Gerontol 2015; 72: 57–62.
[148] Yu H-W, Chiang T-L, Chen D-R, et al. Trajectories of Leisure Activity and Disability in Older Adults Over 11 Years in Taiwan. J Appl Gerontol 2018; 37: 706–727.
[149] Laddu D, Parimi N, Stone KL, et al. Physical Activity Trajectories and Associated Changes in Physical Performance in Older Men: The MrOS Study. J Gerontol A Biol Sci Med Sci. Epub ahead of print 31 March 2020. DOI: 10.1093/gerona/glaa073.
[150] Laddu DR, Wertheim BC, Garcia DO, et al. Associations Between Self-Reported Physical Activity and Physical Performance Measures Over Time in Postmenopausal Women: The Women’s Health Initiative. J Am Geriatr Soc 2017; 65: 2176–2181.
[151] McGrath R, Al Snih S, Markides K, et al. The Burden of Functional Disabilities for Middle-Aged and Older Adults in the United States. J Nutr Health Aging 2019; 23: 172–174.
[152] Olsen PØ, Termannsen A-D, Bramming M, et al. Effects of resistance training on self-reported disability in older adults with functional limitations or disability - a systematic review and meta-analysis. Eur Rev Aging Phys Act 2019; 16: 24.
[153] Reas ET, Laughlin GA, Bergstrom J, et al. Physical Activity and Trajectories of Cognitive Change in Community-Dwelling Older Adults: The Rancho Bernardo Study. J Alzheimers Dis 2019; 71: 109–118.
[154] Nikolova R, Demers L, Béland F, et al. Transitions in the functional status of disabled community-living older adults over a 3-year follow-up period. Archives of Gerontology and Geriatrics 2011; 52: 12–17.
[155] Wolinsky FD, Bentler SE, Hockenberry J, et al. Long-term declines in ADLs, IADLs, and mobility among older Medicare beneficiaries. BMC Geriatr 2011; 11: 43.
[156] Pahor M, Guralnik JM, Ambrosius WT, et al. Effect of structured physical activity on prevention of major mobility disability in older adults: the LIFE study randomized clinical trial. JAMA 2014; 311: 2387–2396.
[157] Song J, Gilbert AL, Chang RW, et al. Do Inactive Older Adults Who Increase Physical Activity Experience Less Disability: Evidence From the Osteoarthritis Initiative. J Clin Rheumatol 2017; 23: 26–32.
[158] Guralnik JM, Ferrucci L, Pieper CF, et al. Lower extremity function and subsequent disability: consistency across studies, predictive models, and value of gait speed alone compared with the short physical performance battery. J Gerontol A Biol Sci Med Sci 2000; 55: M221-231.

GENERAL DISCUSSION
173
[159] Fielding RA, Guralnik JM, King AC, et al. Dose of physical activity, physical functioning and disability risk in mobility-limited older adults: Results from the LIFE study randomized trial. PLoS ONE 2017; 12: e0182155.
[160] Owen N, Healy GN, Dempsey PC, et al. Sedentary Behavior and Public Health: Integrating the Evidence and Identifying Potential Solutions. Annu Rev Public Health 2020; 41: 265–287.
[161] Biswas A, Oh PI, Faulkner GE, et al. Sedentary time and its association with risk for disease incidence, mortality, and hospitalization in adults: a systematic review and meta-analysis. Ann Intern Med 2015; 162: 123–132.
[162] Harvey JA, Chastin SFM, Skelton DA. How Sedentary Are Older People? A Systematic Review of the Amount of Sedentary Behavior. Journal of Aging and Physical Activity 2015; 23: 471–487.
[163] Jefferis BJ, Sartini C, Shiroma E, et al. Duration and breaks in sedentary behaviour: accelerometer data from 1566 community-dwelling older men (British Regional Heart Study). Br J Sports Med 2015; 49: 1591–1594.
[164] de Rezende LFM, Rey-López JP, Matsudo VKR, et al. Sedentary behavior and health outcomes among older adults: a systematic review. BMC Public Health 2014; 14: 333.
[165] Mañas A, Del Pozo-Cruz B, García-García FJ, et al. Role of objectively measured sedentary behaviour in physical performance, frailty and mortality among older adults: A short systematic review. Eur J Sport Sci 2017; 17: 940–953.
[166] Rezende LFM, Sá TH, Mielke GI, et al. All-Cause Mortality Attributable to Sitting Time: Analysis of 54 Countries Worldwide. Am J Prev Med 2016; 51: 253–263.
[167] Ku P-W, Steptoe A, Liao Y, et al. A Threshold of Objectively-Assessed Daily Sedentary Time for All-Cause Mortality in Older Adults: A Meta-Regression of Prospective Cohort Studies. J Clin Med; 8. Epub ahead of print 25 April 2019. DOI: 10.3390/jcm8040564.
[168] Lee I-M, Shiroma EJ, Evenson KR, et al. Accelerometer-Measured Physical Activity and Sedentary Behavior in Relation to All-Cause Mortality: The Women’s Health Study. Circulation 2018; 137: 203–205.
[169] Diaz KM, Howard VJ, Hutto B, et al. Patterns of Sedentary Behavior and Mortality in U.S. Middle-Aged and Older Adults: A National Cohort Study. Ann Intern Med 2017; 167: 465–475.
[170] Ekelund U, Tarp J, Steene-Johannessen J, et al. Dose-response associations between accelerometry measured physical activity and sedentary time and all cause mortality: systematic review and harmonised meta-analysis. BMJ 2019; 366: l4570.
[171] Cabanas-Sánchez V, De la Cámara MA, Sadarangani KP, et al. Associations of daily activities measured by a pattern-recognition activity monitor with overall and

GENERAL DISCUSSION
174
abdominal obesity in older people: the IMPACT65+ study. Int J Obes (Lond) 2019; 43: 2545–2554.
[172] León-Muñoz LM, Martínez-Gómez D, Balboa-Castillo T, et al. Continued sedentariness, change in sitting time, and mortality in older adults. Med Sci Sports Exerc 2013; 45: 1501–1507.
[173] Lee J, Kuk JL, Ardern CI. The relationship between changes in sitting time and mortality in post-menopausal US women. J Public Health (Oxf) 2016; 38: 270–278.
[174] Chen T, Narazaki K, Haeuchi Y, et al. Associations of Sedentary Time and Breaks in Sedentary Time With Disability in Instrumental Activities of Daily Living in Community-Dwelling Older Adults. J Phys Act Health 2016; 13: 303–309.
[175] Gennuso KP, Gangnon RE, Matthews CE, et al. Sedentary Behavior, Physical Activity, and Markers of Health in Older Adults. Med Sci Sports Exerc 2013; 45: 1493–1500.
[176] Kraschnewski JL, Sciamanna CN, Ciccolo JT, et al. Is exercise used as medicine? Association of meeting strength training guidelines and functional limitations among older US adults. Prev Med 2014; 66: 1–5.
[177] Maher RL, Hanlon J, Hajjar ER. Clinical consequences of polypharmacy in elderly. Expert Opin Drug Saf 2014; 13: 57–65.
[178] Liu J-X, Zhu L, Li P-J, et al. Effectiveness of high-intensity interval training on glycemic control and cardiorespiratory fitness in patients with type 2 diabetes: a systematic review and meta-analysis. Aging Clin Exp Res. Epub ahead of print 30 July 2018. DOI: 10.1007/s40520-018-1012-z.
[179] de Carvalho IA, Martin FC, Cesari M, et al. Operationalising the concept of intrinsic capacity in clinical settings. 2017; 31.
[180] Integrated Care for Older People: Guidelines on Community-Level Interventions to Manage Declines in Intrinsic Capacity. Geneva: World Health Organization, http://www.ncbi.nlm.nih.gov/books/NBK488250/ (2017, accessed 10 October 2019).
[181] Valenzuela PL, Morales JS, Pareja-Galeano H, et al. Physical strategies to prevent disuse-induced functional decline in the elderly. Ageing Res Rev 2018; 47: 80–88.
[182] Füzéki E, Engeroff T, Banzer W. Health Benefits of Light-Intensity Physical Activity: A Systematic Review of Accelerometer Data of the National Health and Nutrition Examination Survey (NHANES). Sports Med 2017; 47: 1769–1793.
[183] Cadore EL, Casas-Herrero A, Zambom-Ferraresi F, et al. Multicomponent exercises including muscle power training enhance muscle mass, power output, and functional outcomes in institutionalized frail nonagenarians. Age (Dordr) 2014; 36: 773–785.
[184] Casas Herrero Á, Cadore EL, Martínez Velilla N, et al. [Physical exercise in the frail elderly: an update]. Rev Esp Geriatr Gerontol 2015; 50: 74–81.

GENERAL DISCUSSION
175
[185] Valenzuela PL, Castillo-García A, Morales JS, et al. Physical Exercise in the Oldest Old. Compr Physiol 2019; 9: 1281–1304.
[186] Izquierdo M, Rodriguez-Mañas L, Casas-Herrero A, et al. Is It Ethical Not to Precribe Physical Activity for the Elderly Frail? J Am Med Dir Assoc 2016; 17: 779–781.
[187] Tarazona-Santabalbina FJ, Gómez-Cabrera MC, Pérez-Ros P, et al. A Multicomponent Exercise Intervention that Reverses Frailty and Improves Cognition, Emotion, and Social Networking in the Community-Dwelling Frail Elderly: A Randomized Clinical Trial. J Am Med Dir Assoc 2016; 17: 426–433.
[188] Snijders T, Nederveen JP, Joanisse S, et al. Muscle fibre capillarization is a critical factor in muscle fibre hypertrophy during resistance exercise training in older men. J Cachexia Sarcopenia Muscle 2017; 8: 267–276.
[189] Cadore EL, Izquierdo M. Muscle Power Training: A Hallmark for Muscle Function Retaining in Frail Clinical Setting. J Am Med Dir Assoc 2018; 19: 190–192.
[190] Public consultation on the draft WHO Guidelines on physical activity and sedentary behaviour for children and adolescents, adults and older adults 2020, https://www.who.int/news-room/articles-detail/public-consultation-on-the-draft-who-guidelines-on-physical-activity-and-sedentary-behaviour-for-children-and-adolescents-adults-and-older-adults-2020 (accessed 2 April 2020).
[191] Global Recommendations on Physical Activity for Health. Geneva: World Health Organization, http://www.ncbi.nlm.nih.gov/books/NBK305057/ (2010, accessed 2 April 2020).
[192] Lee R, Mason A. Cost of Aging. Finance Dev 2017; 54: 7–9.
[193] McPhee JS, French DP, Jackson D, et al. Physical activity in older age: perspectives for healthy ageing and frailty. Biogerontology 2016; 17: 567–580.
[194] Cruz-Jentoft AJ, Sayer AA. Sarcopenia. Lancet 2019; 393: 2636–2646.
[195] Offord NJ, Witham MD. The emergence of sarcopenia as an important entity in older people. Clin Med (Lond) 2017; 17: 363–366.
[196] Law TD, Clark LA, Clark BC. Resistance Exercise to Prevent and Manage Sarcopenia and Dynapenia. Annu Rev Gerontol Geriatr 2016; 36: 205–228.
[197] Kirk B, Phu S, Debruin DA, et al. Aging Muscle and Sarcopenia. In: Rattan SIS (ed) Encyclopedia of Biomedical Gerontology. Oxford: Academic Press, pp. 120–131.
[198] Vlietstra L, Hendrickx W, Waters DL. Exercise interventions in healthy older adults with sarcopenia: A systematic review and meta-analysis. Australas J Ageing. Epub ahead of print 11 April 2018. DOI: 10.1111/ajag.12521.
[199] Lozano-Montoya I, Correa-Pérez A, Abraha I, et al. Nonpharmacological interventions to treat physical frailty and sarcopenia in older patients: a systematic

GENERAL DISCUSSION
176
overview - the SENATOR Project ONTOP Series. Clin Interv Aging 2017; 12: 721–740.
[200] de Mello RGB, Dalla Corte RR, Gioscia J, et al. Effects of Physical Exercise Programs on Sarcopenia Management, Dynapenia, and Physical Performance in the Elderly: A Systematic Review of Randomized Clinical Trials. J Aging Res 2019; 2019: 1959486.
[201] Barbalho M de SM, Gentil P, Izquierdo M, et al. There are no no-responders to low or high resistance training volumes among older women. Exp Gerontol 2017; 99: 18–26.
[202] Bennie JA, Pedisic Z, van Uffelen JGZ, et al. Pumping Iron in Australia: Prevalence, Trends and Sociodemographic Correlates of Muscle Strengthening Activity Participation from a National Sample of 195,926 Adults. PLoS ONE 2016; 11: e0153225.
[203] Dodds RM, Syddall HE, Cooper R, et al. Global variation in grip strength: a systematic review and meta-analysis of normative data. Age Ageing 2016; 45: 209–216.
[204] Ainsworth BE, Haskell WL, Herrmann SD, et al. 2011 Compendium of Physical Activities: a second update of codes and MET values. Med Sci Sports Exerc 2011; 43: 1575–1581.
[205] Luo D, Lin Z, Li S, et al. Effect of nutritional supplement combined with exercise intervention on sarcopenia in the elderly: A meta-analysis. Int J Nurs Sci 2017; 4: 389–401.
[206] Xia Z, Cholewa J, Zhao Y, et al. Targeting Inflammation and Downstream Protein Metabolism in Sarcopenia: A Brief Up-Dated Description of Concurrent Exercise and Leucine-Based Multimodal Intervention. Front Physiol 2017; 8: 434.
[207] García-Hermoso A, Ramírez-Vélez R, Celis-Morales CA, et al. Can physical activity attenuate the negative association between sitting time and cognitive function among older adults? A mediation analysis. Exp Gerontol 2018; 106: 173–177.
[208] Boerema ST, van Velsen L, Vollenbroek MM, et al. Pattern measures of sedentary behaviour in adults: A literature review. Digit Health 2020; 6: 2055207620905418.
[209] Nagin DS, Jones BL, Passos VL, et al. Group-based multi-trajectory modeling. Stat Methods Med Res 2018; 27: 2015–2023.
[210] Bhasin S, Travison TG, Manini TM, et al. Sarcopenia Definition: The Position Statements of the Sarcopenia Definition and Outcomes Consortium. J Am Geriatr Soc. Epub ahead of print 9 March 2020. DOI: 10.1111/jgs.16372.
[211] Concato J. Observational Versus Experimental Studies: What’s the Evidence for a Hierarchy? NeuroRx 2004; 1: 341–347.
GENERAL DISCUSSION
177
[212] Hanach NI, McCullough F, Avery A. The Impact of Dairy Protein Intake on Muscle Mass, Muscle Strength, and Physical Performance in Middle-Aged to Older Adults with or without Existing Sarcopenia: A Systematic Review and Meta-Analysis. Adv Nutr 2019; 10: 59–69.
[213] Gylling AT, Eriksen CS, Garde E, et al. The influence of prolonged strength training upon muscle and fat in healthy and chronically diseased older adults. Experimental Gerontology 2020; 110939.
[214] Sundstrup E, Jakobsen MD, Andersen LL, et al. Positive effects of 1-year football and strength training on mechanical muscle function and functional capacity in elderly men. Eur J Appl Physiol 2016; 116: 1127–1138.
[215] Aartolahti E, Lönnroos E, Hartikainen S, et al. Long-term strength and balance training in prevention of decline in muscle strength and mobility in older adults. Aging Clin Exp Res 2020; 32: 59–66.
[216] Landi F, Cesari M, Calvani R, et al. The ‘Sarcopenia and Physical fRailty IN older people: multi-componenT Treatment strategies’ (SPRINTT) randomized controlled trial: design and methods. Aging Clin Exp Res 2017; 29: 89–100.
[217] Izquierdo M, Rodriguez-Mañas L, Sinclair AJ. Editorial: What Is New in Exercise Regimes for Frail Older People - How Does the Erasmus Vivifrail Project Take Us Forward? J Nutr Health Aging 2016; 20: 736–737.
[218] Albornos-Muñoz L, Moreno-Casbas MT, Sánchez-Pablo C, et al. Efficacy of the Otago Exercise Programme to reduce falls in community-dwelling adults aged 65-80 years old when delivered as group or individual training. J Adv Nurs 2018; 74: 1700–1711.
[219] Melouane A, Ghanemi A, Yoshioka M, et al. Functional genomics applications and therapeutic implications in sarcopenia. Mutat Res 2019; 781: 175–185.
[220] Capitanio D, Moriggi M, Gelfi C. Mapping the human skeletal muscle proteome: progress and potential. Expert Rev Proteomics 2017; 14: 825–839.

178
Conclusions-Conclusiones

CONCLUSIONS-CONCLUSIONES
179
Conclusions
The conclusions that can be drawn from this thesis are listed below.
• Moderate-to-vigorous physical activity levels are associated with sarcopenia
rates and better performance in its determinants in an older adult population
• Intensity might be a relevant modulator of the association between physical
activity and health
• Sedentary behavior and light physical activity might not be associated
independently with sarcopenia or its determinants
• Prospectively maintaining physical activity during late life might be protective
against important adverse events
• Increasing physical activity from very low baseline levels might be protective
against functional decline, indicating benefits from physical activity even in the
less active older adults
• Increased spontaneous free-living physical activity might be a powerful strategy
for age-related intrinsic capacity loss attenuation given low adherence to the
well-recognized structured physical exercise
• The prevention and attenuation of functional decline through physical activity
might have broad clinical, economic, public health implications in the context of
a burgeoning older adult population worldwide.

CONCLUSIONS-CONCLUSIONES
180
Conclusiones
De la presente tesis doctoral se extraen las siguientes conclusiones:
• Los niveles de actividad física espontánea de intensidad de moderada a vigorosa
se asocian negativamente con la probabilidad de presentar sarcopenia y con
mejores valores en sus determinantes en una muestra de adultos mayores
• La intensidad de la actividad física espontánea aparece como un determinante
crucial en la asociación entre ésta y la salud
• Los niveles de sedentarismo y la actividad física espontánea de intensidad ligera
podrían no asociarse independientemente con la sarcopenia y sus determinantes.
• El mantenimiento de los niveles de la actividad física a edades avanzadas podría
conferir protección frente a eventos adversos
• El aumento de la actividad física desde los niveles más bajos a edades avanzadas
podría ser un factor protector contra el declive funcional, lo que podría indicar la
obtención de beneficios a partir de la actividad física incluso en los adultos
mayores más inactivos
• Dada la baja adherencia y el limitado acceso a programas de ejercicio físico
estructurado entre los adultos mayores, el mantenimiento o aumento de los
niveles de actividad física espontánea, en forma de volumen e intensidad, podría
constituir una potente estrategia en la prevención/atenuación de la pérdida de
capacidad intrínseca durante el envejecimiento.
• La prevención del declive funcional a través de la actividad física en el adulto
mayor podría tener importantes implicaciones en las esferas clínica, económica y
de salud pública, en el contexto del envejecimiento de la población a nivel global.
CONCLUSIONS-CONCLUSIONES
181
Publications-Publicaciones

182