public transport introduction and … transport introduction and organizational models: ... • uk...
TRANSCRIPT
John Attanucci 1.201, Lecture 7 Fall 2008
1
PUBLIC TRANSPORT INTRODUCTION AND ORGANIZATIONAL MODELS:
THE ROLES OF THE PUBLIC and PRIVATE SECTORS
Outline • Current U.S. Status and Recent Trends
• Significant Influences
• A Critical Assessment
• Arguments Supporting Public Transport
• Organizational Models
• US Transit Industry
• UK Bus Industry Experience
John Attanucci 1.201, Lecture 7 Fall 2008
2
Current Status
• Ridership increasing modestly but remains small
• Strong financial support from all levels of government
• Significant growth in number of new rail starts in past 25 years
• Major rebuilding of many older systems over past 15 years
• Little institutional or technological innovation, but growing recognition that fundamental change may be necessary for survival well into 21st century
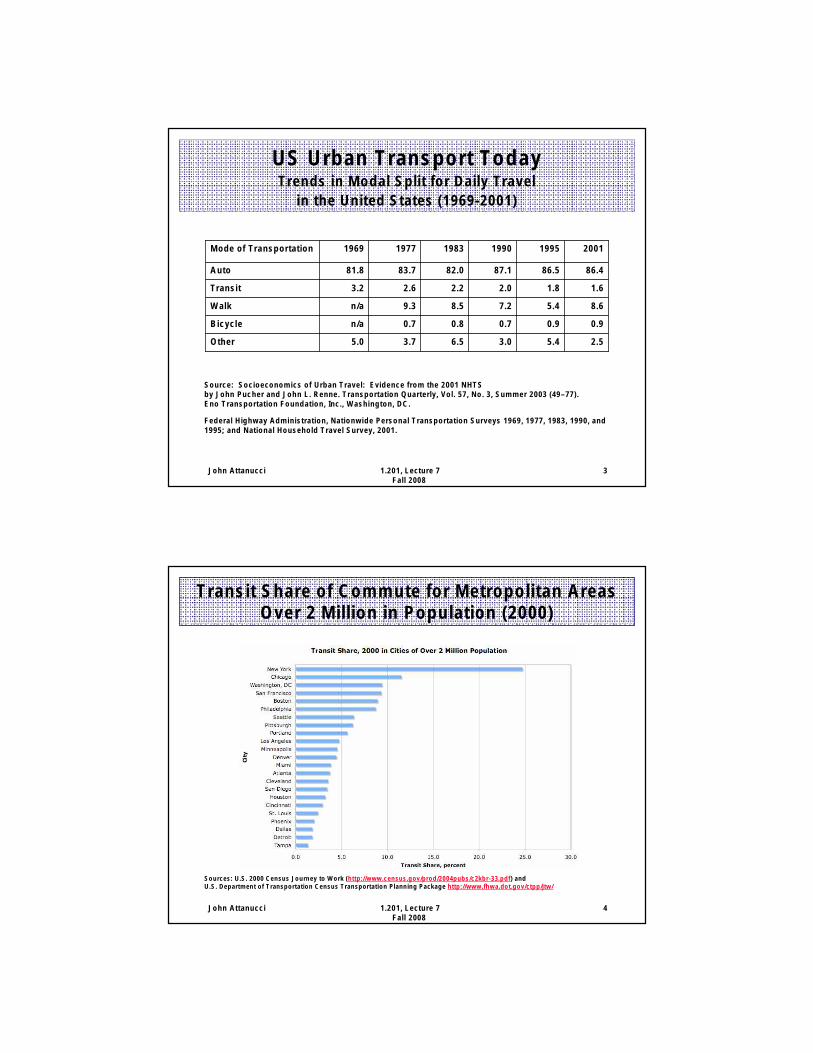
US Urban Transport Today Trends in Modal Split for Daily Travel
in the United States (1969-2001)
Mode of Transportation 1969 1977 1983 1990 1995 2001
Auto 81.8 83.7 82.0 87.1 86.5 86.4
Transit 3.2 2.6 2.2 2.0 1.8 1.6
Walk n/a 9.3 8.5 7.2 5.4 8.6
Bicycle n/a 0.7 0.8 0.7 0.9 0.9
Other 5.0 3.7 6.5 3.0 5.4 2.5
Source: Socioeconomics of Urban Travel: Evidence from the 2001 NHTSby John Pucher and John L. Renne. Transportation Quarterly, Vol. 57, No. 3, Summer 2003 (49–77).Eno Transportation Foundation, Inc., Washington, DC.
Federal Highway Administration, Nationwide Personal Transportation Surveys 1969, 1977, 1983, 1990, and1995; and National Household Travel Survey, 2001.
John Attanucci 1.201, Lecture 7 3 Fall 2008
Transit Share of Commute for Metropolitan Areas Over 2 Million in Population (2000)
Sources: U.S. 2000 Census Journey to Work (http://www.census.gov/prod/2004pubs/c2kbr-33.pdf) and U.S. Department of Transportation Census Transportation Planning Package http://www.fhwa.dot.gov/ctpp/jtw/
John Attanucci 1.201, Lecture 7 4 Fall 2008
↑ ↓ ↓ ↑
↑ ↓ ↓ ↑
↑
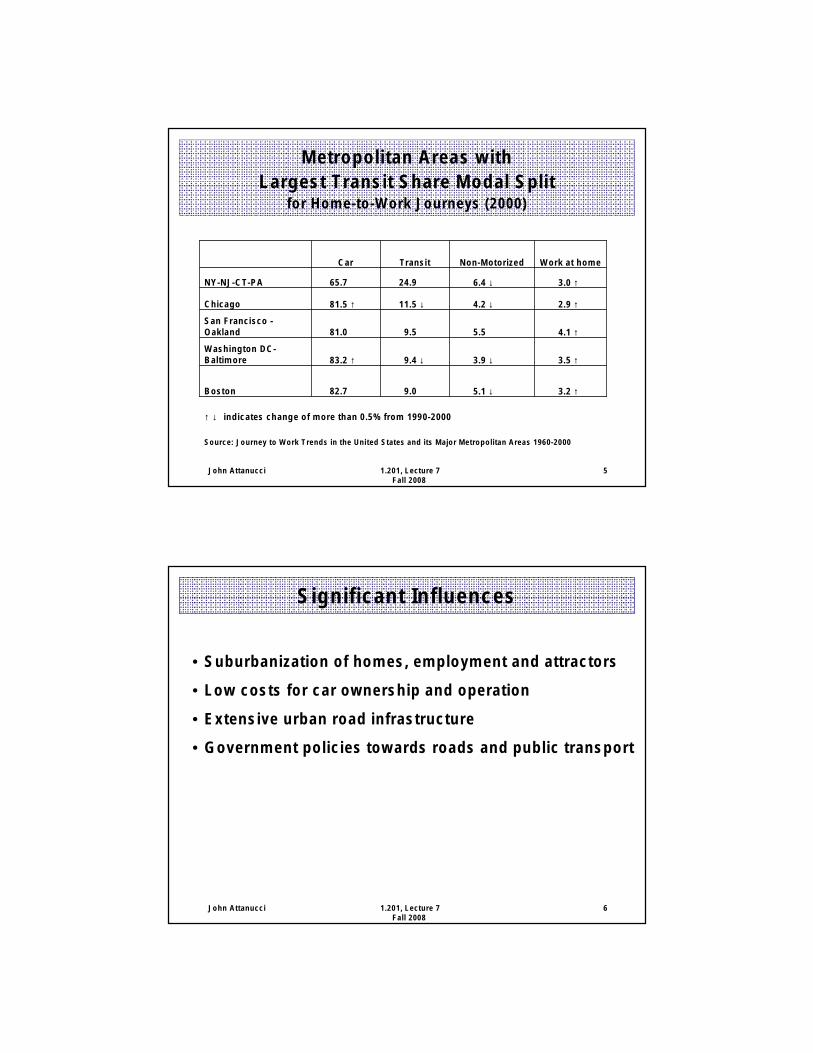
Metropolitan Areas with Largest Transit Share Modal Split
for Home-to-Work Journeys (2000)
Car Transit Non-Motorized Work at home
San Francisco Oakland
Chicago
NY-NJ-CT-PA
81.0
81.5 ↑
65.7
9.5
11.5 ↓
24.9
5.5
4.2 ↓
6.4 ↓� ↑↓�
4.1 ↑
2.9 ↑
3.0 ↑
Washington DC-Baltimore 83.2 ↑ 9.4 ↓ 3.9 ↓ 3.5 ↑
Boston 82.7 9.0 5.1 ↓ ↑↓ 3.2 ↑
↑ ↓↑ ↓ indicates change of more than 0.5% from 1990-2000
Source: Journey to Work Trends in the United States and its Major Metropolitan Areas 1960-2000
John Attanucci 1.201, Lecture 7 5 Fall 2008
John Attanucci 1.201, Lecture 7 Fall 2008
6
Significant Influences
• Suburbanization of homes, employment and attractors
• Low costs for car ownership and operation
• Extensive urban road infrastructure
• Government policies towards roads and public transport

7
Suburbanization: 2000 Journey to Work
A. Total Trips (in millions of daily trips)
53.8 (52%) 49.0 (48%) Total Jobs
37.4 (36%) 9.2 (9%) 28.2 (27%) Central City
65.4 (64%) 44.6 (43%) 20.8 (20%) Suburbs
Total Homes Suburbs Central City Homes in:
Jobs in:
B. Share of 1990-2000 Increase Jobs in:
65% 16% Suburbs
14% 5% Central City
Suburbs Central City Homes in:
C. Public Transport Mode Share
John Attanucci 1.201, Lecture 7 Fall 2008
Jobs in:
2% 6% Suburbs
6% 14% Central City
Suburbs Central City Homes in:
John Attanucci 1.201, Lecture 7 Fall 2008
8
The Car-Road System*
High car ownership levels • 600 cars per 1000 population
High car usage • 10,000 veh-km per capita annually
Low taxes, fees and user charges for car ownership and use • Sales taxes range from 5-8% • Users pay only 60% of road infrastructure costs in US • Petrol taxes are from 10-20% of European levels
Urban parking supply is relatively widely available and often free • 380 parking spaces per 1000 central city workers in 10 largest US cities • 95% of car commuters enjoy free parking
Highly developed urban road system • 6.6 metres of road per capita in 10 largest US cities; 3 times European levels
* Source: The Urban Transportation Crisis in Europe and North America, by John Pucher and Christian LeFevre, 1996.

Public Transport Funding by Source (2005, in $ billions)
Capital Operating
Fares --- 10.3 (32%)
Other directly generated 3.3 (27%) 5.0 (16%)
Local 2.7 (22%) 6.7 (21%)
State 1.6 (13%) 7.5 (24%)
Federal 4.8 (39%) 2.3 (7%)
Total 12.4 billion 31.7 billion
Source: American Public Transportation Association, Transit Facts 2007 (for 2005)
John Attanucci 1.201, Lecture 7 9 Fall 2008
John Attanucci 1.201, Lecture 7 Fall 2008
10
A Critical Assessment
• Public transport has been stabilized
• Many new rail initiatives in operation or under construction
• Some real success stories: New York City, Houston, Seattle
• Institutional change is occurring slowly
• Retention of political support

John Attanucci 1.201, Lecture 7 Fall 2008
11
Arguments Supporting Public Transport
• Equity: access for those who cannot or do not choose to drive
• Congestion: the need for a high-quality alternative
• Land use influence: public transport is necessary, but not sufficient to change trends
• Environmental: car technology strategies are more effective
• Energy: car technology strategies are more effective
John Attanucci 1.201, Lecture 7 Fall 2008
12
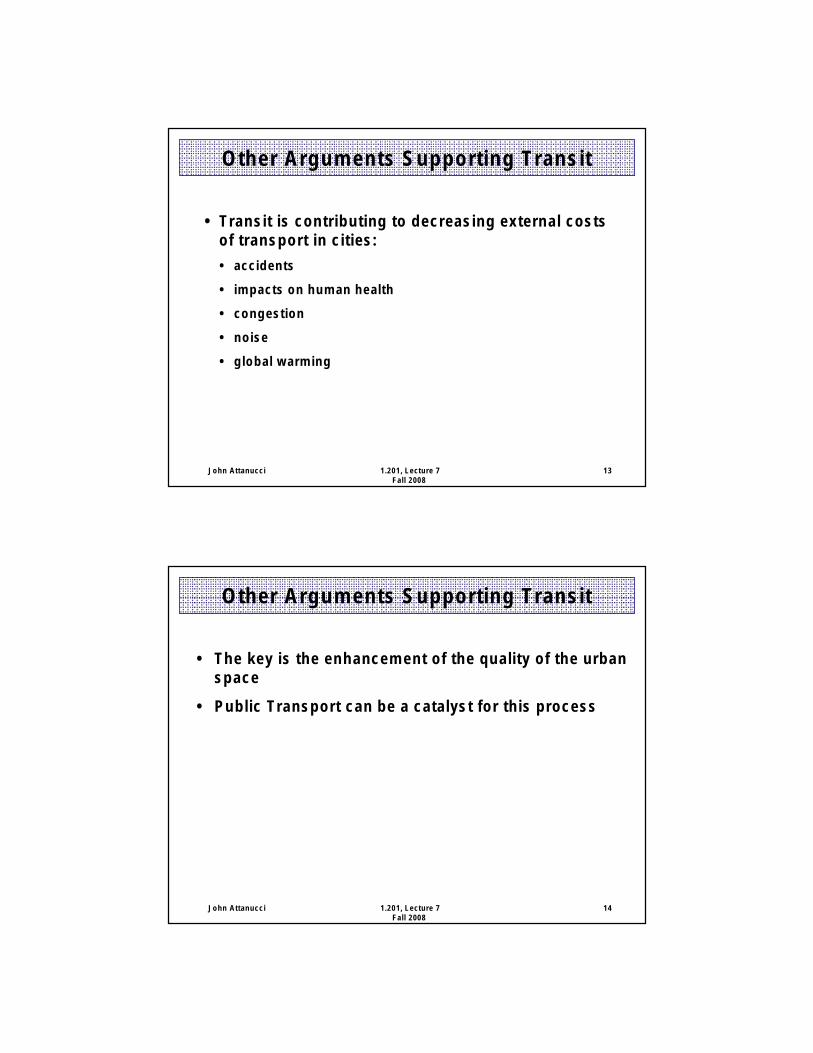
Other Arguments Supporting Transit
• Economic: private expenditures for autos may be alternatively used to improve local economies and quality of life
• Transit allows agglomeration of economic activity in cities:
• New York, Boston, San Francisco, etc. could not have developed without transit
• The contribution of earlier investments in heavy rail is not valued appropriately
• New investments will have a lasting impact – thus the need for a long view
John Attanucci 1.201, Lecture 7 Fall 2008
13
Other Arguments Supporting Transit
• Transit is contributing to decreasing external costs of transport in cities:
• accidents
• impacts on human health
• congestion
• noise
• global warming
John Attanucci 1.201, Lecture 7 Fall 2008
14
Other Arguments Supporting Transit
• The key is the enhancement of the quality of the urban space
• Public Transport can be a catalyst for this process

Six Organizational Models
MODELS
Unregulated Regulated
Competition Threatened Competition
Private Monopoly
Public Monopoly
Contracting Out
F U N
Regulation Minimum Yes Yes* Yes Yes Yes*
Financing PR PR PR PR PU PR & PU
C Planning PR PU & PR PU & PR PR & PU PU PU
T I
Ownership PR PR PR PR PU PR (orPU)
O Operation PR PR PR PR PU PR
S N
Maintenance PR PR PR PR PU PR
* The model is regulated in the form of contracts.
PU: Public Sector; PR: Private Sector
John Attanucci 1.201, Lecture 7 16 Fall 2008
John Attanucci 1.201, Lecture 7 Fall 2008
15
US vs Europe
• US has been the leader in deregulation outside transit
• UK, and now Europe, the leader in restructuring transit organizations

Purchased Transit Service in US Transit Industry:
Operating Expense (2005, $ millions)
Mode Directly Operated Purchased Total % Purchased
Bus 14,758.6 2,028.2 16,768.8 12.1%
Heavy Rail 5,102.0 42.8 5,144.8 0.8%
Commuter Rail 3,439.7 223.5 3,663.2 6.1%
Light Rail 922.6 45.5 978.0 4.7%
Demand Response 1,059.0 1,769.4 2,828.4 62.6%
Total 25,281.9 4,109.4 29,383.2 14.0%
Source: American Public Transit Administration Fact Book 2007 (for 2005, preliminary)
John Attanucci 1.201, Lecture 7 18 Fall 2008
John Attanucci 1.201, Lecture 7 Fall 2008
17
U.S. Transit Industry Structure
• Remarkably little change since the early 1970s:
• regional transit authorities regulating, planning and directly operating most services in larger urban areas (> 100 buses + rail)
• municipalities operate transit in many small cities (< 100 buses)
• principal use of private sector is in providing limited types of purchased services to transit authorities

Percent of Transit Systems that Contract for Bus Services
Source: Transportation Research Board Special Report 258 (2001) Contracting for Bus and Demand-Responsive Transit Services: A Survey of US Practice and Experience.
John Attanucci 1.201, Lecture 7 20 Fall 2008
John Attanucci 1.201, Lecture 7 Fall 2008
19
Use of Purchased Transit Services
• Dominant for demand-responsive service
• Very little for urban rail services
• Modest for fixed route bus services
Systems withcontracts for all bus services 18%
Systems with contracts for some bus services 12%
Systems with no contracts for bus services 70%
Figure by MIT OpenCourseWare.

Percent of Transit Systems that Contract for Demand-Responsive Transit Services
Source: Transportation Research Board Special Report 258 (2001) Contracting for Bus and Demand-Responsive Transit Services: A Survey of US Practice and Experience.
John Attanucci 1.201, Lecture 7 21Fall 2008
Percent of Transit Systems that Contract for All, Some, and No Bus
and Demand-Responsive Transit Services
Source: Transportation Research Board Special Report 258 (2001) Contracting for Bus and Demand-Responsive Transit Services: A Survey of US Practice and Experience.
John Attanucci 1.201, Lecture 7 22Fall 2008
Transit systems with nocontracts for demand-responsive service 36%
Systems with somecontracts for demand-responsive services 16%
Systems with contracts for all demand- responsive services 48%
Figure by MIT OpenCourseWare.
Systems with nocontracts for bus and demand-responsive services 40%
Systems with somecontracts for bus and/ or demand-responsive services 39%
Systems with contractsfor all bus and demand-responsive services 21%
Systems with contractsfor all bus and demand-responsive services 21%
Figure by MIT OpenCourseWare.
...
John Attanucci 1.201, Lecture 7 Fall 2008
23
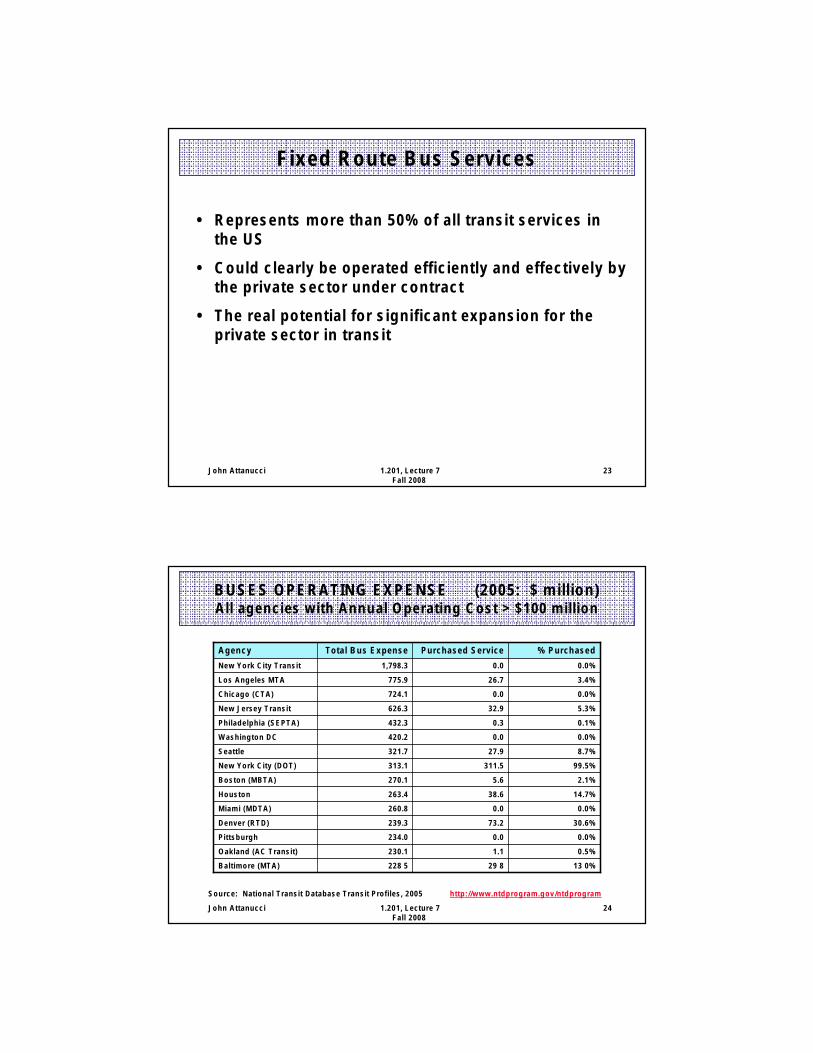
Fixed Route Bus Services
• Represents more than 50% of all transit services in the US
• Could clearly be operated efficiently and effectively by the private sector under contract
• The real potential for significant expansion for the private sector in transit
BUSES OPERATING EXPENSE (2005: $ million) All agencies with Annual Operating Cost > $100 million
Agency Total Bus Expense Purchased Service % Purchased
New York City Transit 1,798.3 0.0 0.0%
Los Angeles MTA 775.9 26.7 3.4%
Chicago (CTA) 724.1 0.0 0.0%
New Jersey Transit 626.3 32.9 5.3%
Philadelphia (SEPTA) 432.3 0.3 0.1%
Washington DC 420.2 0.0 0.0%
Seattle 321.7 27.9 8.7%
New York City (DOT) 313.1 311.5 99.5%
Boston (MBTA) 270.1 5.6 2.1%
Houston 263.4 38.6 14.7%
Miami (MDTA) 260.8 0.0 0.0%
Denver (RTD) 239.3 73.2 30.6%
Pittsburgh 234.0 0.0 0.0%
Oakland (AC Transit) 230.1 1.1 0.5%
Baltimore (MTA) 228 5 29 8 13 0%
Source: National Transit Database Transit Profiles, 2005 http://www.ntdprogram.gov/ntdprogram
John Attanucci 1.201, Lecture 7 24 Fall 2008
John Attanucci 1.201, Lecture 7Fall 2008
25
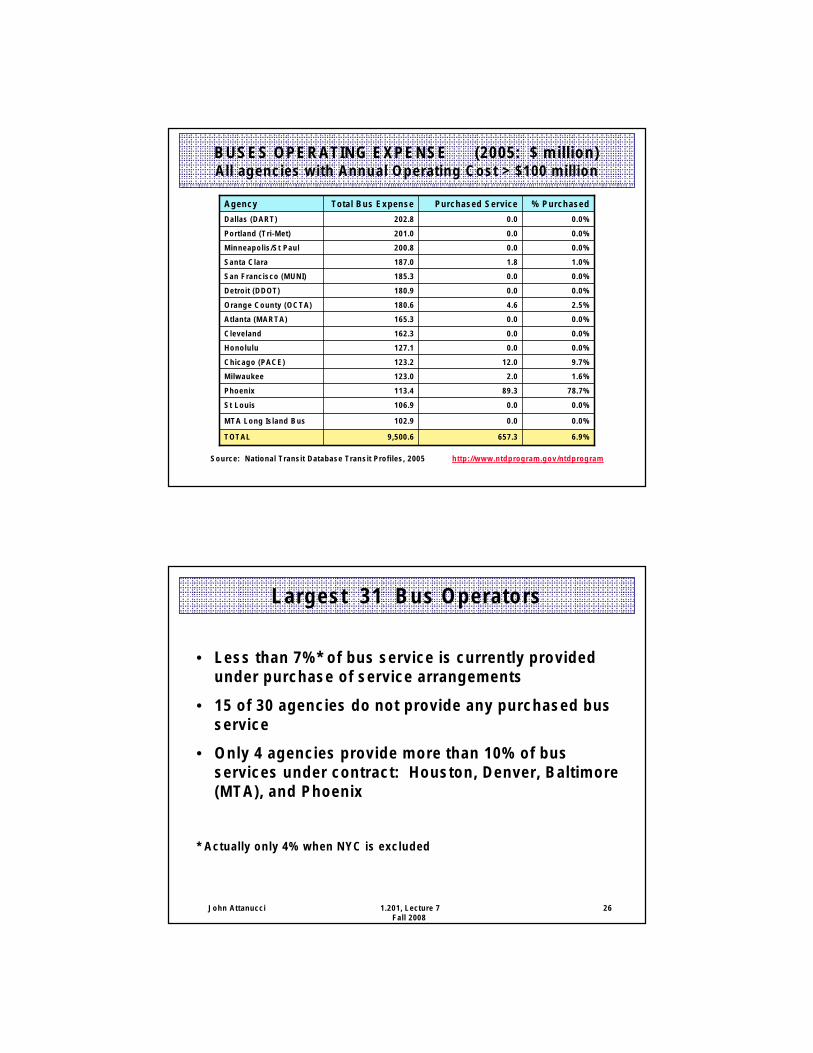
BUSES OPERATING EXPENSE (2005: $ million) All agencies with Annual Operating Cost > $100 million
Agency Total Bus Expense Purchased Service % Purchased
Dallas (DART) 202.8 0.0 0.0%
Portland (Tri-Met) 201.0 0.0 0.0%
Minneapolis/St Paul 200.8 0.0 0.0%
Santa Clara 187.0 1.8 1.0%
San Francisco (MUNI) 185.3 0.0 0.0%
Detroit (DDOT) 180.9 0.0 0.0%
Orange County (OCTA) 180.6 4.6 2.5%
Atlanta (MARTA) 165.3 0.0 0.0%
Cleveland 162.3 0.0 0.0%
Honolulu 127.1 0.0 0.0%
Chicago (PACE) 123.2 12.0 9.7%
Milwaukee 123.0 2.0 1.6%
Phoenix 113.4 89.3 78.7%
St Louis 106.9 0.0 0.0%
MTA Long Island Bus 102.9 0.0 0.0%
TOTAL 9,500.6 657.3 6.9%
Source: National Transit Database Transit Profiles, 2005 http://www.ntdprogram.gov/ntdprogram
John Attanucci 1.201, Lecture 7 Fall 2008
26
Largest 31 Bus Operators
• Less than 7%* of bus service is currently provided under purchase of service arrangements
• 15 of 30 agencies do not provide any purchased bus service
• Only 4 agencies provide more than 10% of bus services under contract: Houston, Denver, Baltimore (MTA), and Phoenix
* Actually only 4% when NYC is excluded

John Attanucci 1.201, Lecture 7 Fall 2008
27
Agencies Using Purchased Services Extensively Fall Into Three Groups
• Agencies which took over financial responsibility for franchise operators: New York City Department of Transportation
• Agencies taking over franchised services and/or expanding services through purchase of service agreements: Houston, Baltimore (MTA), and Phoenix
• Agencies required to transfer core services to purchased service arrangements: Denver
John Attanucci 1.201, Lecture 7 Fall 2008
28
Prospects for the Future
Key ingredients for private sector participation: • service is new and different • external intervention • incomplete assimilation of private operators
Direct transit authority operation is highly stable in NorthAmerica:
• small leverage for central government • at state/local levels of government organized labor is a powerful
force likely to resist change
• confrontational/ideological nature of the debate

John Attanucci 1.201, Lecture 7 Fall 2008
29
Possible Strategies
• Development of non-confrontational, incrementalchange proposals
• Contingency plans
• Replacement of marginally performing routes bycontracted van or minibus service
• Develop a database on results of initiatives bycredible agency
• Split policy board from operating functions
• Corporatization and privatization of bus depots inlarge metropolitan areas
John Attanucci 1.201, Lecture 7 Fall 2008
30
UK Experience with Bus Industry Restructuring
• Background
• Bus Deregulation outside London
• London strategy
• Results to date
John Attanucci 1.201, Lecture 7 Fall 2008
31
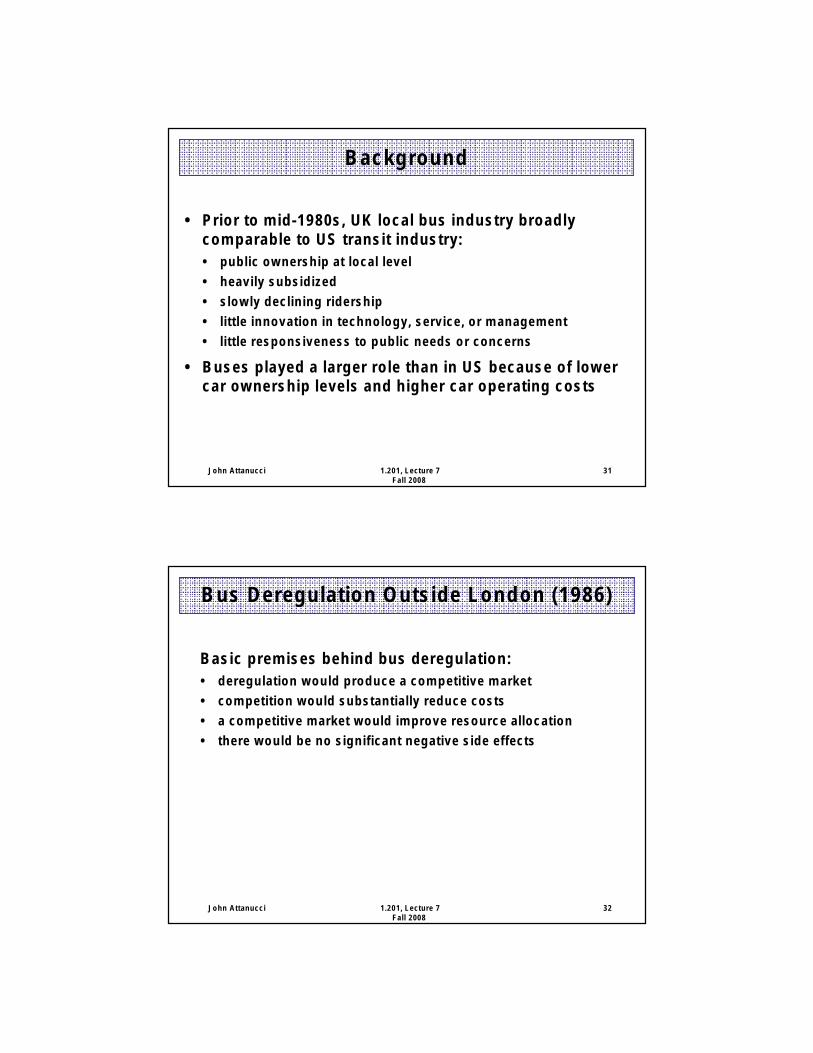
Background
• Prior to mid-1980s, UK local bus industry broadly comparable to US transit industry: • public ownership at local level
• heavily subsidized
• slowly declining ridership
• little innovation in technology, service, or management
• little responsiveness to public needs or concerns
• Buses played a larger role than in US because of lower car ownership levels and higher car operating costs
John Attanucci 1.201, Lecture 7 Fall 2008
32
Bus Deregulation Outside London (1986)
Basic premises behind bus deregulation: • deregulation would produce a competitive market
• competition would substantially reduce costs
• a competitive market would improve resource allocation
• there would be no significant negative side effects

John Attanucci 1.201, Lecture 7 Fall 2008
33
Basic Elements of UK Bus Deregulation
• Bus markets were divided between commercial and noncommercial, with the following definitions and rules for each:
Commercial • Defined as any service that an operator is prepared to offer
with the only government support being: -- concessionary fares reimbursement
-- fuel tax rebate
• Services are registered including the route and timetable, and changes become effective after 6 weeks notice
• Fares can be changed with no prior notice
• Unrestricted entry and exit from the market
• Known as "Competition In the Market”
John Attanucci 1.201, Lecture 7 Fall 2008
34
Basic Elements of UK Bus Deregulation
Non-Commercial
• Services which are not registered as commercial, but needed for social reasons as identified by local authorities
• Awarded to a private sector operator after a competitive bidding process for a period of (typically) three years

John Attanucci 1.201, Lecture 7 Fall 2008
35
Public Transport Authority Reorganization
• As a transitional strategy, public transport authorities were to be "corporatized," i.e., held at arm's length from government
• Could receive subsidy only as a result of success in a competitive bidding process
• Eventually they were to be privatized
• These large operations were not broken up into smaller competitive units
John Attanucci 1.201, Lecture 7 Fall 2008
36
London Strategy
• Deregulation not introduced in London because of concerns about: • the effects of free entry on congestion in Central London • rail system interaction effects
• London Transport (now Transport for London) opted to retain control over all planning functions but to move to privatization through competition for incremental pieces of the London bus network
• TfL controls routes, frequencies, quality standards, and fares
• Known as "Competition For the Market"

...
Table 1: Key bus operating statistics, GB and London, 1985/86 to 2004/2005
Bus km (mil)
Pax trips (mil)
Subsidy
(in 2000 dollars)
Operating costs per bus-km
Total £m Per bus km Per pax trip
London
1985/1986 273 1152 £335 £1.23 £0.29 £2.71
1989/1990 292 1188 £238 £0.82 £0.20 £2.23
1994/1995 356 1167 £177 £0.50 £0.15 £1.59
1999/2000 365 1307 £134 £0.37 £0.10 £1.49
2004/2005 450 1793 £601 £1.34 £0.34 £1.95
GB Outside London
1985/1986 1804 4489 £904 £0.50 £0.20 £1.51
1989/1990 2150 3886 £682 £0.32 £0.18 £1.02
1994/1995 2293 3253 £620 £0.27 £0.19 £0.86
1999/2000 2234 2972 £613 £0.27 £0.21 £0.76
2004/2005 2146 2944 £730 £0 34 £0 25 £0 87
Source: Transport Statistics GB 2007 and earlier editions
Note: Subsidy includes concessionary fares payments; Operating Costs and Subsidies are in constant 1999/2000 prices
John Attanucci 1.201, Lecture 7 38 Fall 2008
John Attanucci 1.201, Lecture 7 Fall 2008
37
London Buses Reorganization
• Decentralization of London Buses Limited (LBL) operations, giving progressively more independence to LBL depots
• Put out to competitive bid about 10% of the bus network annually
• Awarding approximately 50% of competitive tenders to LBL subsidiaries with the remainder to independent private bus operators
• Used competitive pressure to induce LBL subsidiaries to restructure labor contracts and management strategy
• In 1994 all LBL subsidiaries were privatized
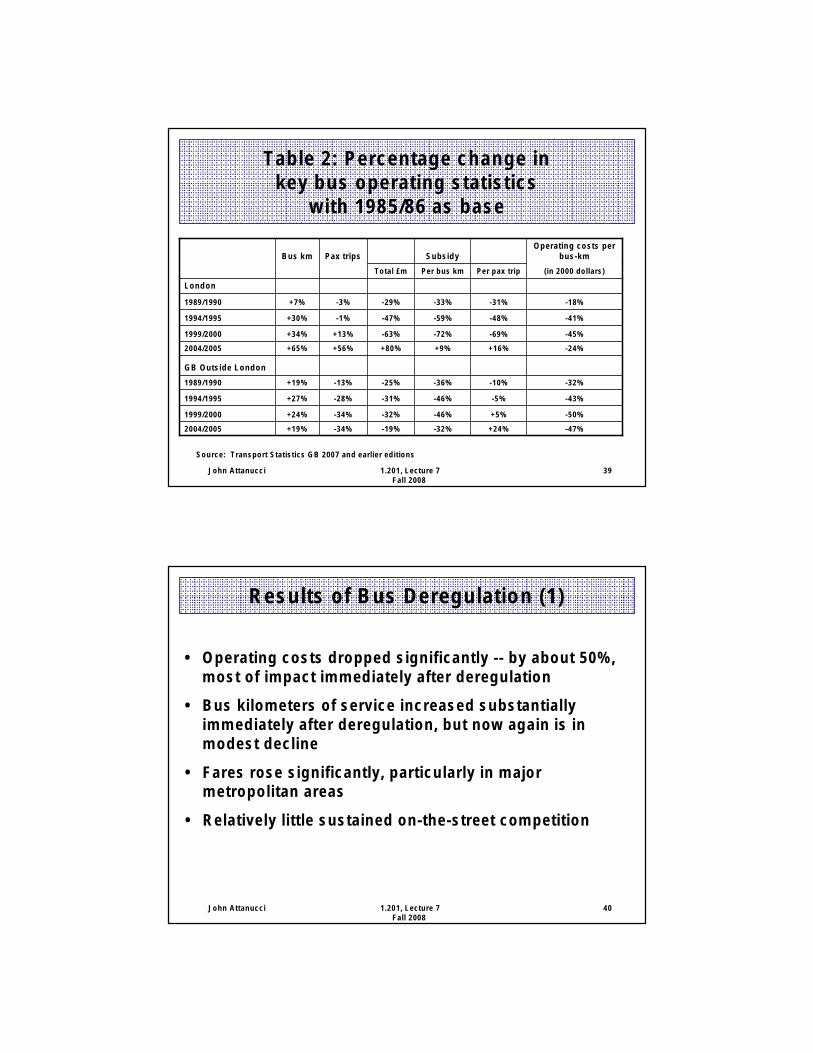
Table 2: Percentage change in key bus operating statistics
with 1985/86 as base
Bus km Pax trips Subsidy
(in 2000 dollars)
Operating costs per bus-km
Total £m Per bus km Per pax trip
London
1989/1990 +7% -3% -29% -33% -31% -18%
1994/1995 +30% -1% -47% -59% -48% -41%
1999/2000 +34% +13% -63% -72% -69% -45%
2004/2005
1989/1990
GB Outside London
+65%
+19%
+56%
-13%
+80%
-25%
+9%
-36%
+16%
-10%
-24%
-32%
1994/1995 +27% -28% -31% -46% -5% -43%
1999/2000 +24% -34% -32% -46% +5% -50%
2004/2005 +19% -34% -19% -32% +24% -47%
Source: Transport Statistics GB 2007 and earlier editions
John Attanucci 1.201, Lecture 7 39 Fall 2008
John Attanucci 1.201, Lecture 7 Fall 2008
40
Results of Bus Deregulation (1)
• Operating costs dropped significantly -- by about 50%, most of impact immediately after deregulation
• Bus kilometers of service increased substantially immediately after deregulation, but now again is in modest decline
• Fares rose significantly, particularly in major metropolitan areas
• Relatively little sustained on-the-street competition
John Attanucci 1.201, Lecture 7 Fall 2008
41
Results of Bus Deregulation (2)
• Great majority of services (80-85%) are operated in commercial regime
• Subsidies have declined by about 30% since deregulation
• Ridership has declined significantly since deregulation
• Subsidy per passenger has remained approximately constant despite major decline in subsidy per vehicle kilometer
• Perceptions of service instability
John Attanucci 1.201, Lecture 7 Fall 2008
42
Typical Trajectory Following Deregulation
• Incumbent operator registered most of pre-existing network as commercial
• Reduced costs and raised entry cost by converting to minibuses
• Establishing a foothold for a new entrant via competitive bidding proved difficult
• Price competition proved to be ineffective relative to frequency competition
• Large bus holding companies emerged through mergers and acquisitions
• The urban bus market as it developed in the UK proved not to be truly contestable
• Local bus planning staff were largely eliminated
John Attanucci 1.201, Lecture 7 Fall 2008
43
London Results
• Similarities: • Unit cost reductions in London are close to those attained
outside London
• Service provided increased by a similar amount to outside London
• Differences: • Ridership in London has experienced modest growth
• Subsidy initially declined much more substantially in London
than elsewhere -- prior to Congestion Charging effects
John Attanucci 1.201, Lecture 7 Fall 2008
44
European Strategy
• Several major European cities adopted London-like schemes, e.g., Copenhagen, Stockholm
• Separation of public sector from direct operation is an accepted principal
• Contractual agreements developed between the planning and oversight agency (in the public sector) and the operators (in the private sector)

MIT OpenCourseWare http://ocw.mit.edu
1.201J / 11.545J / ESD.210J Transportation Systems Analysis: Demand and Economics Fall 2008
For information about citing these materials or our Terms of Use, visit: http://ocw.mit.edu/terms.