public transport development strategies for...
TRANSCRIPT

Public Transport Development Strategies forEmerging Metropolis- A Case of NOIDA
- RAMYA SITHARA.G Dr. SANJAY GUPTASchool of Planning and Architecture, New Delhi
Christchurch tramway routesSydney transit routesCopenhagen transit routes

Contents
Importance of Public Transport in urban areas.
Methodological Approach
Performance Evaluation indicators for Public Transport
Case Study area Profile and Data base
Public Transport travel pattern and demand assessment
Alternative scenarios of PT network Development
Salient Research Findings

IMPORTANCE OF PUBLIC TRANSPORT
Mobility is a major concern in urban
areas.
Attention to PT in JnNURM (2006) &
NUTP.
Land use activities change rapidly which
will have a direct impact on change in
travel characteristics.
Private vehicles are growing rapidly to
cater the increase travel needs, resulting
increase congestion levels in the cities.
PT share increase not in line with the
growing population.
Need for transit network to decongest
the roads and increase the connectivity
in cities
0
200
400
1-5Lakh
5-10Lakh
10-20Lakh
20-40Lakh
>40Lakh
372
43 34 10 9No.
of C
ities
Population Size
Distribution of Indian citiesaccording to population
Increase in city size is having direct impact on the PT
share.

RESEARCH NEED
Configuration of a transit network greatly influenced by
configuration of city’s roadway networks.
Current practice of network planning is normative and
policy based in nature.
No significant scientific effort in evolving an optimal &
rational Public Transport network strategy.
Very little research reported in the efficiency of alternate
Public Transport network forms on overall performance in
Indian Cities.
AHD City network
Boston transit network
Istanbul transit network
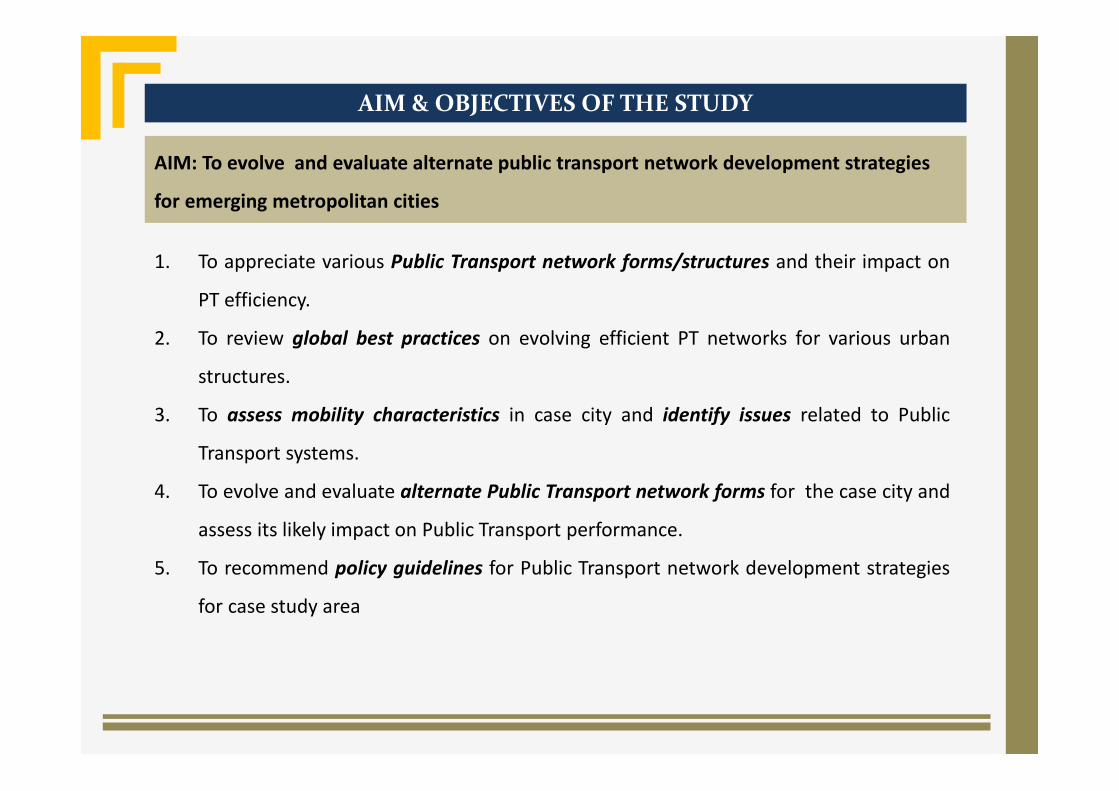
AIM & OBJECTIVES OF THE STUDY
AIM: To evolve and evaluate alternate public transport network development strategies
for emerging metropolitan cities
1. To appreciate various Public Transport network forms/structures and their impact on
PT efficiency.
2. To review global best practices on evolving efficient PT networks for various urban
structures.
3. To assess mobility characteristics in case city and identify issues related to Public
Transport systems.
4. To evolve and evaluate alternate Public Transport network forms for the case city and
assess its likely impact on Public Transport performance.
5. To recommend policy guidelines for Public Transport network development strategies
for case study area
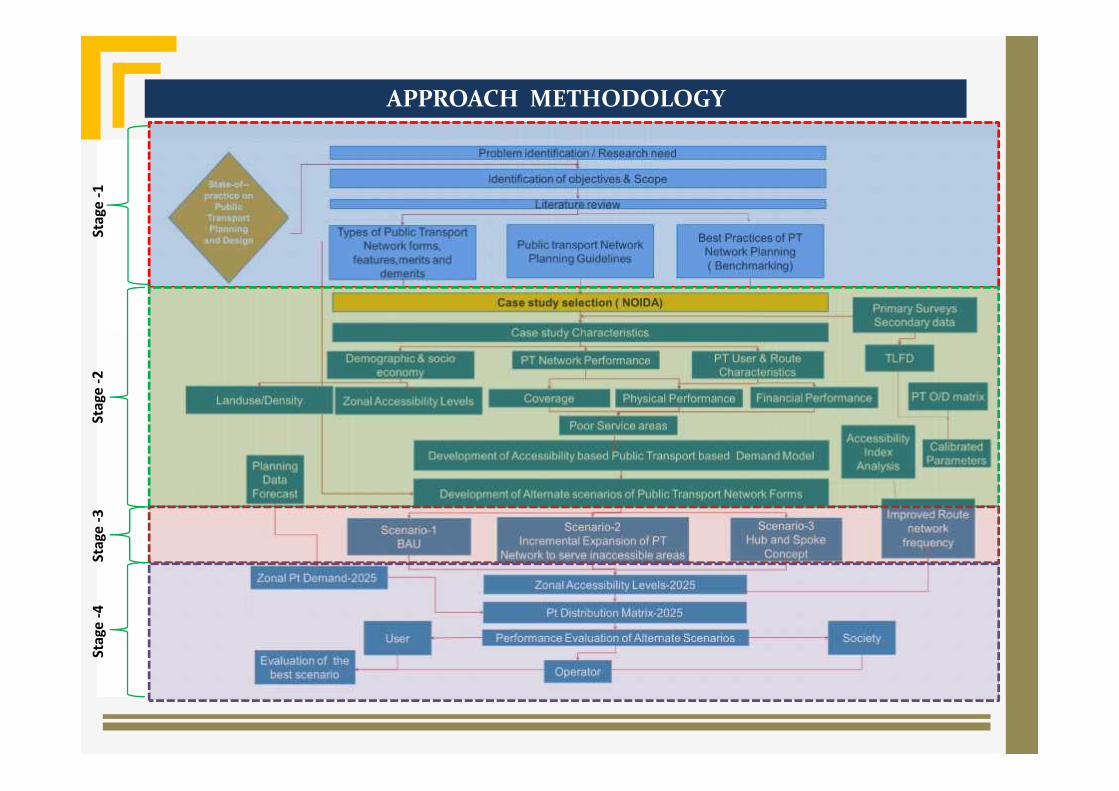
APPROACH METHODOLOGYSt
age
-1St
age
-2St
age
-3St
age
-4
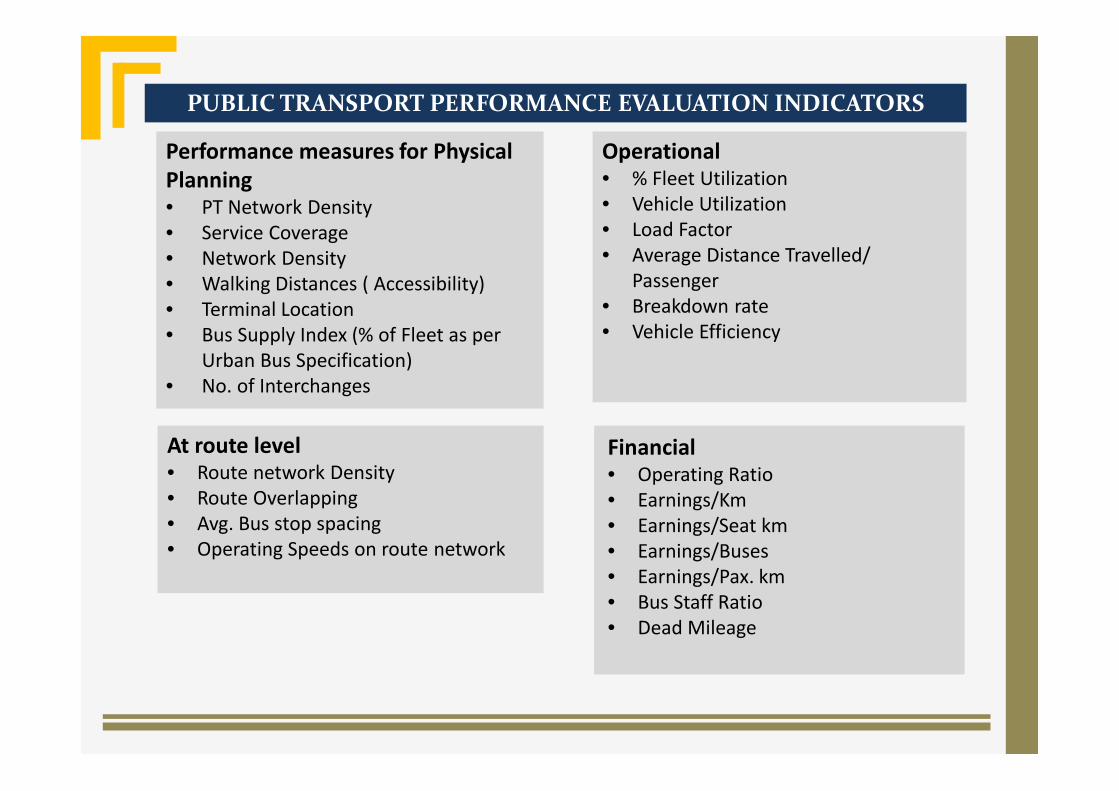
PUBLIC TRANSPORT PERFORMANCE EVALUATION INDICATORS
Financial• Operating Ratio• Earnings/Km• Earnings/Seat km• Earnings/Buses• Earnings/Pax. km• Bus Staff Ratio• Dead Mileage
Performance measures for PhysicalPlanning• PT Network Density• Service Coverage• Network Density• Walking Distances ( Accessibility)• Terminal Location• Bus Supply Index (% of Fleet as per
Urban Bus Specification)• No. of Interchanges
At route level• Route network Density• Route Overlapping• Avg. Bus stop spacing• Operating Speeds on route network
Operational• % Fleet Utilization• Vehicle Utilization• Load Factor• Average Distance Travelled/
Passenger• Breakdown rate• Vehicle Efficiency
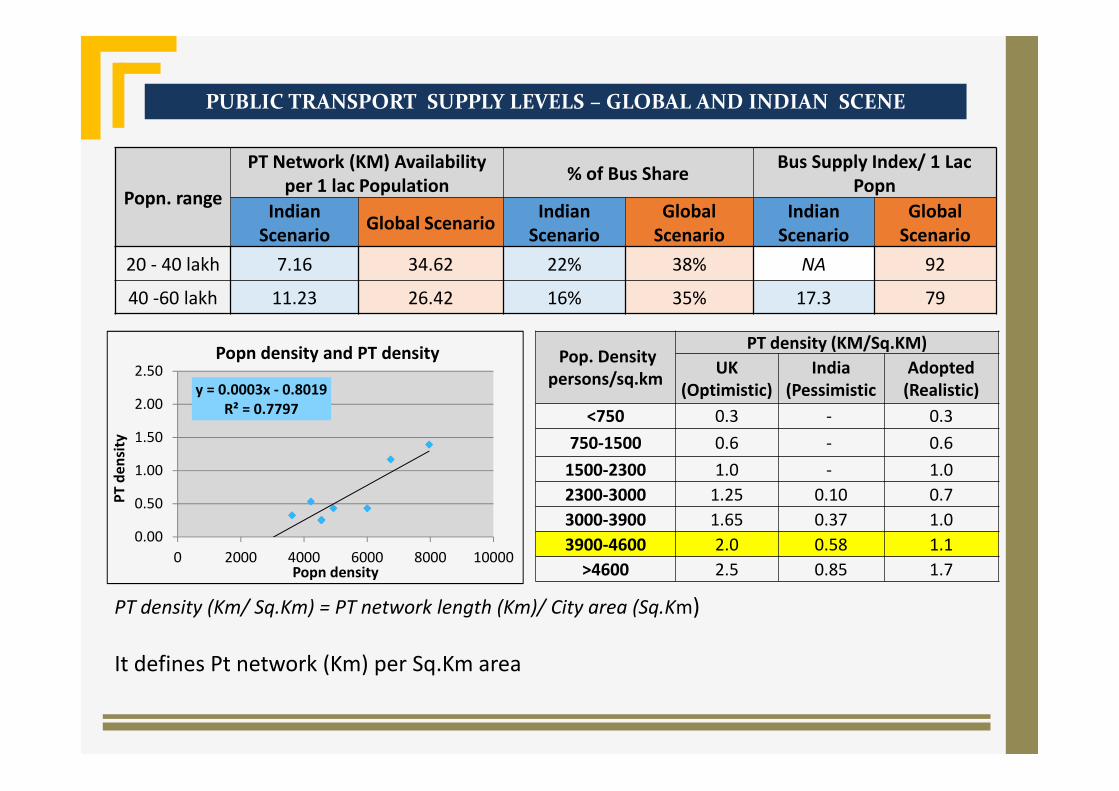
PUBLIC TRANSPORT SUPPLY LEVELS – GLOBAL AND INDIAN SCENE
Popn. range
PT Network (KM) Availabilityper 1 lac Population % of Bus Share Bus Supply Index/ 1 Lac
PopnIndian
Scenario Global Scenario IndianScenario
GlobalScenario
IndianScenario
GlobalScenario
20 - 40 lakh 7.16 34.62 22% 38% NA 92
40 -60 lakh 11.23 26.42 16% 35% 17.3 79
y = 0.0003x - 0.8019R² = 0.7797
0.00
0.50
1.00
1.50
2.00
2.50
0 2000 4000 6000 8000 10000
PT d
ensi
ty
Popn density
Popn density and PT density Pop. Densitypersons/sq.km
PT density (KM/Sq.KM)UK
(Optimistic)India
(PessimisticAdopted
(Realistic)<750 0.3 - 0.3
750-1500 0.6 - 0.61500-2300 1.0 - 1.02300-3000 1.25 0.10 0.73000-3900 1.65 0.37 1.03900-4600 2.0 0.58 1.1
>4600 2.5 0.85 1.7
PT density (Km/ Sq.Km) = PT network length (Km)/ City area (Sq.Km)
It defines Pt network (Km) per Sq.Km area
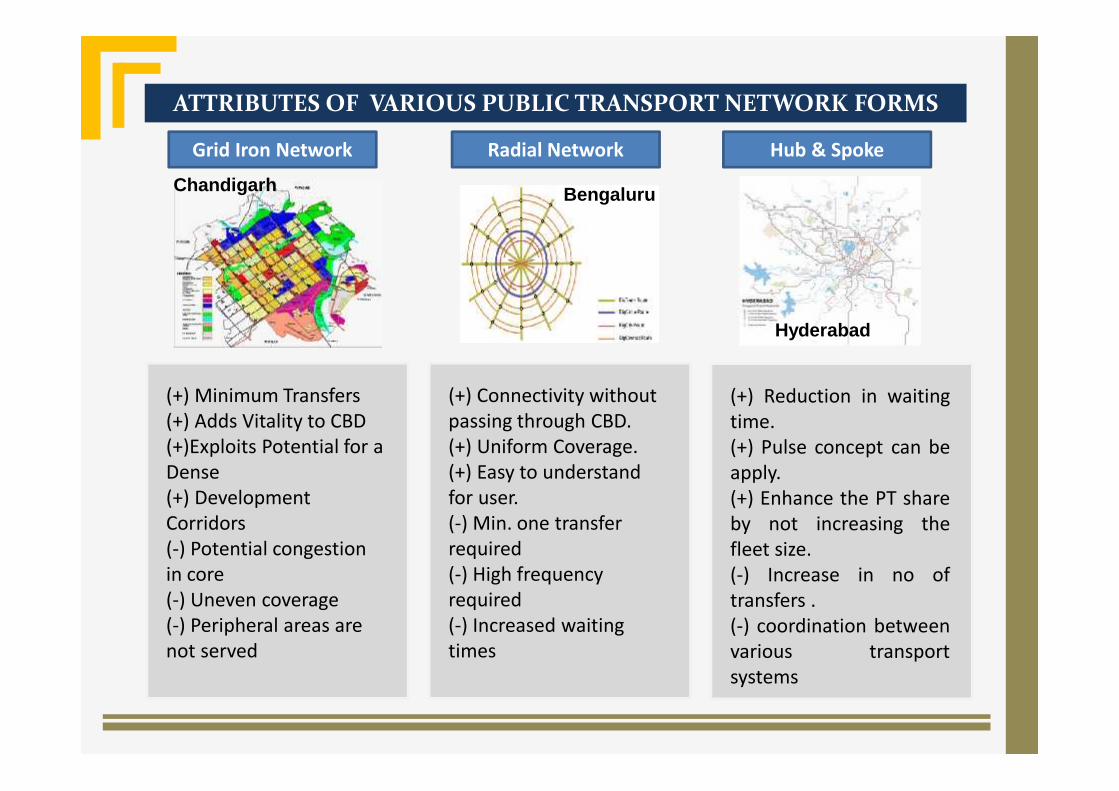
ATTRIBUTES OF VARIOUS PUBLIC TRANSPORT NETWORK FORMS
Bengaluru
Grid Iron Network
(+) Minimum Transfers(+) Adds Vitality to CBD(+)Exploits Potential for aDense(+) DevelopmentCorridors(-) Potential congestionin core(-) Uneven coverage(-) Peripheral areas arenot served
Radial Network
(+) Connectivity withoutpassing through CBD.(+) Uniform Coverage.(+) Easy to understandfor user.(-) Min. one transferrequired(-) High frequencyrequired(-) Increased waitingtimes
Hub & Spoke
Chandigarh
Hyderabad
(+) Reduction in waitingtime.(+) Pulse concept can beapply.(+) Enhance the PT shareby not increasing thefleet size.(-) Increase in no oftransfers .(-) coordination betweenvarious transportsystems

CASE STUDY PROFILE OF NOIDA
• Presently an industrial and residential suburb of Delhi will grow into
a metropolis by 2021
• Part of evolving conurbation extending from Delhi to Faridabad,
Greater NOIDA, Bulandshahr, Meerut and Ghaziabad
• Major Transport nodes are Atta Market, Great India Place, Sec-15,
Sec-16, Sec-62.
02468
1012141618
FY1981
FY1991
FY2001
FY2011
FY2015
FY2021
FY2025
Popu
latio
n
Year
Population( In Lakhs) City Profile
Population 8.24 lakhs
Area 203 sq.km
PopulationDensity
3152persons/sq
.km
Workforce 35%
NOIDA Master plan - 2021
Existing PT Network inNOIDA
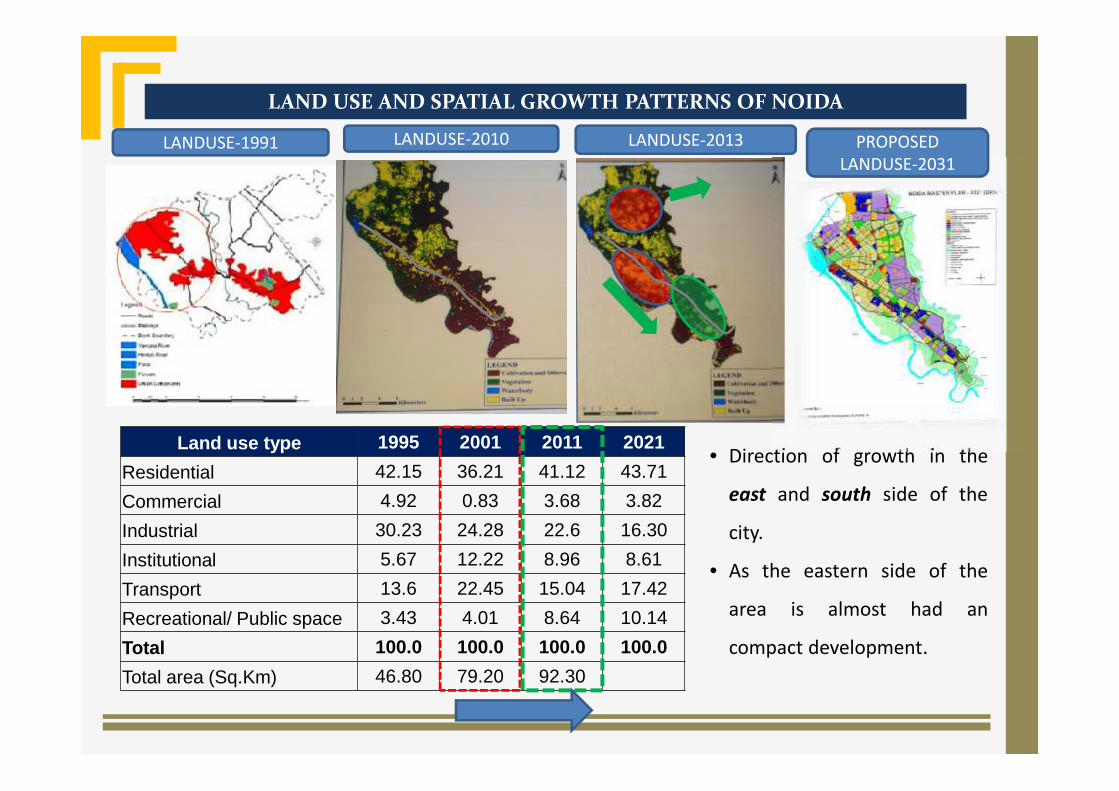
LAND USE AND SPATIAL GROWTH PATTERNS OF NOIDA
• Direction of growth in the
east and south side of the
city.
• As the eastern side of the
area is almost had an
compact development.
LANDUSE-1991 LANDUSE-2010 LANDUSE-2013 PROPOSEDLANDUSE-2031
Land use type 1995 2001 2011 2021Residential 42.15 36.21 41.12 43.71Commercial 4.92 0.83 3.68 3.82Industrial 30.23 24.28 22.6 16.30Institutional 5.67 12.22 8.96 8.61Transport 13.6 22.45 15.04 17.42Recreational/ Public space 3.43 4.01 8.64 10.14Total 100.0 100.0 100.0 100.0Total area (Sq.Km) 46.80 79.20 92.30
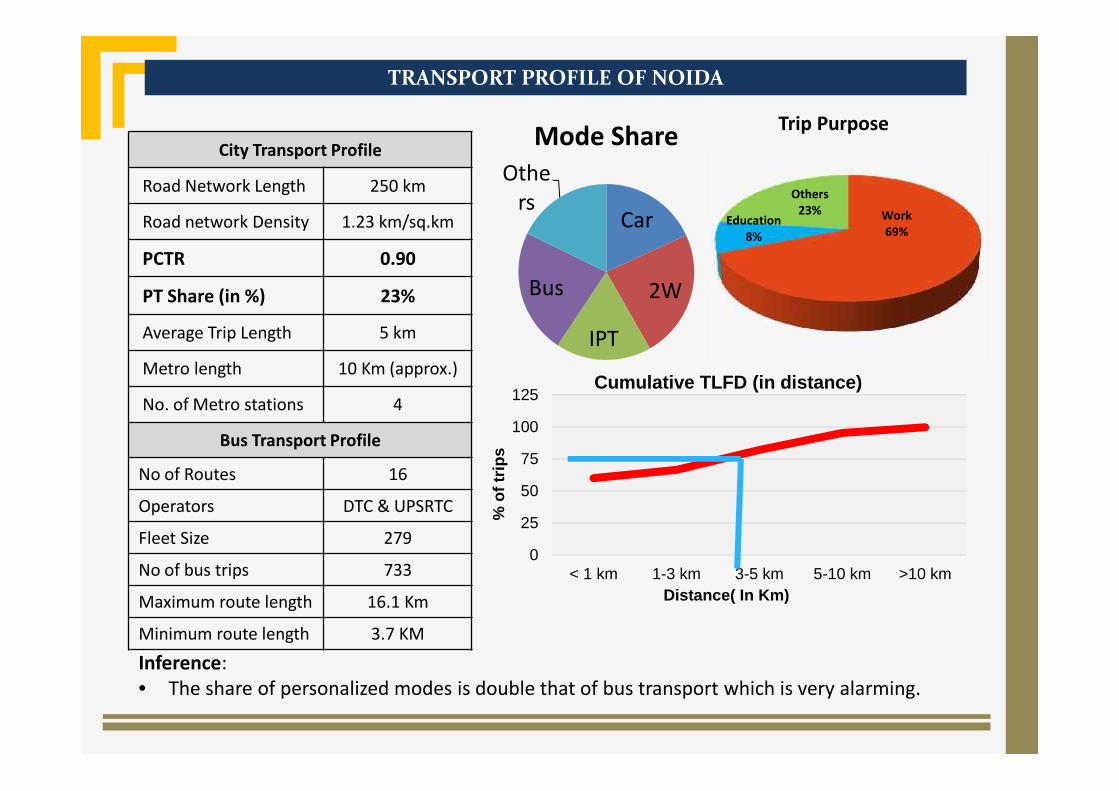
TRANSPORT PROFILE OF NOIDA
City Transport Profile
Road Network Length 250 km
Road network Density 1.23 km/sq.km
PCTR 0.90
PT Share (in %) 23%
Average Trip Length 5 km
Metro length 10 Km (approx.)
No. of Metro stations 4
Bus Transport Profile
No of Routes 16
Operators DTC & UPSRTC
Fleet Size 279
No of bus trips 733
Maximum route length 16.1 Km
Minimum route length 3.7 KM
Car
2W
IPT
Bus
Others
Mode Share
Work69%
Education8%
Others23%
Trip Purpose
Inference:• The share of personalized modes is double that of bus transport which is very alarming.
0
25
50
75
100
125
< 1 km 1-3 km 3-5 km 5-10 km >10 km
% o
f trip
s
Distance( In Km)
Cumulative TLFD (in distance)
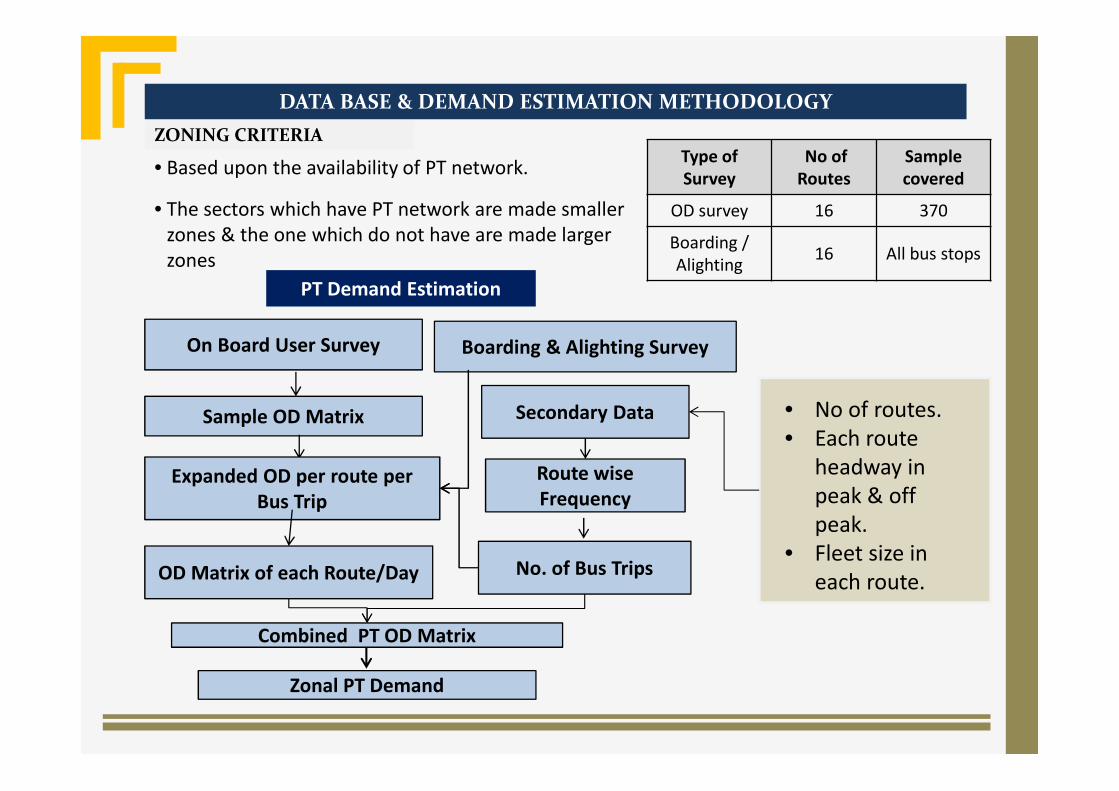
DATA BASE & DEMAND ESTIMATION METHODOLOGY
On Board User Survey Boarding & Alighting Survey
Sample OD Matrix
Expanded OD per route perBus Trip
OD Matrix of each Route/Day No. of Bus Trips
Route wiseFrequency
Secondary Data
Combined PT OD Matrix
Zonal PT Demand
Type ofSurvey
No ofRoutes
Samplecovered
OD survey 16 370
Boarding /Alighting 16 All bus stops
ZONING CRITERIA
PT Demand Estimation
• Based upon the availability of PT network.
• The sectors which have PT network are made smallerzones & the one which do not have are made largerzones
• No of routes.• Each route
headway inpeak & offpeak.
• Fleet size ineach route.
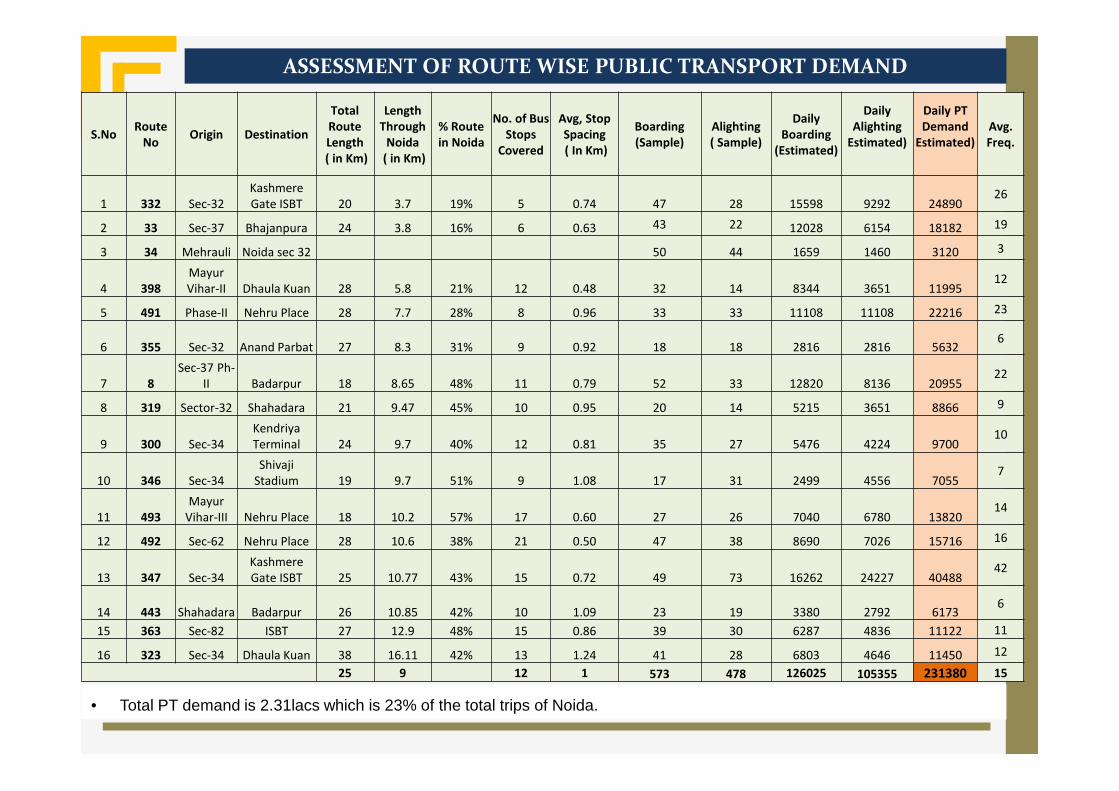
ASSESSMENT OF ROUTE WISE PUBLIC TRANSPORT DEMAND
S.No RouteNo Origin Destination
TotalRouteLength( in Km)
LengthThrough
Noida( in Km)
% Routein Noida
No. of BusStops
Covered
Avg, StopSpacing( In Km)
Boarding(Sample)
Alighting( Sample)
DailyBoarding
(Estimated)
DailyAlighting
Estimated)
Daily PTDemand
Estimated)Avg.Freq.
1 332 Sec-32KashmereGate ISBT 20 3.7 19% 5 0.74 47 28 15598 9292 24890
26
2 33 Sec-37 Bhajanpura 24 3.8 16% 6 0.63 43 22 12028 6154 18182 19
3 34 Mehrauli Noida sec 32 50 44 1659 1460 3120 3
4 398MayurVihar-II Dhaula Kuan 28 5.8 21% 12 0.48 32 14 8344 3651 11995
12
5 491 Phase-II Nehru Place 28 7.7 28% 8 0.96 33 33 11108 11108 22216 23
6 355 Sec-32 Anand Parbat 27 8.3 31% 9 0.92 18 18 2816 2816 56326
7 8Sec-37 Ph-
II Badarpur 18 8.65 48% 11 0.79 52 33 12820 8136 2095522
8 319 Sector-32 Shahadara 21 9.47 45% 10 0.95 20 14 5215 3651 8866 9
9 300 Sec-34KendriyaTerminal 24 9.7 40% 12 0.81 35 27 5476 4224 9700
10
10 346 Sec-34Shivaji
Stadium 19 9.7 51% 9 1.08 17 31 2499 4556 70557
11 493Mayur
Vihar-III Nehru Place 18 10.2 57% 17 0.60 27 26 7040 6780 1382014
12 492 Sec-62 Nehru Place 28 10.6 38% 21 0.50 47 38 8690 7026 15716 16
13 347 Sec-34KashmereGate ISBT 25 10.77 43% 15 0.72 49 73 16262 24227 40488
42
14 443 Shahadara Badarpur 26 10.85 42% 10 1.09 23 19 3380 2792 61736
15 363 Sec-82 ISBT 27 12.9 48% 15 0.86 39 30 6287 4836 11122 11
16 323 Sec-34 Dhaula Kuan 38 16.11 42% 13 1.24 41 28 6803 4646 11450 12
25 9 12 1 573 478 126025 105355 231380 15
• Total PT demand is 2.31lacs which is 23% of the total trips of Noida.
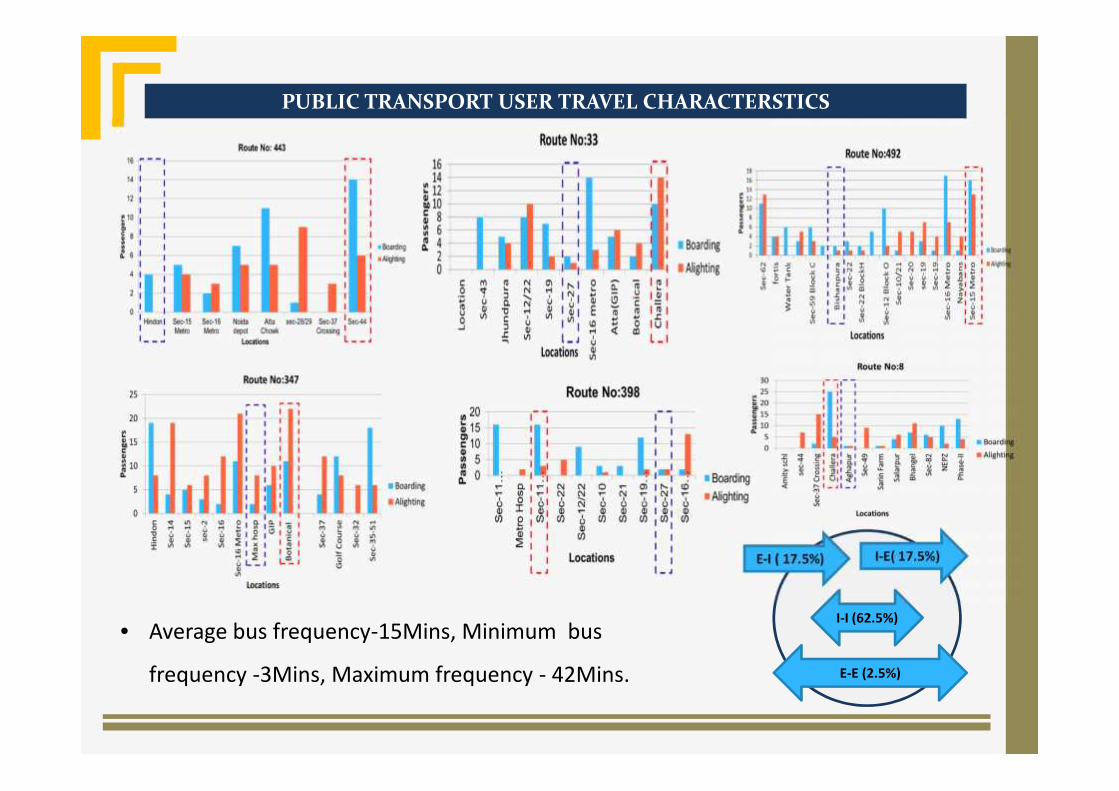
PUBLIC TRANSPORT USER TRAVEL CHARACTERSTICS
I-E( 17.5%)E-I ( 17.5%)
E-E (2.5%)
I-I (62.5%)• Average bus frequency-15Mins, Minimum bus
frequency -3Mins, Maximum frequency - 42Mins.

ASSESSMENT OF ACCESSIBILITY BASED PUBLIC TRANSPORT DEMAND
y = 10529x + 230.27R² = 0.6316
0
5000
10000
15000
20000
25000
30000
35000
0.00 0.50 1.00 1.50 2.00 2.50
PT R
ider
ship
Accessibility Index
Accessibility Index vs PT Ridership
Key Findings:• A good relation is observed between
accessibility index and PT ridership.
Accessibility Index = ∑Ni-j/Aj
Ni-j = Off Peak Frequency of route “I” passingthrough zone “j”.Ai = Area of that particular Zone.
Zone wise Accessibility map of NOIDA
Accessibility Index
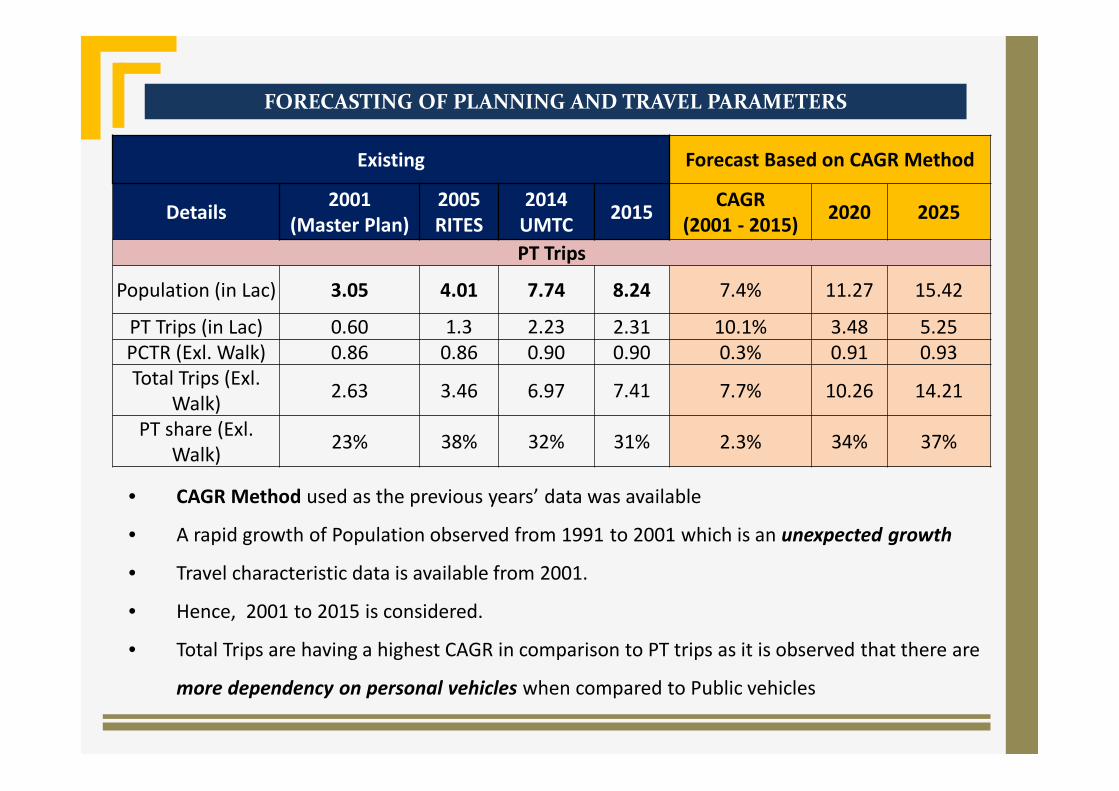
FORECASTING OF PLANNING AND TRAVEL PARAMETERS
Existing Forecast Based on CAGR Method
Details 2001(Master Plan)
2005RITES
2014UMTC 2015 CAGR
(2001 - 2015) 2020 2025
PT Trips
Population (in Lac) 3.05 4.01 7.74 8.24 7.4% 11.27 15.42
PT Trips (in Lac) 0.60 1.3 2.23 2.31 10.1% 3.48 5.25PCTR (Exl. Walk) 0.86 0.86 0.90 0.90 0.3% 0.91 0.93Total Trips (Exl.
Walk) 2.63 3.46 6.97 7.41 7.7% 10.26 14.21
PT share (Exl.Walk) 23% 38% 32% 31% 2.3% 34% 37%
• CAGR Method used as the previous years’ data was available
• A rapid growth of Population observed from 1991 to 2001 which is an unexpected growth
• Travel characteristic data is available from 2001.
• Hence, 2001 to 2015 is considered.
• Total Trips are having a highest CAGR in comparison to PT trips as it is observed that there are
more dependency on personal vehicles when compared to Public vehicles
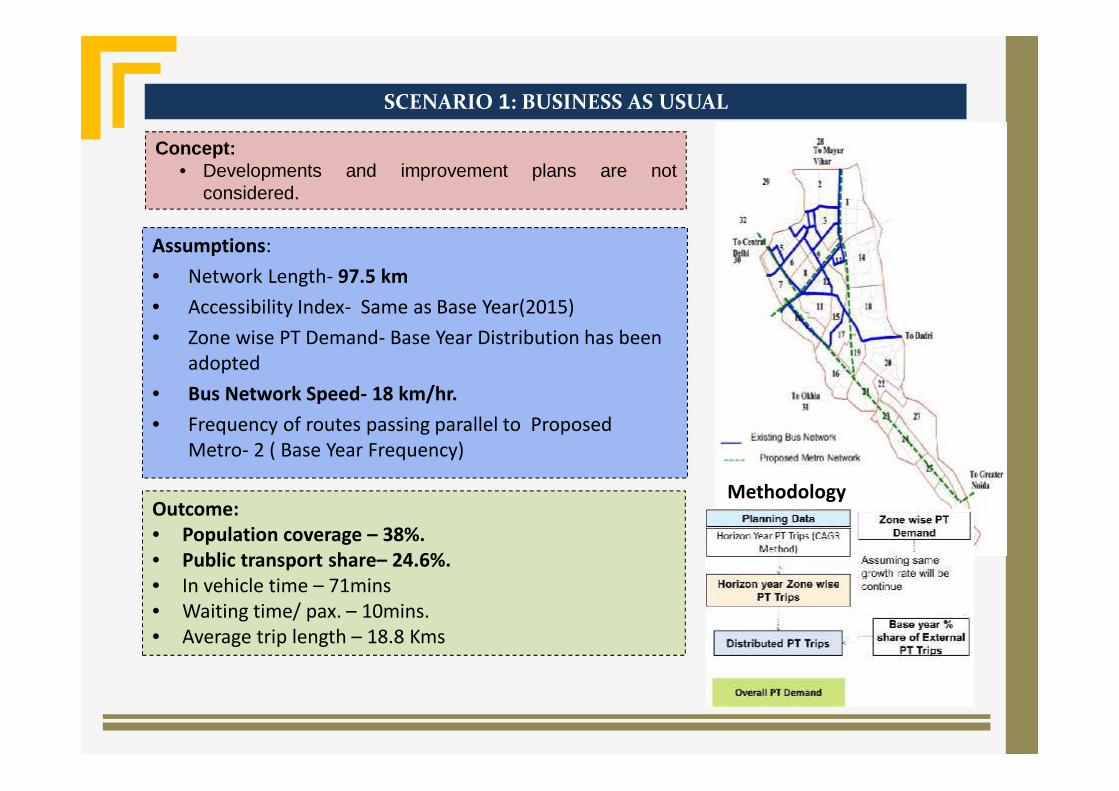
SCENARIO 1: BUSINESS AS USUAL
Assumptions:• Network Length- 97.5 km• Accessibility Index- Same as Base Year(2015)• Zone wise PT Demand- Base Year Distribution has been
adopted• Bus Network Speed- 18 km/hr.• Frequency of routes passing parallel to Proposed
Metro- 2 ( Base Year Frequency)
Outcome:• Population coverage – 38%.• Public transport share– 24.6%.• In vehicle time – 71mins• Waiting time/ pax. – 10mins.• Average trip length – 18.8 Kms
Concept:• Developments and improvement plans are not
considered.
Methodology

SCENARIO 2: INCREMENTAL INCREASE IN BUS NETWORK LENGTH
Key Assumptions:• Zone wise population distributed based on the
proposed master plan for the Horizon year• Population density increased in zones which have
low PPHa and have proposed development• Growth of core area population considered low• Required PT network density estimated based upon
the future population density as per PT networkdensity vs population density relation
• Zone wise PT ridership estimated based on theaccessibility model
Description Details
Existing PT N/W Density (In Km) 97.5
Desired PT Network Density(KM/Sq.KM) 1.0
Required in length (in Km) 200Gap in Network (in KM) 112.52025 Population (in lacs.) 15.24
Scenario 2 PT Network
Concept:• PT demand is estimated based on the PT Accessibility
Index Model and spatial growth patterns.
Outcome:• Population coverage – 76%.• Public transport share– 39.7%.• In vehicle time – 51mins• Waiting time/ pax. – 8mins.• Average trip length – 16 Kms
Methodology
Scenario 3 PT Network
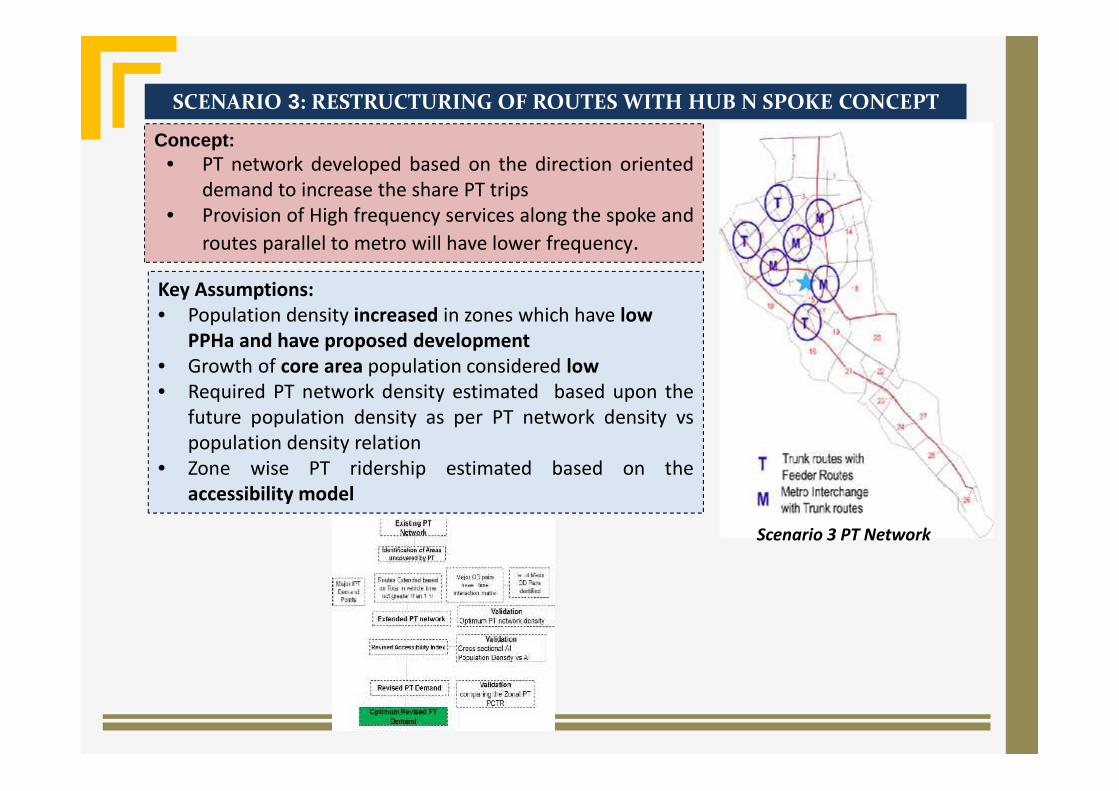
SCENARIO 3: RESTRUCTURING OF ROUTES WITH HUB N SPOKE CONCEPT
Key Assumptions:• Population density increased in zones which have low
PPHa and have proposed development• Growth of core area population considered low• Required PT network density estimated based upon the
future population density as per PT network density vspopulation density relation
• Zone wise PT ridership estimated based on theaccessibility model
Concept:• PT network developed based on the direction oriented
demand to increase the share PT trips• Provision of High frequency services along the spoke and
routes parallel to metro will have lower frequency.
SCENARIO 3: RESTRUCTURING OF ROUTES WITH HUB N SPOKE CONCEPT
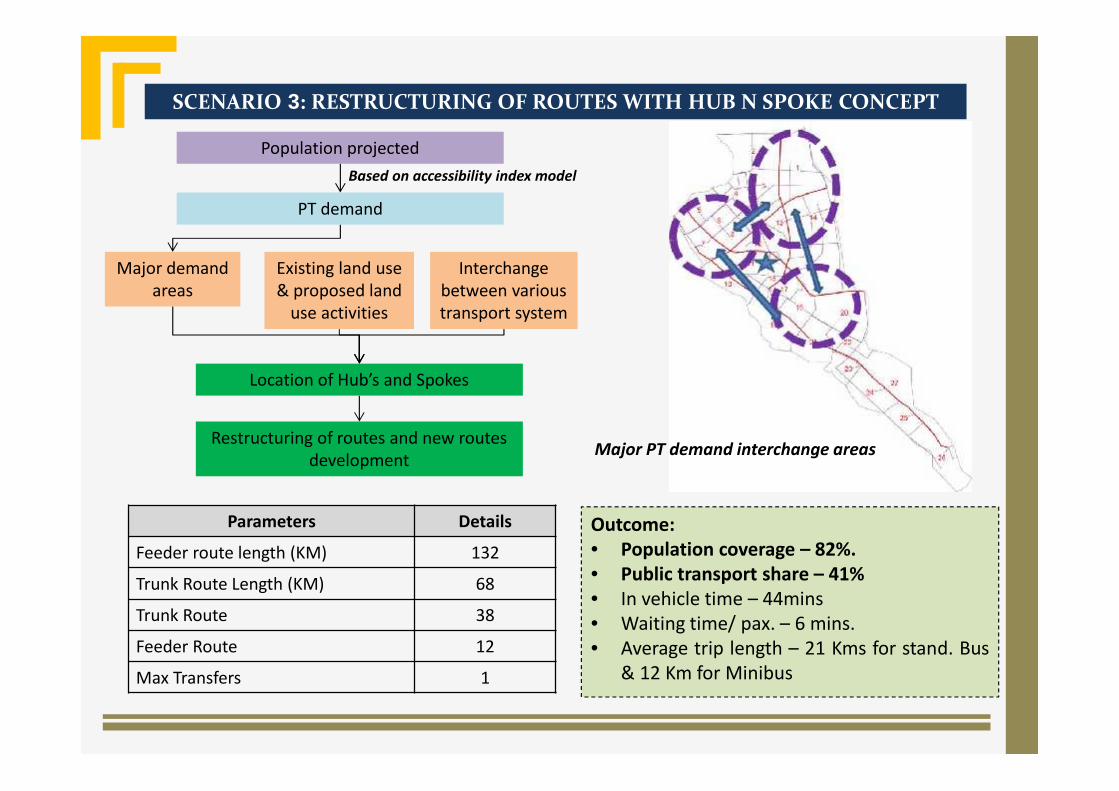
Parameters Details
Feeder route length (KM) 132
Trunk Route Length (KM) 68
Trunk Route 38
Feeder Route 12
Max Transfers 1
Major PT demand interchange areas
Population projected
PT demand
Major demandareas
Existing land use& proposed land
use activities
Interchangebetween varioustransport system
Based on accessibility index model
Location of Hub’s and Spokes
Restructuring of routes and new routesdevelopment
Outcome:• Population coverage – 82%.• Public transport share – 41%• In vehicle time – 44mins• Waiting time/ pax. – 6 mins.• Average trip length – 21 Kms for stand. Bus
& 12 Km for Minibus

EVALUATION OF SCENARIO
Summary S.No Parameter Sc-1(BAU WithMetro)2025
Sc-2 (IncrementalExpansion)2025
Sc-3 (Hub &Spoke)2025
Standard Bus Mini Bus
GEN
ERAL
1 PT Network Density(Km/Sq.Km) 0.4 1 1
2 PT Network Length(In km) 98 203 203
3 Population Covered 38% 76% 82%4 Total PT Trips( in Lakhs) 3.57 5.65 5.845 Bus Supply( Fleet Size) 521 950 200 8006 Total Bus Trips 3126 3800 800 70887 Avg Route Length ( km.) 25 27 28 148 Avg Trip Length (km) 18.8 16 21 12
USE
R 9 Vehicle Utilization(Km/Bus) 240 270 238
10 In vehicle time ( Mins.) 70 51 4411 Avg. Waiting Time/Pax. 10 mins 8 mins 6 Mins
OPE
RATO
R
12 Passenger Km Travelled(PKT) (in Lakhs) 71 87 96
13 Total Earnings/Day(In Lakhs) 53.4 65.3 71.9
14 Fleet Procurement Cost(In Lakhs) 14588 18788 7388
15 Operating Cost/ day(In Lakhs) 23.4 34.2 26.6

CONCLUSIONS AND RECOMMENDATIONS
Conclusion There is a strong relationship is observed between the accessibility index and
ridership. Hub and spoke concept is more feasible network approach to enhance the
Public Transport coverage in cities form like NOIDA. The approach developed in this study is useful to in assessing inequities in
Public Transport accessibility index in urban areas and aids in evolving PTnetwork strategies.
Recommendations Need for a scientific approach to enhance the Public Transport usage in
Indian cities as it is having rapid growth in cities Public transport network approach should be rationale rather than
conventional approach, so there is a need for integrated land use and publictransport network forms.
Further study• Similar Studies need to be conducted in different size of cities and application
of various network forms have to be tested.
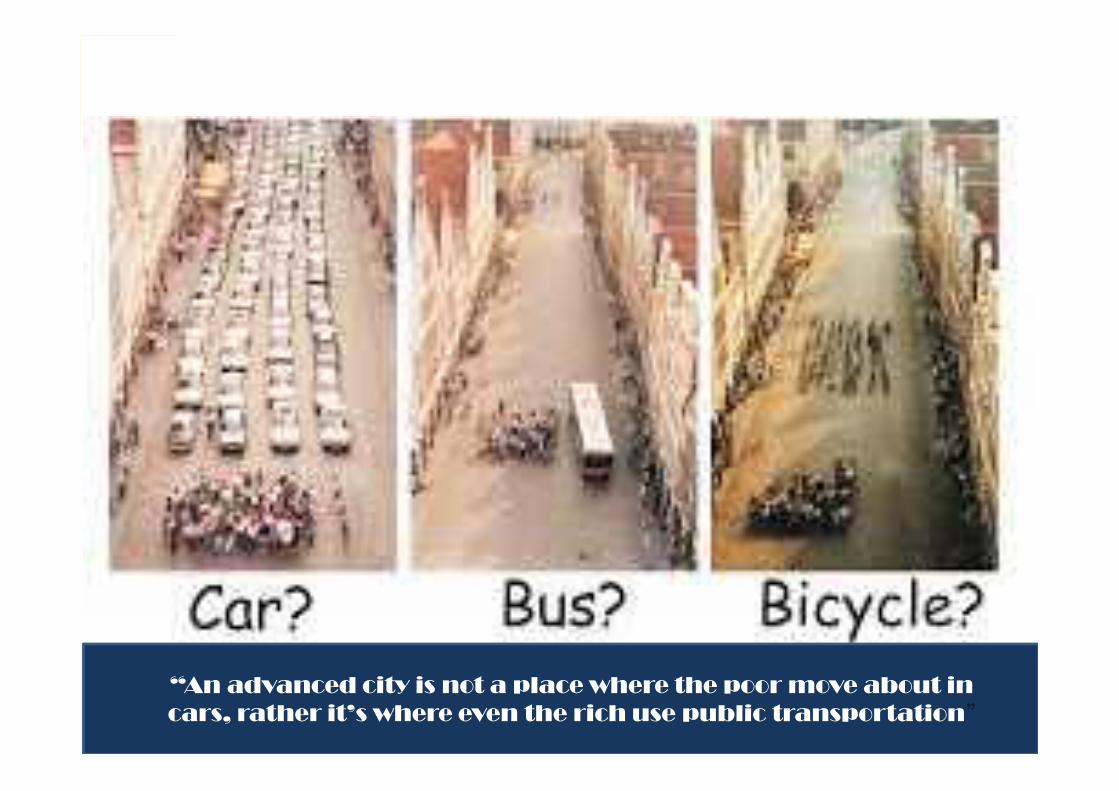
“An advanced city is not a place where the poor move about incars, rather it’s where even the rich use public transportation”