public transport accessibility through co-modality: are interconnectivity indicators good enough?
TRANSCRIPT

Research in Transportation Business & Management 2 (2011) 48–56
Contents lists available at ScienceDirect
Research in Transportation Business & Management
Public transport accessibility through co-modality: Are interconnectivity indicatorsgood enough?
Claudia de Stasio, Davide Fiorello ⁎, Silvia MaffiiTRT Trasporti e Territorio, via Rutilia 10/8 20141 Milano, Italy
⁎ Corresponding author. Tel. +39 2 57410380; fax +E-mail addresses: [email protected]
[email protected] (D. Fiorello), maffii@trt(S. Maffii).
2210-5395/$ – see front matter © 2011 Elsevier Ltd. Aldoi:10.1016/j.rtbm.2011.07.003
a b s t r a c t
a r t i c l e i n f oArticle history:Received 5 January 2011Received in revised form 22 June 2011Accepted 4 July 2011Available online 26 July 2011
Keywords:InterconnectivityCo-modalityNetworkAccessibility
Improving the accessibility of areas using public transport modes in various combinations (or even incombination with car) is one major goal of the concept of co-modality. For co-modality, the quality ofinterconnectivity is a major requirement to improve accessibility and indicators exist for measuringaccessibility and interconnectivity of nodes. However, in this paper we argue that co-modality is not fullymeasured by most common indicators. Furthermore, in that qualitative aspects are key features of comodality, indicators do not provide enough information for ex-ante analyses.
39 2 55212845.(C. de Stasio),trasportieterritorio.it
l rights reserved.
© 2011 Elsevier Ltd. All rights reserved.
1. Introduction
The role of transport networks and services is to allow people andgoods to move between different points in space, i.e. to provideaccessibility. When new infrastructures or modifications of transportsupply are planned their performance is assessed in terms of theimpact on accessibility. Road transport (i.e. better roads, newmotorways) has played a big role in improving accessibility in thelast half century. The undesired consequences of private transportsuch as congestion and pollution, but also fossil fuels consumptionand greenhouse gases emissions, have however prompted authoritiesto promote the use of public transport.
Unfortunately, public transport modes often supply a loweraccessibility level than car. This is one major reason why inducingmode shift from private cars to public services is difficult. One possiblestrategy to improve accessibility by public transport is to extend thepossibility to use public modes in various combinations (or even incombination with car). The basic idea is that even if one publictransport network (e.g. rail) alone cannot provide high accessibility,an integrated use of different networks (e.g. rail plus bus) can.
Whena combinationof transportmodes is involved, interconnectionrepresents a key part of the trip and the quality of interconnectivity isthen a major requirement. A smooth transfer from one network toanother is a matter of physical connections but also of functional andorganisational aspects like e.g. integrated services and ticketing. A
consequence is that measuring accessibility through modal combina-tions is challenging. Usually accessibility indicators do not distinguishbetween uni-modal and multi-modal trips, but just consider a measureof overall “distance” between zone pairs or nodes. This measuregenerally overlooks the functioning of interconnections, especiallywith reference to qualitative aspects. Ex-post, when an integratedtransport service is implemented and the quality of its interconnectionsis implicitly embedded in total travel times between zone pairs and inthe amount of the demandbetween zonepairs, common accessibility orinterconnectivity indicators can provide useful indications. For ex-anteanalysis, using indicators to forecast the effectiveness of new transportservices can be more problematic.
This paper tries to address this issue building on results of theEuropean project INTERCONNECT, aimed at investigating intercon-nection between short distance and long distance transport networks.After a definition of the research questions and of the methodology,the paper presents a theoretical background on accessibility andinterconnectivity indicators. The concept of co-modality is introducedwith special emphasis on its qualitative aspects. Then an applicationof interconnectivity indicators computed ex-ante onmodelling outputis presented and results are discussed in the light of co-modality. Theimplications of the analysis for managerial procedure and for futureresearch end the paper.
2. Research questions and method
Accessibility indicators are used to analyse the relative position ofregions in location terms but also to analyse the quality of transportnetworks. The latter purpose does not include only ex-post assess-ment of existing transport supply, but also ex-ante studies to identify

49C. de Stasio et al. / Research in Transportation Business & Management 2 (2011) 48–56
the expected outcome of new infrastructures or services andmaybe todiscriminate between alternative solutions. For ex-ante analyses,accessibility indicators are basically summaries of modelling output interms of e.g. travel times between zone pairs of nodes.
In most cases, accessibility indicators consider some syntheticmeasures of the “distance” between zones, therefore direct connec-tions between zones give rise to better accessibility measures. Wherea transfer between networks is needed the relative accessibility islower: in order to improve it themost intuitive strategy is to provide adirect connection. This strategymakes implicit reference to private caras the best solution (at least at the urban scale). In these terms publictransport services are improved only if they reduce the need ofinterchanges or reduce the time required for the interchanges.
Assuming the point of view of co-modality, where the use ofdifferent networks is not a suboptimal solution but the best strategy,do measures of accessibility based on distance andminimised transferprovide a representative picture of the transport network? Cantraditional simulation models provide enough elements to estimateex-ante the improvements of interconnectivity and their impact ondemand? These are the questions addressed in this paper.
The objective of the paper is not to provide conclusive responses tothese questions, but rather to present the need for further reflectionson the matter. We address the research starting from the theoreticaldefinition of accessibility indicators and then to the translation of thisdefinition for the analysis of interconnectivity. Then we discuss insome detail the concept of co-modality and the various elements ofinterconnectivity that have to be considered to design networks topromote co-modality. In the light of this theoretical analysis weintroduce an example of calculation of interconnectivity indicatorsbased on a modelling application designed to analyse interconnectionand discuss the significance of the results.
2.1. The concept of co-modality
There are no official definitions of the terms used for describing themobility of passengers or the transport of goods using more than onetransport mode. In literature one can often come across the words“multi-modality” and “inter-modality” to define a characteristic of atransport system that allows at least two differentmodes to be used inan integrated manner in a door-to-door transport chain. The majordistinction between the two terms is that multi-modality is generallyapplied to passenger mobility while inter-modality usually refers tofreight transport.
Multi-modal or inter-modal transport usually implies that onetransport mode is used as main mode for making the trip, while theother(s) is (are) used as access or egress mode(s). Consequently, thetransport modes, and thus also the related transport networks,operate together in a hierarchical structure. It is easy to distinguishsuch hierarchical structures in existing networks, for instance,regional roads and freeways, or short-distance and long-distancepublic transport services.
Interconnectivity is a characteristic of a transport network thatallows multi-modal or inter-modal transport. Interconnections arethe connections between the infrastructures of the various transportnetworks. However, interconnectivity goes beyond multi-modalityand inter-modality. The SORT-IT Project defined interconnections as“connections between international, national, regional and localnetworks, both within and between transport modes” (Institute forTransport Studies (ITS) et al., 1999). It might be noted that accordingto this definition a trip composed a short urban segment made by busfollowed by an inter-urban long segment still made by (a different)bus is considered an interconnected trip. Also, an urban trip started onan underground line and ended on a different underground line is alsoan interconnected trip.
These examples highlight that the core concept of interconnectionis not only the use of different transportmodes but especially the need
to make a transfer during the trip. The difference between usingdifferent transport modes for one trip or travelling on interconnectednetworks can be subtle. If this difference exists its essence should befound in the functioning of interconnections between differentnetworks considered as a sort of single super-mode of transport.Traditionally it is assumed that a multi-modal or inter-modal trip ismade because a uni-modal connection is not available between originand destination. However multi-modality and inter-modality canallow for combining the strengths of the different transport modes(and to avoid their weaknesses) in order to optimise the travel timeand costs. For instance, even if one might use only road or direct railservices to reach one destination, it might well be that a multi-modaltrip road+air+rail can significantly reduce travel time without asignificant increase of travel cost. On this respect a new definition hastaken place in recent years: co-modality.
Co-modality refers to the use of different modes on their own andin combination in order to obtain an optimal mobility outcome interms of travel effort as well as transport sustainability and supplyefficiency. Co-modality recalls the principle that “public transportoperates most successfully when it is planned as a unified network tosupport seamless multi-destination travel rather than as individuallines catering to single trips” (Dodson, Mees, Stone, & Burke, 2011).This principle is based on the concept of public transport networkplanning. i.e. “serving the maximum number of possible journeyswith the minimum of operational resources” (Mees, Stone, Imran, &Nielson, 2010). In other words, the way the various means oftransport are utilised should always result in the best possiblecombination, in ecological, economic and social terms. Co-modalitytherefore widens the analysis of interconnections from a pure“shortest-path” approach to a more comprehensive definition wherethe user perspective is enriched with considerations about the qualityof interconnections and is complemented with elements concerningsupply.
The supply-side is related to the efficiency of the service.According to a co-modality perspective, the optimal connectionbetween two zones is not the best conceivable service that any modecan provide (e.g. a direct underground connection, a very frequentbus service, etc.) but the best service that could be provided with anoptimal use of resources in the whole transport system. In otherwords, improving accessibility by providing direct, fast and frequentservices by means of a single mode can be less preferable thanimproving accessibility by providing working interconnections tobuild a co-modal path. At least if the latter solution costs a fraction ofthe former one and its burden on travellers (both as user andtaxpayers) is significantly lower.
Following the approach proposed by Keller (2001) physical andfunctional dimensions of interconnectivity can be distinguished. Inthe narrow physical sense, interconnections are structural transitionsbetween the infrastructures of the various transport networks. Theyconsist of structural and technical installations providing access to thenetworks (platform, transhipment installations, etc.). From this pointof view, improving interconnectivity means provide better transferfacilities, which is the kind of intervention closer to the traditionalconcept of good interconnection.
Functional dimensions of interconnectivity are those more linkedto the principle of co-modality. Acting on functional dimensionsimprovements should be reflected in better accessibility, but “better”does not necessarily mean “faster”. Even when zone pairs becomecloser in terms of travel effort, this can be the effect of qualitativeaspects. For public transport network planning a significant literatureexists (see e.g. the aforementioned contribution by Dodson et al.,2011).
The interconnection between long distance and short distancenetworks presents specific questions to be addressed. For instance,unlike urban cases, different operators are almost always involved.Also, while urban networks are often used by regular users (e.g.
50 C. de Stasio et al. / Research in Transportation Business & Management 2 (2011) 48–56
commuters) the interconnections between long distance and shortdistance networks serve a large share of occasional travellers thathave limited or no experience of transfer points.
A review of relevant aspects can be enumerated building on theintermediate results of the INTERCONNECT project (http://www.interconnect-project.eu/). INTERCONNECT started in 2009 within the7th Research Framework Programme of the European Commissionand aims to investigate interconnection between short distance andlong distance transport networks. Within the project examples ofgood practice from Europe and elsewhere have been analysed to showhow passenger interconnectivity could benefit from a co-modalityapproach (Ulied et al., 2010b). INTERCONNECT has identified thefunctional dimensions of interconnectivity include aspects like thefollowings.
2.1.1. Co-ordination and co-operationEffective interconnection requires the provision of both integrated
networks and services. The achievement of this integration usuallyrequires a strong co-operation between a range of authorities andproviders in the public and private sectors. The creation of effectiveinterconnection may sometimes conflict with the priorities ofauthorities and providers who have hitherto be concerned solelywith serving a local constituency.
In general, the various transport networks (infrastructure andservices) are owned and/or operated by different independent publicor private organisations, which in many cases compete against eachother for a share of the transportmarket (e.g. road, rail, air). Therefore,each transport company endeavours to optimise the building andoperation of its own network and transport services. Thus mono-modal operational and economic interests take precedence overcustomers’ co-modal interests. Passengers appear only of interest aslong as they stay on a given network. Particularly in passengertransport none of the various actors is responsible for the wholeintermodal route from house to house or for intermodal networkconnection. No transport company is generally responsible forbuilding and operating interchange points either. Transfer processesin passenger transport are generally accompanied by loss of time,costs, safety and reliability problems and loss of comfort. There istherefore room for significant improvements of co-modality throughco-ordination of different actors.
2.1.2. InformationIn the case of interconnected multimodal transport chains it is
necessary that users can obtain information quickly and easily. Often,many sources of information deal only with a subset of the modes andservices required to complete the journey and generally informationon offered intermodal services is still definitely rare. For example,many travel agents will have no knowledge of local bus serviceslinking an airport to the local city and are unlikely to be able to selltickets for such services in conjunction with an air ticket. Similarly,most internet-based journey planners deal only with a single mode.This may be because they cannot earn any commission from sale ofthe “local” tickets, or because of institutional and technical barriersinvolved in accessing such information.
Barriers to consistent information and marketing can be foundeven within a single mode. A good example is the UK rail systemwhere services are operated by more than 20 different companieswho are allowed to, and to some extent are encouraged to, developtheir own brand and marketing strategy. Operators will, quitenaturally, give more priority to publicising their own services thaninterconnected services for which they will receive only a share of therevenue. Also, they may not wish to compromise their own brandimage by allowing it to be diluted by association with a joint venturewith another provider. As a result passengers are exposed toinconsistent or incomplete information and marketing messages aseach operator strives to differentiate its service and promote a
distinctive brand. Since inter-modal traffic typically represents only asmall proportion of each individual operator's demand their market-ing will be tailored to their core market, their particular priorities andoperating practices.
Making access to full information for easy and fast planning a co-modal trip is one of the key aspects to improve interconnectivitybetween networks.
2.1.3. Pricing and ticketingEspecially for long distance trips, travel tickets are mostly valid
only for parts of the overall route (e.g. long distance only). Eachpassenger buys individual transport services on specific networks. Therequirement to purchase separate tickets for each journey can beparticularly onerous for travellers who do not know the location of theplaces where tickets can be bought and may be unsure of the type(s)of ticket that can or should be purchased.
Integrated pricing and ticketing schemes (e.g. allowing travellersto make a journey involving both long distance rail and local trans-port modes with a single ticket) would facilitate passengers’ multi-modality especially for long distance trips and encourage travellers touse a combination of the long distance and local public transportservices. Of course in this case the basis assumption is that theintegrated ticket price should be not higher than the combined costof separate tickets for any trip of the different modes within theintegrated network.
2.1.4. TimetablingThe successful operation of connected transport services cannot be
separated from harmonised schedules of all modes available at acertain interchange point, providing both short transfer and waitingtimes. Improvements in this sense could be directly achieved byoptimising services’ timetabling. As an example, when a non frequentlong distance service is fed by a regional service, the schedule of such aservice to and from the interchange point should be designed such assafety margins exist in order to reduce the likelihood that any delayswill have cumulative effects. Schedules with built-in safety marginsare termed “robust”.
Creating robust schedules for co-modal trips is challenging but itcan greatly improve interconnectivity even without reducing traveltime. For instance, if the schedule of a regional train is changed toreach the interchange station 15 min in advance with respect to thedeparture time of high-speed services (instead of 5 min), travel timeincrease, but in fact the connection is made more robust and theinterconnection is improved.
2.2. Co-modality and indicators
2.2.1. Accessibility and interconnectivity indicatorsAccessibility determines the location position of an area relative to
all areas (including itself). In general terms, accessibility is the outcomeof two functions, one representing the attractiveness of the areas thatcan be reached and one representing the “effort” needed to reach them(European Spatial Planning Observation Network (ESPON), 2010):
Ai = Σj g Wj
� �f cij� �
ð1Þ
Where:
A accessibility of area i,Wj attractiveness to be reached in area j,cij the “effort” for reaching area j from area i.
The functions g(Wj) and f(cij) are called “activity function” and“impedance function”, respectively. According to the form of these

51C. de Stasio et al. / Research in Transportation Business & Management 2 (2011) 48–56
two functions, different types of accessibility indicators are calculated.Widely used indicators include e.g.:
Travel cost where g(Wj) has value “1” or “0” depending onthe destination zone (e.g. it is “1” for zoneswhere attractiveness exceeds a given threshold)and the impedance function is travel time ortravel cost itself.
Daily accessibility where f(cij) is expressed in terms of travel timeand only destinations within 24 h (or anotherthreshold) are considered.
Potential accessibility Where the impedance function is generallynonlinear, (e.g. exponential) andalso theactivityfunction may take account of agglomerationeffects or economies of scale and therefore canbe nonlinear (e.g. a power function).
Indicators can be estimated for alternative modes to show, forinstance, that road accessibility and rail accessibility of regions mayvary due to existing infrastructures. When trips require to use morethan onemode, also intermodal accessibility can be estimated. In suchcases the impedance function should implicitly or explicitly includealso the effort to transfer between modes. Examples of accessibilityindicators computed according to [1] can be found in Lutter, Pütz, andSpangenberg (1993) for passengers and in Chatelus and Ulied (1995)for freight.
From a different perspective and with specific reference to multi-modal trips, the Interconnectivity Ratio indicator has been proposed byKrygsman, Dijst, and Arentze (2004) as the proportion of access andegress time to/from the network to total trip travel time:
IRi = Σj ATij + ETij� �
=Σj TotTij ð2Þ
Where:
IRi Interconnectivity Ratio of area i,ATij access time to the network for reaching area j from area i.ETij egress time from the network for reaching area j from area i.TotTij total travel time for reaching area j from area i.
This indicator stems from the consideration that access and egressstages are the weakest part of a multimodal chain and theircontribution to the total travel disutility is often substantial.
A third group of accessibility indicators that are applied to multi-modal transport are interconnectivity indicators, derived from thegraph theory and network analysis. Such indicators provide alterna-tive measures of nodes “centrality” within a graph, i.e. its relativeimportance. Different measures of centrality have been applied to theanalysis of public transport networks (Scheurer & Curtis, 2008;Scheurer, Curtis, & Porta, 2007).
One of such measures is the Degree Centrality of a node, whichdenotes the number of connections and local opportunities associatedto that node. A possible application of this concept to a transportnetwork is computing the degree centrality as follows:
DCi = Σj MTij =N ð3Þ
where:
DCi Degree Centrality of node iMTij 1 if area j can be reached by underground from area i
without interchanges, 0 otherwise (i,j ∈ N and i≠ j)N all nodes in the network.
With this formulation the indicator depicts the average minimumnumber of transfers required to travel between any pair of nodes in the
network. Reducing the transfer-dependency of a network, offeringmoredirect links between different nodes and routes, gives rise to a lowerdegree centrality index.
A second measure taken from graph theory is Closeness Centralitydefined by the inverse of the impedance between the node in questionand all other nodes in the network:
CCi = N−1ð Þ=Σj Distij ð4Þ
where:
CCi Closeness Centrality of node iDistij impedance between nodes i and j (i,j ∈ N and i≠ j)N all nodes in the network.
Closeness Centrality is similar to a traditional accessibilityindicator. It increases when the impedance between zones is reduced,but does not provide any specific information on how the existinginterconnections work. This aspect can be considered in the definitionof the impedance, which can be measured in several alternative ways:distance, travel time, travel cost, etc. Scheurer et al. (2007)) usedtravel time divided by frequency. Other measures of impedancewhere e.g. a penalty for transfer time is applied could be used toemphasise the role of interconnectivity.
2.2.2. Measuring co-modality with indicatorsCo-modality assumes that mode transfer is an inherent feature of
trips taking place onto networks planned and managed to be used formulti-modal trips. In making interconnectivity between networkswork, qualitative (functional) aspects can play a major role. In thiscontext, indicators like those examined above are much lessinformative to measure the level of interconnectivity.
In general, despite multi-modal accessibility being explicitlyconsidered, the goal of accessibility indicators remains to provide arepresentative measure of the overall impedance in physical termsrather than investigating how the interconnectivity between modeswork. In other words, the focus is on overall travel “distance” than oninterconnections conditions. If one of the interconnected modesbecomes faster (e.g. a high speed train replaces a conventional railconnection available from the airport) this is reflected in someimprovement of the accessibility indicator. However, this effect hasnothing to do with an enhancement of the interconnection. If the“interface” between the two modes remain the same (e.g. nofacilities to reach the rail station from the terminal, no possibilityto purchase a single ticket for the whole trip or, at least, to buy therail ticket during the flight, etc.) the level of co-modality is notchanged. The higher accessibility is due to higher speed of one of themodes, not to some change planned to make the combination ofmore modes work better.
Also interconnectivity indicators are unable to capture themanifold dimensions of co-modality. The Interconnectivity Ratio asproposed for public transport networks is mostly a “network” indexand it is a reflection of the “relative time catchment. […] It representsthat part of trip time that the user is physically occupied or willing to“sacrifice”, to reach the public transport system and their finaldestination. (Krygsman et al., 2004). In this form the Interconnec-tivity Ratio does not provide a reliable measure of the quality of amulti-modal trip for long distance journeys where long access andegress stages do not necessary mean a bad quality of interconnec-tion. For instance, if an Interconnectivity Ratio of 0.3–0.4 is high incase of local transport, it can be a normal value when an air trip over700–1000 km is considered. Furthermore, in the proposed indexaccess and egress times do not include waiting and transfer timeswhile aspects like the service frequency or the optimisation oftimetable at the interchanges are important elements in passenger

52 C. de Stasio et al. / Research in Transportation Business & Management 2 (2011) 48–56
interconnections. Including average waiting and transfer times in theindex could provide a more representative index that inform, at leastpartially, also on the quality of interconnection.
Closeness Centrality is similar to traditional accessibility indexes,being focused on total travel impedance, and so it is “blind” withrespect to the quality of interconnections.
In the definition of Degree Centrality, transfers are by definitionnegative circumstances that should be minimised. So, DegreeCentrality is basically incompatible with the concept of co-modality.Even if one may agree that in principle direct connections arepreferable, in some cases theremight be strong organisational reasonsto design a network according to a hierarchical, hub-and spokes typesystem. For instance, buses acting as feeders to rail at dedicatedinterchanges or using one major airport as hub can provide a moreefficient service (thus impacting also on user costs) than many directconnections. In such cases a lower degree centrality network wouldarise. Also, if an underground network is opened to replace a bussystem on some routes, it can happen that two zones are connectedthrough an interchange rather than with a direct service. If theinterconnection is well designed total travel time can be significantlyreduced despite the need for the interchange. However, the DegreeCentrality index would decrease since a higher number of transfersare required.
In literature one may find other indicators of interconnectivity(e.g. Gonçalves, da Silva Portugal, & Nassi, 2009; Kazerani & Winter,2009; Scheurer et al., 2007), but they also do not inform on the qualityof interconnectivity, but on the relative position of nodes within thenetwork. This is the case for instance of Betweenness Centrality(defined for each node as the average proportion of paths betweenany two nodes within the network that traverse the node inquestion); Straightness Centrality (defined as the ratio of the actualinverse average shortest path length between the node in questionand all other directly connected nodes, to the theoretical averageshortest path length within that sample) and Information Centrality(defined as the relative drop in network straightness in case the nodein question is removed from the network).
Using the concept of co-modality, measuring the level ofinterconnectivity does not correspond to measuring total traveltime or cost nor the number of direct connections. Even the timespent at interchanges or its weight on total travel time is not arepresentative measure of co-modality since other key aspects likeinformation, ticketing, interoperability is not reflected in theindicators.
The problem can be considered of minor importance for ex-postanalyses. Once interconnections between different networks areestablished, also qualitative aspects contribute to define the overalltravel “effort”. Thus, travel costs, total travel time, waiting time attransfer points partially reflect the level of “co-modality”. Furthermore,if the functionality of interchanges is good, the amount of demandbetween region pairs can increase, i.e. the activity function of regions ishigher. Assessing whether the integration of different networks hassucceeded canmake use of accessibility and interconnectivity indexes ifthey are used appropriately.
The limitations of indicators are much more significant for ex-antestudies, where qualitative elements are difficult to be dealt with. Forinstance, if a transport network model is used to make demandforecasts, only physical aspects and some functional elements can beconsidered and transformed into model parameters. Availability andquality of information, ticketing facilities, availability of facilities tomove between terminals, the possibility to spend waiting time in aproductive way are generally beyond the capabilities of simulationmodels or can be simulated only indirectly, by means of roughassumptions on travel time or cost. Co-ordination of services andtimetabling are in principle in the domain of models, but themodelling task for a proper simulation of these aspects in case ofinterconnectivity between long-distance and short-distance networks
can be huge. Urban models can represent timetables of peak-timeservices of different operators (even if quite sophisticated models areneeded). Regional or national models can hardly do the same for airservices, different rail services and local networks. As a result,qualitative aspects will be generally neglected in ex-ante modellingsimulations. Travel times and costs of multi-modal trips will be morethe outcome of separated improvements of single modes and theconcept of co-modality will not be fully captured. Therefore,accessibility and interconnectivity indicators applied to model resultswill provide hard to interpret hints from a co-modality perspective.Indeed, authors proposing such indexes (e.g. the quoted works fromScheurer at. al., see also Rochat, 2009) are aware of their limitationsand usually use them in combination or together with otherinformation and indexes.
But even without considering qualitative aspects and limiting theanalysis to simpler interventions to improve interconnectivity,indicators can give poor indications. In the next section an exampleis provided taken from the work made in INTERCONNECT (see Uliedet al., 2010a).
3. Findings and discussion
To show how some of the interconnectivity indicators introducedabove behave, some results taken from amodelling application for theMilan metropolitan area in Italy are presented. In particular, theanalysis is focused on the interconnectivity of rail and undergroundservices. The application of the Milanmodel can provide useful resultsto support the considerations made on the role of qualitative aspectsin co-modality.
The analysis is carried out by means of modelling simulation. Themodelling tool is a transport network model aimed at representing themobility in the Milan metropolitan area with a special attention tomultimodal trips and taking explicitly into account the connectionbetween long distance transport services (air and rail) and localnetworks (private and public). The model is built using the MEPLANsoftware and deals with mode split and assignment of exogenouslyprovided origin/destinationmatrices of personal trips. In themodel, thecity of Milan is broken down into 30 zones. The main urban transportnodes like railway stations are located in separated zones in order tosimulate explicitly trips between suchnodes (a significant part of whichare related to interconnectionbetweendifferent transport services). TheMilan hinterland (including Milan province as well as the Monza andBrianza province) is divided into 76 zones. Municipalities are the basicunit of hinterland zones, but in some cases more detail is used to betterrepresent accessibility to rail services.
Interconnectivity is simulated with more detail than in usualapplications at this scale. The model simulates peak-morning timewith a static assignment algorithm, therefore it does not include fulltimetables of public modes. Nevertheless, service frequencies of railand metro are modelled and complex user-cost functions areimplemented to simulate as realistic as possible the tariffs paid bymulti-modal travellers. Dedicated links are used to simulate walkingtransfers at terminals (e.g. at rail stations where interchange withmetro is available) with an associated travel time and, where relevant,travel cost.
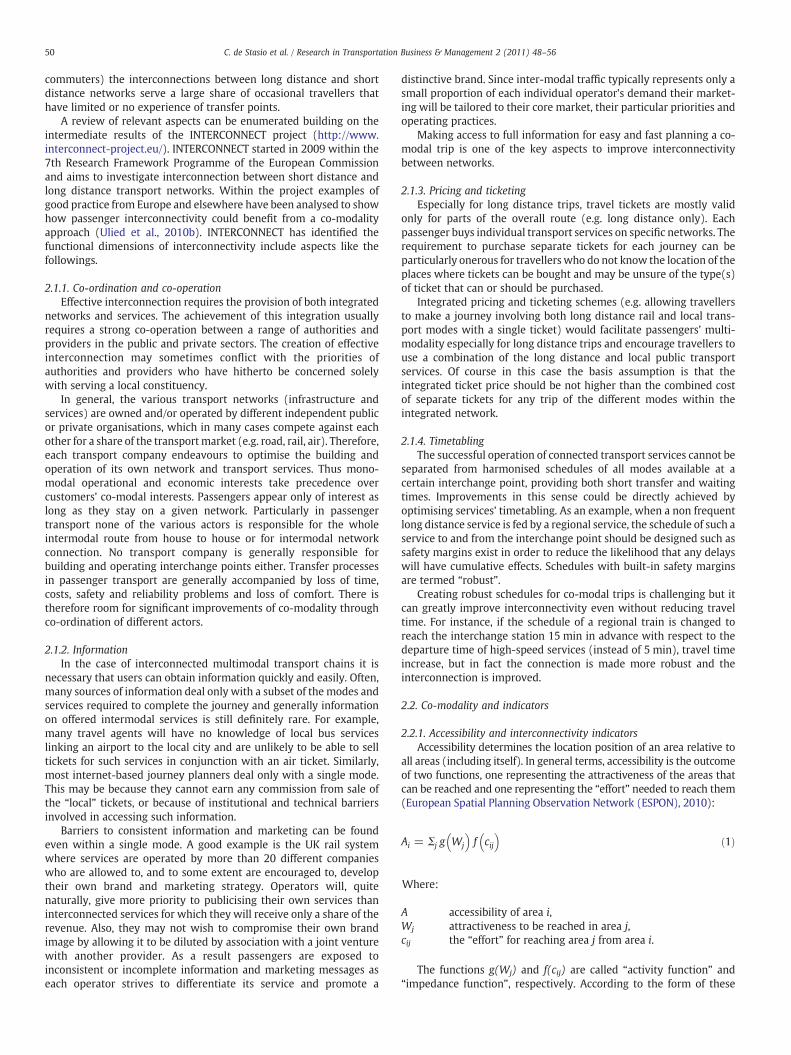
The model has been used to simulate alternative scenarios ofpublic transport supply compared to the current situation. Inparticular, one scenario consisted of the implementation of allplanned extensions of current underground lines and the buildingof two new underground lines. Fig. 1 shows the changes betweenthe reference scenario and the alternative project. The transportmodel provides origin-destination-based results on travel times andcosts that can be used to compute indicators of the kind describedabove.
Fig. 2 shows the variation between the reference and thealternative scenario for the Interconnectivity Ratio for the mode

Fig. 1. Extension of the underground lines in the study area.
53C. de Stasio et al. / Research in Transportation Business & Management 2 (2011) 48–56
“underground”. The Interconnectivity Ratio has been computedpartially different than in [2], using the formula:
‘IRi = Σj ATij + ETij + TTij� ��Dij
h i=ΣjTotTij
�Dij ð5Þ
Where:
‘IRi modified Interconnectivity Ratio of area i,ATij access time to the underground network for reaching area j
from area i.ETij egress time from the underground network for reaching
area j from area i.TTij transfer time (including boarding and alighting times and
waiting time at stops) for reaching area j from area i byunderground
TotTij total travel time for reaching area j from area i by underground
Fig. 2. Variation of Interconnectivity R
Dij demand (modelled number of trips in peak time) betweenarea i and area j.
The reason for using a modified formula is twofold. First, in thecontext under analysis interchange is quite relevant. Adding transfertime to the numerator allows for better measuring the share of‘interconnectivity-related’ transport time. Second, introducing thedemand between the zones allows for weighting the relativeimportance of each destination (i.e. the role of activity function inaccessibility indicators).
The Interconnectivity Ratio decreases for most of the zones wherenew underground lines are built or existing underground lines areextended. These zones benefit from a larger number of directconnections and their access, egress and interchange time is reduced.However, in several zones the ratio increases. It is quite clear that such
atio (IR) for underground service.

54 C. de Stasio et al. / Research in Transportation Business & Management 2 (2011) 48–56
increase does not reflect a worsening of the services, with lowerfrequencies or more distant stations. Instead, the higher ratio is due tothe larger number of indirectly (i.e. by means of some feeder mode)connected zones after the extension of the network.
In fact, the indicator has been computed considering in eachscenario all origin-destination pairs that are directly or indirectly (i.e.by means of some feeder mode) connected by underground. In thealternative scenarios the number of connections increases, thus theindicator is computed on a larger group of pairs. Computing theindicator on the same set of pairs would significantly underestimatethe impact of the new infrastructures. This applies to the otherindicators presented below.
Thus the Interconnectivity Ratio provides a biassed picture of theaccessibility level in the network (by underground) by consideringonly physical aspects. Looking at Fig. 2, one should incorrectlyconclude that for most of the zones the new infrastructure give riseto poorer interconnectivity.
Fig. 3 shows the variation of a Degree Centrality-type indexbetween reference and alternative scenarios. In this case, DegreeCentrality has been computed as:
‘DCi = Σj MTij�DTij
� �=N�Σj DTij ð6Þ
where:
‘DCi modified Degree Centrality of node iMTij 1 if area j can be reached by underground from area i
without interchanges, 0 otherwiseN number of destinations that can be reached by underground
from area i.DTij demand between area i and area j
A modified formula instead of [3] is used to take into account therelevance of destinations, under the assumption that a directconnection to poorly attractive zones is not the same as directconnections to most attractive areas.
It is important to note that according to this definition, thenumerator of the index increases when the number of interchanges isreduced (whilst in the Eq. (3) the numerator decreases). It should also
Fig. 3. Variation of Degree Centrality
be noted that for computing the index, interchanges are not onlythose between two different underground lines, but also betweenunderground and bus or urban rail services.
As for Interconnectivity Ratio, there are improvements for zoneswith more direct connections. However, in most of the area the indexis lower because the number of total connections (weighted by theirrelevance in terms of demand) increases more than the number ofdirect connections. From a co-modal point of view the possibility ofreaching more destinations through the interconnection with othernetworks is a positive effect, but the Degree Centrality indicatorsseems rather suggesting that the North-East of the study area worsensits connectivity.
Finally, in Fig. 4, the variation of Closeness Centrality between thetwo scenarios is shown. Closeness Centrality has been computed as:
‘CCi = N�Σj DTij = Av TotTij�DTij
h ið7Þ
where:
CCi modified Closeness Centrality of node iTotTij total travel time for reaching area j from area i.DTij demand between area i and area j.N number of destinations that can be reached by underground
from area i.Av average function
Apart the weighting of destinations with demand, themain changewith respect to [4] is that denominator is made of the average(weighted) travel time rather than total distance. The reason for thischange is that using total distance would invariably lead to increasedenominator more than numerator, thus reducing the value of theCloseness Centrality. Using the average time, in regions for whichfaster (direct) connections become available the denominator candecrease or at least not increase too much as effect of the new(indirect) connections. Another change is that N represents thenumber of destinations rather than the number of nodes in thenetwork. In the network used for the modelling simulation, onlynodes representing the zones (i.e. the centroids) are relevant.Therefore the indicator is computed with reference to those nodes.
(DC) for underground service.

Fig. 4. Variation of Closeness Centrality (CC) for underground service.
55C. de Stasio et al. / Research in Transportation Business & Management 2 (2011) 48–56
Indeed, looking at Fig. 3, the largest part of the zones shows apositive change of the index. This index, under this specific formseems more able to capture the improvement of accessibility given bythe new infrastructures.
4. Implications for managerial practice
From the concepts developed above the following main consider-ations emerge for the managerial practice.
First of all, if transport should provide accessibility, this goal cansometimes bemore efficientlymet by exploiting the relative strengthsof different modes than trying to supply direct services. Assuming thisperspective, interconnections and transfers between networks shouldnot be regarded as something to eliminate as much as possible, but asone part of the trip that should be made as smooth as possible.
Second, implementing co-modality successfully is challenging asthe various transport networks should be considered as a single entityand managed as such. This condition is very far from the currentexperience. Let us consider a trip between two different countriesusing air as the main mode, but relying on an intercity rail service atthe origin and a local bus service at the destination. In this example,the passenger starts by using a rail service provided by a nationaloperator, possibly regulated by the Ministry for Transport. Thetraveller will then need to navigate through a rail station, operatedby the rail infrastructure manager, and an airport, operated by theairport authority and regulated by a separate national agency. He willthen board a plane run by an airline regulated by an internationalagency and repeat the reverse process upon arrival at the destinationairport, except that each station and service will again be run by adifferent operator regulated by a different national agency. At thelocal level, in particular, it is likely that bus services will be regulatedby local transport authorities with a narrowly defined remit notextending much beyond their municipal boundaries.
This example clarifies that themajor difficulties to create co-modalconnections may be not only on the infrastructural side. Physicalseparation exists and may be difficult to eliminate especially whenexisting transport networks to be connected were planned indepen-dently and built in different times in the past and in different locationslike e.g. rail networks and airports. However, putting together severaldifferent subjects to manage functional aspects of interconnectivity
can be even more complicated. To remain on air and rail transport,examples of agreements between air and train operators exist inEurope to enhance procedures for check-in and luggage transfer. Forinstance, Lufthansa and Deutsche Bahn for check-in or Vienna airportand Vienna central train for full luggage check-in or “Fly rail” servicethat transports luggage from many airports in the world via Genevaand Zürich airport to most Swiss train stations.
However, all these examples involve bi-lateral agreements. Whenmore networks and more subjects are involved, interests may bemuch more diverging, especially if sensitive aspects like ticketing andpricing are involved. One of themost critical elements for co-modalityis probably arranging robust timetables. In principle the introductionof robust schedules could be applied anywhere — particularly wheredelays can result from incidental effects. Nevertheless it is oftendifficult to achieve the balance between sufficient safety margins onthe one hand and efficient usage of the system on the other. Ideallythe margins would be created by optimising the schedules to createeven gaps in the schedule, but more often this can only be achieved byreducing either average speed on route or increasing the times atstations, and this in turn may – where the schedules are very denseand tight – only be possible through reducing the number of servicesthat are run. This is of course not desirable from the point of view ofthe single operators.
This suggests that a more open-minded approach is needed. Aneffort to promote a common strategy and to combine resourcesshould emerge as an opportunity for achieving a higher market share.An open-mind would be probably helped by a strong regulatoryenvironment. While in a local transport context it could be expectedthat dominant operators take the lead, some form of higher levelregulation is likely to be critical for intermodal long distance travel.
Themainmessage that this paper adds to such considerations is thatmeasuring interconnectivity, assuming a co-modality perspective iscomplex, especially for ex-ante analyses. Co-modality is today still in avery embryonic stage. Current infrastructures and services should be re-organised in order to build interconnected services where differentnetworks work like a singlemode. In many cases, new services and alsonew infrastructures should be put into practice. In the planning phase,promoters and investors would like to estimate the impact of theinterconnected services and the demand for new infrastructures. Publicauthorities would like to forecast the improvement of accessibility that

56 C. de Stasio et al. / Research in Transportation Business & Management 2 (2011) 48–56
clever interconnectivity would bring about. Both private and publicsubjects would like to compare alternative solutions to choose the bestalternative. Most likely, modelling simulations of alternative scenarioswould be requested.
The discussion presented in this paper suggests that summaryindicators used to measure accessibility and interconnectivity arestructurally insufficient to capture the essence of co-modality. Manyinterventions that could improve accessibility from a co-modal pointof view are poorly reflected, not reflected at all or give rise tomisinterpretation. While the indicators available in literature tomeasure interconnectivity can provide useful information to policymakers and planners for designing networks and assessing nodesaccessibility, their usefulness to analyse the quality of interconnec-tions in the light of co-modality is not fully satisfying.
All in all, it could be said that co-modality begs for a change ofperspective in transport networksmanagement as well as in transportnetwork performance measurement.
5. Conclusions
This paper deals with existing accessibility and interconnectivityindicators seen fromtheperspective of co-modality,which is still quite atheoretical concept. Two main steps ahead are suggested by this work.First of all, the ways that co-modality could be put into practice shouldbe studied in detail. There are organisational, infrastructural as well aslegal issues to be overcome and contributions to research in this fieldwould be one natural consequence of this work. Secondly, if currentindicators seem not fit to measure interconnectivity from a co-modalpoint of view, new indicators could be developed. In order to be usefulsuch indicators should be based on elements available not only ex-post,but also ex-ante. Suggestions for modelling applications capable toprovide the needed elements could be also developed to help theplanning phase of interconnected services.
Acknowledgements
Authors gratefully acknowledge the contribution of their colleagueLoredana Zani at TRT for the computation of the indicators. Authorsare also grateful to INTERCONNECT partners, who provided thebackground for this paper.
References
Chatelus, G., & Ulied, A. (1995). Union territorial strategies linked to the transeuropeantranspor-tation networks. Final report to DG VII. Paris/Barcelona.
Dodson, J., Mees, P., Stone, J., & Burke, M. (2011). The principles of public transportnetwork planning: A review of the emerging literature with select examples. GriffithUniversity. Urban Research Program, Issues Paper 15. Brisbane.
European spatial planning observation network (ESPON) (2010). TRACC TransportAccessibility at Regional/Local Scale and Patterns in Europe. Spiekermann&Wegener,Dortmund. Available at: http://www.espon.eu/export/sites/default/Documents/Projects/AppliedResearch/TRACC/TRACC_Inception_Report_300710.pdf
Gonçalves, J. A. M., da Silva Portugal, L., & Nassi, C. D. (2009). Centrality indicators as aninstrument to evaluate the integration of urban equipment in the area of influenceof a rail corridor. Transportation Research Part A, 43(2009), 13–25.
Institute for Transport Studies (ITS), et al. (1999). Strategic organisation and regulationin transport. Final report glossary of the SORT-IT project. Leeds.
Kazerani, A., & Winter, S. (2009). Can betweenness centrality explain traffic flow?. Paperpresented at the 12th AGILE International Conference on Geographic InformationScience 2009. Germany: Leibniz Universität Hannover.
Keller, P. (2001). Intermodality of network points: The planners view. Paper presented atthe international workshop "Intermodal connectivity at European Transport NetworkPoints: Why so late?" COST 340: Working Group 2, Berlin.
Krygsman, S., Dijst, M., & Arentze, T. (2004). Multimodal public transport: an analysis oftravel time elements and the interconnectivity ratio. Transport Policy, 11(3),265–275.
Lutter, H., Pütz, T., & Spangenberg, M. (1993). Lage und Erreichbarkeit der Regionen in derEG und der Einfluß der Fernverkehrssysteme. Forschungen zur Raumentwicklung 23.Bonn: Bundes-forschungsanstalt für Landeskunde und Raumordnung.
Mees, P., Stone, J., Imran,M., &Nielson, G. (2010). Public transport network planning: a guide tobest practice in NZ cities. New Zealand Transport Agency research report 396. Wellington.
Rochat, Y. (2009). Closeness centrality extended to unconnected graphs: The harmoniccentrality index. Paper presented at ASNA (Application of Social Network Analysis)2009. Zurich: University of Zurich.
Scheurer, J., & Curtis, C. (2008). Spatial network analysis of multimodal transport systems:Developing a strategic planning tool to assess the congruence of movement and urbanstructure. A case study of Perth before and after the Perth-to-Mandurah Railway.Research monograph of the Faculty of Architecture. : Building and Planning at theUniversity of Melbourne.
Scheurer, J., Curtis, C., & Porta, S. (2007). Spatial network analysis of public transportsystems: Developing a strategic planning tool to assess the congruence of movementand urban structure in Australian cities. Paper presented at Australasian TransportResearch Forum 2007, Melbourne.
Ulied, A., Bielefeldt, C., Biosca, O., Matthews, B., Shires, J., Schnell, O., et al. (2010). Casestudy reports per case study. Test-bed analysis. Milestone M4.5 of the INTERCONNECTproject, Co-funded by 7th Research Framework Programme of the EuropeanCommission, Barcelona.
Ulied, A., Bielefeldt, C., Biosca, O., Matthews, B., Shires, J., Schnell, O., et al. (2010).Factors affecting interconnectivity in passenger transport. Deliverable D4.1 of theINTERCONNECT project, Co-funded by 7th Research Framework Programme of theEuropean Commission, Barcelona.