public stakeholder survey summary
TRANSCRIPT

August 27, 2021 - DCR Contract No. E194-89627
VIRGINIA COASTAL RESILIENCE PLAN PUBLIC STAKEHOLDER SURVEY SUMMARY
1.0 INTRODUCTION In November 2018, Governor Northam issued Executive Order 24, directing the Commonwealth’s Chief Resilience Officer (Secretary of Natural and Historic Resources), with the assistance of the Special Assistant to the Governor for Coastal Adaptation and Protection, to develop a comprehensive Coastal Resilience Master Plan (CRMP), in cooperation with residents, stakeholders, and localities in the coastal regions of Virginia. This effort, as outlined in the Virginia Coastal Resilience Master Planning Framework, released October 2020, will identify and address unique and shared flooding challenges that residents within the 8 coastal PDCs experience along Virginia’s diverse coastline. The first Virginia Coastal Resilience Master Plan will be completed in November 2021. Additional iterations will evolve as research progresses, community planning continues, and projects are implemented. The Commonwealth is committed to an enduring planning process that ensures continuity in long-term coastal adaptation and protection. The goals of the CRMP project are to: 1. Identify priority projects to increase the resilience of coastal communities, including both built and natural assets at risk due to sea level rise and flooding 2. Establish a financing strategy, informed by regional differences and equity considerations, to support execution of the plan 3. Effectively incorporate climate change projections into all of the Commonwealth’s programs addressing coastal region built and natural infrastructure at risk due to sea level rise and flooding 4. Coordinate all state, federal, regional, and local coastal region adaptation and protection efforts in accordance with the guiding principles of this Framework and Master Plan.
1.1 Purpose and Scope The Public Stakeholder Survey (also known as the Decentralized Stakeholder Survey) was designed to capture input from residents and business owners to inform the Commonwealth’s efforts and ensure the CRMP addresses the needs of coastal stakeholders. Questions were developed to glean information on the following: citizens “lived” experiences regarding flooding, damages experienced, mitigation actions in place, impacts to daily life, and awareness of planning efforts. The responses painted a broad picture of resident’s experiences on “living with the water.” Additionally, questions were posed on ideas or suggestions for resilience/mitigation projects for the communities, to provide an opportunity for public input on project identification and potential rankings.
1,176 Respondents as of
August 25, 2021

Page | 2
Responses to this public survey are intended to be representative of an individual from the general public and are not intended to capture of the views/positions of local government staff or representatives of localities, tribes, or organizations. A separate, centralized survey targeted toward PDCs, localities, tribes, and other organizations was developed separately, that captured more organizational level information. Please see the Virginia Coastal Resilience Plan - Centralized Stakeholder Survey Summary for further details.
1.2 Survey Design and Methodology The Public Stakeholder Survey was developed in close coordination with, and input from, the Secretary of Natural Resources (SNR), the Project Impact Assessment Team, and the Coastal Resilience Technical Advisory Committee (TAC) Community Outreach Subcommittee. A comprehensive set of questions was developed to capture the information needs for each Team’s unique goals. The Secretariat provided valuable guidance on the nature of feedback the Secretary, and the Commonwealth in general, were seeking from the public. Questions included the perceived community-level impacts due to sea level rise in the next 20-40 years; flood-related impacts or lack of safe access to public services, utilities, or infrastructure; and framing equity-based questions. Questions developed to support the Impact Assessment Team’s tasks included: the types of flood hazards residents experienced (tidal, riverine, stormwater, etc.), the kinds of damages faced; residents’ experience with flood events in the Study Area; and projects that would be most effective (beach/dune restoration, property elevation/acquisitions, stormwater drainage, etc.) in their communities. The Community Outreach Subcommittee provided input on questions such as: anticipated benefits to the local communities as a result of the CRMP; perceived challenges or negative impacts to the community as a result of the CRMP; relocation; and the preferred outreach avenues for future correspondence. Additionally, the Outreach Subcommittee provided guidance on phrasing all questions in a concise, user-friendly manner for residents and business owners. The Survey contained 28 questions; the first eight (8) included questions on demographics, to support tracking and documentation efforts. Not all questions were mandatory. Short form questions such as multiple choice or “select all that apply” were made mandatory, where long form or open-ended questions were made optional, to encourage participation. Issues related to completing responses to open-ended questions on a cellular or small screen device, were taken into consideration. The Survey was designed to take approximately 10 minutes to complete and is compatible with laptop, tablet, and cellular devices. A copy of the Survey is included as an Appendix to this document.

Page | 3
2.0 SURVEY PARTICIPANT DEMOGRAPHICS The first section of questions is designed to capture simple demographics on survey respondents. These demographics can help guide future outreach efforts as targeted campaigns can be developed to focus on particular communities that were not well represented in the survey results. Over 1100 responses were received as of 25 August 2021.
2.1 Age For analysis purposes, respondents were asked to identify their age bracket. Approximately twenty percent (20%) indicated being between 18-39 years, forty-nine percent (49%) listed age 40-65, and thirty percent (30%) stated they were aged 66 or over. A single (1) respondent identified under the age of 18.
2.2 Sex Over fifty percent (50%) of respondent identified as Female, thirty-eight percent (38%) identified as Male, and seven (7%) preferred not to answer.
2.3 Race The Commonwealth’s focus on Social Equity is centered on minority, traditionally underserved, and sovereign communities such as Native Tribal Lands. Of the over 1100 respondents, an overwhelming 72% of respondents identified as Caucasian. Black or African American respondents only made up eight percent (8%) of the sample. Only two percent (2%) of individuals identified as Native American/Alaska Native, and Asian and Pacific Islander respondents made up a combined 1.3%. Two percent (2%) of respondents identified as “Another Race” and fourteen percent (14%) preferred not to answer.

Page | 4
2.4 Location In order to focus the survey on residents in Coastal Virginia, respondents were first asked if they lived or worked in the Study Area, so that only those who did, would proceed through the questions. Over 1,000 respondents live and/or work in a coastal community, as identified in the study area map. Approximately 125 respondents stated they lived outside of the study area, which indicates that the survey’s distribution reached far inland. Once responses were sorted to only include those in the study area, respondents were asked to identify the county/locality in which they reside. Over 46 county/localities were represented, with predictable spikes in participation in Virginia Beach, Norfolk, Hampton, and Chesapeake. No participation was observed from Charles City, Manassas Park City, and Surry, at least one (1) response was received from the other localities.
2.5 Occupation/Industry In order to identify which businesses, industries, and economic sectors are represented by the public survey results, respondents were asked to identify their occupation by sector. The sector selections are the same as those used in the Centralized Survey to estimate potential impacts from coastal hazards. They include:
• Agriculture/Livestock/Fishery
• Manufacturing/Industry
• Hospitality/Tourism
• Healthcare/Pharmaceuticals
• Construction/Engineering
• Retail/Sales
• Education/Research
• Utilities/Energy/Telecom
• Arts/Entertainment
• Food and Beverage
• Military/Federal
• Other Fourteen percent (14%) of respondents identified as Education/Research, nine percent (9%) as Military or Federal, and Healthcare/Pharmaceuticals and Construction/Engineering each reflected five percent (5%) of respondents. An overwhelming fifty-five (55%) of respondents identified as “Other,” in that they either did not see themselves well reflected in the available options, or there is potentially another occupational sector that should be targeted for outreach.

Page | 5
3.0 FINDINGS/KEY THEMES 3.1 Perceptions on Flood Risk Respondents were asked how much of a risk they felt flooding posed to their community currently and , in the next 20-40 years, given climate change and rising sea levels. Over thirty-five (35%) of respondents stated flooding is currently a “serious challenge,” and twenty (20%) stated it is an “extreme challenge.” Looking forward to the next 20-40 years, twenty-nine percent (29%) foresee a “serious challenge,” with fifty (50%) of respondents stated it would be an “extreme challenge.” Additionally, citizens were asked if they had seen a change in flood activity throughout their time living in coastal Virginia. An overwhelming seventy-six percent (76%) stated they had witnessed an increase in flooding issues. Sixteen percent (16%) stated they had not witnessed any change in flood conditions.
3.2 Experiences with Flooding Residents and business owners were asked questions regarding the kind of hazards witnessed in their community. More than one flood type could be selected. Eighty percent of responses (80%) included stormwater flooding and seventy-four percent (74%) reported storm surge flooding. Tidal flooding and coastal erosion each represented forty percent (40%) of responses. Riverine flooding was included in thirty (30%) of responses. One percent (1%) of responses indicated they did not witness any flooding hazards in their communities. Additionally, respondents were provided an open text box to provide additional examples of flooding hazards. These comments reflected similar themes throughout the 65 responses, which are captured in the table below. The full responses are included in the Appendix.
Key Theme Frequency Key Theme Frequency
All of the above 1 Land Subsidence 3
Extreme storms 2 Wind Driven 5
Construction Caused 8 Farmland/Marsh/Tree Loss 12
Flash Floods 2 Drainage 14
Rainfall 3

Page | 6
Respondents were then asked if their home and/or business had ever flooded from major storm events or nuisance flooding. Sixty-six percent (66%) of respondents stated their home/business had never flooded, nineteen percent (19%) of homeowners and four (4%) of business owners stated they had experienced a flood 1-2 times in the past ten years, and eight percent (8%) of homeowners and 2 percent (2%) of business owners indicated they had experienced more than three (3) floods in the past ten years. Respondents were then asked to identify the kind of damages they had most frequently experienced from a flood event. Respondents were invited to select all damage types that apply. Selections included:
• Basement/below grade flooding
• Siding/exterior damage
• Architectural feature damage (spires, lintels, cornices, railings)
• Finished (or first) floor flooding
• Damaged Masonry (fireplace, stairs)
• Structural or Foundation Damage
• Plumbing, sewer, or septic damages, issues, or challenges
• Roof/shingle damage
• Utility damage (hvac, electrical, natural gas)
• Damage to secondary buildings (shed, garage, boat house)
• Damaged/rotting wood features (exterior)
• Damaged/rotting wood features (interior)
• Window/Door damage
• Standing water on property (around buildings)
• Loss of vegetation (trees, shrubs, gardens)
• Soil washout or erosion Over sixty (60%) of residents have experienced standing water on their properties, forty-six (46%) reported seeing soil washout or erosion, and thirty-six percent (36%) reporting the loss of vegetation. Nearly forty (40%) of responses included basement flooding, twenty-three (23%) percent reported structural or foundation damages, twenty-three (23%) of responses indicated first floor flooding, and twenty-three (23%) of responses show plumbing, sewer, or septic damages, issues, or challenges. Additionally, over twenty-five (25%) percent of responses indicate damaged/rotting wood features on buildings (exterior) and damage to secondary buildings such as sheds and boat houses.

Page | 7
Additionally, Respondents were provided an open text box to provide other, or additional examples of flooding damages they had experienced not represented in the categories above. These comments reflected similar themes to those listed above throughout the 36 responses. However, some new or uncategorized damages are captured and listed in the table below. Full responses are included in the Appendix.
Key Theme Frequency
Bulkhead Damage 1
Dune Loss 1
Mold/Mildew 1
Debris/Trash Deposits 1
Street Flooding 5
Fence Damage 1
Vehicle Damage 3
Page | 8
Respondents were provided an opportunity to report any other negative impacts as a result of flooding events. Sample categories were provided, as well as an open text box for other impacts. Respondents were invited to select all damage types that apply. Sample impacts included:
• Damage to transportation networks (e.g., flooded roadways, closure of public transportation systems, transportation delays)
• Loss of electricity
• Lack of access to clean drinking water
• Injury, illness, and/or concerns for personal safety
• Limited access to services (e.g., closure of hospitals, schools, government offices)
• Damage to personal possessions (including vehicles)
• Sewer overflows
• Inability to perform work duties
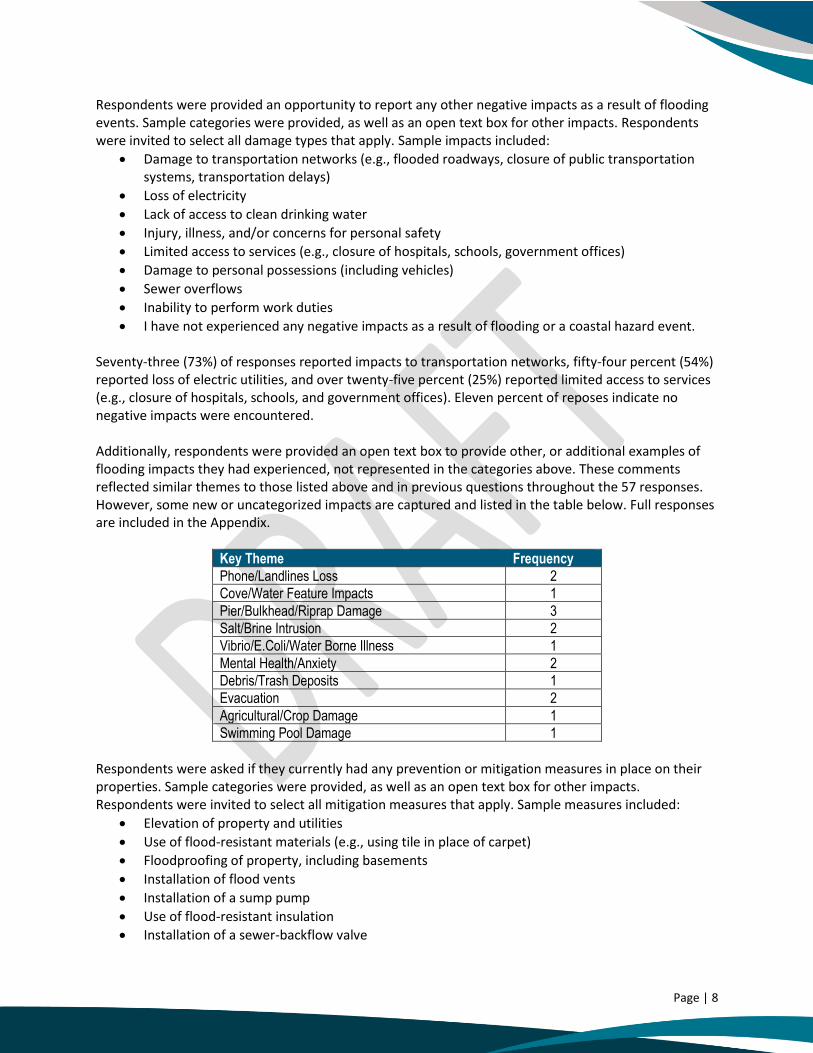
• I have not experienced any negative impacts as a result of flooding or a coastal hazard event. Seventy-three (73%) of responses reported impacts to transportation networks, fifty-four percent (54%) reported loss of electric utilities, and over twenty-five percent (25%) reported limited access to services (e.g., closure of hospitals, schools, and government offices). Eleven percent of reposes indicate no negative impacts were encountered. Additionally, respondents were provided an open text box to provide other, or additional examples of flooding impacts they had experienced, not represented in the categories above. These comments reflected similar themes to those listed above and in previous questions throughout the 57 responses. However, some new or uncategorized impacts are captured and listed in the table below. Full responses are included in the Appendix.
Key Theme Frequency
Phone/Landlines Loss 2
Cove/Water Feature Impacts 1
Pier/Bulkhead/Riprap Damage 3
Salt/Brine Intrusion 2
Vibrio/E.Coli/Water Borne Illness 1
Mental Health/Anxiety 2
Debris/Trash Deposits 1
Evacuation 2
Agricultural/Crop Damage 1
Swimming Pool Damage 1
Respondents were asked if they currently had any prevention or mitigation measures in place on their properties. Sample categories were provided, as well as an open text box for other impacts. Respondents were invited to select all mitigation measures that apply. Sample measures included:
• Elevation of property and utilities
• Use of flood-resistant materials (e.g., using tile in place of carpet)
• Floodproofing of property, including basements
• Installation of flood vents
• Installation of a sump pump
• Use of flood-resistant insulation
• Installation of a sewer-backflow valve

Page | 9
• Use of reinforced caulking of windows and doors
• My property does not have measures in place to prevent or reduce flooding and/or future damage.
Fifty (50%) percent of respondents indicated that they did not have any preventive or mitigating measures in place on their properties. Nineteen percent (19%) of responses indicated elevation of property and utilities, sixteen (16%) indicated the installation of a sump pump, and thirteen percent of responses reported the use of flood-resistant materials (e.g., using tile in place of carpet) in the building. Additionally, respondents were provided an open text box to provide other, or additional examples of flood prevention or mitigation measures they have in place, not represented in the categories above. These comments reflected similar themes to those listed above and in previous questions throughout the 124 responses. However, some new or uncategorized considerations are captured and listed in the table below. Full responses are included in the Appendix.
Key Theme Frequency
Lack of Financial Resources 4
Green Solutions (rain garden, planting trees, naturalization, etc.) 22
French Drains 10
Berms/Ditches/Swales 5
Sandbagging 7
Generator Usage (for sump pumps) 4
Permeable pavers 3
Seawall/Riprap 2
Water Collection (rain barrels/cisterns) 3
Flood Insurance 4
Public Education 2
Lawn Grading/Drainage 4
Soil Replenishment/Fill 2
Finally, respondents were asked if they had ever considered moving to another location (inside or outside of Coastal Virginia) to avoid future flood losses, impacts, or damage. Forty-two percent (42%) indicated they did not want to leave their current area, twenty percent (20%) stated their property does not flood, so it is not a factor. Thirteen (13%) percent stated they are considering buying/renting at a new location in the future if flood events become more frequent, and over six (6%) percent stated they are looking to relocate to a new location due to flooding.

Page | 10
3.3 Resilience and Mitigation Project Suggestions Respondents were provided a selection of project types and asked if they believed any would provide benefits to their community. Respondents were invited to select all project types that apply. Selections included:
• Beach and dune restoration
• Habitat creation and restoration
• Property buy-outs and land preservation
• Nature-based shoreline stabilization
• Local resilience planning (including climate change plans, sea-level change restrictions, etc.)
• Resilience policy and development standards
• Public education and outreach
• Structural shoreline protection (including floodwalls, levees, tide gates, etc.)
• Critical infrastructure upgrades (including hospitals, police and fire stations, nursing homes, etc.)
• Stormwater drainage improvements
• Road/bridge elevation
• None of the above Over eighty (80%) percent of responses included stormwater drainage improvements as recommended projects. Sixty-one percent (61%) indicated that local resilience planning (including climate change plans and sea-level change restrictions) and fifty-three percent (53%) suggested that resilience policy and development standards would be effective projects. Fifty-nine (59%) of responses included nature-based shoreline stabilization, forty two percent (42%) included structural shoreline protection (including floodwalls, levees, tide gates, etc.), and forty four percent (44%) included property buy-outs and land preservation. Additionally, respondents were provided an open text box to provide other, or additional examples of Projects, not represented in the categories above. These comments reflected similar themes to those listed above and in previous questions throughout the 106 responses. However, some new or uncategorized considerations are captured and listed in the table below. Full responses are included in the Appendix.
Key Theme Frequency
All of the Above 2
Development/Building Moratorium 15
Installation/Use of Permeable Hard Surfaces 4
Building Code Changes 3
Funding Assistance to Property Owners 2
Dredging 3
Community-Wide Pump Stations 3
Real Estate Sale Disclosures 2

Page | 11
Finally, respondents were asked for any final ideas for projects that may help reduce flooding in their community not represented in the categories or questions above. Respondents were provided an open text box to provide additional examples of flood prevention or mitigation projects. These comments reflected similar themes to those listed above and in previous questions throughout the 432 responses. However, some new or uncategorized considerations are captured and listed in the table below. Full responses are included in the Appendix.
Key Theme Frequency
Windmills 1
Managed Retreat 2
Non-Repayable Grants To Homeowners For Mitigation/Prevention Measures 6
Water Retention Incentives For Homeowners 5
Developer Liability Laws/Fines 4
Above-Ground Storm Runoff Infrastructure (Aqueducts/Reservoirs) 3
Harsh Penalties For Dune Damages From Tourists 1
Fines to Business/Property Owners for Not Keeping Storm Drains Clear of Debris/Trash/Litter 3
Detailed Flood Mapping Products 2
Off-Shore Artificial Reefs and/or Breakwaters 4
Model Actions After Netherlands Efforts 3
Beaver Population Monitoring/Trapping 4
Greater Military/Federal Cooperation 1
Floodwalls and Tide Gates 2
Mandatory School Science Curricula that Include Weather, Climate Change, and Earth Science 1
Carbon Sequestration 3
Respondents were asked if they would support a special benefit assessment charge to fund flooding and sea level rise projects in their community. A “special benefit assessment” is a charge or fee introduced by localities/municipalities and imposed on owners of properties that particularly benefit from a public improvement project. Twenty-three percent (23%) were “not at all” or “not very” supportive of the charge. Twenty-two percent identified as “ neutral,” and fifty-four percent (54%) were “somewhat supportive” or “very much supportive” of the fee.

Page | 12
4.0 PLANNING AWARENESS AND PARTICIPATION In order to have a “pulse” on the Commonwealth and SNR’s outreach efforts regarding the CRMP, respondents were asked about their familiarity with both the CRMP and other local flood planning efforts.
4.1 Commonwealth Planning Efforts Of the 832 responses to this question, nearly fifty percent (48%) stated they were “not at all” or “not very” familiar with the CRMP project prior to taking the survey. Only ten percent (10%) stated that they were “very familiar” with the project, with the remainder falling into the “neutral” or “somewhat familiar” categories.
4.2 Local Planning Efforts In order to provide a comparison for the CRMP awareness efforts, respondents were asked to identify if they were familiar with any county or local planning efforts to address flooding issues. Fifty percent (50%) of respondents stated that they were not aware of any planning efforts underway to address coastal hazards and flooding in their area. Of the remaining fifty percent of respondents who advised that they were aware of local planning efforts, sixteen percent (16%) stated they were actively involved in the planning process at their local level.
4.3 CRMP Project Perceptions Respondents were asked if they foresaw the CRMP project providing benefits to their communities. Thirty-six percent (36%) saw the project as being “very beneficial” and thirty-one percent (31%) saw it as being somewhat beneficial. Ten percent (10%) of respondents reported either “not at all” or “not very” beneficial, and twenty-one percent (21%) were neutral.
Benefits – Perceived Positive Impacts Respondents were then asked about the type of benefits they hoped to see to their community as a result of the CRMP. The table below highlights key themes encountered throughout public responses. Full responses are included in the Appendix.
Key Theme Key Theme
Awareness/Education Environmental Benefits/Stewardship
Protect Life/Property Historic Preservation
Resilience/Sustainability Reduced New Building/Development
Better Planning/Zoning Additional Funding
Prevention/Mitigation Quality of Life
Economic Growth/Resilience Equity/Environmental Justice
Global Warming/Climate Change/Sea Level Rise Managed Retreat/Relocation

Page | 13
Concerns – Perceived Negative Impacts Respondents were asked about potentially negative impacts to their community as a result of the Project. The table below highlights key themes encountered throughout public responses. Full responses are included in the Appendix.
Key Theme Key Theme
Lack of funding, or money would be spent elsewhere, instead of where it is needed most.
Governments could begin over-regulating private property.
If solutions are not implemented soon after recommendations are made, no actions will be taken or the implementation of projects will move too slowly and the situation will get worse and require more resources.
Distrust of local governments to take the proper follow through steps, to use the funds for the projects appropriately, and to implement the projects where they will be of most benefit.
Increased taxes on residents who already pay high taxes due to their location without seeing the benefits of projects in the community.
Social and political divides in the communities where these projects will be implemented might impact the progression of these projects.
Structural solutions can be destructive or may not be in the best interest of the community
Inadequate funding sources to implement suggested mitigation solutions.
Any actions will be outdated in a few years and it would be more cost effective to retreat from flood prone areas instead of trying to remain.
Underserved populations and equity concerns will not be appropriately addressed and cause the inequitable implementation of mitigation solutions
Negative impacts the projects might have on wildlife and the natural environment.
Traffic-related disruptions created due to project development.
Lack of updated flood maps and data that accurately measure increased rainfall and flooding to create meaningful solutions.
Only affluent communities will see the benefits of these projects, and that low- or fixed-income communities would be treated unequally.
Critical improvements to stormwater drainage and sewer systems that might not be addressed in the CRMP.
Uncertainty involving whether the costs associated with the projects will outweigh the benefits.

Page | 14
4.4 Potential Strategic Partners Respondents were asked if they knew of any local or community groups or organizations, that they feel the Commonwealth should coordinate with, to promote the CRMP Project, or similar flooding and resilience projects in the future. Respondents were given an open-ended text box and asked to provide the group/organizations name, website, and a contact person/email, if possible. Suggestions spanned the gamut from federal and state agencies, to local HOAs and even individuals requesting to stay updated on the project. The table below provides a listing of all recommendations, including contact information where provided, and the number of times the group/organization was suggested, and have been sorted by type.
• Federal Agencies
• State Agencies/Organizations
• County/Local Agencies
• Businesses
• University/Academic
• NGOs and Community Associations/Organizations
• Individuals
• General
Group/Organization Contact Information Frequency Group/Organization Contact Information Frequency
Federal/Tribal Agencies State Agencies/Organizations FBI VDOT 2
Langley AFB Matthew Weldon, [email protected]
Virginia Department of Forestry - Coastal Forest Resilience
Us Navy Virginia Aquarium
USACE Virginia Sea Grant https://vaseagrant.org 3
NOAA 2 Virginia Environmental Justice Collaborative
Chickahominy Indian Tribe - Eastern Division EPA Officer
9 VA DWR Waterfowl Biologist
Warren Taylor, Pamunkey Indian Tribe
Natural Resources. Email - [email protected] - https://pamunkey.org
County/Local Agencies County/Local Agencies
City Governments 10 Virginia Living Museum
Police/Fire/Ems Agencies 2 Reston Association
Local Emergency Management Mitigation Offices
City of Fairfax
Public Services Citizens For A Better Eastern Shore 2
Kyle Spencer, City of Norfolk's Deputy Resilience Officer
[email protected] ECO District Hampton Roads Center for Sustainable Communities

Page | 15
Group/Organization Contact Information Frequency Group/Organization Contact Information Frequency Parksley Town Council Town of Parksley, Mayor Frank
Russell, [email protected] 2 Department of Defective Housing
and Environmental Policy
Alexandria Environmental policy commission
Kathie Hoekstra, chair @ [email protected]
York County Planning Dept & Commission
Newport News Waterworks Resort Advisory Commission
Lancaster County Pughsville Civic League
Environmental Council Of Alexandria
Chesapeake Environmental Improvement Council
Norfolk Office of Resiliency Clean City Commissions
Public Works Northumberland Association Of Progressive Stewardship,
Fairfax County Office Of Environmental And Energy Coordination
Allison Homer [email protected]
City of Hampton Clean City Commission
C'Faison Harris, 757-727-1130, 1296 Thomas Street, Hampton 23669, hampton.gov/hccc
Downtown Hampton King George Service Authority
Water Board RVAgreen2050, Virginia Commonwealth University
Planning And Zoning 3 LWVSHR
Boards Of Supervisors 2 Protect Hanover
Back Bay Federal & with NE Coastal NC/Currituck County/Knotts Island
Departments of Human Services
Local Mathews County government officials
King George Community Development
Mathews Land Conservatory Virginia Beach City Council
Gloucester county supervisors Norfolk City Government
City of Petersburg York County Board of Supervisors
Town Councils; -Kilmarnock -White Stone -Irvington
Lancaster County; -Board of Supervisors -Planning Commission -Wetlands Board
County Board Of Supervisors 3 GFACA Board Of Directors
City of Virginia Beach Public Works Department
2 The Environmental Quality Advisory Council, Fairfax County
School Division - Brock Center Environmental Studies Program
The Town of Chincoteague. Mayor and Town Council
6150 Community Drive Chincoteague Island, VA 23336
New Kent County Virginia Chesapeake Conservation
DHCD TCC
University/Academic Businesses
VWU Dominion Electric

Page | 16
Group/Organization Contact Information Frequency Group/Organization Contact Information Frequency University of Mary Washington Atlantic Coast Pipeline
George Mason University Mountain Valley Pipeline
NSU Silver Beach Va. LLC
Chesapeake Bay National Estuarine Research Reserve
2 Omega Protein (Largest Employer In The County)
ODU Hanover magazine
VIMS Labs at VIMS - https://www.vims.edu/ccrm/
6 VAmercantile.Com [email protected], Owner: Robin Moser
Norfolk State Building Resilient Solutions www.brs.llc
Oyster/Seafood House Owners
NGOs and Community Associations/Organizations
NGOs and Community Associations/Organizations
Audubon The Willoughby Civic League
Conservation International Chesapeake Citizens Coalition Facebook
Nature Conservancy 2 NRHA
ERP Del Ray Citizens Association https://delraycitizens.org/
EDF 2 The Spirit Of Newport News Facebook
HRSD Back Bay Wildlife Society
Chesapeake Bay Foundation 26 Arbor Day Foundation
RISE Newport News Green Foundation
Hanover NAACP 2 Friends Of The Rappahannock 9
Nansemond River Preservation Alliance
Friends of the Lower Appomattox River
NAACP Energy and Climate Leader Friends Of Indian River [email protected] 2
Norfolk Master Gardener Association
VBCCO Virginia Beach Civic League Coalition
Virginia Master Naturalists - Central Rappahannock Chapter
https://www.facebook.com/groups/177327920476 - or http://masternaturalistcrc.blogspot.com/; Harry Puffenberger
Ghent Neighborhood League Jeremy MvGee, President. https://www.ghentneighborhoodleague.org/
Virginia League Of Conservation Voters.
https://valcv.org/ Carl Smith - [email protected]
Norfolk Botanical Gardens, Azalea Garden Road, Norfolk, VA 23518.
Pungo Homeowners Brigadoon Civic League.
CNI Citizens Advisory Committee NMG agent Chris Eppes
Grass Roots Community Group At Silver Beach (Exmore, VA)
Elizabeth River Project https://elizabethriver.org [email protected]
24
Union Mission Elizabeth River Trail Foundation
Salvation Army VCE Extension Agent

Page | 17
Group/Organization Contact Information Frequency Group/Organization Contact Information Frequency The Mariners Museum in Newport News
Sandbridge Home Owners Association
3
Portsmouth Civic Leagues Hilton Village
Sharon Baptist Association UU Church in Newport News
Suffolk Interdenominational Ministers Alliance
Buckroe Improvement League
Conserve York County Foundation. Ron Struble - https://conserveyorkcounty.org/
Phoebus Community Enhancement Committee
Joe Griffith, Phoebus Neighborhood Commissioner www.phoebuslife.org [email protected]
2
Norfolk Master Gardeners nmgv.org Save our Live Oaks
Wetland Watch Skip Stiles, Executive Director https://wetlandswatch.org/ 2601 Granby Street Norfolk, VA 23517 757.621.1185
5 Virginia Beach Clean Community Commission:
Walter wtclegal- [email protected] Camp or Kristy Rines (VB waste management) or possibly [email protected]
Stop Flooding Now
http://www.stopthefloodingnow.com/ [email protected]
5 Lafayette Wetlands Partnership
LRNow Lafayette River Now
Coastal Virginia Unitarian Universalist
c-vuu,org - Bob Williams Northampton Civic League
https://www.facebook.com/Northampton-Civic-League- 305899192241
Ducks Unlimited
Lynnhaven River Now Karen Forget, [email protected] www.lrnow.org or Jim Deppe ([email protected])
21
Delta Waterfowl Lynnhaven Citizens Association in Alexandria
Surfrider Foundation https://www.surfrider.org/ 2 NSWC Dahlgren on the Potomac
Norfolk Council Of Civic Leagues James River Association thejamesriver.org
Virginia Beach Vision Virginia Beach Tea Party
West Park View Community League Kiwanis Club Of Poquoson
Croatan Civic Association (mike Kelly)
Larchmont-Edgewater Civic League
http://larchmontedgewater.org 3
Lynnhaven Colony Civic League Dave Kromkowski - [email protected]
Churchland Civic League https://www.facebook.com/23703.Churchland/
Tidewater Master Naturalists Princess Anne Hills President @pahills.org
Virginia Master Naturalists 2 Churchland Civic League [email protected]
ESVMG Master Gardeners Master Naturalists Museum of Chincoteague Island
Pughsville Civic League
Wayne White (President): [email protected] and

Page | 18
Group/Organization Contact Information Frequency Group/Organization Contact Information Frequency Pamela Brandy (Vice-President): [email protected]
Virginia Beach Vision Martha McClees (Exec Dir) Grandview Islanders LLC. Mr. Richard Boncal, [email protected]
Civic Leadership Institute Amasa Smith Grandview Beach Partners
Virginia Organizing, Windsor Woods
The Siesta Club Broad Bay Colony civic league
The New Majority Bay Island Colony civic league
Keep Virginia Beach Above water Alexandria City Civic Associations
Fairfax County Federation Of Citizens Associations
Flint Webb, PE, Environment Committee Co-chair ([email protected])
Williamsburg JCC Indivisible Heather Meaney-Allen, [email protected]
2
GFCACA Member Association. Vice president - [email protected]
Shore Drive Community Coalition [email protected]
CE&H Heritage Civic League
[email protected] Falls of the James Sierra Club group - Falls of the James Group Advocacy Committee
Lee Williams at James River Association- Main telephone: (804) 788-8811 [email protected]
Greater Chuckatuck Civic League
President: Roosevelt Jones [email protected]
https://www.smartersafer.org/aboutus/coalition/
VOICE Bellamy Woods Civic League
Mothers Out Front 4 Master Gardeners
Sierra Club https://www.sierraclub.org/virginia/york-river
12 Virginia Environmental Justice Collaborative
SAVE Coalition
stophip.org Guinea Heritage Association https://www.facebook.com/GuineaHeritage
League of Women Voters of South Hampton Roads
2 Sandbridge Civic League 3
CCAN - Chesapeake Climate Action Network
4 Master Naturalists http://www.virginiamasternaturalist.org - Michelle Prysby
5
Hoffler Creek Wildlife Preserve
Ashley Morgan, Executive Director [email protected]
tHRive - Young Professional Organization
Trail Club Island Community House Cindy Faith [email protected]
Sunrise Movement Beta Clubs
Brandermill Community Association [email protected] Redville Fisherman's Museum
Native Plant Society FOLAR 2
Ocean Park Civic League Brown Grove community
Coalition for Hanover's Future hanoversfuture.org Virginia Green New Deal
Cameron Foundation Virginia Waterfowlers Association

Page | 19
Group/Organization Contact Information Frequency Group/Organization Contact Information Frequency Buckroe Improvement League https://coastalcare.org/
Greater First Baptist Church - Orlando
Located in Suffolk JRA
NAPS
General Individuals
Local Civic Leagues 9 [email protected]
Local Eco-Clubs Or Organizations [email protected]
Local League Of Women Voters Dustin Cox [email protected]
Local Commercial Fishermen Groups
Tyla Matteson, Chair York River Group
[email protected] (H) 804-275-6476
Local Gardening Clubs Angela Buckner [email protected]
Wildlife and Bird Enthusiasts Wayne White [email protected]
Development Groups that Just Want to Build Everywhere
Garry Harris - Center for Sustainable Communities
404-936-0620 Garry Harris - CSC HR
Local Churches 12 Markiella Moore [email protected]
Local Libraries Guss K. [email protected]
Local Schools/Universities 13 Paul Fransisco Email: [email protected]
Local Radio/News Papers https://drainalx.wixsite.com/website Twitter - @DrainALX
Farmers (Small & Large) 2 Mayor Denise Drewer
Local Public Housing Residents Associations
Valerie Butler, Town Council Member
757-651-7521 2
HOAs 7 Dr. Hans-Peter Plag The Mitigation And Adaptation Research Institute (MARI)
Scout packs and troops 2 Markiella A. Moore - Council appointed Stormwater Committee Member
[email protected] and Council appointed NEMAC member
Masons and Shriners 2 Greta Thunberg Or Leo
Kayak clubs
Running Clubs
Aquia Supervisors
Recreational Boaters
Extension Agencies
Nextdoor 3
Soil and water districts 2
Tourism Groups
Legal Aid Organizations
Insurance Agencies

Page | 20
4.5 Future Outreach Preferences In order to tailor future outreach efforts, and to target those avenues or platforms residents most wish to use, respondents were asked how they would like the Commonwealth to communicate with them or to reach out to their communities regarding this project or on similar projects in the future. Forty-five (45%) of respondents indicated they preferred email for receiving information. Thirteen (13%) preferred social media, while eleven (11%) percent chose a newsletter format. Additionally, respondents were provided an “other” option, to include their own suggestions. Nineteen of the 33 comments left indicated either “all of the above” or a combination of three or more outlets. Additional suggestions are included in the table below.
Website information. Any "newsletter" information can be posted to an actual website.
Through local town councils and churches ....schools... etc. really grassroots information.
Newspaper articles and local TV coverage. The Newspaper: The Virginian-Pilot, The Daily Press, etc.
Inexpensive virtual messages that lead to structured in-person workgroups with community input.
Email is OK, but avoid social media; it has effectively trained most users to believe what they see on social media if they agree with it, and to otherwise ignore it.
Virtual meetings, not in person meetings. Post bulletins at local post offices and libraries. They are the social centers of our rural community.
Webinars through Virginia APA.
4.6 Closing Remarks Respondents were provided a final opportunity to provide open, candid comments on the CRMP project, the survey, flooding issues, outreach, or other related topics before closing the survey. Over 360 individual responses were received. While the majority of feedback was positive, some respondents were critical of the Commonwealth, Local governments, the Plan, and mitigation or Resilience efforts. These closing comments reflected very similar themes throughout, with a selection of responses captured in the table below. The full responses are included in the Appendix.
Supportive/Positive Comments Critical/Negative Comments Thank you for organizing this survey! I hope it helps people to think about our plight and I hope the answers help YOU.
It seems counterintuitive to cut significantly treed land to build stormwater retention ponds. Why not install retention system under streets?
Thank you for allowing me to participate in this excellent, inclusive survey.
This is all about destruction of the environment, which we need to restore. We can't floodwall our way out of this.
Consider environmental justice and equity in the resiliency planning
I feel the DOD does not contribute as it should for base access roads such as Hampton Blvd.
Find the resources, implement the legislation, and put solutions in place as soon as possible
Stop "planning" and implement what we know mitigates flooding.

Page | 21
Supportive/Positive Comments Critical/Negative Comments Thanks for doing this — sometimes it seems like no one else notices or cares that climate change is here.
Stop wasting tax money on trying to convince Virginians to support this foolish scheme.
Thank you for your efforts. Please continue this valuable job that you are doing!
Over development is part of the problem, maybe the cities should look at development issues like drainage issues! … loss of tree cover, etc.
This should be the area’s #1 priority. A comprehensive plan and the large scale projects that must be completed
Stop trying to save the homes in coastal areas. It's a waste of time and money. Buy them out and let mother nature take them back.
Your efforts to minimize flooding impacts will be critical to residents of the Eastern Shore.
It's probably too late, the best solution is probably to move people out of these areas as quickly as possible. Give Hampton Roads back to the sea.
Think about the residents first, then non-tourist business. Driving more tourists to the beach should be the last concern of this project.
Please stop building. There is more than enough real estate already in place to support community needs. If only it was actually utilized in an efficient, supportive way.
It is critical that this initiative be extended to all junior and senior high schools, as well as community colleges, to be offered for students as an option for career choices.
This plan/study is being rushed for political motivations resulting in lack of meaningful input and limited data analysis.
We are encouraged with the establishment of this project and look forward to working together to improve our communities and shorelines.
Continuing development in flood prone areas has placed Virginia residents in danger, and has created vast liabilities for all taxpayers, property owners, and residents.
If there is a way to bring this critical issue into local classrooms, I hope that can be done -- whether by speakers, field trips, or other means!
We cannot adapt our way out of climate change driven flooding. We must stop emitting greenhouse gasses if we hope to hold sea level at a manageable height.
The state should ban development in flood zones, including accounting for future sea level rise of up to 6 feet this century.
Our city may be lost, even though we are a tourist destination. That said, the city cares more about tourists than the tax paying citizens.
Storm Drain labeling with visible letting will help too. Key West has 2-inch letters on their drains that says No Waste; Drains to Ocean with a fish stenciled. Billboards and TV commercials should help too.
The land is sinking and the ocean is rising. If you are concern, you should move because no matter how much money is spent on flooding, it is just going to get worst.
I'd like to hear discussion of strategies to manage retreat while still protecting vulnerable communities and cultural identity from some areas where significant investments to protect limited resources and people would be required.
Encourage transparency by local governments. They can't deny or hide the problems, especially when a tropical storm exposes weaknesses in infrastructure, poor management, and planning.
Providing for public input virtually, and notifying public of such options on a broad scale (e.g., by TV news channels and radio minimally) in good time to allow for community input.
Honestly, I have very little faith that any improvements will be made. I do however have faith he will charge us more taxes for whatever this failure of a plan will be. I've lived here too long not to be jaded.
I do not live near the coast or a river but I strongly support land use planning to recover significant healthy ecosystems, not development or agriculture, to restore abundant air/water/plants/wildlife and less people.
Move or build a dike and become an island......The oceans once extended well-inland and will again. To think that man can tamper with, or avert these cycles is the ultimate in human hubris and small thinking.
Understanding that time/data was limited this round, rainfall, stormwater, inland flooding should be included in the next plan with additional resident/municipal engagement!
After the tunnel expansion debacle and Portsmouth Terminals tax-avoidance strategies, I have zero confidence in central or local government to do anything more than feather the nests of its old and new friends.
Please promote more public awareness and education especially to those who cannot afford to learn about these waterway litter items at the Aquarium. Please put out Billboards and PSA’s - please let people know that litter clogs storm drains and causes flooding. And that trees absorb water.
Each and every effort needs to revolve around the same idea that we are a coastal city. Flooding, environmental concerns, neighborhood improvement, job creation, education — everything ties back to our identity and that needs to become a laser-sharp focus of city officials.
I wish that the newest information and processes for conservation and flood mitigation in wetlands would be broadcast widely so that these will trickle down into my
I live in a "high rent" district and don't mind higher taxes and higher rent in expensive neighborhoods but don't want to distribute greater improvements to expensive neighborhoods than to low-income neighborhoods. Don't

Page | 22
Supportive/Positive Comments Critical/Negative Comments local community. Not cutting down trees, leaving room near tidal streams and finding a way to better encourage land conservation are all needed in my vulnerable community.
know how that's managed but I always see more public funds going into the wealthiest neighborhoods instead of those which need them most.
Make dredging and cleaning out waterways a priority on a more frequent basis. Areas near us still have drainage problems created by storm debris (downed trees, etc.) not being removed from previous hurricanes and bad storm events that impact our drainage ways. The debris and lack of maintenance of ditches causes flooding with even the smaller rain events now which is concerning.
I would say… listen to the Navy in Norfolk.. they have been ahead of this and acting for years....but they need to publicize their efforts more.. They will leave this area if the problem gets too big to control....that in itself would be a disaster ...and people should realize that... and follow their lead.
We are a coastal community and residents are taking it upon themselves to create positive impact for the community's flood resiliency. We find value in working together and accomplishing what we can without outside help, but sometimes it isn't feasible to do it all ourselves, so please reach out if you'd like to coordinate.
Planning is the operative word. If land is too low and subject to flooding, it should not be approved for building. If, like Norfolk, the flooding has increased due to global warming, help should be given but with an emphasis on relocation. You can't fight Mother Nature.
Many people do not believe in it or say that it is government over-reach. I have seen its effects. It is real and if one thing is certain it will rain and it will storm. Increased strength, duration, and frequency of such events, in combination with sea level rise, land subsidence, groundwater depletion and aging existing infrastructure (roads, bridges, dams, storm drain systems, etc.) is a nasty combination that we will have to pay the price for - one way or another.
Engineers and scientists know many ways that climate change could go, but cannot know when they will occur. There are so many possible ways the future of this problem could go that there is a very great risk of spending money to mitigate something that turns out to not be part of the future, or that discourages people from getting out of high-risk areas. The rapidly increasing tendency in the past 40 years of replacing knowledge, education and thinking with pseudo-science, faith and denial is likely to lead to some painful lessons from nature.
Honestly, if you don't understand the benefits, I have neither the time nor the crayons to explain them to you.
The survey will remain open to capture further feedback from residents and business-owners through October 15, 2021. The survey can be found at https://www.surveymonkey.com/r/VACRMP-Public.
“ We are encouraged with the establishment of this project and look forward to working together to improve our communities and
shorelines.”